Embed Size (px)
Citation preview

1
Supplementary Figure 1 | Graphene growth from SiO2 nanoparticles for 10 min using
CH4 only. (a-b) a, XRD spectra and b, TGA profiles for the samples processed at 900 oC and
1050 oC. (c-f) TEM images of the samples processed at (c-d) 900
oC (scale bars, 20 nm and 5
nm, respectively) and (e-f) 1050 oC (scale bars, 20 nm and 5 nm, respectively).
10 20 30 40 50 60
CH4 1050
oC
CH4 900
oC
Graphite
(101)
Graphite
(002)
Inte
ns
ity
(a
rb.u
nit
s.)
2 theta (degree)
SiO2
a b
c
e
d
f
200 300 400 500 600 700 8000
20
40
60
80
100
CH4 1050
oC
CH4 950
oC
Temperature (oC)
TG
-Weig
ht
loss (
%)

2
10 20 30 40 50 60
Conv. CVD SiO2
Graphite(101)
Graphite(002)
In
tens
ity (a
rb.u
nits
.)
2 theta (degree)
SiO2
a b
c d
200 300 400 500 600 700 80070
80
90
100
110
Conv. CVD SiO2
Temperature (oC)
TG-W
eigh
t los
s (%
)
Supplementary Figure 2 | Graphene growth from SiO2 nanoparticles by a conventional CVD process (H2 + CH4, 1000 oC) for 10 min. a, XRD spectra. b, TGA profiles. c, SEM image (scale bar, 20 nm). d, TEM image (scale bar, 5 nm). The series of analyses indicate negligible graphene growth.

3
a b c
f
g
0 min 5 min 30 min 60 min 240 min
a b c
500 nm 500 nm 500 nm
50 nm
f
g
0 min 5 min 30 min 60 min 240 min
500 nm 500 nm
d e
Supplementary Figure 3 | Morphology and color of GB at different CVD growth time. (a-e) SEM images of GB after a, 0 min, b, 5 min, c, 30 min, d, 60 min, and e, 240 min (scale bars, 500 nm). f, Higher magnification SEM image of c (scale bar, 50 nm). g, Photographs of GB powder at different CVD growth time.

4
10 20 30 40 500
5
10
15
20
25
av. = 28.2 nm
av. = 17.9 nm
Rel
ativ
e fr
eque
ncy
(%)
Number of SiOx particles
0 min 5 min 30 min
av. = 15.3 nm
a b c
d
Supplementary Figure 4 | Graphene growth from SiO2 nanoparticles. (a-c) TEM images after different growth time. a, 0 min, b, 5 min, and c, 30 min min (scale bars, 50 nm). d, Size change of SiO2 particles during the course of the CVD process.

5
200 400 600 8000
20
40
60
80
100
CH4 240min CH4 60min CH4 30min CH4 5min SiO2
Temperature (oC)TG
-Wei
ght l
oss
(%)
1500 2000 2500 3000 3500
CH4 240min CH4 60min CH4 30min CH4 5min
Inte
nsity
(arb
.uni
ts.)
Raman shift (cm−1)
a b
Supplementary Figure 5 | Characterization of GB during the course of graphene growth. a, Raman spectra. b, TGA profiles.

6
a b
C Sic d
Supplementary Figure 6 | Morphology characterization before and after surface coating. (a-b) SEM images (scale bars, 2 µm) a, before and b, after GB coating. c, SEM image (scale bar, 1 µm) after the coating with a physical mixture of 0.5 wt% SiO2 particles and 0.5 wt% graphene. d, EDX mapping of the sample shown in c with respect to carbon and silicon (scale bars, 2 µm).

7
0 40 80 120 160 200
2.62.83.03.23.43.63.84.04.24.4
Pristine NCM 0.1C Pristine NCM 1C GB-NCM 0.1C GB-NCM 1C
Volta
ge (V
)
Capacity (mAh g−1)0 40 80 120 160 200
2.62.83.03.23.43.63.84.04.24.4
Pristine NCM 0.1C Pristine NCM 1C GB-NCM 0.1C GB-NCM 1C
Volta
ge (V
)
Capacity (mAh/g)0 5 10 15 20 25 30 35 40 45
-1-2-3-4-5-6-7-8-9
-10 Pristine NCM GB-NCM
Z'' (
Ohm
)
Z' (Ohm)0 2 4 6 8 10 12 14 16 18
0-1-2-3-4-5-6-7-8-9
-10 Pristine NCM GB-NCM
Z'' (
Ohm
)
Z' (Ohm)
1st cycle 50th cycle
ba ca
Supplementary Figure 7 | The electrochemical properties of both NCM electrodes at 25 oC. a, 1st charge-discharge profiles at 0.1C and 1C. (b-c) Electrochemical impedance spectroscopy (EIS) plots after b, 1st cycle and c, 50th cycle.

8
a b
Supplementary Figure 8 | SEM images after 100 cycles. Battery measurement condition: half-cell, 60 oC, top cut-off =4.3V. a, pristine NCM (scale bar, 2 µm). b, GB-NCM (scale bar, 2 µm).

9
0 500 1,000 1,5000.0
1.0
2.0
3.0 1st Lithiation 1st Delithiation
Volta
ge v
s. L
i+ /Li (
V)
Specific Capacity (mAh g−1)
Supplementary Figure 9 | The 1st charge-discharge profiles of the GB anode at 0.1C and 25 oC. Areal capacity=2.7 mAh cm−2.

10
0 50 100 150 2002.0
2.5
3.0
3.5
4.0
4.5
Vo
ltage
(V)
Capacity (mAh gNCM−1)
GB-NCM//GB 25 oC GB-NCM//GB 60 oC
a
0 50 100 150 2002.0
2.5
3.0
3.5
4.0
4.5
GB-NCM//GB 25 oC GB-NCM//GB 60 oC
Volta
ge (V
)
Capacity (mAh gNCM−1)
b
Supplementary Figure 10 | Charge-discharge profiles of the GB-NCM//GB full-cell. a, The first cycle at 0.1C. b, The second cycle at 25 oC and 60 oC when measured at 5C.

11
c0 30 60 90 120 150 180
2.83.03.23.43.63.84.04.2
Pristine NCM 1st cycle Pristine NCM 100th cycle Pristine NCM 500th cycle GB-NCM 1st cycle GB-NCM 100th cycle GB-NCM 500th cycle
Vol
tage
(V)
Capacity (mAh g−1)0 30 60 90 120 150
2.83.03.23.43.63.84.04.2
Pristine NCM 1st cycle Pristine NCM 100th cycle Pristine NCM 500th cycle GB-NCM 1st cycle GB-NCM 100th cycle GB-NCM 500th cycle
Vol
tage
(V)
Capacity (mAh g−1)
60 oC25 oCba
0 50 100 150 200 250 300 350 400 450 5000
20406080
100120140160
GB-NCM//Graphite @60 oC, 5C
GB-NCM//Graphite @25 oC, 5C
Pristine NCM//Graphite @60 oC, 5C
Cap
acity
(mA
h g−
1 )
Cycle Number
Pristine NCM//Graphite @25 oC, 5C
Supplementary Figure 11| The cycling performance and fast charging capability of NCM//graphite full-cells. (a-b) Charge-discharge profiles at a, 25 oC and b, 60 oC when measured at 5C (1C=190 mAh gNCM
−1). c, Capacity retentions at 5C. The areal capacities of all the cells in this figure are 1 mAh cm−2. In each cycle, charging and discharging rates were the same for all the data shown in this figure. Note that once the areal capacity is increased to 2.4 mAh cm−2 as in Figure 5 in the main text, the graphite anode does not operate as well as GB, because the graphite anode cannot afford to accommodate Li ions at this high C-rate during charge.

12
d
ba c
Supplementary Figure 12 | Characterization of the cross-section of GB-NCM after 500 cycles in full-cell at 5C and 60 oC. a-b, Cross-sectional SEM images (scale bars, 2 µm and 200 nm, respectively). c, STEM image (scale bar, 200 nm). d, STEM image and its EDX elemental mapping with respect to Ni, Co, Mn, O, C, Pt, and F (scale bars, 200 nm).

13
d
ba c
0.5 μm
200 nm
Supplementary Figure 13 | Characterization of the cross-section of pristine NCM after 200 cycles in full-cell at 1C and 25 oC. a-b, Cross-sectional SEM images (scale bars, 2 µm and 200 nm, respectively). c, STEM image (scale bar, 200 nm). d, STEM image and its EDX elemental mapping with respect to Ni, Co, Mn, O, C, Pt, and F (scale bars, 200 nm). The given full-cell was cycled in a milder cycling condition in terms of temperature, C-rate, and cycle number, compared with the GB-NCM shown in Supplementary Fig. 11 because the capacity fading is too significant to reach the same number of cycles. The capacity fading is attributed to amplified transition metal dissolution that impairs the interfacial stability of the graphite anode.

14
Supplementary Tables
Supplementary Table 1 | Design parameters for an EV prismatic cell and specific capacities and energy densities using pristine NCM//graphite and GB-NCM//GB.
Parameter NCM//graphite GB-NCM//GB
EV Cell
Current density (mAh cm−2) 4.4 4.4
NP ratio 1.08a 1.0a
Packing ratio (%)
Energy Density (Wh L−1)
Total capacity ([email protected])
90.0
630
49.67
90.0
800
63.40
(∆27.6%↑)
Negative
electrode
Capacity (mAh g−1) 360 716
1st Efficiency (%) 95.0 99.0
Electrode density (g cc−1) 1.6 1.1
Content of active material (%) 97.5 95
Capacity (mAh g−1) 190 190
Positive
electrode
1st Efficiency (%) 93 93
Electrode density (g cc−1) 3.0 4.0
Content of active material (%) 92 97 aThe different NP ratios originate from different initial Coulombic efficiencies (ICEs) of electrode materials. In the NCM//graphite cell, the ICEs of the NCM and graphite are ~93% and ~95%, respectively. With these ICE values, NP ratio of around 1.1 is widely adopted to have an excessive capacity in the anode. In the GB-NCM//GB cell, pre-lithiated GB has a higher ICE of 99% so that NP ratio was decreased to 1.0.

15
Supplementary Table 2 | Material-based energy densities obtained from (Ccathode⋅ Canode ⋅Vnominal)/ (Ccathode + Canode)
Cell type Canode Ccathode Vnominal Energy density
[mAh g−1] [mAh cc−1] [mAh g−1] [mAh cc−1] V [Wh kg−1] [Wh L−1]
pristine
NCM//graphite 360 576 190 570 3.4 422.8 974.1
GB-NCM//GB 700 770 190 760 3.4 508.1
(∆20.2%↑)
1300.4
(∆33.5%↑)

16
Supplementary Table 3 | Summary of electrochemical properties of LiNi0.6Co0.1Mn0.3O2 (NCM) in half-cell measurements at 25 oC and 60 oC.
25 oC Capacity @ 0.1C
(mAh gNCM
−1) initial Coulombic
efficiency (%)
Average Coulombic efficiency for 2-100
cycles (%)
Capacity retention for 2-100 cycles
(% )
Cut off 4.3 V
Pristine NCM 189.5 93.15 99.92 97.8
GB-NCM 192.2 93.71 99.96 99.5 ∆1.7%↑
Cut off 4.4 V
Pristine NCM 198.5 92.06 99.78 95.0
GB-NCM 201.1 92.32 99.93 98.5 ∆3.5%↑
Cut off 4.5 V
Pristine NCM 210.3 91.95 99.63 92.1
GB-NCM 211.5 92.89 99.90 97.3 ∆5.2%↑
60 oC Capacity @ 0.1C
(mAh gNCM
−1) initial Coulombic
efficiency (%)
Average Coulombic efficiency for 2-50 cycles
(%)
Capacity retention for 2-50 cycles
(% )
Cut off 4.3 V
Pristine NCM 184.5 96.10 99.64 93.22
GB-NCM 191.4 96.62 99.68 97.10 ∆4.16↑
Cut off 4.4 V
Pristine NCM 198.9 91.92 99.58 92.70
GB-NCM 206.5 95.71 99.62 95.07 ∆2.56↑
Cut off 4.5 V
Pristine NCM 209.5 89.54 99.33 79.91
GB-NCM 215.1 91.96 99.46 90.99 ∆13.9↑
17
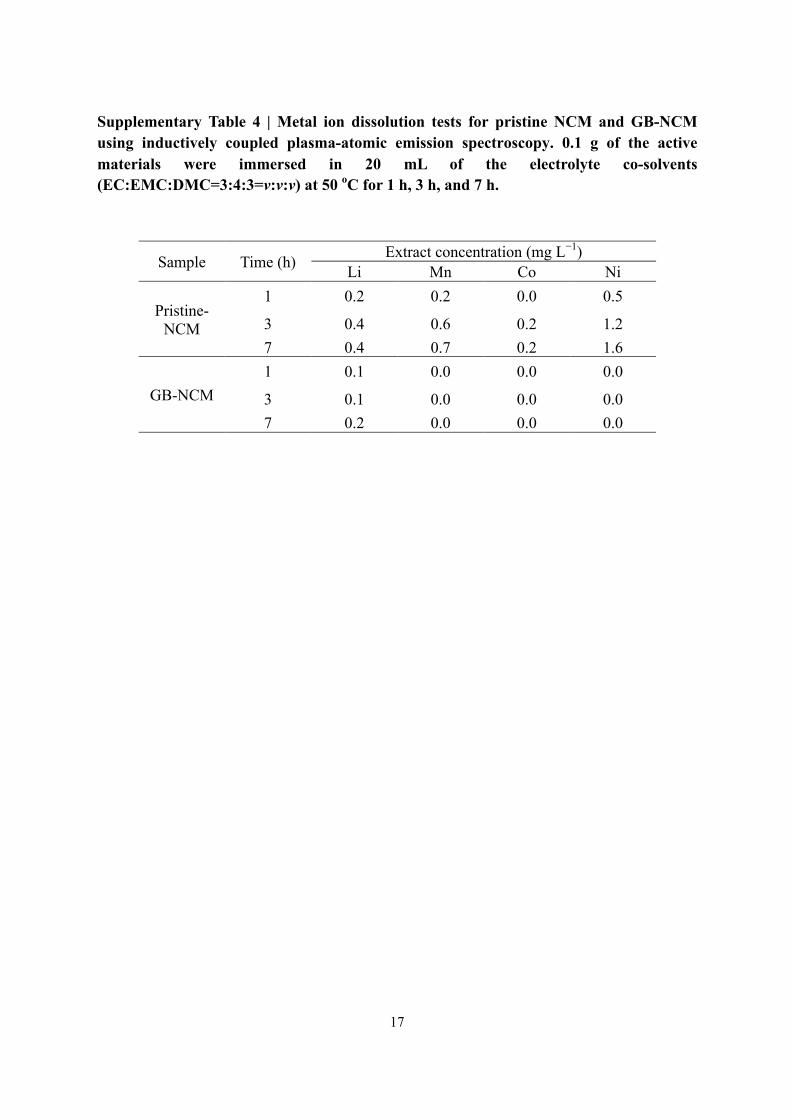
Supplementary Table 4 | Metal ion dissolution tests for pristine NCM and GB-NCM using inductively coupled plasma-atomic emission spectroscopy. 0.1 g of the active materials were immersed in 20 mL of the electrolyte co-solvents (EC:EMC:DMC=3:4:3=v:v:v) at 50 oC for 1 h, 3 h, and 7 h.
Sample Time (h) Extract concentration (mg L−1)
Li Mn Co Ni
Pristine-NCM
1 0.2 0.2 0.0 0.5
3 0.4 0.6 0.2 1.2
7 0.4 0.7 0.2 1.6
GB-NCM
1 0.1 0.0 0.0 0.0
3 0.1 0.0 0.0 0.0
7 0.2 0.0 0.0 0.0

18
Supplementary Table 5 | Summary of electrochemical properties of the GB anode in half-cell measurements at 25 oC and 60 oC.
Sample Capacity @ 0.1C
(mAh gGB−1)
initial Coulombic efficiency @0.1C
(%)
Average Coulombic efficiency for 2-500
cycles at 5C (%)
Capacity retention for 500 cycles at 5C (%)
25 oC 716.2 44.5 99.98 88.0
60 oC 718.4 41.5 99.97 86.1

19
Supplementary Table 6 | Summary of electrochemical properties in GB-NCM//GB full-cell measurements at 25 oC and 60 oC.
Sample Capacity @0.1C (mAh gNCM
−1)
initial Coulombic efficiency @0.1C
(%)
Average Coulombic efficiency for 2-500
cycles at 5C (%)
Capacity retention for 500 cycles at 5C (% )
25 oC 178.2 93.1 99.97 84.1
60 oC 185.0 94.0 99.95 78.6