Embed Size (px)
Citation preview

1248 IEEE TRANSACTIONS ON BIOMEDICAL ENGINEERING, VOL. 63, NO. 6, JUNE 2016
Application-Driven No-Reference QualityAssessment for Dermoscopy Images
With Multiple DistortionsFengying Xie∗, Yanan Lu, Alan C. Bovik, Fellow, IEEE, Zhiguo Jiang, and Rusong Meng
Abstract—Goal: Dermoscopy images often suffer from blurand uneven illumination distortions that occur during acquisi-tion, which can adversely influence consequent automatic imageanalysis results on potential lesion objects. The purpose of thispaper is to deploy an algorithm that can automatically assess thequality of dermoscopy images. Such an algorithm could be usedto direct image recapture or correction. Methods: We describe anapplication-driven no-reference image quality assessment (IQA)model for dermoscopy images affected by possibly multiple distor-tions. For this purpose, we created a multiple distortion dataset ofdermoscopy images impaired by varying degrees of blur and un-even illumination. The basis of this model is two single distortionIQA metrics that are sensitive to blur and uneven illumination,respectively. The outputs of these two metrics are combined to pre-dict the quality of multiply distorted dermoscopy images using afuzzy neural network. Unlike traditional IQA algorithms, whichuse human subjective score as ground truth, here ground truth isdriven by the application, and generated according to the degree ofinfluence of the distortions on lesion analysis. Results: The exper-imental results reveal that the proposed model delivers accurateand stable quality prediction results for dermoscopy images im-paired by multiple distortions. Conclusion: The proposed model iseffective for quality assessment of multiple distorted dermoscopyimages. Significance: An application-driven concept for IQA is in-troduced, and at the same time, a solution framework for the IQAof multiple distortions is proposed.
Index Terms—Application driven, dermoscopy image, imagequality assessment (IQA), multiple distortions, no reference (NR).
I. INTRODUCTION
D ERMOSCOPY is a noninvasive diagnostic techniquewhich is useful in diagnosis of many skin diseases [1].
In recent years, dermoscopy technology has been developing
Manuscript received April 3, 2015; revised August 17, 2015 and October 10,2015; accepted October 19, 2015. Date of publication October 26, 2015; dateof current version May 18, 2016. This work was supported by the NationalNatural Science Foundation of China under Grants 61471016, 61371134, and61271436. The work of A. C. Bovik was supported by the U.S. National ScienceFoundation under Grant IIS-1116656 Asterisk indicates corresponding author.
∗F. Xie is with the Beijing Key Laboratory of Digital Media and also with theImage Processing Center, Beihang University, Beijing 100083, China (e-mail:[email protected]).
Y. Lu and Z. Jiang are with the Beijing Key Laboratory of Digital Me-dia, and also with the Image Processing Center, Beihang University (e-mail:[email protected]; [email protected]).
A. C. Bovik is with the Laboratory for Image and Video Engineering (LIVE),University of Texas at Austin (e-mail: [email protected]).
R. Meng is with the General Hospital of the Air Force, People’s LiberationArmy (e-mail: [email protected]).
Color versions of one or more of the figures in this paper are available onlineat http://ieeexplore.ieee.org.
Digital Object Identifier 10.1109/TBME.2015.2493580
toward network platforms. In 2005, Iyatomi et al. built anInternet-based remote diagnosis system [2], which permits or-dinary people to upload dermoscopy image for analysis anddiagnosis of skin diseases. In 2010, a Handyscope [3] was de-veloped, by which dermoscopy images can be captured usinga mobile phone. This development has enabled more nonclin-ical physicians to capture and upload dermoscopy images intoremote diagnosis systems. Unfortunately, this process can eas-ily lead to poor image quality (arising from, for example, hair,blur, and uneven illumination), which can adversely influencesubsequent analysis. In [4] and [5], Rosado et al. pointed outthat the quality of dermoscopy images captured via mobile de-vice is problematic, and proposed a blur evaluation method forthese types of images. This suggests that accurate image qualityassessment (IQA) algorithms would be of great value towardsassuring that the images being used for diagnosis or analysisstage are of high quality.
Blur and uneven illumination are two common distortions ofdermoscopy images. It is a more complex problem to evaluatethe image quality when multiple distortions (more than one dis-tortion type) occur, since the distortions can interact and modifyeach other. However, recent work on dermoscopy image anal-ysis has mainly focused on hair detection and removal, lesionsegmentation, and classification [6]–[10]. IQA of dermoscopyimages has thus far received little attention.
Over the past decade, numerous no-reference (NR) IQAmodels have been proposed for different purposes. These canbe roughly divided into two groups: 1) models developedfor specific image distortion types and 2) general-purpose ornondistortion-specific (sometimes called agnostic) models. IQAmodels developed for a single specific distortion type such asblur [11], JPEG [12], JPEG2000 [13], or noise [14] generallyfail in the presence of other distortions. General-purpose IQAalgorithms [15]–[18] are effective for assessing many types ofsingle distortions. However, existing algorithms do not addresstwo problems. First, almost all IQA algorithms have been de-signed to predict human judgments of perceived quality. How-ever, in applications, high visual quality may not equate to highapplication value. For example, in medical image analysis, thequality of images should be expressed in terms of benefit inthe sense that image analysis tasks be more efficient on imageshaving high “task quality.” Second, most of the distorted imagesin publicly available IQA datasets such as TID [19], IVC [20],A57 [21], LIVE II [22], and CSIQ [23] suffer from a single dis-tortion type, although LIVE recently built a multiple distorted(MD) image quality dataset [24]. None of the images in these
0018-9294 © 2015 IEEE. Personal use is permitted, but republication/redistribution requires IEEE permission.See http://www.ieee.org/publications standards/publications/rights/index.html for more information.

XIE et al.: APPLICATION-DRIVEN NO-REFERENCE QUALITY ASSESSMENT FOR DERMOSCOPY IMAGES WITH MULTIPLE DISTORTIONS 1249
databases are directed toward any visual analysis or specificvisual tasks, save the IQA task. Experiments indicate that state-of-the-art IQA models performed more poorly on the LIVE MDdataset than on single distortion datasets. The MD images area challenge for IQA, since both the individual and joint ef-fects of these distortions on the image as well as the effects ofthese distortions on each other must be considered [25]. In [26],Gu et al. proposed a five-step metric for assessing the quality oftwo types of MD images (blur followed by noise and blur fol-lowed by JPEG). Their experiments showed good performanceon the LIVE MD dataset.
Here, we develop an application-driven NR IQA algorithmfor assessing the task-related quality of dermoscopy images suf-fering from multiple distortions (blur and uneven illumination).The algorithm is called assessment of dermoscopy images withmultiple distortions, or ADMD for short. Unlike traditional IQAalgorithms driven by human vision models, in the proposed al-gorithm, ground truth is defined in terms of the influence ofdistortions on the efficacy of lesion analysis algorithms appliedon dermoscopy images. An assessment model learned by a fuzzyneural network is used to predict the overall quality of MD der-moscopy images. The rest of this paper is organized as follows:Section II describes the new dataset. Section III presents theproposed IQA model and algorithm in detail. Experiments andanalysis are presented in Section IV, and Section V concludesthe paper.
II. DISTORTED DERMOSCOPY IMAGE DATABASE
A. Data Generation
Following the method of distorted image generation used byother public IQA datasets [19]–[24], the distorted images werecreated from reference dermoscopy images by applying blurfollowed by uneven illumination to them. Dermoscopy imagesusually suffer from vignetting, with black borders at the im-age boundaries [27], [28]. Since reference dermoscopy imagesshould be undistorted, the vignetting and black border regionsin them were removed. Fig. 1 depicts a number of MD images.The image at leftmost in the first row is the reference image.By filtering the reference image using an approximately cir-cular averaging filter of varying radii, four blur images weregenerated, as shown in the first row. Then, by adding differentuneven illumination masks (shown in Fig. 2) to each of theseblur images, the next four rows of images with uneven illumi-nation were generated, shown in the second to the fifth rows.Therefore, there are five levels of each distortion. The distortionseverity increases from level 1 to level 4, whereas level 0 has nointroduced distortion of that type. In the overall dataset, thereare 18 representative reference images, each associated with24 corresponding distorted images. Therefore, 450 images wereobtained, including the references. There are 25 different distor-tion level/distortion combinations, each containing 18 images.
B. Image Quality Ground Truth
In the traditional IQA research, ground truth of true percep-tual quality of distorted images is obtained via subjective ex-periments. However, in automatic dermoscopy image analysis,
Fig. 1. Examples of MD dermoscopy images.
Fig. 2. Simulated uneven illumination masks. (a) Level 1. (b) Level 2. (c)Level 3. (d) Level 4.
the image quality can significantly affect the accuracy of thesubsequent analysis in two regards: segmentation and classi-fication. Therefore, instead of regarding human judgments asground truth, we have created a ground-truth database that ex-presses image quality as a function of the degree of influenceon both segmentation and classification.
1) Index of Influence on Segmentation: Segmentation resultsoften change with increases of distortion level. Otsu’s threshold-ing method [29] is simple and quick for calculation. Therefore,we used the Otsu’s thresholding method to segment all of theimages in the dataset. The difference in the segmentation resultson the distorted image and its corresponding reference image isdetermined using the “XOR metric” [30]. A small XOR met-ric value indicates that the segmentation result of the distortedimage is close to that of its reference image, which ostensiblymeans that the distortion is slight, whereas a large XOR metricvalue likely indicates a serious distortion.
Assume that the distorted images can be indexed by groups,where the images in each group have suffered the same degreeof both blur and uneven illumination distortions. Then, for theith group, the degree of influence of the composite of distortioncombinations and distortion levels on segmentation is definedas the average value of the XOR metric values between thesegmented versions of those images and those of the aligned

1250 IEEE TRANSACTIONS ON BIOMEDICAL ENGINEERING, VOL. 63, NO. 6, JUNE 2016
Fig. 3. Flowchart of the proposed algorithm ADMD.
reference images. The XOR metric used here is
gXORi =1Ni
Ni∑
j=1
XORij, i = 1, 2, . . . 25 (1)
where XORij is the XOR value between the segmentation ofthe jth image in the ith group and that of its aligned reference,and Ni is the number of images in the ith group. Here, of course,we are summing XOR values as if they were algebraic, which isa simple way of expressing and normalizing a counting process.Here, Ni = 18.
2) Index of Influence on Classification: Image distortionsmay change the results of classification algorithms on lesions.If the lesion classification in the distorted image is different fromthat of its aligned reference image, then the distortion influencesclassification. Here, we use a classification method based on aneural network [31] to automatically classify all of the images.On the ith group, if ni is the number of images having a differentclassification result with their aligned reference images, thenthe degree of influence of the corresponding distortion on lesionclassification is defined as
ri =ni
Ni, i = 1, 2, . . . 25 (2)
where Ni is the same as in (1). The value of ri falls between 0and 1. The larger the value of ri , the more serious the influenceon lesion classification.
3) Ground-Truth Image Quality: Finally, we linearly com-bine gXORi and ri to form the overall ground-truth qualityindex of the MD image
qi = L(α ∗ gXORi + (1 − α) ∗ ri), i = 1, 2, . . . 25
L(xi) =1
max(xi) − min(xi)(xi − min(xi)) (3)
where α is a weight parameter, set to 0.3 according to thedermatologist’s experience in this paper; and L(·) remapsqi, i = 1, 2 . . . 25 to fall in the range [0,1]. Generally, the smallerthe qivalue, the higher the task-affective image quality.
III. METHOD
Finding IQA models that can handle multiple distortions hasproven difficult and to date, there exists little research providinga detailed analysis of the problem or that can guide one to a sat-isfactory solution [25]. Here, we propose a quality assessmentframework that can handle images impaired by two coincidentdistortions: blur and uneven illumination. Features that are sen-sitive to these distortions are extracted and mapped to differentdistortion levels. Then, a fuzzy neural network is used to modelthe joint effect of blur and uneven illumination to enable predic-tion of the overall image quality. Fig. 3 illustrates a flowchart ofthe proposed method.
A. Blur Distortion Evaluation
Natural scene statistics (NSS) features are widely used inmany state-of-the-art IQA algorithms [17], [32], [33]. ManyNSS models are based on the empirical distributions of imagesdecomposed by a wavelet transform into multiple subbands.The statistics of low–high (LH) and high–low (HL) subbandsare similar [17], so they can be calculated together. Here, aninput image is decomposed into four scales, hence, eight waveletsubbands are obtained. For each subband, a simple magnitudefeature mk is calculated as
mk =1
Mk × Nk
Mk∑
i=1
Nk∑
j=1
log2 |Ck (i, j)|k = 1, 2, . . . 8 (4)
where Ck (i, j) is the kth subband coefficient at (i, j), and Mk
and Nk represent the width and length of the kth subband,respectively. Then, the wavelet feature vector can be written as
fm = [m1 ,m2 , · · ·m8 ]T . (5)
Fig. 4 shows the magnitude features of images having differ-ent applied blur levels. Clearly, increases of the blur distortionlevel yields sharp decreases in the magnitude feature, which ishighly indicative of the degree of blur distortion. Fig. 5 showsthe magnitude features of images exhibiting different unevenillumination levels. These values lie very close to each other,because the magnitude feature is hardly affected by uneven
XIE et al.: APPLICATION-DRIVEN NO-REFERENCE QUALITY ASSESSMENT FOR DERMOSCOPY IMAGES WITH MULTIPLE DISTORTIONS 1251
Fig. 4. Magnitude features of blur images, where red, green, blue, black, andmagenta lines represent blur levels 0 to 4, respectively, and each line is theaverage result of ten distorted images.
Fig. 5. Magnitude features of uneven illumination images, where differentcolor lines represent different uneven illumination levels, and each line is theaverage result of ten images. The curves heavily overlap each other.
illumination. This suggests that the magnitude feature may beused to correctly estimate the blur degree even when there isillumination distortion in the image.
The feature vector in (5) is mapped to blur distortion levelusing a support vector regressor (SVR). An SVR is able tohandle high-dimensional data [34], and has been proved to behighly effective for solving other IQA problems [33], [35], [36].For more details about an SVR, see [33]–[36].
B. Uneven Illumination Evaluation
As compared with blur, research reports on assessing thequality of images afflicted by uneven illumination are quiterare. In order to evaluate the level of this type of distortion, wedecompose the distorted image into an illumination componentand a reflectance component using a model from variationalRetinex theory, and extract the illumination component via basisfunction fitting. Then, the average gradient magnitude of theillumination component (AGIC) is used to evaluate the level ofuneven illumination distortion [37]. Fig. 6 is an instance of theextracted illumination component. AGIC can be calculated as
AGIC =1
M × N
M∑
i=1
N∑
j=1
g(i, j)
g(i, j) =max |h(i, j) − hk (i, j)|
h(i, j), k = 1, 2, . . . 8 (6)
where i ∈ {1, 2, · · ·M}, j ∈ {1, 2, · · ·N}, and h(i, j) andhk (i, j) represent the average gray value of patch (i, j) and
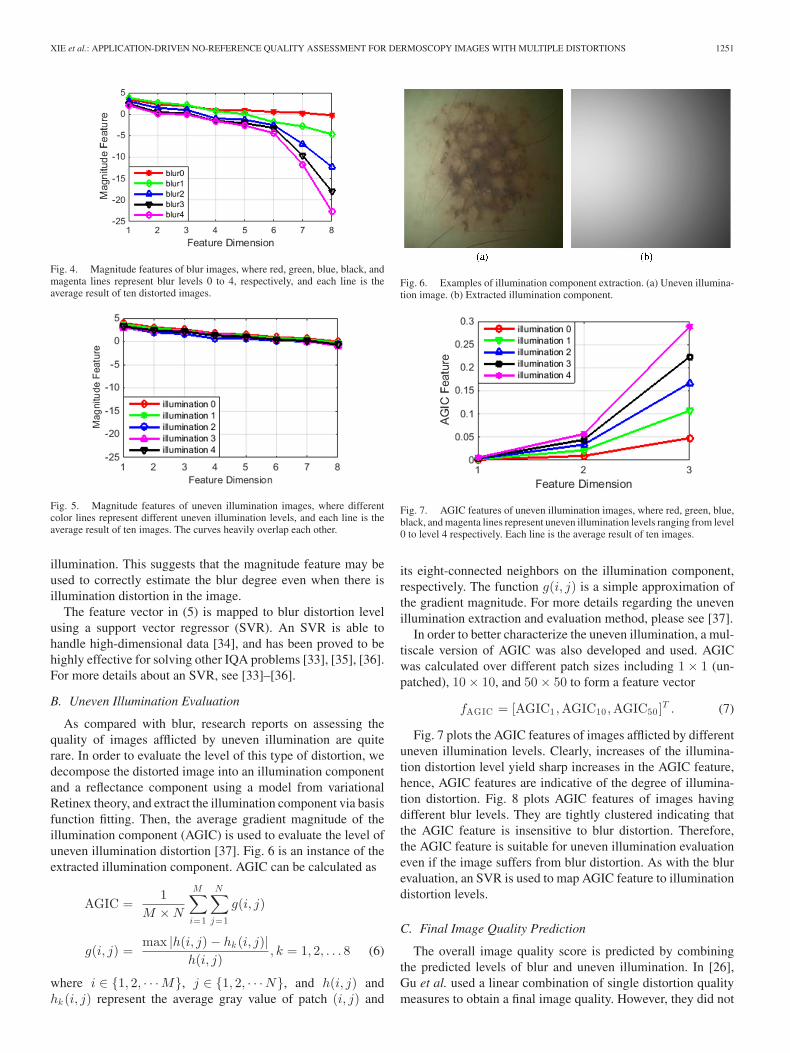
Fig. 6. Examples of illumination component extraction. (a) Uneven illumina-tion image. (b) Extracted illumination component.
Fig. 7. AGIC features of uneven illumination images, where red, green, blue,black, and magenta lines represent uneven illumination levels ranging from level0 to level 4 respectively. Each line is the average result of ten images.
its eight-connected neighbors on the illumination component,respectively. The function g(i, j) is a simple approximation ofthe gradient magnitude. For more details regarding the unevenillumination extraction and evaluation method, please see [37].
In order to better characterize the uneven illumination, a mul-tiscale version of AGIC was also developed and used. AGICwas calculated over different patch sizes including 1 × 1 (un-patched), 10 × 10, and 50 × 50 to form a feature vector
fAGIC = [AGIC1 ,AGIC10 ,AGIC50]T . (7)
Fig. 7 plots the AGIC features of images afflicted by differentuneven illumination levels. Clearly, increases of the illumina-tion distortion level yield sharp increases in the AGIC feature,hence, AGIC features are indicative of the degree of illumina-tion distortion. Fig. 8 plots AGIC features of images havingdifferent blur levels. They are tightly clustered indicating thatthe AGIC feature is insensitive to blur distortion. Therefore,the AGIC feature is suitable for uneven illumination evaluationeven if the image suffers from blur distortion. As with the blurevaluation, an SVR is used to map AGIC feature to illuminationdistortion levels.
C. Final Image Quality Prediction
The overall image quality score is predicted by combiningthe predicted levels of blur and uneven illumination. In [26],Gu et al. used a linear combination of single distortion qualitymeasures to obtain a final image quality. However, they did not

1252 IEEE TRANSACTIONS ON BIOMEDICAL ENGINEERING, VOL. 63, NO. 6, JUNE 2016
Fig. 8. AGIC features of blur images, where different color lines representdifferent blur levels. Each line is the average result of ten images. The curvesheavily overlap each other.
Fig. 9. Schematic diagram of the fuzzy neural network.
account for nonlinear relationships between the degree of thesingle distortions and the final image quality [24], [25]. Here,we deploy a fuzzy neural network to model the complex jointeffects of the two distortions on final quality score.
A fuzzy neural network [38] combines fuzzy logic with anartificial neural network to create an inference system. It is apowerful tool for handling uncertain, nonlinear, and other ill-posed problems. Fig. 9 shows the schematic diagram of thefuzzy neural network, which consists of five layers: input layer,fuzzy layer, rule layer, normalization layer, and output layer. Inthe proposed method, the two inputs descriptive of an image x1and x2 are the blur and uneven illumination levels, respectively.The output y represents the image quality score, which is theground truth in the training stage and the prediction in the teststage. Here, the number of nodes in the five layers is 2–10–25–25–1. In the training stage, the fuzzy neural network is trained onthe image’s single distortion levels and the quality ground truthto obtain a quality prediction model. In the test stage, blur anduneven illumination features are extracted from distorted imagesand mapped to distortion levels. Then, using the distortion levelsas inputs, the quality score y is delivered.
IV. EXPERIMENTS AND ANALYSIS
In order to quantitatively validate the performance of the pro-posed algorithm, experiments were conducted in regards to fouraspects using our dataset: 1) effectiveness of the single distor-tion metrics; 2) effectiveness of the overall quality assessment
Fig. 10. Blur prediction.
Fig. 11. Uneven illumination prediction.
model; 3) sensitivity of the model in relation to the training setsize; and 4) performance for real distorted dermoscopy images.The performances of competing IQA algorithms were comparedusing two evaluation criteria: the Pearson linear correlation co-efficient (LCC) and the Spearman rank-order correlation coeffi-cient (SROCC). The LCC between the actual quality scores andthe algorithm predicted scores provides an evaluation of pre-diction accuracy. The SROCC estimates the agreement betweenthe rank-ordered actual quality score and the rank-ordered algo-rithm predictions and is a test of prediction monotonicity. Thecloser the value of LCC and SROCC are to 1, the better theperformance of the algorithm is.
A. Effectiveness of the Single Distortion Metric
The accurateness of the single distortion assessment metricssubstantially determines the efficacy of the proposed method.Each image group in our dataset was randomly divided into twoparts, one for training and the other for testing. The images testedin this experiment included all distortion combinations. Figs. 10and 11 show the single distortion prediction results. For eachactual blur level in Fig. 10, the images include different degreesof uneven illumination ranging from level 0 to level 4, and theblur prediction results of different blur levels may be observed tobe well separated. Thus, the proposed blur metric can effectivelyevaluate blur degree when the image also suffers from uneven

XIE et al.: APPLICATION-DRIVEN NO-REFERENCE QUALITY ASSESSMENT FOR DERMOSCOPY IMAGES WITH MULTIPLE DISTORTIONS 1253
TABLE IAVERAGE LCC AND SROCC OF THE SINGLE DISTORTION METRICS
Blur Uneven Illumination
LCC 0.9643 0.9838SROCC 0.9534 0.9753
Fig. 12. Results of FSIM.
Fig. 13. Results of QAC.
illumination distortion. As with the blur metric, the proposeduneven illumination metric is insensitive to blur distortion, andcan effectively evaluate uneven illumination degree even in thepresence of blur distortion. Table I gives the average LCC andSROCC scores after repeating the training and testing process1000 times. It can be seen that the proposed blur and unevenillumination metric is in high agreement with the actual singledistortion level.
B. Effectiveness of the Overall Quality Assessment
The overall effectiveness of the proposed ADMD model wasevaluated on the database of MD dermoscopy images. A lin-ear combination of blur and uneven illumination measures wascompared with the ADMD method. Several other IQA algo-rithms, including the full reference method FSIM [39], and twonondistortion-specific NR methods NIQE [16] and QAC [18]were also used to compare with our method. Figs. 12–16 showthe quality prediction results of the five methods on our dataset,
Fig. 14. Results of NIQE.
Fig. 15. Results of linear combination.
Fig. 16. Results of ADMD.
while Table II shows the LCC and SROCC scores. Obviously,FSIM, QAC, and NIQE all fail. The FSIM metric is designedto simulate human judgments of image quality, while here theground truth of dermoscopy image quality is taken to be thedegree of influence of the distortion on lesion analysis. QACis based on FSIM, so they both fail. The failure of FSIM andQAC highlights the idea that the goals of application-driven IQAare different from those of the traditional IQA with regards toboth target and solution. NIQE is a method based on NSS fea-tures. While NSS features are used to evaluate blur distortion in
1254 IEEE TRANSACTIONS ON BIOMEDICAL ENGINEERING, VOL. 63, NO. 6, JUNE 2016
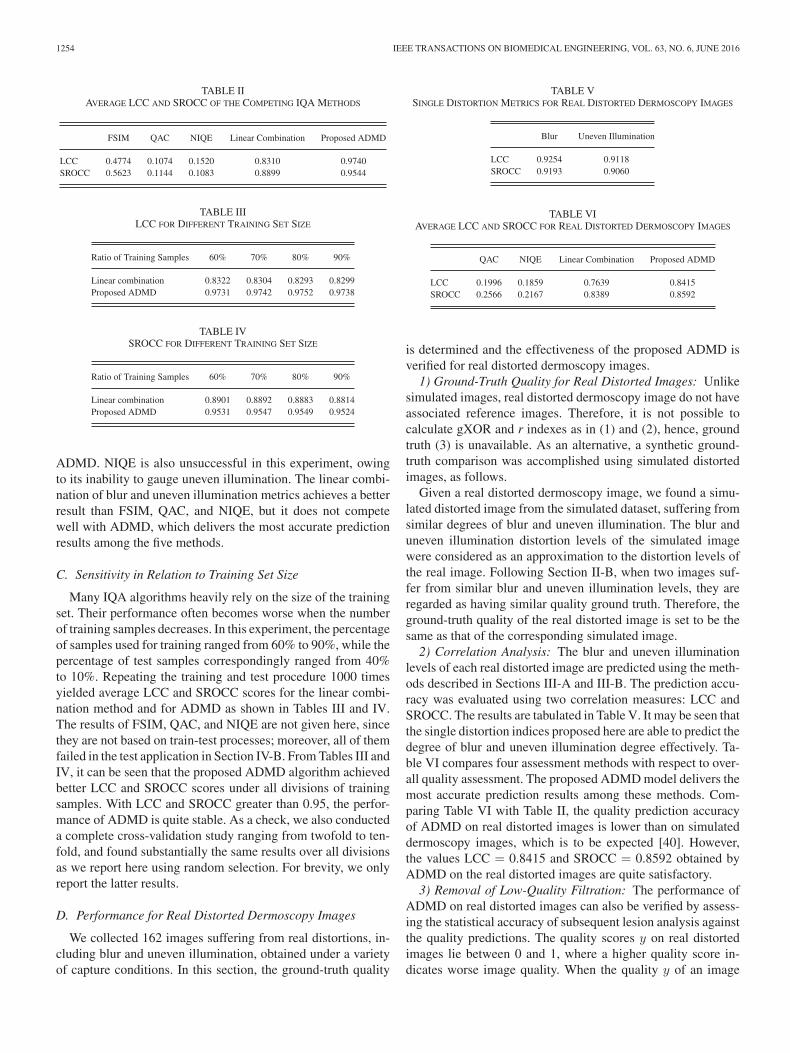
TABLE IIAVERAGE LCC AND SROCC OF THE COMPETING IQA METHODS
FSIM QAC NIQE Linear Combination Proposed ADMD
LCC 0.4774 0.1074 0.1520 0.8310 0.9740SROCC 0.5623 0.1144 0.1083 0.8899 0.9544
TABLE IIILCC FOR DIFFERENT TRAINING SET SIZE
Ratio of Training Samples 60% 70% 80% 90%
Linear combination 0.8322 0.8304 0.8293 0.8299Proposed ADMD 0.9731 0.9742 0.9752 0.9738
TABLE IVSROCC FOR DIFFERENT TRAINING SET SIZE
Ratio of Training Samples 60% 70% 80% 90%
Linear combination 0.8901 0.8892 0.8883 0.8814Proposed ADMD 0.9531 0.9547 0.9549 0.9524
ADMD. NIQE is also unsuccessful in this experiment, owingto its inability to gauge uneven illumination. The linear combi-nation of blur and uneven illumination metrics achieves a betterresult than FSIM, QAC, and NIQE, but it does not competewell with ADMD, which delivers the most accurate predictionresults among the five methods.
C. Sensitivity in Relation to Training Set Size
Many IQA algorithms heavily rely on the size of the trainingset. Their performance often becomes worse when the numberof training samples decreases. In this experiment, the percentageof samples used for training ranged from 60% to 90%, while thepercentage of test samples correspondingly ranged from 40%to 10%. Repeating the training and test procedure 1000 timesyielded average LCC and SROCC scores for the linear combi-nation method and for ADMD as shown in Tables III and IV.The results of FSIM, QAC, and NIQE are not given here, sincethey are not based on train-test processes; moreover, all of themfailed in the test application in Section IV-B. From Tables III andIV, it can be seen that the proposed ADMD algorithm achievedbetter LCC and SROCC scores under all divisions of trainingsamples. With LCC and SROCC greater than 0.95, the perfor-mance of ADMD is quite stable. As a check, we also conducteda complete cross-validation study ranging from twofold to ten-fold, and found substantially the same results over all divisionsas we report here using random selection. For brevity, we onlyreport the latter results.
D. Performance for Real Distorted Dermoscopy Images
We collected 162 images suffering from real distortions, in-cluding blur and uneven illumination, obtained under a varietyof capture conditions. In this section, the ground-truth quality
TABLE VSINGLE DISTORTION METRICS FOR REAL DISTORTED DERMOSCOPY IMAGES
Blur Uneven Illumination
LCC 0.9254 0.9118SROCC 0.9193 0.9060
TABLE VIAVERAGE LCC AND SROCC FOR REAL DISTORTED DERMOSCOPY IMAGES
QAC NIQE Linear Combination Proposed ADMD
LCC 0.1996 0.1859 0.7639 0.8415SROCC 0.2566 0.2167 0.8389 0.8592
is determined and the effectiveness of the proposed ADMD isverified for real distorted dermoscopy images.
1) Ground-Truth Quality for Real Distorted Images: Unlikesimulated images, real distorted dermoscopy image do not haveassociated reference images. Therefore, it is not possible tocalculate gXOR and r indexes as in (1) and (2), hence, groundtruth (3) is unavailable. As an alternative, a synthetic ground-truth comparison was accomplished using simulated distortedimages, as follows.
Given a real distorted dermoscopy image, we found a simu-lated distorted image from the simulated dataset, suffering fromsimilar degrees of blur and uneven illumination. The blur anduneven illumination distortion levels of the simulated imagewere considered as an approximation to the distortion levels ofthe real image. Following Section II-B, when two images suf-fer from similar blur and uneven illumination levels, they areregarded as having similar quality ground truth. Therefore, theground-truth quality of the real distorted image is set to be thesame as that of the corresponding simulated image.
2) Correlation Analysis: The blur and uneven illuminationlevels of each real distorted image are predicted using the meth-ods described in Sections III-A and III-B. The prediction accu-racy was evaluated using two correlation measures: LCC andSROCC. The results are tabulated in Table V. It may be seen thatthe single distortion indices proposed here are able to predict thedegree of blur and uneven illumination degree effectively. Ta-ble VI compares four assessment methods with respect to over-all quality assessment. The proposed ADMD model delivers themost accurate prediction results among these methods. Com-paring Table VI with Table II, the quality prediction accuracyof ADMD on real distorted images is lower than on simulateddermoscopy images, which is to be expected [40]. However,the values LCC = 0.8415 and SROCC = 0.8592 obtained byADMD on the real distorted images are quite satisfactory.
3) Removal of Low-Quality Filtration: The performance ofADMD on real distorted images can also be verified by assess-ing the statistical accuracy of subsequent lesion analysis againstthe quality predictions. The quality scores y on real distortedimages lie between 0 and 1, where a higher quality score in-dicates worse image quality. When the quality y of an image

XIE et al.: APPLICATION-DRIVEN NO-REFERENCE QUALITY ASSESSMENT FOR DERMOSCOPY IMAGES WITH MULTIPLE DISTORTIONS 1255
Fig. 17. Segmentation accuracy using different quality thresholds. The num-bers with arrows indicate the number of images remaining following applicationof the threshold T .
was greater than a threshold T , the image was removed fromconsideration. Therefore, only images of high quality (y < T )were saved and used for the subsequent lesion analysis. Weused tenfold cross validation to obtain quality predictions onthe real images. Fig. 17 plots segmentation accuracy against thequality threshold T . The segmentation accuracy is expressedas the mean XOR value of the remaining images. A smallerXOR indicates a higher segmentation accuracy. The relation-ship in Fig. 17 is largely monotonic. The mean XOR valuedecreases as the quality threshold is reduced. This suggests thatour application-driven IQA algorithm is quite useful for ensur-ing the accuracy of lesion segmentation and is effective on realdistorted images. The classification accuracy is not given heresince very few malignant lesion samples were present in thedata.
V. CONCLUSION
An IQA process would be a highly desirable part of the pro-cess of acquiring dermoscopy images to ensure that the imagesbeing analyzed are not distorted. Toward this end, we intro-duced a novel application-driven IQA model called ADMD foranalyzing the quality of MD dermoscopy images. In this algo-rithm, two single distortions: blur and uneven illumination areseparately evaluated. Then, taking the two single distortion lev-els as inputs, the overall image quality is predicted by a fuzzyneural network. There are four main contributions made. Thefirst is a new application-driven IQA concept is proposed; thesecond is a new dataset for MD dermoscopy images with blurand uneven illumination that we created. The third contributionis single distortion metrics for blur and uneven illumination thatare only sensitive to their corresponding distortion, while insen-sitive to the other. The fourth and last contribution is an overalldermoscopy image quality assessment framework based on afuzzy neural network. The overall framework effectively cap-tures the highly nonlinear mutual effects of multiple distortionsand it provides an IQA solution framework that may prove use-ful for assessing multiple distortions not only on dermoscopyimages but also on other types of images. A series of experi-ments showed that the proposed algorithm is effective, stable,and insensitive to training set size.
REFERENCES
[1] H. Kittler et al., “Diagnostic accuracy of dermoscopy,” Lancet. Oncol.,vol. 3, no. 3, pp. 159–165, 2002.
[2] H. Iyatomi et al., “An internet-based melanoma diagnostic system-towardthe practical application,” in Proc. IEEE Symp. Comput. Intell. Bioinfor-mat. Comput. Biol., 2005, pp. 1–4.
[3] Handyscope-mobile dermatoscope: Handyscope (2010). [Online]. Avail-able: http://www.handyscope.net
[4] M. Vasconcelos and L. Rosado, “No-reference blur assessment of derma-tological images acquired via mobile devices,” in Proc. Int. Conf. ImageSignal Process., 2014, pp. 350–357.
[5] L. Rosado et al., “From dermoscopy to mobile teledermatology,” inDermoscopy Image Analysis. Boca Raton, FL, USA: CRC Press, 2015,pp. 385–418.
[6] F. Xie et al., “PDE-based unsupervised repair of hair-occluded informa-tion in dermoscopy images of melanoma,” Comput. Med. Imag. Graph.,vol. 33, no. 4, pp. 275–282, 2009.
[7] F. Xie and A. C. Bovik, “Automatic segmentation of dermoscopy im-ages using self-generating neural networks seeded by genetic algorithm,”Pattern Recog., vol. 46, no. 3, pp. 1012–1019, 2013.
[8] Y. He and F. Xie, “Automatic skin lesion segmentation based on textureanalysis and supervised learning,” in Proc. Asian Conf. Comput. Vis., 2012,pp. 330–341.
[9] Q. Abbas et al., “Pattern classification of dermoscopy images: A percep-tually uniform model,” Pattern Recog., vol. 46, no. 1, pp. 86–97, 2013.
[10] M. Sadeghi et al., “Global pattern analysis and classification of der-moscopic images using textons,” in Proc. SPIE Med. Imag., vol. 8314,pp. 83144X-1–83144X-6, 2012.
[11] P. Marziliano et al., “A no-reference perceptual blur metric,” in Proc. Int.Conf. Image Process., 2002, pp. III–57–III-60.
[12] A. C. Bovik and S. Liu, “DCT-domain blind measurement of blockingartifacts in DCT-coded images,” in Proc. IEEE Int. Conf. Acoust. SpeechSignal Process., 2001, pp. 1725–1728.
[13] H. R. Sheikh et al., “No-reference quality assessment using naturalscene statistics: JPEG2000,” IEEE Trans. Image Process., vol. 14, no. 11,pp. 1918–1927, Nov. 2005.
[14] X. Kong et al., “A new image quality metric for image auto-denoising,”in Proc. Int. Conf. Comput. Vis., 2013, pp. 2888–2895.
[15] A. K. Moorthy and A. C. Bovik, “A two-step framework for constructingblind image quality indices,” IEEE Signal Process. Lett., vol. 17, no. 5,pp. 513–516, May 2010.
[16] A. Mittal et al., “Making a ‘completely blind’ image quality analyzer,”IEEE Signal Process. Lett., vol. 20, no. 3, pp. 209–212, Mar. 2013.
[17] L. He et al., “Sparse representation for blind image quality assessment,”in Proc. IEEE Conf. Comput. Vis. Pattern Recog., 2012, pp. 1146–1153.
[18] W. Xue et al., “Learning without human scores for blind image qualityassessment,” in Proc. IEEE Conf. Comput. Vis. Pattern Recog., 2013,pp. 995–1002.
[19] N. Ponomarenko et al., “TID2008-A database for evaluation of full-reference visual quality assessment metrics,” Adv. Modern Radioelectron.,vol. 10, no. 4, pp. 30–45, 2009.
[20] Subjective quality assessment IVC database. (2005). [Online]. Available:http://www.irccyn.ec-nantes.fr/ivcdb/
[21] A57 Database. [Online]. Available: http://foulard.ece.cornell.edu/dmc27/vsnr/vsnr.html
[22] H. R. Sheikh et al. Live image quality assessment data set release2. (2006). [Online]. Available: http://live.ece.utexas.edu/research/ qual-ity/subjective.htm
[23] E. C. Larson and D. M. Chandler, “Most apparent distortion: Full-referenceimage quality assessment and the role of strategy,” J. Electron. Imag.,vol. 19, no. 1, pp. 011006-1–011006-21, 2010.
[24] D. Jayaraman et al., “Objective quality assessment of multiply distortedimages,” in Proc. Conf. Rec.46th Asilomar Conf. Signals Syst. Comput.,2012, pp. 1693–1697.
[25] D. M. Chandler, “Seven challenges in image quality assessment:Past, present, and future research,” ISRN Signal Process., vol. 2013,pp. 905685-1–905685-53, 2013.
[26] K. Gu et al., “FISBLIM: A five-step blind metric for quality assessmentof multiply distorted images,” in Proc. IEEE Workshop Signal Process.Syst., 2013, pp. 241–246.
[27] H. Wang et al., “Watershed segmentation of dermoscopy images usinga watershed technique,” Skin Res. Technol., vol. 16, no. 3, pp. 378–384,2010.
[28] M. E. Celebi et al., “Lesion border detection in dermoscopy images,”Comput. Med. Imag. Graph., vol. 33, no. 2, pp. 148–153, 2009.

1256 IEEE TRANSACTIONS ON BIOMEDICAL ENGINEERING, VOL. 63, NO. 6, JUNE 2016
[29] N. Otsu, “A threshold selection method from gray-level histograms,”Automatica, vol. 11, pp. 23–27, 1975.
[30] M. E. Celebi et al., “An improved objective evaluation measure forborder detection in dermoscopy images,” Skin Res. Technol., vol. 15, no. 4,pp. 444–450, 2009.
[31] F. Xie, “Segmentation and recognition of dermoscopy melanoma imagesbased on computational intelligence,” Ph.D. thesis, Beihang University,Beijing, China, May 2009.
[32] H. R. Sheikh et al., “An information fidelity criterion for image qualityassessment using natural scene statistics,” IEEE Trans. Image Process.,vol. 14, no. 12, pp. 2117–2128, Dec. 2005.
[33] A. K. Moorthy and A. C. Bovik, “Blind image quality assessment: Fromnatural scene statistics to perceptual quality,” IEEE Trans. Image Process.,vol. 20, no. 12, pp. 3350–3364, Dec. 2011.
[34] A. J. Smola and B. Scholkopf, “A tutorial on support vector regression,”Stat. Comput., vol. 14, no. 3, pp. 199–222, 2004.
[35] A. Mittal et al., “No-reference image quality assessment in the spatialdomain,” IEEE Trans. Image Process., vol. 21, no. 12, pp. 4695–4708,Dec. 2012.
[36] J. Wu et al., “Image quality assessment with degradation on spatialstructure,” IEEE Signal Process. Lett., vol. 21, no. 4, pp. 437–440,Apr. 2014.
[37] Y. Lu et al., “No reference uneven illumination assessment for der-moscopy images,” IEEE Signal Process. Lett., vol. 22, no. 5, pp. 534–538,May 2015.
[38] C. T. Lin and C. S. G. Lee, “Neural-network-based fuzzy logic control anddecision system,” IEEE Trans. Comput., vol. 40, no. 12, pp. 1320–1336,Dec. 1991.
[39] L. Zhang et al., “FSIM: A feature similarity index for image qualityassessment,” IEEE Trans. Image Process., vol. 20, no. 8, pp. 2378–2386,Aug. 2011.
[40] M. A. Saad et al., “Objective consumer device photo quality evaluation,”IEEE Signal Process. Lett., vol. 22, no. 10, pp. 1516–1520, Oct. 2015.
Fengying Xie received the Ph.D. degree in patternrecognition and intelligent system from Beihang Uni-versity, Beijing, China, in 2009.
She was a Visiting Scholar in the Laboratory forImage and Video Engineering, University of Texas atAustin, Austin, TX, USA, from 2010 to 2011. Sheis currently a Professor in Image Processing Center,School of Astronautics, Beihang University. Her re-search interests include biomedical image and remotesensing image processing, image quality assessment,and image segmentation and classification.
Yanan Lu received the B.Eng. degree from BeihangUniversity, Beijing, China, in 2011, where she is cur-rently working toward the Ph.D. degree majored inpattern recognition and intelligent system.
Her research interests include biomedical imageprocessing and image quality assessment and restora-tion.
Alan C. Bovik (S’80–M’81–SM’89–F’96) is theCockrell Family Regents Endowed Chair Professorat The University of Texas at Austin, Austin, TX,USA, where he is the Director of the Laboratoryfor Image and Video Engineering, Department ofElectrical and Computer Engineering and the Insti-tute for Neuroscience. His research interests includeimage and video processing and visual perception.He has published more than 750 technical articlesand holds four U.S. patents. His several books in-clude the recent companion volumes The Essential
Guides to Image and Video Processing (San Diego, CA, USA: Academic Press,2009).
Prof. Bovik has received numerous awards from the IEEE Signal Process-ing Society: the Society Award (2013), the Best Paper Award (2009), the BestMagazine Paper Award (2013), the Education Award (2007), the TechnicalAchievement Award (2005), the Meritorious Service Award (1998), and theyoung author Best Paper Award (coauthor, 2013). He also received HonoraryMembership in the Society for Imaging Science and Technology in 2013, theSPIE Technology Achievement Award in 2012, and was named the IS&T/SPIEImaging Scientist of the Year in 2011. He is a Fellow of the Optical Societyof America and the Society of Photo-Optical and Instrumentation Engineers.He cofounded and served as an Editor-in-Chief of the IEEE TRANSACTIONS
ON IMAGE PROCESSING from 1996 to 2002 and founded and served as the firstGeneral Chairman of the IEEE International Conference on Image Processing,Austin, in 1994.
Zhiguo Jiang received the B.Eng., M.S., and Ph.D.degrees from the Beihang University, Beijing, China,in 1987, 1990, and 2005, respectively.
He is currently a Professor in Image ProcessingCenter, School of Astronautics, Beihang University.His research interests include medical image process-ing, segmentation and classification, remotely sensedimage processing, and target detection, tracking, andrecognition.
Rusong Meng is a Deputy Chief Physician of theGeneral Hospital of the Air Force of PLA, Beijing,China. His research interests include morphologicalanalysis of histiocytes, derma pathology, and the clin-ical application of image analysis technology.


![Perceptual Quality Prediction on Authentically …arXiv:1609.04757v1 [cs.CV] 15 Sep 2016 Journal of Vision (2016) Ghadiyaram & Bovik 2 “quality-aware” strategies could help deliver](https://img.dokumen.tips/doc/110x75/5f78d6fa6af0fe77482443c2/perceptual-quality-prediction-on-authentically-arxiv160904757v1-cscv-15-sep.jpg)