Embed Size (px)
Citation preview

VELIBOR MAČKIĆPolitical budget cycles at the municipal level in Croatia
38 (1) 2014
BRUNA ŠKARICADeterminants of non-performing loans in Central and Eastern European countries
MIROSLAV VERBIČ, MITJA ČOK and DARIJA ŠINKOVEC Some evidence for implementing an enhanced relationship in Slovenia
SINIŠA SLIJEPČEVIĆ and BRANIMIR BLAŠKOVIĆStatistical detection of fraud in the reporting of Croatian public companies
Vol. 38, No. 1 | pp. 1-101March 2014 | Zagreb
udc 336issn 1846-887x
1/2014

PublisherInstitute of Public Finance, Smičiklasova 21, Zagreb, Croatia
Editor-in-ChiefKatarina Ott
Production EditorMarina Nekić
Editorial Board (Institute of Public Finance)Marijana Bađun Anto BajoPredrag BejakovićVjekoslav BratićMihaela BronićMartina FabrisKatarina Ott Ivica UrbanGoran Vukšić
Editorial Advisory BoardHrvoje Arbutina (Faculty of Law, Zagreb, Croatia) Will Bartlett (London School of Economics and Political Science, London, UK)Helena Blažić (Faculty of Economics, Rijeka, Croatia) Balázs Égert (OECD, Paris, France)Edgar L. Feige (Professor of Economics Emeritus at the University of Wisconsin, Madison,
Wisconsin, USA) Božidar Jelčić (Faculty of Law, Zagreb, Croatia) Evan Kraft (American University, Washington D.C., USA and Croatian National Bank,
Zagreb, Croatia)Peter J. Lambert (University of Oregon, Department of Economics, Eugene, USA)Olivera Lončarić-Horvat (Faculty of Law, Zagreb, Croatia) Dubravko Mihaljek (Bank for International Settlements, Basel, Switzerland) Peter Sanfey (European Bank for Reconstruction and Development, London, UK)Bruno Schönfelder (Technical University Bergakademie Freiberg, Faculty of Economics
and Business Administration, Freiberg, Germany)Tine Stanovnik (Faculty of Economics, Ljubljana, Slovenia) Athanasios Vamvakidis (Bank of America Merrill Lynch, London, UK)Hrvoje Šimović (Faculty of Economics and Business, Zagreb, Croatia)
Financial Theory and Practice is abstracted and indexed in: DOAJ (Directory of Open Access Journals, Lund University, Sweden) EBSCO Publishing DatabaseEconLit (American Economic Association’s electronic database), JEL (Journal
of Economic Literature, Pittsburgh, Pennsylvania, USA) HRČAK (Portal of Scientific Journals of Croatia)IBSS (International Bibliography of the Social Sciences, ProQuest, Cambridge, UK) RePEc (Research Papers in Economics)
Editorial OfficeInstitute of Public Finance – Financial Theory and PracticeSmičiklasova 21, Zagreb, Croatia, P.O. BOX 320phone: +385 (0)1 4886 444; 4819 363; fax: +385 (0)1 4819 365web-site: www.fintp.hr; e-mail: [email protected]
SubscriptionAnnual subscription amounts to 400 kuna Payments to account no. HR7024840081100661775, Institut za javne financije, Zagreb; quoting: subscription to Financial Theory and Practice, 2014
Printed in 115 copies
The journal comes out four times a year
The journal is co-financed by the Ministry of Science, Education and Sport of the Republic of Croatia
Computer typesetting and printingKerschoffset Zagreb d.o.o., Zagreb, Ježdovečka 112
Pursuant to the requirements of Article 34 Paragraph 3 of the Media Law (Official Gazette no. 59/2004), in 2013 the total income from sales of the journal Financial Theory and Practice was 33,523.60 kuna and the average print order was 200 copies.

Reviewed scientific journal
Vol. 38, No. 1 I pp. 1-101 I March 2014 I Zagreb
1/2014
Financial Theory and Practice publishes scientific articles in the field of public sector economics, and also welcomes submissions of applied and theoretical research papers on a broader set of economic topics such as economic growth and development, the role of institutions, transition to the market economy and EU integration. Empirical analysis is preferably related, but not limited, to the experience of countries in Central and Eastern Europe and Southeast Europe.
Submission of papers
Submission of a paper will be held to imply that it contains original unpublished work and is not being submitted for publication elsewhere. All papers have to pass through a double blind peer-reviewing process.
Guidelines for authors can be found at www.fintp.hr.
Financial Theory and Practice is published in accordance with the highest level of professional ethics and standards. Ethical guidelines for journal publication can be found at www.fintp.hr.
table of contents
articlesVELIBOR MAČKIĆPolitical budget cycles at the municipal level in Croatia
BRUNA ŠKARICADeterminants of non-performing loans in Central and Eastern European countries
MIROSLAV VERBIČ, MITJA ČOK and DARIJA ŠINKOVEC Some evidence for implementing an enhanced relationship in Slovenia
SINIŠA SLIJEPČEVIĆ and BRANIMIR BLAŠKOVIĆStatistical detection of fraud in the reporting of Croatian public companies
book reviewTHE WORLD BANKGlobal Financial Development Report 2013: Rethinking the Role of the State in Finance (Marijana Bađun)
1
1/2014
37
61
81
97


velib
or m
ač
kić:
politic
al b
ud
get c
yc
les at the m
un
icipa
l level in c
ro
atiafin
an
cia
l theo
ry an
d pr
ac
tice
38 (1) 1-35 (2014)1Political budget cycles
at the municipal level in Croatia
VELIBOR MAČKIĆ, univ.spec.oec.*
Preliminary communication**JEL: D72doi: 10.3326/fintp.38.1.1
* The author would like to thank Mirjana Dragičević, PhD and Blanka Škrabić Perić, PhD for all their help during the research phase of the paper as well as to three anonymous referees for their useful comments and suggestions.
** Received: June 1, 2013 Accepted: December 20, 2013The article was awarded as the best regular category paper in the annual award of the Prof. Dr. Marijan Hanžeković Prize for 2013.
Velibor MAČKIĆUniversity of Zagreb, Faculty of Economics and Business, J. F. Kennedy 6, 10000 Zagreb, Croatiae-mail: [email protected]

velib
or m
ač
kić:
politic
al b
ud
get c
yc
les at the m
un
icipa
l level in c
ro
atiafin
an
cia
l theo
ry an
d pr
ac
tice
38 (1) 1-35 (2014)
2 abstractThis paper examines the existence of the political budget cycle (PBC) at the local unit level in Croatia. The research was focused on a sample of 19 county centres, the City of Zagreb and Pula in the period from 2002 to 2011. During that time three parliamentary (in 2003, 2007 and in 2011) and two local elections (in 2005 and in 2009) were held and all the results are calculated at the level of the selected cities. The results do not confirm the existence of opportunistic PBCs, either when the analysis takes in all five elections or when it considers only the parliamentary polls. They do however indicate the restructuring of total expenditures based on second-best strategies and institutional constraints. Analysis of local elections alone indicates the existence of Rogoff’s model of information asymmetry. The paper also presents various theoretical models of the PBC together with a survey of empirical research regarding the existence of PBCs in the developed, transiti-onal and developing countries.
Keywords: political-budget cycles, elections, dynamic panel data analysis
1 introductionIn the context of the path transition has taken in Croatia since the 1990s the pro-blem with budget deficits at all government levels (national, regional and local) indicates the importance of analysing political constraints in the processes of both budget and economic policy formulation and implementation. Political constraints are the result of heterogeneity of preferences among economic agents as defined by public choice theory (politicians, voters, bureaucrats and interest groups) and their mutually confronting interests. They arise due to self-interest on the behalf of incumbents and their re-election motives. In other words, they are shown in a sub-optimal allocation of budget resources and in the creation of budget deficits. Thus, a wider perception of these constraints can be beneficial both for economic policy makers as well as for researchers, voters and other economic agents as de-fined by public choice theory. Additionally, the size and the influence of the state in the economy (measured as the percentage of GDP that is distributed through political decisions) is of too great an importance to keep the focus strictly on the analysis of market decisions and to claim that politicians and their preferences are exogenous.
The political-budget cycle (PBC) has been vigorously studied in the literature, from both theoretical (e.g. Rogoff and Siebert, 1988; Rogoff, 1990; Shi and Svensson, 2002; Drazen and Eslava, 2006) and empirical aspects (e.g. Persson and Tabellini, 2002; Brender and Drazen, 2004; Alt and Lassen, 2006; Schneider, 2010) with various country samples and methodological instruments. Despite the importance of political constraints in the formulation and implementation of opti-mal economic policies, PBCs in Croatia represent an area of research where scie-ntific empirical literature has been rather silent, especially at the local level.

velib
or m
ač
kić:
politic
al b
ud
get c
yc
les at the m
un
icipa
l level in c
ro
atiafin
an
cia
l theo
ry an
d pr
ac
tice
38 (1) 1-35 (2014)3PBC models represent one of the most active branches of research within the new
(positive) political economy (NPE). Due to their theoretical foundations and em-pirical validation they have almost entirely replaced previous research focused on political business cycles. PBC models can be defined as periodical fluctuations in fiscal policy induced by the electoral cycle. With respect to the model, fluctuations can take the form of a budget deficit or a change in the magnitude (increase) and composition of public spending or a reduction in public revenues. From this origi-nates the primary goal of this paper, namely to establish which of the theoretical political budget cycle models is suitable for Croatia.
The main hypothesis of the paper is that in Croatia PBCs do exist at the municipal level and an additional hypothesis is that any party ideology shared at the munici-pal and national level is likely to be visible in public spending. More directly, public spending will rise if municipal and national incumbents share the same party ideology. To the best of the author’s knowledge, there is no scientific empi-rical paper in the domestic literature that has tested the existence of PBCs at the municipal level. The fundamental contribution of this paper to the existing litera-ture is in providing an empirical analysis of the results of combined parliamentary and local elections, and an analysis of separately held local and separately held parliamentary elections on a sample of Croatian cities.
Results that refer to joint parliamentary and local elections and to solely parlia-mentary elections do not confirm the main and the additional hypothesis. In ele-ction years, total spending decreases, which results in a lower budget deficit. Due to the institutional limitations set on the size of public debt at the local level, in-cumbents use opportunistic manipulations within public spending items. In other words, they cut capital and increase current spending. The analysis of solely local elections confirms the existence of PBCs at the municipal level and suggests that Rogoff’s model of asymmetric information is optimal. The increase of the budget deficit in election years in combination with an increase in the average number of employees in the local bureaucracy and budgetary users corresponds with the the-oretical predictions of the stated model. Both results indicate opportunistic beha-viour on the part of the incumbent and the rent-seeking role of the local bureau-cracy in the election process.
The article is organised as follows. The next section presents basic terms from the NPE and from public choice theory (PCT) that serve as the common ground on which both political business cycle and PBC models were developed. Section 3 presents three key PBC models: asymmetric information, moral hazard and the model of incumbent asymmetric preferences (pork barrel cycles), which consti-tute the theoretical basis of the empirical analysis. A survey of the empirical lite-rature on PBC models in developed, transition and developing countries is prese-nted in section 4. Data, methodology and the empirical results obtained are

velib
or m
ač
kić:
politic
al b
ud
get c
yc
les at the m
un
icipa
l level in c
ro
atiafin
an
cia
l theo
ry an
d pr
ac
tice
38 (1) 1-35 (2014)
4 presented in section 5. Finally, conclusions are reported in section 6 together with the directions that future research might take.
2 the new political economy and public choice theoryThe roots of the NPE as a research area can be traced to the theory of macroeco-nomic policy (Lucas’ critique), rational choice theory and public choice theory (PCT) (Persson and Tabellini, 2000:2-3). Although founded on PCT grounds (me-thodological individualism1 and utility maximisation) the NPE is primarily intere-sted in the analysis of the economic effects of politics. In other words, the NPE takes the current institutional framework as a given constraint in the optimisation process without having any explicit intention of changing it.
Drazen (2000:7) argues that actual policies are often quite different from optimal policies due to technical, informational and political constraints. The NPE ex-plains the choice of policies and thus economic outcomes that differ from optimal policies, and the outcomes those policies would imply. In this light the two fol-lowing propositions are important for the NPE. First, heterogeneity and conflicts of interests among economic agents are a necessary condition for political con-straints to exist. And second, the effect of politics on economics follows from the mechanisms by which these conflicts are resolved. It is the latter that is the key focus of the NPE.
The economic effects of political behaviour, within the existing literature, are di-vided between political business cycle and the PBC. Both theoretical and empiri-cal researches into these phenomena stem from PCT. As an interdisciplinary rese-arch area, PCT unites theoretical paradigms of economics and political science and applies it in the analysis of behaviour of key economic agents within the the-ory itself (politicians, voters, bureaucrats and interest groups). PCT can be defined as a special form of ‟economic imperialism”2, as an economic theory of politics or based on Buchanan (2005:8) as ‟politics without romance”. PCT is based on three assumptions: of self-interest, exchange and methodological individualism (Udehn, 2003:154). From these assumptions follows the behaviour of economic agents that aim to maximize their utility with respect to the given constraints.
Elections play a twofold role in this process. First, they include politicians and their preferences in economic models which in turn make them ‟richer” and more real. In that way, by incorporating the interactions of all economic agents, the economic models include conflicts due to incompatible preferences. Finally, through the election process, voters decide on the collective action (i.e. its start/end, intensity, etc.).
1 The term highlights that it is the individual and his (rational) choices that are in the centre of the analysis. Arnsperger and Varoufakis (2006) suggest that methodological individualism implies the idea that all socio-economic explanations should be sought at the level of individual economic agent.2 The term is derived in the works of Tullock (1972), Stiegler (1984) and Udehn (2003).
velib
or m
ač
kić:
politic
al b
ud
get c
yc
les at the m
un
icipa
l level in c
ro
atiafin
an
cia
l theo
ry an
d pr
ac
tice
38 (1) 1-35 (2014)5The relationship between economic agents within PCT is best described through
the agent-principal model in which preferences, in most cases, do not coincide. For instance, the agent (politician) can trick his principal (voter) due to informa-tion asymmetry prior, during or even after the election period. Once the elections are held, economic agents start negotiating and voting on various public policies. The policies chosen are then delegated to bureaucrats who are in charge of imple-menting them. During this whole process, interest groups apply pressure in order to bring about an outcome of the collective action that is in their favour.
McLean (1997:39, 41) analyses politicians as entrepreneurs that provide specific public goods and as ‟ideological entrepreneurs”. The first are responsible for pro-ducing and trading public goods, but are also characterised by their tendency to trade private goods also. It is their role as entrepreneurs that represents the basis for their re-election aspirations in front of the electorate. On the other hand we see ‟ideological entrepreneurs” who are genuinely interested in the contents of poli-tics and the political. They ensure public goods regardless of the free rider pro-blem. ‟Ideological entrepreneurs” do not expect to be compensated and consider their work as their calling.
Voters represent rational and self-interested economic agents that can be compa-red to consumers in the market. Their act of voting serves as a means to maximize their utility function. The biggest problem in the analysis of voter behaviour is that voters actually do not know how to vote for their own interests. The cost of acqui-ring information, in a (pre)election period, is too high for a rational homo econo-micus. Additionally, if information does not exist or is asymmetric the optimal strategy for every voter is to act as a rational ignoramus.3 In such a case, a rational voter ignores all pre-election events and votes ideologically. In return, it is exactly the combination of rational ignorance, ideological voting and the so called ‟pro-blem of full supply”4 that stimulates politicians in their sub-optimal behaviour.
According to Niskanen’s model of bureaucracy, bureaucrats will aim to maximize their own budget due to the fact that they cannot maximize profit (McLean, 1997:100-101). Since they are monopolistic suppliers of their own goods this re-presents the only way in which they can ensure compensation through various privileges: bigger offices, higher salaries, public reputation, etc. Most theoreti-cians of public choice claim that during this process bureaucrats will tend to pro-duce more than the politicians (and probably voters) would like them to do or that they will do it at a higher price (Lemieux, 2004:27). The literature also emphasises the role of information asymmetry or the power of bureaucracy to determine the agenda (Mueller, 2003:333, 342-343).
3 But rational ignorance is also asymmetric, with the essential role of interest groups and incumbents in that process.4 The situation in which none of the programs offered to voters fully reflects their preferences.

velib
or m
ač
kić:
politic
al b
ud
get c
yc
les at the m
un
icipa
l level in c
ro
atiafin
an
cia
l theo
ry an
d pr
ac
tice
38 (1) 1-35 (2014)
6 Interest groups represent groups of individuals with common interests that con-duct collective actions: caveats, lobbying, financing political party campaigns, etc. Their goal is to influence the outcome of collective actions that very often have the characteristics of a public good. Their activities rarely come to the tight bonding to those political options that would, in their opinion, best represent their interests in exchange for their support in the elections. Promoting the joint interest of their members, at the expense of others, is the main reason why interest groups enter into politics.
3 political budget cyclesPolitical decisions have economic outcomes that are visible in movements of eco-nomic variables and instruments. Political business cycle models represent elec-tion driven cycles in (macro)economic variables: unemployment rates, inflation rates and production. With respect to the rational expectations hypothesis and in-cumbents’ motives (opportunistic vs. partisan) the existing political business cycle models can be divided into four large groups: adaptive opportunistic, adaptive partisan, rational opportunistic and rational partisan political business cycle mo-dels (Alesina, 1988:16). Drazen (2000:259) supplemented Alesina’s division with ‟Hibb’s model of changing objectives”, which represents a synthesis of previous models in an environment characterised by rational expectations.
PBC models represent a periodical fluctuation in governmental fiscal policy indu-ced by the cyclicality of elections (Shi and Svensson, 2003:67), that is, an incre ase in public spending (total or in certain items), budget deficit creation and a decr ease in public revenues in election year. The key difference between PBC and political business cycle models is that the former focus on the analysis of instruments that are under the direct control of politicians. Various PBC models study the effects of political pressures aimed at increasing public spending and creating budget defi-cits. Just as in the political business cycle models, political pressures can take two forms: opportunistic and partisan. In the first case, opportunistic politicians can increase either total spending or individual budget items aimed at certain groups in order to improve their chances of re-election. Alternatively, incumbents might be beholden to a partisan constituency that gains from certain kinds of expendi ture (Lohmann, 2006:534).
According to Mueller’s ethical voter hypothesis that focuses on economic vo ting, the voter has an objective function, which he tries to maximize, with the two following variables: personal and social welfare.5 In PBC models, voters value only personal, direct benefit from governmental programmes. Since information is asymmetric, their voting is labelled as rational retrospective, meaning that it
5 Mueller (2003:298-299) denotes these two terms as egotropic and sociotropic variables in the objective func-tion that the voter is trying to maximize. Egotropic variables measure voter expectations regarding the effect of the government’s policies on the voter’s own income, employment status, and so on. Sociotropic variables measure voter expectations regarding the effect of the government’s policies on the economy at large, that is, on the welfare of all citizens.

velib
or m
ač
kić:
politic
al b
ud
get c
yc
les at the m
un
icipa
l level in c
ro
atiafin
an
cia
l theo
ry an
d pr
ac
tice
38 (1) 1-35 (2014)7 follows from the incumbents’ observed results during their term in the office
(Alesina et al., 1997). In this way, voters are trying to determine exactly how much the incumbents contribute to their objective utility functions. In so doing, a rational voter will react to pre-election manipulation, e.g. when an incumbent tries to signalise its high level of competence through increased public spending and lower taxes or when it changes the structure of public spending in the (pre)elec-tion period. Under these conditions, the incentives faced by the politicians to ma-nipulate budget items and to create budget deficits primarily depend on the fiscal prefere nces of voters (whether they prefer ‟high spending” or ‟low spending” politicians) and on the transparency of the budget process.
Shi and Svensson (2003:69-70) distinguish two types of PBC models: signal mo-dels (adverse selection-type models), that are based on asymmetric information regarding the politicians’ level of competence, and models based on moral hazard. Drazen and Eslava (2006:16) expand this division with their own model of incum-bents’ asymmetric preferences (pork barrel cycles) in which alongside the overall level of expenditures one also observes the structure of expenditures among vo-ters.
The key reason for analysing PBC models is in their empirical confirmation, which is stronger in the case of macroeconomic instruments than in that of macro-economic results (Drazen, 2000:242-244). At the same time, empirical results cle-arly indicate that the manipulation of instruments by incumbents who wish to improve their re-election chances through opportunistic economic policies is more evident in the case of fiscal than in the case of monetary policy (Snowdon and Vane, 2005:536). This follows from Rogoff’s concept of conservative central banker whose primarily goal is price stability (Snowdon and Vane, 2005:552). Cycles that arise are shorter and have lower intensity, but the empirical advantage of PBC models is that they permit research into cycles at both national and local levels.
3.1 model based on asymmetric preferencesThis model is based on signals that incumbents have sent to their electorate in the form of lower taxes and/or higher expenditures. The goal of incumbents in the (pre)election period is to present themselves as more competent then they really are. In that way, they create the illusion that they can provide a given level of pu-blic services with lower levels of public revenues.6
The basic argument of the model is that voters prefer public expenditures, but constantly undervalue their tax costs, i.e. they suffer from ‟fiscal illusions”. The problem increases if the costs are postponed so voters support incumbents who
6 Rogoff and Siebert (1988:2) define competence as the minimum amount of public revenues needed to en sure the given levels of public services.
velib
or m
ač
kić:
politic
al b
ud
get c
yc
les at the m
un
icipa
l level in c
ro
atiafin
an
cia
l theo
ry an
d pr
ac
tice
38 (1) 1-35 (2014)
8 can provide high levels of public expenditures, financed through public debt, and remove those who cannot.
3.1.1 Rogoff and siebert Pbc model The PBC model by Rogoff and Siebert in 1988 assumes that each politician has a competence level (high or low) which is only known to him and not to the electo-rate. As a consequence, during elections, voters form their rational expectations based on observable current fiscal policy outcomes. A high-type incumbent will attempt to signal his type by engaging in expansionary fiscal policy, which leads to a pre-election budget deficit. A low-type incumbent will avoid this manoeuvre. The reason for this originates from the theoretical predictions of the model, in which both types of politicians put equal weights on re-election and social welfare.
Elections are held every two years and the incumbent provides a well-known, fi-xed level of public services financed through distortive (e.g. bond issuance) and non-distortive tax, depending also on the competence level of the incumbent (Ro-goff and Siebert, 1988:5). Incumbents’ competence is shown in the level and the structure of public revenues and it follows an MA(1)7 process indicating that com-petence will not be signalised outside the election period. Voters vote taking into account the increase/decrease of their individual utility functions. Since they are all identical we are observing a representative voter who will, other things being equal, prefer a high-type incumbent who can finance public goods solely through non distortive taxes that do not further decrease voters’ income level.
At the beginning of each election period, voters receive a signal from the incum-bent in the form of a non-distortive tax. Only after the elections are held do voters infer the second signal, which is loss of income (e.g. costs of debt financing). This enables incumbents to signalise a higher level of competence, i.e. to provide more public goods for a given level of (non-distortive) taxes, in the election period through budget deficit creation (Rogoff and Siebert, 1988).
3.1.2 Rogoff’s Pbc model In Rogoff’s PBC model of 1990 public goods are divided into ‟consumption” and ‟investment” goods. Pre-election manipulations are shown in the structure of pu-blic expenditures that decreases capital expenditures for ‟investment” goods and increases transfers and current spending. The model also incorporates an ego rent for the incumbent that represents a non-monetary benefit for holding office (e.g. honour), but which ‟does not exclude a possibility of rent seeking behaviour” (Rogoff, 1990:2).
7 MA(1) denotes a moving-average model which is conceptually a linear regression of the current value of the series against current and previous (unobserved) white noise error terms or random shocks.

velib
or m
ač
kić:
politic
al b
ud
get c
yc
les at the m
un
icipa
l level in c
ro
atiafin
an
cia
l theo
ry an
d pr
ac
tice
38 (1) 1-35 (2014)9According to Rogoff’s 1990 model an incumbent’s competence follows the
MA(1) process and we analyse the public goods production function, but in per capita amounts. The production of public goods depends on the level of (non-di-stortive) tax and incumbent’s (administrative) competence,8 indicating that a com-petent incumbent is able to provide a given level of public goods at a lower level of taxes. Since the level of taxes and the amount of public ‟consumption” goods can be inferred by voters in time period t, which is the election period, the incen-tive for the incumbent to increase the amount of public ‟consumption” goods is evident. The exact level of the incumbent’s competence will be clear in time pe-riod t + 1, once the production of public ‟investment” goods is noted. Thus in the election period voters do not know whether the increased amount of goods and services is a sign of higher competence or a result of a fiscal manipulation.
3.2 model based on moral hazardIn a PBC model based on moral hazard it is assumed that neither the electorate nor the politician can observe the politician’s competence contemporaneously. A com-petent politician is defined by their ability to produce public goods without raising taxes. The easiest way to do this is through short-term excess borrowing, which voters infer only after the elections. Thus all politicians, regardless of their level of competence, will incur excessive pre-election budget deficits.
The supply of public goods depends on the incumbent’s level of competence, taxes, excessive short-term borrowing and the cost function of public debt. The incumbent’s competence also follows the MA(1) process, implying that the same level of competence does not last more than two periods. Exactly after these two periods, the elections are held.
At the beginning of period t incumbent decides on the level of taxes and excess short-term borrowing. During the observed time period there is shock in the in-cumbent’s level of competence. The result of this shock is the ex ante uncertainty of the incumbent of his ability to convert revenues into public goods, i.e. his own competence. Since the elections are held at the end of the period, voters’ ability correctly to evaluate the incumbent’s decisions depends on the level of informa-tion. A share of the informed voters σ will know exactly the levels of taxes, public debt and public goods at the time of the election. A share of the uninformed voters (1 − σ)will only have information on variables that directly affect their level of utility (public goods and tax levels). Thus it follows that incumbents will more easily manipulate fiscal instruments when the level of uninformed voters is bigger. The model implies that countries with lower levels of voter awareness and higher ‟ego” rents will have higher levels of public debt, but also that ‟ego” rents will decrease with the development of institutions and higher transparency of budget process (Shi and Svensson, 2006:1376-1377).
8 Rogoff (1990:23) identifies competence of politicians with the level of administrative intelligence quotient.

velib
or m
ač
kić:
politic
al b
ud
get c
yc
les at the m
un
icipa
l level in c
ro
atiafin
an
cia
l theo
ry an
d pr
ac
tice
38 (1) 1-35 (2014)
10 3.3 model of incumbent’s asymmetric preferences: pork barrel cycle
Drazen and Eslava (2006) developed a PBC model in which incumbents influence voters by targeting government spending to specific group of voters at the expense of other voters or other expenditures. Using targeted spending, aimed at more ‟useful” voters, enables electoral manipulation with no effect on total spending and/or budget deficit. This is especially important for so called ‟old” democracies, where empirical research confirms that voters are ‟fiscal conservatives” who pu-nish incumbents who generate budget deficits (Eslava, 2011:22). In the model, voters exactly know how the increase of spending is financed. Their only interest is in whether this structure of spending will continue to favour them once the elections are over. Total spending takes the three following forms in the model:
– geographically concentrated investment projects (a more narrow definition of ‟pork barrel spending”),
– expenditures and transfers targeted to specific demographic groups, – tax cuts benefiting certain sectors.
A key innovation that enables the creation of PBCs is so called ‟policy” prefere-nces of the incumbent over different voting groups that are not revealed to the electorate. Voters try to detect them by monitoring public goods spending over regions in the previous term. At the same time it is assumed that the incumbent has unobserved preferences concerning groups of voters or types of expenditure, which have some persistence over time. Monitoring the level of expenditures on public goods in one region enables the voter to infer the importance of that region in the time period t (election year) for the incumbents and their likely preferences in the future. In other words, a voter can rationally evaluate all future benefits if the incumbent remains in office (Drazen and Eslava, 2006).
4 survey of empirical research on the political budget cycleThis part of the paper presents 8 studies which empirically test the existence of PBC in OECD countries. All the papers are theoretically founded either on the asymmetric information or the moral hazard basis. Methodologically, research has been conducted via a static or a dynamic panel model. Six studies have been con-ducted at the local and the remaining two at the national level. The results in four studies confirm the existence of PBCs, while research undertaken by Rose (2006) indicates that PBCs are conditional on institutional constraints within the obser-ved federal states of USA. Studies on federal states in the former West Germany yield interesting results. Seitz (2000) and Schneider (2010) reject the hypothesis that PBCs exist, while Galli and Rossi (2002) confirm it. Table 1 contains all the mentioned studies and lists: author names, methodology, variables and conclu-sions.

velib
or m
ač
kić:
politic
al b
ud
get c
yc
les at the m
un
icipa
l level in c
ro
atiafin
an
cia
l theo
ry an
d pr
ac
tice
38 (1) 1-35 (2014)11
ta
bl
e 1
Empi
rica
l res
earc
h on
PBC
in d
evel
oped
cou
ntri
es
auth
ors
Meth
odolo
gyVa
riabl
esco
nclu
sion
Seitz
(200
0): 1
1 fed
eral
states
of
Wes
t Ger
man
y, 19
70-1
996
Fixe
d-Ef
fect
estim
ator
(stati
c pan
el da
ta)
Prim
ary b
udge
t bala
nce,
total
ex
pend
iture
s, ca
pital
expe
nditu
res,
fede
ral g
rant
s, un
empl
oym
ent
expe
nditu
res,
total
reve
nues
, tax
re
venu
es
Parti
san P
BC m
odel
not c
onfir
med
.
Pette
rsson
-Lid
bom
(200
0):
Swed
en, 2
88 m
unici
palit
ies,
1974
-199
8
Ande
rson-
Hsiao
es
timato
r (d
ynam
ic pa
nel d
ata)
Total
spen
ding
, inc
ome t
ax ra
te,
aggr
egate
grow
th of
the S
wedi
sh
econ
omy
In ac
cord
ance
with
Rog
off’s
mod
el, sp
endi
ng is
raise
d and
taxe
s are
cut i
n elec
tion y
ear,
in th
e pos
t-elec
tion y
ear s
pend
ing i
s hig
her a
nd ta
xes a
re lo
wer f
or re
-elec
ted th
an fo
r ne
wly e
lected
gove
rnm
ents,
re-e
lected
gove
rnm
ents
spen
d les
s and
tax m
ore i
n the
po
st-ele
ction
year
as co
mpa
red t
o the
elec
tion y
ear,
cond
ition
al on
taxe
s, sp
endi
ng is
po
sitiv
ely re
lated
to el
ecto
ral s
ucce
ss.
Galli
and R
ossi
(200
2):
11 fe
dera
l stat
es of
Wes
t Ge
rman
y, 19
74-1
994
Fixe
d-Ef
fect
estim
ator
(stati
c pan
el da
ta)
Total
expe
nditu
re, s
urpl
us/d
eficit
, pu
blic
adm
inist
ratio
n, he
alth c
are,
educ
ation
, roa
ds an
d soc
ial se
curit
y
Oppo
rtuni
stic P
BC m
odel
confi
rmed
, gov
ernm
ent s
pend
ing i
ncre
ases
in an
elec
tion
perio
d.
Rose
(200
6): 4
3 fed
eral
states
of
USA
, 197
4-19
99
GMM
estim
ator
(dyn
amic
pane
l data
)Bu
dget
balan
ce, t
axes
, exp
endi
ture
, fe
dera
l gra
nts (
per c
apita
) Fi
scal
restr
ictio
ns on
borro
wing
in fe
dera
l stat
es li
mits
polit
ically
-mot
ivate
d fisc
al vo
latili
ty.Al
t and
Las
sen (
2006
):
19 O
ECD
coun
tries
, 199
0-19
99
GMM
esti
mato
r (d
ynam
ic pa
nel d
ata)
Budg
et ba
lance
(% G
DP),
fisca
l tra
nspa
renc
y ind
exPo
litica
lly m
ore p
olar
ized a
nd fi
scall
y les
s tra
nspa
rent
coun
tries
reco
rd cy
cles i
n bud
get
balan
ce in
the e
lectio
n yea
rs.
Veig
a and
Veig
a (20
06):
27
8 mun
icipa
lities
in P
ortu
gal,
1979
-200
1
GMM
estim
ator
(dyn
amic
pane
l data
)Bu
dget
balan
ce, t
axes
and t
otal
expe
nditu
res (
per c
apita
)
Oppo
rtuni
stic b
ehav
iour
of lo
cal g
over
nmen
ts co
nsist
ent w
ith as
ymm
etric
info
rmati
on
mod
els, i
n pre
-elec
tion p
erio
ds th
ey in
crea
se to
tal ex
pend
iture
s and
chan
ge th
eir
com
posit
ion f
avou
ring i
tems t
hat a
re hi
ghly
visib
le to
the e
lecto
rate.
Schn
eider
(201
0): f
eder
al sta
tes
of W
est G
erm
any,
1970
-200
3 Fi
xed-
Effe
ct es
timato
r (st
atic p
anel
data)
Grow
th ra
tes of
defic
it/su
rplu
s, to
tal
expe
nditu
re an
d soc
ial be
nefit
sDu
e to i
nstit
utio
nal c
onstr
aints
incu
mbe
nts m
anip
ulate
budg
et str
uctu
res,
but t
here
is no
cy
cle in
budg
et ba
lance
and t
otal
expe
nditu
re.
Katsi
mi a
nd S
aran
tides
(201
2):
19 O
ECD
coun
tries
, 197
2-19
99
Fixe
d-Ef
fect
estim
ator
(stati
c pan
el da
ta)Bu
dget
balan
ce, t
otal
expe
nditu
res
and r
even
ues
Mor
al ha
zard
PBC
mod
el wa
s tes
ted, o
nly t
he ne
gativ
e effe
ct of
elec
tions
on re
venu
e att
ribut
ed to
a fa
ll in
dire
ct tax
ation
was
stati
stica
lly si
gnifi
cant
.
Sour
ce: T
he a
utho
r.

velib
or m
ač
kić:
politic
al b
ud
get c
yc
les at the m
un
icipa
l level in c
ro
atiafin
an
cia
l theo
ry an
d pr
ac
tice
38 (1) 1-35 (2014)
12
ta
bl
e 2
Empi
rica
l res
earc
h on
PBC
in tr
ansi
tion
and
deve
lopi
ng c
ount
ries
auth
ors
Meth
odolo
gyVa
riabl
esco
nclu
sion
Halle
rber
and d
e Sou
za
(200
0): 1
0 new
EU
mem
ber
states
, 199
0-19
99
Tim
e ser
ies
analy
sisBu
dget
balan
ce, m
oney
supp
ly an
d exc
hang
e rate
Coun
tries
with
fixe
d exc
hang
e rate
exhi
bit a
n inc
reas
e of b
udge
t defi
cit ar
ound
1.5
% of
GDP
in pr
e-ele
ction
perio
d, wh
ile co
untri
es w
ith fl
exib
le ex
chan
ge
rates
exhi
bit a
n inc
reas
e in m
oney
supp
ly ar
ound
0.14
% of
GDP
in pr
e-ele
ction
perio
d if t
he ce
ntra
l ban
k is n
ot in
depe
nden
t.
Akhm
edov
and Z
hura
vska
ya
(200
4): M
unici
pal l
evel
in
Russ
ia, 19
96-2
003
Fixe
d-Ef
fect
estim
ator (
static
pa
nel d
ata) a
nd
LOGI
T
Total
expe
nditu
res,
socia
l exp
endi
ture
s, ed
ucati
on
expe
nditu
res,
expe
nditu
res o
n cul
ture
, hea
lth ca
re
expe
nditu
res,
med
ia ex
pend
iture
s, ex
pend
iture
s on
indu
stry,
shar
e of s
ocial
expe
nditu
res,
shar
e of
med
ia ex
pend
iture
s, to
tal re
venu
es, t
ax re
venu
es,
defic
it, tr
ansfe
rs, gr
owth
, infl
ation
, wag
e
Rogo
ff’s t
ype o
f PBC
mod
el is
confi
rmed
, exi
stenc
e of a
n opp
ortu
nisti
c cyc
le in
the l
evel
and s
tructu
re of
total
expe
nditu
re in
elec
tion p
erio
d is c
onfir
med
(c
urre
nt ex
pend
iture
s rise
), th
e mag
nitu
de of
cycle
decr
ease
s with
insti
tutio
nal
deve
lopm
ent a
nd ov
er ti
me,
pre-
electo
ral m
anip
ulati
on in
crea
ses i
ncum
bent
s’ ch
ance
s for
re-e
lectio
n.
Mau
rel (
2006
): 25
EU
coun
tries
, Bul
garia
, Rom
ania
and C
roati
a, 19
90-2
005
Fixe
d-Ef
fect
estim
ator (
static
pa
nel d
ata)
Budg
et ba
lance
, tot
al ex
pend
iture
s, to
tal re
venu
es,
mon
ey ag
greg
ate M
3 In
crea
se in
total
expe
nditu
res a
nd bu
dget
defic
it in
the e
lectio
n per
iod i
n bot
h ‟o
ld” a
d ‟ne
w” m
embe
r stat
es.
Klaš
nja (
2008
): 25
post-
com
mun
ist co
untri
es,
1990
-200
6
Fixe
d-Ef
fect
estim
ator (
static
pa
nel d
ata)
Budg
et ba
lance
, tot
al ex
pend
iture
s and
reve
nues
, so
cial t
rans
fers
and ‟
loca
l pub
lic go
ods”
(cur
rent
an
d cap
ital e
xpen
ditu
res,
perso
nnel
expe
nditu
res,
i.e. i
nstru
men
ts th
at ca
n be s
ocial
ly or
geog
ra ph
i-ca
lly ta
rgete
d) (%
GDP
)
Incr
ease
in bu
dget
defic
it of
1.05
% an
d in t
otal
expe
nditu
res o
f 0.82
% in
an
electi
on pe
riod,
with
in to
tal ex
pend
iture
s the
re is
an in
crea
se of
0.63
% on
so
cial t
rans
fers
in an
elec
tion a
nd 0.
45%
in a
post-
electi
on pe
riod,
coun
tries
wi
th pr
esid
entia
l dem
ocra
cy an
d majo
ritar
ian el
ectio
n sys
tem ex
hibi
t cyc
les in
so
cial t
rans
fers
with
sim
ultan
eous
cuts
in ta
x rev
enue
s tha
t are
not r
ecor
ded i
n co
untri
es w
ith pa
rliam
entar
y dem
ocra
cy an
d pro
porti
onal
electi
on sy
stem
.Vu
čkov
ić (2
010)
: Cr
oatia
, 199
5-20
08Ti
me s
eries
an
alysis
Budg
et ba
lance
, tot
al ex
pend
iture
s, to
tal re
venu
es
(% G
DP)
Oppo
rtuni
stic c
ycles
in th
e tot
al ex
pend
iture
s (in
crea
se in
last
quar
ter pr
ior t
o ele
ction
s and
decr
ease
in fi
rst qu
arter
after
elec
tions
).Sc
hukn
echt
(200
0):
24 de
velo
ping
coun
tries
, 19
73-1
992
Fixe
d-Ef
fect
estim
ator (
static
pa
nel d
ata)
Budg
et ba
lance
, tot
al ex
pend
iture
s, to
tal re
venu
es,
capi
tal an
d cur
rent
expe
nditu
res a
nd pe
rsonn
el ex
pend
iture
s
Total
expe
nditu
res i
ncre
ase i
n pre
-elec
tion p
erio
d, to
geth
er w
ith an
incr
ease
in
capi
tal as
com
pare
d to c
urre
nt ex
pend
iture
s in p
re-e
lectio
n per
iod.

velib
or m
ač
kić:
politic
al b
ud
get c
yc
les at the m
un
icipa
l level in c
ro
atiafin
an
cia
l theo
ry an
d pr
ac
tice
38 (1) 1-35 (2014)13
auth
ors
Meth
odolo
gyVa
riabl
esco
nclu
sion
Gonz
alez (
2002
): M
exico
, 19
57-1
997
Tim
e ser
ies
analy
sisBu
dget
balan
ce, t
otal
expe
nditu
res a
nd re
venu
es,
capi
tal ex
pend
iture
s and
socia
l tra
nsfe
rsCa
pital
expe
nditu
res i
n inf
rastr
uctu
re an
d soc
ial tr
ansfe
rs co
nfirm
the e
xiste
nce
of an
oppo
rtuni
stic P
BC m
odel.
Perss
on an
d Tab
ellin
i (20
02):
60 co
untri
es, 1
960-
1998
Fixe
d-Ef
fect
estim
ator (
static
pa
nel d
ata)
Total
expe
nditu
res,
total
reve
nues
, defi
cit/su
rplu
s, so
cial e
xpen
ditu
res
Taxe
s dec
reas
e in p
re-e
lectio
n per
iod i
n bot
h par
liam
entar
y and
pres
iden
tial
dem
ocra
cies,
but o
nly t
he la
tter e
xhib
it ex
pend
iture
cuts
and t
ax in
crea
ses i
n a
post-
electi
on pe
riod.
Khem
ani (
2004
): 14
fede
ral
states
in In
dia,
1960
-199
4Ti
me s
eries
an
alysis
Budg
et ba
lance
, pub
lic in
vestm
ent,
total
ex
pend
iture
s, to
tal re
venu
esEl
ectio
n yea
r is p
ositi
vely
corre
lated
with
publ
ic in
vestm
ents
and n
egati
vely
co
rrelat
ed w
ith ce
rtain
cons
umpt
ion t
axes
, the
re is
no cy
cle in
budg
et de
ficit.
Bren
der a
nd D
raze
n (20
04):
68 co
untri
es, 1
960-
2001
Fixe
d-Ef
fect
estim
ator (
static
pa
nel d
ata)
Budg
et ba
lance
, tot
al ex
pend
iture
s, to
tal re
venu
es
(% G
DP)
Both
expe
nditu
res a
nd bu
dget
defic
its in
crea
se in
elec
tion y
ears
in co
untri
es
labell
ed as
‟new
” dem
ocra
cies.
Draz
en an
d Esla
va (2
005)
: Co
lum
bia (
mun
icipa
l lev
el),
1992
-200
0
GMM
estim
ator
(dyn
amic
pane
l da
ta)
Curre
nt ex
pend
iture
s, ca
pital
expe
nditu
res,
inve
stmen
t, de
bt se
rvice
Ther
e is n
o inc
reas
e in t
otal
expe
nditu
res i
n the
elec
tion p
erio
d, ra
ther
a ch
ange
in
the s
tructu
re of
total
expe
nditu
res,
curre
nt ex
pend
iture
s dec
reas
e and
capi
tal
expe
nditu
res i
ncre
ase w
ith an
incr
ease
in pe
rsonn
el ex
pend
iture
s for
perm
anen
t pe
rsonn
el.
Shi a
nd S
vens
son (
2006
):
85 de
velo
ped a
nd de
velo
ping
co
untri
es, 1
975-
1995
GMM
estim
ator
(dyn
amic
pane
l da
ta)Bu
dget
balan
ce as
a pe
rcen
tage o
f GDP
Budg
et de
ficit
incr
ease
s aro
und 1
% in
elec
tion y
ear,
stron
ger e
ffect
exhi
bited
in
deve
lopi
ng co
untri
es du
e to w
eake
r ins
titut
iona
l var
iables
and l
ack o
f acc
ess t
o in
form
ation
.
Bren
der a
nd D
raze
n (20
09):
74
coun
tries
, 197
0-20
03LO
GIT
BALC
H_ter
m (c
hang
e in b
alanc
e/GDP
ratio
in th
e pe
riod o
f 2 ye
ars p
rior t
o elec
tions
com
pare
d to
balan
ce/G
DP ra
tio in
the p
erio
d of 2
year
s prio
r to
that)
and B
ALCH
_ey (
chan
ge in
balan
ce/G
DP ra
tio
in th
e elec
tion y
ear c
ompa
red t
o cha
nge i
n bala
nce/
GDP r
atio i
n the
year
prio
r to e
lectio
n yea
r)
Budg
et de
ficit
in th
e elec
tion y
ear d
ecre
ases
or do
es no
t hav
e a st
atisti
cally
sig
nific
ant e
ffect
on re
-elec
tion c
hanc
es.
Naru
hiko
Sak
urai
and
Men
ezes
-Filh
o (20
11):
Br
azil,
1989
-200
5
GMM
estim
ator
(dyn
amic
pane
l da
ta)
Budg
et ba
lance
, tot
al ex
pend
iture
s (cu
rrent
and
capi
tal),
tax re
venu
es of
loca
l mun
icipa
lities
Exist
ence
of op
portu
nisti
c and
parti
san c
ycles
at th
e loc
al lev
el in
acco
rdan
ce
with
Rog
off’s
PBC
mod
el, bu
dget
defic
it in
crea
se du
e to i
ncre
ase o
f cur
rent
ex
pend
iture
s and
decr
ease
of lo
cal t
ax re
venu
es in
the e
lectio
n per
iod.
Sour
ce: T
he a
utho
r.

velib
or m
ač
kić:
politic
al b
ud
get c
yc
les at the m
un
icipa
l level in c
ro
atiafin
an
cia
l theo
ry an
d pr
ac
tice
38 (1) 1-35 (2014)
14 A survey of empirical studies of the existence of PBCs in the sample of transition and developing countries encompasses 13 studies, out of which 10 confirm the existence of PBCs. Methodologically, research was also conducted via static or dynamic panel models on a large sample of countries, but also via time series analysis. Brender and Drazen (2009) did not test for existence or statistical signi-ficance of budgetary variables in election period rather whether opportunistic cre-ation of cycles helps boost re-election chances for the incumbent with LOGIT regression.9 Also Akhmedov and Zhuravskaya (2004) use LOGIT regression but combine it with static panel analysis. Methodology, variables and conclusions of surveys are presented in table 2 in chronological order. First are listed surveys in transition countries and after them surveys for developing countries, also in chro-nological order.
5 research on political budget cycles at the municipal level in croatia 5.1 dataThe model encompasses 21 cities (19 county centres plus the City of Zagreb and Pula) in time period from 2002 till 2011. In the observed time period 3 parliamen-tary elections (2003, 2007 and 2011) and 2 local elections (2005 and 2009) were held, with all results calculated and shown at the municipal (local) levels. The sample encompasses all the county centres and the City of Zagreb, but instead of Pazin, in Istarska County, it includes Pula. Since Pula represents the economic, financial, cultural, transportation, health and educational hub of Istarska County, the choice was obvious. These 21 cities, out of the 33 that have taken over decen-tralised functions, were selected because of their size and due to the fact that they are generators of trends in fiscal variables at the local level. Furthermore, the NPE is based on a Hamiltonian approach to political economy which emphasises not just the importance of economic incentives, but also of political constraints, in its analysis of economic outcomes. The latter are shown in the symbolic value of holding office in the selected cities for all political parties. From that, it clearly follows that political constraints will significantly influence economic outcomes.
Data used in the model come from Ministry of Finance local budget archives, the State Election Committee and the Croatian Bureau of Statistics. As the starting year of the analysis, 2002 was chosen, because it was the year when the fiscal decentralisation process started and local-level data became available.
Dynamic panel regressions with dependent variables taken from local budgets are used in the model. Stated dependent variables in the model are:
1) Budget balance (% of total revenues),2) Total expenditures (% of total revenues),
9 LOGIT or logistic regression is a special form of regression analysis in which the dependent variable is a binary variable (Hair et al., 1995:130). In survey conducted by Brender and Drazen (2008) dependent varia-ble takes the value of 1 if incumbent remains in office and 0 otherwise.

velib
or m
ač
kić:
politic
al b
ud
get c
yc
les at the m
un
icipa
l level in c
ro
atiafin
an
cia
l theo
ry an
d pr
ac
tice
38 (1) 1-35 (2014)153) Current expenditures (% of total revenues),
4) Other expenditures (% of total revenues),5) Capital expenditures (% of total revenues),6) Average number of employees in local bureaucracy (% of total population),7) Average number of employees in budgetary users (% of total population),8) Personnel expenses for local bureaucracy (% of total revenues),9) Personnel expenses for budgetary users (% of total revenues).
Model also includes 6 binary/dummy variables: 1) Election year (which takes the value of 1 in election year and 0 otherwise),2) Pre-election year (which takes the value of 1 in pre-election year and 0
otherwise),3) Post-election year (which takes the value of 1 in post-election year and 0
otherwise),4) Partisan compatibility between national and local incumbents /IDEO/
(which takes the value of 1 if national and local incumbent share the same party membership and 0 otherwise),
5) Margin (which takes the value of 1 if the percentage spread of votes recei-ved by the electoral winner is less than 5% compared to the runner up and 0 otherwise),
6) Crises (which takes the value of 1 in the period 2009-2011 and 0 otherwise).
The paper shares and uses the assumption that elections take place every second year, as stated in theoretical PBC models of asymmetric information.10 The goal of the paper is to empirically test whether total expenditures and budget deficits in-crease in an election period, i.e. is there an opportunistic cycle at the municipal level in Croatia.
The dummy variable IDEO is used to test whether partisan alliances at national and local level result in an increase of total expenditures in an election period. Results are compared to Naruhiko Sakurai and Menezes-Filho (2011) who tested for a similar effect on fiscal variables in their paper.
In accordance with Brender and Drazen (2009) the paper includes following con-trol variables as an additional control of business cycle: GDP per capita and GDP gap.11 This is primarily due to the fact that the revenue side of the local budget depends on revenues from the central budget through shared taxes. As in Pette-rsson-Lidbom (2000) we also add population as a final control variable.
10 Having elections every two years follows from the assumption of incumbent’s competence, which follows the structure of the MA (1) process, meaning it lasts exactly two periods after which it needs to be signalised again.11 GDP gap was calculated in EViews 7 with Hodrick-Prescott’s filter (l=100).

velib
or m
ač
kić:
politic
al b
ud
get c
yc
les at the m
un
icipa
l level in c
ro
atiafin
an
cia
l theo
ry an
d pr
ac
tice
38 (1) 1-35 (2014)
16 5.2 methodologyAs a research method, dynamic panel data analysis is applied in economic rese-arch in which the current value of a variable, for example, total expenditure bud-get, depends on the previous values of the same variable (Baltagi, 2008:135). Since autocorrelation is not included in the static panel model assumptions, the optimal choice is a dynamic panel model. Otherwise, the estimated parameters will be consistent, but inefficient, and the standard error of the estimated parame-ters will be biased (Škrabić, 2009:28). The advantage of dynamic panel analysis is also reflected in its wider economic application. Using the dependent variable with one or more lags, regardless of whether the estimated coefficients are of di-rect interest, significantly affects the consistent assessment of other parameters in the model (Bond, 2002). A dynamic panel model, which contains a dependent variable with t − 1 lag and K independent variables xitk, k = 1, ...K, is written as:
yit = μ + γ yi,t-1 + β1xit1 + β2xit2 + βK xitK + αi + εit, i = 1, ...N, t = 1, ...T, (1)
where N denotes the number of units of observation, T the number of periods, and xitk, k = 1, ...K denotes the value of k independent variables in period t. The para-meter α is a random or fixed effect, and β1, ...βK parameters are exogenous varia-bles to be estimated in the model. It is assumed that the idiosyncratic shocks εit are IID (0, σ 2
ε).
Since the lagged dependent variable yi,t−1 is included in the model, it is correlated with the individual-specific effect α1. If the above model is estimated using least squares, OLS estimators of model parameters would be biased and inconsistent, even in the case where εit are mutually uncorrelated, random variables. Arellano and Bond (1991:277-297) propose a new GMM (generalized method of moments) estimator for dynamic panel models.12 Given this, the first difference of equation (1) can be written as follows:
yit − yi,t-1 = γ (yi,t-1 − yi,t-2 ) + β1(xit1 − xi,t-1,1 ) + β2(xit2 − xi,t-1,2 ) + βK(x itK − x i ,t -1 ,K) + (ε i t − ε i ,t -1) ; i = 1, ...N, t = 1, ...T. (2)
In order to ensure that parameter estimator of y was consistent in dynamic panel model we need to include additional instruments. The valid instruments for (y i,t−1 − yi,t−2) are lagged values of the dependent variable in level (yi1, yi2,..., y i,t−2). Through the introduction of additional instruments for the independent variables, the GMM procedure solves the problem of endogenous variables and reverse cau-sality. Valid instruments for values of independent variables in first differences (x i,t−1 ,k − xi,t−2,k), k = 1, 2, ..., K are lagged values of independent variables in level (xi1k, xi2k,..., x i,t−2,k), k = 1, 2, ..., K.
12 Arrelano-Bond estimator is optimal in the analysis of panel data, which are characterized by large N (num-ber of units of observation) and small T (number of periods), as is the case in this paper.
velib
or m
ač
kić:
politic
al b
ud
get c
yc
les at the m
un
icipa
l level in c
ro
atiafin
an
cia
l theo
ry an
d pr
ac
tice
38 (1) 1-35 (2014)17Validity of chosen instruments for parameters estimation can be tested using the
Sargan test. If a null hypothesis is accepted by the Sargan test it means that all chosen instruments are valid, that is, the dynamic panel model is adequately spe-cified. Arellano and Bond (1991:282) developed two additional diagnostic tests for serial correlation: m1 and m2. The second-order autocorrelation in the differen-ced residuals would imply that the estimates are inconsistent.
The advantage of using a two-step GMM estimator is because a one-step estima-tion assumes the error terms to be independent and homoscedastic across coun-tries and over time. A two-step estimator relaxes the assumption of independence and homoscedasticity by using the residuals obtained from the first step estimation to construct a consistent estimate of the variance-covariance matrix. Thus, when the error term εit is heteroscedastic the two step estimator is more efficient (Višić and Škrabić Perić, 2011:178).
When interpreting the model, special attention was given to the dummy variables and their estimated parameters β1, ...βK . In the first step, we are interested in whe-ther they are statistically significant and at what levels of significance. In the se-cond step, we are interested in the sign of their coefficient, i.e. whether the sign corresponds to the theoretical predictions stated in PBC models.
5.3 empirical resultsThe dynamic panel model used in the paper is written as follows:
BVit = α + γBVi,t-1 + β1GDP_PCit + β2GDP_GAPit + β3TOT_POPit + β4 IDEOit + β5 ELE_YEARit + β5CRISESit + β5 MARGINit + εit , (3)
where BVit represents one out of nine budget variables and BVi,t−1 the value of the dependent variable in the previous period. Control variables are: GDP_PCit, GDP_GAPit and TOT_POPit, while the dummy variables IDEOit and ELE_YEARit are used in order to test the existence of ideological alliances and opportunistic cycles, respectively. In the sub-samples that examine local and parliamentary elections separately, the model was expanded by two additional dummy variables: ELE_YEAR (−1)it and ELE_YEAR (+1)it. The former represent the pre-election and latter the post-election year. Finally, the model also includes two dummy va-riables: CRISESit and MARGINit .
Nine different models are estimated in the paper using a two-step GMM Arellano Bond estimator. All calculations were made in the statistical program Stata/SE 11.
Appendix contains descriptive analysis together with the correlation matrix. At a 5% significance level we see that the independent variables are not strongly cor-related, which indicates that in the estimated models there are no problems of multicollinearity. Estimated models that test the existence of PBC are shown in tables 3-5.

velib
or m
ač
kić:
politic
al b
ud
get c
yc
les at the m
un
icipa
l level in c
ro
atiafin
an
cia
l theo
ry an
d pr
ac
tice
38 (1) 1-35 (2014)
18
ta
bl
e 3
The
resu
lts o
f dyn
amic
pan
el d
ata
anal
ysis
: joi
nt p
arlia
men
tary
and
loca
l ele
ctio
nsbu
dget
balan
ce
(sal
)to
tal e
xpen
di
ture
s (UR
)cu
rren
t exp
endi
tu
res (
tc)
othe
r exp
endi
tu
res (
tc_o
st)
capi
tal e
xpen
di
ture
s (Rn
fI)
aver
age n
umbe
r of
empl
oyee
s in
local
bure
auc
racy
(ZPt
)
aver
age n
umbe
r of
empl
oyee
s in
budg
etary
use
rs
(ZPK
)
Pers
onne
l exp
ens
es fo
r loc
al bu
reau
crac
y (R
Zt)
Pers
onne
l exp
ens
es fo
r bud
ge
tary
use
rs (R
ZK)
Depe
nden
t var
iable
-.035
1355
(.112
3043
).17
3179
***
(.102
6024
)
-.318
688*
(.1
0884
77)
.07
0494
9**
(.0
3555
32)
.2981
087*
(.0
8213
92)
-.1
4702
91*
(.02
4279
9)
-.293
5822
*
(.074
7549
)
.2167
674*
(.
0240
5).03
8130
3
(.064
8817
)
GDP
gap
2.29e
-09*
(4.57
e-10
)
-3.29
e-09
*(6
.22e-
10)
7.63e
-10*
**
(4.10
e-10
)
-5.18
e-10
*
(1.98
e-10
)-2
.26e-
09*
(4
.80e-
10)
-6
.20e-
11*
(2
.71e-
12)
-1
.63e-
10*
(6
.25e-
12)
6.02e
-11
(8.06
e-11
)3.5
8e-1
0**
(1.1
3e-1
0)
GDP
pc4.5
2e-0
6*(1
.20e-
06)
-7
.46e-
06*
(1
.54e-
06)
-2
.08e-
06**
(8
.08e-
07)
-3
.37e-
07(4
.23e-
07)
-4.83
e-06
*
(9.60
e-07
)
-9.60
e-08
*
(4.06
e-09
)
-2.39
e-07
*
(1.60
e-08
)
-1.11
e-07
(2.23
e-07
)-4
.53e-
08(1
.91e-
07)
Total
popu
lation
5.02e
-06
(3.90
e-06
)
-1.00
e-05
**
(4.00
e-06
)
4.40e
-07
(2.22
e-06
)
3.23e
-06*
**
(1.89
e-06
)-.0
0001
02*
(3
.23e-
06)
1.3
4e-0
7*
(2.82
e-08
)
5.88e
-07*
(1
.28e-
07)
-3
.03e-
07(3
.71e-
07)
-8.11
e-07
(1.23
e-06
)
IDEO
.0198
274
(.012
8713
)
-.046
0624
*
(.008
964)
.00
4086
6 (.0
0688
72)
.01
1417
9**
(.0
0493
5)-.0
2537
55**
(.0
0985
97)
-8
.69e-
06
(.000
0835
)
-.000
1955
(.0
0018
03)
-.0
0044
34
(.003
0327
)-.0
0557
63
(.006
2833
)
Elec
tion y
ear
.0186
727*
(.005
4602
)
-.027
8911
*
(.007
9538
)
-.009
3125
(.0
0581
73)
.00
9368
6*
(.002
925)
-.013
6125
***
(.0
0779
23)
-.0
0053
39*
(.0
0002
7)
-.001
467*
(.0
0010
72)
.00
2796
8*
(.000
9586
)-.0
0564
05*
(.00
0775
6)
Crise
s-.0
8543
14*
(.013
2365
)
.1004
19*
(.0
1558
93)
.08
4641
5*
(.012
8869
)
.0011
065
(.0
0612
55)
.0026
573
(.0
1667
41)
0017
613*
(.0
0007
67)
.00
3929
3*
(.000
1801
)
.0117
726*
(.0
0309
27)
.0190
663*
(.0
0369
76)
Mar
gin.00
0816
4(.0
1153
89)
.01
3841
5
(.016
5515
)
-.015
4585
***
(.0
0930
59)
-.0
0255
66
(.004
2739
).03
0774
1**
(.0
1492
6)
.00
0306
7*
(.000
0482
)
.0006
735*
(.0
0024
58)
-.0
0389
08
(.002
5652
)-.0
0612
44**
(.0
0270
36)
_con
s-.7
2116
76**
(.322
9327
)
2.338
167*
(.3
2424
69)
1.0
6052
3*
(.279
5429
)
-.152
4102
(.1
7051
97)
1.672
986*
(.2
8246
86)
-.0
0293
56
(.003
0242
)
-.035
4755
**
(.015
0286
)
.0858
89**
(.0
4112
93)
.2049
066
(.1
2810
29)
N16
816
816
816
816
816
816
816
816
8Sa
rgan
test
(p-v
alue)
0.999
61.0
000
0.999
50.9
998
0.999
70.9
955
0.990
40.9
988
1.000
0AR
(1) t
est
0.015
40.0
060
0.125
60.0
403
0.005
50.0
001
0.008
90.0
387
0.243
8AR
(2) t
est
0.807
00.8
419
0.100
00.0
988
0.344
60.7
807
0.069
40.5
722
0.439
6
Not
e: *
, **,
***
den
otes
stat
istic
al si
gnifi
canc
e at
the
leve
l of 1
%, 5
% a
nd 1
0%. S
tand
ard
erro
rs in
par
enth
eses
.
Sour
ce: C
alcu
late
d by
aut
hor.

velib
or m
ač
kić:
politic
al b
ud
get c
yc
les at the m
un
icipa
l level in c
ro
atiafin
an
cia
l theo
ry an
d pr
ac
tice
38 (1) 1-35 (2014)19
ta
bl
e 3
The
resu
lts o
f dyn
amic
pan
el d
ata
anal
ysis
: joi
nt p
arlia
men
tary
and
loca
l ele
ctio
nsbu
dget
balan
ce
(sal
)to
tal e
xpen
di
ture
s (UR
)cu
rren
t exp
endi
tu
res (
tc)
othe
r exp
endi
tu
res (
tc_o
st)
capi
tal e
xpen
di
ture
s (Rn
fI)
aver
age n
umbe
r of
empl
oyee
s in
local
bure
auc
racy
(ZPt
)
aver
age n
umbe
r of
empl
oyee
s in
budg
etary
use
rs
(ZPK
)
Pers
onne
l exp
ens
es fo
r loc
al bu
reau
crac
y (R
Zt)
Pers
onne
l exp
ens
es fo
r bud
ge
tary
use
rs (R
ZK)
Depe
nden
t var
iable
-.035
1355
(.112
3043
).17
3179
***
(.102
6024
)
-.318
688*
(.1
0884
77)
.07
0494
9**
(.0
3555
32)
.2981
087*
(.0
8213
92)
-.1
4702
91*
(.02
4279
9)
-.293
5822
*
(.074
7549
)
.2167
674*
(.
0240
5).03
8130
3
(.064
8817
)
GDP
gap
2.29e
-09*
(4.57
e-10
)
-3.29
e-09
*(6
.22e-
10)
7.63e
-10*
**
(4.10
e-10
)
-5.18
e-10
*
(1.98
e-10
)-2
.26e-
09*
(4
.80e-
10)
-6
.20e-
11*
(2
.71e-
12)
-1
.63e-
10*
(6
.25e-
12)
6.02e
-11
(8.06
e-11
)3.5
8e-1
0**
(1.1
3e-1
0)
GDP
pc4.5
2e-0
6*(1
.20e-
06)
-7
.46e-
06*
(1
.54e-
06)
-2
.08e-
06**
(8
.08e-
07)
-3
.37e-
07(4
.23e-
07)
-4.83
e-06
*
(9.60
e-07
)
-9.60
e-08
*
(4.06
e-09
)
-2.39
e-07
*
(1.60
e-08
)
-1.11
e-07
(2.23
e-07
)-4
.53e-
08(1
.91e-
07)
Total
popu
lation
5.02e
-06
(3.90
e-06
)
-1.00
e-05
**
(4.00
e-06
)
4.40e
-07
(2.22
e-06
)
3.23e
-06*
**
(1.89
e-06
)-.0
0001
02*
(3
.23e-
06)
1.3
4e-0
7*
(2.82
e-08
)
5.88e
-07*
(1
.28e-
07)
-3
.03e-
07(3
.71e-
07)
-8.11
e-07
(1.23
e-06
)
IDEO
.0198
274
(.012
8713
)
-.046
0624
*
(.008
964)
.00
4086
6 (.0
0688
72)
.01
1417
9**
(.0
0493
5)-.0
2537
55**
(.0
0985
97)
-8
.69e-
06
(.000
0835
)
-.000
1955
(.0
0018
03)
-.0
0044
34
(.003
0327
)-.0
0557
63
(.006
2833
)
Elec
tion y
ear
.0186
727*
(.005
4602
)
-.027
8911
*
(.007
9538
)
-.009
3125
(.0
0581
73)
.00
9368
6*
(.002
925)
-.013
6125
***
(.0
0779
23)
-.0
0053
39*
(.0
0002
7)
-.001
467*
(.0
0010
72)
.00
2796
8*
(.000
9586
)-.0
0564
05*
(.00
0775
6)
Crise
s-.0
8543
14*
(.013
2365
)
.1004
19*
(.0
1558
93)
.08
4641
5*
(.012
8869
)
.0011
065
(.0
0612
55)
.0026
573
(.0
1667
41)
0017
613*
(.0
0007
67)
.00
3929
3*
(.000
1801
)
.0117
726*
(.0
0309
27)
.0190
663*
(.0
0369
76)
Mar
gin.00
0816
4(.0
1153
89)
.01
3841
5
(.016
5515
)
-.015
4585
***
(.0
0930
59)
-.0
0255
66
(.004
2739
).03
0774
1**
(.0
1492
6)
.00
0306
7*
(.000
0482
)
.0006
735*
(.0
0024
58)
-.0
0389
08
(.002
5652
)-.0
0612
44**
(.0
0270
36)
_con
s-.7
2116
76**
(.322
9327
)
2.338
167*
(.3
2424
69)
1.0
6052
3*
(.279
5429
)
-.152
4102
(.1
7051
97)
1.672
986*
(.2
8246
86)
-.0
0293
56
(.003
0242
)
-.035
4755
**
(.015
0286
)
.0858
89**
(.0
4112
93)
.2049
066
(.1
2810
29)
N16
816
816
816
816
816
816
816
816
8Sa
rgan
test
(p-v
alue)
0.999
61.0
000
0.999
50.9
998
0.999
70.9
955
0.990
40.9
988
1.000
0AR
(1) t
est
0.015
40.0
060
0.125
60.0
403
0.005
50.0
001
0.008
90.0
387
0.243
8AR
(2) t
est
0.807
00.8
419
0.100
00.0
988
0.344
60.7
807
0.069
40.5
722
0.439
6
Not
e: *
, **,
***
den
otes
stat
istic
al si
gnifi
canc
e at
the
leve
l of 1
%, 5
% a
nd 1
0%. S
tand
ard
erro
rs in
par
enth
eses
.
Sour
ce: C
alcu
late
d by
aut
hor.
Tax autonomy of cities is enabled because the total revenues of the majority of cities refer to tax revenues which again come mostly from taxes shared with the central government.13 Papers by Bajo and Jurlina Alibegović (2008) and Rogić Lugarić (2010) also confirm this statement. Accordingly the revenue side of the budget has not been analysed and all other budgetary variables are presented as a proportion of total revenue. The other two variables, the average number of em-ployees in local bureaucracy and in budgetary users, are expressed as a percentage of total population in the city selected in the reference year.
Results presented in tables 3-5 indicate that all three diagnostic tests for the vali-dity of the estimated dynamic models are satisfied. Based on the results of Sar-gan’s test, we can conclude that the instruments used are well chosen. The basic premise of dynamic panel models and the Arellano-Bond estimator that there is no autocorrelation of error terms of the first and second row of the first differences of residuals is rejected only in the case of a second-order autocorrelation. This is the case only in the model with other expenditures and in the model with the average number of employees in budgetary users in table 3 at a 10% significance level and in the model with current expenditures and in the model with other expenditures in table 4 and table 5 at a 10% significance level.
Results of the dynamic panel analysis (table 3) indicate a rejection of the hypothe-sis of the existence of PBC in the selected sample in the observed period. In the model with budget balance and in the model with total expenditures, the dummy variable election year is statistically significant, but the coefficient has a sign which is opposite to the theoretically expected one. That is, in election years the budget balance, on average, increases by 1.9% of total revenue, while total expen-ditures, on average, decrease by 2.8% of total revenues.
Based on the obtained results, the selected Croatian cities cannot be classified into the paradigm set by the ‟old democracies”. Brender and Drazen (2004) obtained a negative coefficient for this group of countries and more importantly the coeffi-cient was statistically insignificant. In accordance with Rose (2006), the results indicate that the opportunistic manipulation of fiscal instruments is determined by the institutional context within the budgetary process takes place. Limitations on borrowing at the local level in Croatia represent a confirmation of the findings of Bajo and Jurlina Alibegović (2008) and Primorac (2011). Therefore, these results indicate that budgetary constraints regarding public debt accumulation at the local level14 actually reduce the magnitude of opportunistically motivated PBC.15 The implications of this conclusion, at the national level, could potentially result in a
13 In the selected sample the share of tax revenues in total revenues amounted up to 64-68% in the observed time period.14 Government and the Ministry of Finance restrict local government borrowing up to 2.3% of total revenues of all local units (Bajo and Jurlina Alibegović, 2008:135).15 Primorac (2011:461) states that cities can borrow through utility companies that are in their possession and thus circumvent institutional constraints specified in the Budget Law and the Law on State Budget Execution.

velib
or m
ač
kić:
politic
al b
ud
get c
yc
les at the m
un
icipa
l level in c
ro
atiafin
an
cia
l theo
ry an
d pr
ac
tice
38 (1) 1-35 (2014)
20 reduction of total expenditures in election years which is a point strongly advoca-ted by the constitutional political economy. Furthermore, Vučković (2011) finds that the only statistically significant variable with the expected theoretical sign, at the consolidated central government level, is total expenditures. This raises a number of questions connected with the conduct of economic policy within such a context, the most important being the limited use of countercyclical fiscal policy. Descriptive analysis (figure 1) shows that capital expenditures have declined since 2008 while personnel expenditures have increased or remained at the same level. In other words, fiscal policy was not used as a countercyclical instrument, rather it was a result of ‟state capture” and rent-seeking behaviour by the bureaucracy.
figure 1Budget balance, current and capital expenditures (in billion kuna)
3.5
3.0
2.5
2.0
1.5
1.0
0.5
0.0
-0.5
-1.0
2002
2003
2004
2005
2006
2007
2008
2009
2010
2011
Personnel expenditure Capital expenditure Budget balance
Source: Calculated by author.
Econometric analysis also confirms that in election years capital expenditures de-crease (on average by 1.4% of total revenues), while other expenditures (on ave-rage by 0.9% of total revenue) and personnel expenditure for local bureaucracy (on average by 0.3% of total revenues) simultaneously increase. It follows that the manipulation of the structure of total expenditures serves as the second best stra-tegy for the incumbent in election years. As in Schneider (2010) we find that in-cumbents use this fiscal strategy, the only one remaining due to institutional con-straints.
The relationship between budget balance and personnel expenditure for local bureaucracy is shown in figure 2. It indicates that personnel expenditure grew continuously until 2009, regardless of whether the budget was balanced or not. Personnel expenditures declined in 2010, but in the year of the last parliamentary elections, 2011, they again increased. Throughout this period, the budget balance of selected cities was in surplus only in 2002 and in 2007. This indicates not only the fiscal irresponsibility of the political elite at the local level, but also to political economy issues in planning and implementing budgetary policies and the appa-
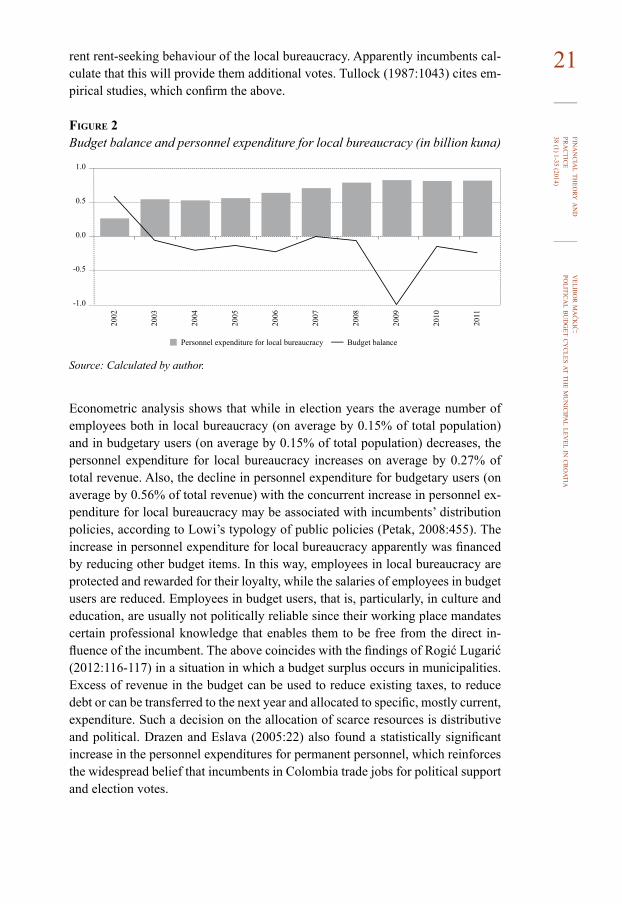
velib
or m
ač
kić:
politic
al b
ud
get c
yc
les at the m
un
icipa
l level in c
ro
atiafin
an
cia
l theo
ry an
d pr
ac
tice
38 (1) 1-35 (2014)21rent rent-seeking behaviour of the local bureaucracy. Apparently incumbents cal-
culate that this will provide them additional votes. Tullock (1987:1043) cites em-pirical studies, which confirm the above.
figure 2Budget balance and personnel expenditure for local bureaucracy (in billion kuna)
1.0
0.5
0.0
-0.5
-1.0
2002
2003
2004
2005
2006
2007
2008
2009
2010
2011
Personnel expenditure for local bureaucracy Budget balance
Source: Calculated by author.
Econometric analysis shows that while in election years the average number of employees both in local bureaucracy (on average by 0.15% of total population) and in budgetary users (on average by 0.15% of total population) decreases, the personnel expenditure for local bureaucracy increases on average by 0.27% of total revenue. Also, the decline in personnel expenditure for budgetary users (on average by 0.56% of total revenue) with the concurrent increase in personnel ex-penditure for local bureaucracy may be associated with incumbents’ distribution policies, according to Lowi’s typology of public policies (Petak, 2008:455). The increase in personnel expenditure for local bureaucracy apparently was financed by reducing other budget items. In this way, employees in local bureaucracy are protected and rewarded for their loyalty, while the salaries of employees in budget users are reduced. Employees in budget users, that is, particularly, in culture and education, are usually not politically reliable since their working place mandates certain professional knowledge that enables them to be free from the direct in-fluence of the incumbent. The above coincides with the findings of Rogić Lugarić (2012:116-117) in a situation in which a budget surplus occurs in municipalities. Excess of revenue in the budget can be used to reduce existing taxes, to reduce debt or can be transferred to the next year and allocated to specific, mostly current, expenditure. Such a decision on the allocation of scarce resources is distributive and political. Drazen and Eslava (2005:22) also found a statistically significant increase in the personnel expenditures for permanent personnel, which reinforces the widespread belief that incumbents in Colombia trade jobs for political support and election votes.

velib
or m
ač
kić:
politic
al b
ud
get c
yc
les at the m
un
icipa
l level in c
ro
atiafin
an
cia
l theo
ry an
d pr
ac
tice
38 (1) 1-35 (2014)
22 Partisan compatibility between national and local incumbents, or variable IDEO, is statistically significant only in the case of the following variables: total expen-ditures, other expenditures and capital expenditures. All three variables are stati-stically significant even when we look at particular outcomes of parliamentary and local elections. Even their signs and the estimated coefficients are equal. A nega-tive sign obtained for the variable total expenditure (a reduction, on average, by 4.6% of total revenue) and capital expenditures (a reduction, on average, by 2.53% of total revenue) points to the following two conclusions. First, the movement of these variables is the opposite of the expected theoretical direction and the results do not coincide with those of Naruhiko Sakurai and Menezes-Filho (2011) in the case of local elections in Brazil. Second, the resulting signs of coefficients are equal both for dummy variable Election year and IDEO, suggesting that partisan compatibility apparently does not play any role in the allocation/distribution of budget funds. As in Jurlina Alibegović et al. (2010) it is evident that the connec-tions between central and local government units are primarily determined thro-ugh decentralized functions and fiscal equalization model. With respect to the latter, Bajo and Bronić (2007), on a sample of 5% of cities and municipalities, and Bronić (2010), on a sample of counties, judge it inefficient, but in the identifica-tion of reasons do not find any related to party affiliation.
In order to capture the potential benefits of pre-election manipulation, in a situa-tion of uncertainty of election outcome, the model was augmented with an addi-tional dummy variable – margin. The obtained results again indicate that the in-cumbent turns to his second best strategy in that situation. Through restructuring items on the expenditure side of the budget, the incumbent, in the election year, on average, reduces current expenditures by 1.5% of total revenue and simulta-neously increases capital expenditures, on average, by 3.1% of total revenues. In other words, voters in these cities can expect an increase in capital investment, a reduction in current expenditures and no cycle in the budget balance. Khemani (2004) obtained identical results for local elections in 14 states in India. Also, the incumbent increases the average number of employees in the local bureaucracy, on average, by 0.03% of total population and the average number of employees in budgetary users, on average, by 0.06% of total population. This electoral mano-euvre is ‟paid for” by a decrease in personnel expenditures for budgetary users in the amount of, on average, 0.6% of total revenues.
The dummy variable crisis unambiguously shows that in the period 2009-11 the budget balance deteriorated, on average, by 8.54% of total revenue. Total expen-ditures in the reporting period increased, on average, by 10.04% of total revenue as a result of the increase in current expenditures, on average, by 8.46% of total revenue. Franić (2012) analysed employment at the local level in Croatia in the 2008-11 period and found that the total number of employees that received wage from local and regional government increased by 15%. This increase was evident both in the absolute and the relative increase in the proportion of total expenditure.

velib
or m
ač
kić:
politic
al b
ud
get c
yc
les at the m
un
icipa
l level in c
ro
atiafin
an
cia
l theo
ry an
d pr
ac
tice
38 (1) 1-35 (2014)23Given that during this period new units were not established, and that no signifi-
cant progress in decentralization was made, which would have required new jobs, it is evident that this was a political-economy answer to unemployment issues on the labour market. The same trend is observed in our sample of cities. The model records an increase in the average number of employees in local bureaucracy, on average, by 0.17% of total population and an increase in the average number of employees in budgetary users, on average, by 0.39 % of total population. Also, personnel expenditures for local bureaucracy, on average, increase by 1.17% of total revenues and personnel expenditures for budgetary users, on average, incre-ase by 1.9% of total revenues.
If local elections are analysed separately then the hypothesis on the existence of PBC is confirmed. As in Naruhiko Sakurai and Menezes-Filho (2011), we find that budget deficit increases, on average, by 4.45% of total revenues. The budget defi-cit is also statistically significant in the pre-election and post-election year. In pre-election year, the budget deficit increases, on average, by 4.81% of total reve-nue and in post-election year the budget deficit increases, on average, by 2.36% of total revenue. Rašić Bakarić et al. (2013), on a sample of 127 cities, and Bratić (2008), in an analysis of the decision-making processes on local budgets in Croa-tia, conclude that political commitment does not affect the movement of budge-tary variables. In other words, all politicians opportunistically manipulate budget items in order to ensure re-election.
In the model with total expenditures, there is a statistically significant increase in the pre-election (on average by 3.41% of total revenues) and the post-election year (on average by 2.06% of total revenues). In the composition of total expenditures, for all three selected periods, only other expenditures are statistically significant, decreasing, on average, by 1.65% of total revenues in the pre-election year.
Also, in each of the selected periods there is a statistically significant increase in variables that measure average numbers of employees in a local bureaucracy and in budgetary users with the most significant coefficients in a post-election year (0.105% and 0.296% of total population, respectively). In a situation in which the outcome of the elections is unclear, the dummy variable margin in the election year also confirms a statistically significant and positive coefficient of the mentio-ned variables (0.034% and 0.052% of total revenues, respectively). The above mentioned phenomenon points to the incumbents’ motivation, which is for the incumbent to ensure political support in local elections by providing jobs to the electorate. Since the turnout in local elections is much lower than the turnout in the parliamentary elections (SEC, 2013) the marginal benefits of such a mano-euvre are much larger.

velib
or m
ač
kić:
politic
al b
ud
get c
yc
les at the m
un
icipa
l level in c
ro
atiafin
an
cia
l theo
ry an
d pr
ac
tice
38 (1) 1-35 (2014)
24
ta
bl
e 4
The
resu
lts o
f dyn
amic
pan
el d
ata
anal
ysis
: loc
al e
lect
ions
budg
et ba
lance
(s
al)
tota
l exp
endi
tu
res (
UR)
curr
ent e
xpen
di
ture
s (tc
)ot
her e
xpen
di
ture
s (tc
_ost
)ca
pita
l exp
endi
tu
res (
RnfI
)av
erag
e num
ber
of em
ploy
ees i
n loc
al bu
rea
ucra
cy (Z
Pt)
aver
age n
umbe
r of
empl
oyee
s in
budg
etary
use
rs
(ZPK
)
Pers
onne
l exp
ens
es fo
r loc
al bu
reau
crac
y (R
Zt)
Pers
onne
l exp
ens
es fo
r bud
ge
tary
use
rs (R
ZK)
Depe
nden
t var
iable
-.173
4933
**
(.086
6908
)
-.031
8814
(.0
9950
42)
-.4
0845
1*
(.15
1990
3)
.1589
668*
*
(.075
9598
).28
8284
4**
(.13
4716
1)
.13
2664
7*
(.050
3974
)
-.121
2022
(.1
3361
6)
.1608
494*
(.0
2300
38)
.1414
747*
*
(.055
9279
)
GDP
gap
1.44e
-09*
(4
.44e-
10)
-2
.07e-
09*
(6
.33e-
10)
1.22e
-09*
(4
.43e-
10)
-7
.42e-
10*
(2
.56e-
10)
-2.36
e-09
*
(4.79
e-10
)
-5.92
e-11
* (2
.51e-
12)
-1
.52e-
10*
(8.48
e-12
) -1
.56e-
11
(1.02
e-10
)3.8
7e-1
0**
(1.56
e-10
)
GDP
pc4.4
9e-0
6*
(1.01
e-06
)
-5.62
e-06
* (1
.43e-
06)
-1
.35e-
06**
(5
.37e-
07)
-1
.62e-
07
(6.37
e-07
)-4
.72e-
06*
(9
.39e-
07)
-8
.12e-
08*
(4
.35e-
09)
-2
.08e-
07*
(2
.04e-
08)
-4
.04e-
07
(2.81
e-07
)-9
.91e-
08
(3.32
e-07
)
Total
popu
lation
6.28e
-06
(3.94
e-06
)
-8.17
e-06
**
(3.88
e-06
)
5.15e
-07
(2.65
e-06
)
1.33e
-06
(2
.31e-
06)
-8.93
e-06
*
(3.04
e-06
)
7.32e
-08*
*
(4.19
e-08
)
3.34e
-07*
**
(1.84
e-07
)
3.81e
-07
(6
.64e-
07)
5.92e
-07
(1
.42e-
06)
IDEO
.0116
954
(.0
0973
28)
-.0
2138
06**
(.0
0993
05)
.01
1176
6
(.009
4053
)
.0110
828*
*(.0
0559
44)
-.025
8052
**
(.01
2086
5)
-.000
0987
*
(.000
0482
)
-.000
2981
*
(.000
1134
)
.0006
123
(.0
0603
45)
-.008
577
(.0
0787
3)
Elec
tion y
ear
-.044
5553
* (.0
1244
94)
.02
1568
(.
0148
752)
.00
7580
1
(.005
9256
)
.0028
12
(.002
7731
)-.0
0126
91
(.01
5277
7)
.0005
471*
(.0
0004
61)
.00
1566
1*
(.00
0105
4)
-.006
5418
* (.0
0115
63)
.0019
676
(.002
9124
)Pr
e-elec
tion y
ear
(-1)
-.048
1236
* (.
0098
106)
.0341
971*
(.0
1174
83)
.0052
825
(.0
1025
31)
-.016
565*
(.0
0537
45)
.0125
16
(.01
2113
9).00
0409
8*
(.000
0563
).00
0839
1*
(.000
168)
-.004
0639
**
(.001
831)
.0107
797*
(.0
0284
54)
Post-
electi
on ye
ar
(+1)
-.023
6024
** (.
0110
145)
.0206
571*
* (.
0089
672)
.0150
651
(.0
0842
86)
-.003
2058
(.0
0449
25)
.0080
385
(.0
1339
5).00
1055
9*
(.000
0577
).00
2968
9*
(.000
1996
)-.0
0660
08*
(.0
0086
26)
.0007
081
(.00
2372
4)
Crise
s-.0
5472
07*
(.01
4053
5)
.0750
296*
(.0
1703
65)
.06
6768
3*
(.013
9985
)
.0050
259
(.0
0812
44)
.0075
472
(.0
1866
99)
.0011
67*
(.0
0008
19)
.00
2556
8*
(.000
2581
)
.0162
795*
(.0
0354
66)
.0182
82*
(.006
2298
)
Mar
gin.00
5664
(.
0134
177)
-.011
6937
(.
0139
365)
-.012
8702
(.0
1130
66)
-.0
0397
85
(.00
5180
2).02
5805
(.0
1838
04)
.00
0347
7*
(.000
0705
)
.0005
276*
**
(.00
0294
)
-.004
9563
**
(.002
3088
)-.0
1152
83**
(.0
0457
06)
_con
s-.9
6346
6*
(.30
0485
2)
2.284
333*
(.3
0595
2)
1.0
9851
6*
(.295
0632
)
.0027
445
(.2
2411
1)1.5
9995
5*
(.306
9513
)
-.001
1136
(.0
0365
1)
-.010
6099
(.0
2734
51)
.04
637
(.0
7539
64)
.0522
293
(.1
3734
)

velib
or m
ač
kić:
politic
al b
ud
get c
yc
les at the m
un
icipa
l level in c
ro
atiafin
an
cia
l theo
ry an
d pr
ac
tice
38 (1) 1-35 (2014)25
budg
et ba
lance
(s
al)
tota
l exp
endi
tu
res (
UR)
curr
ent e
xpen
di
ture
s (tc
)ot
her e
xpen
di
ture
s (tc
_ost
)ca
pita
l exp
endi
tu
res (
RnfI
)av
erag
e num
ber
of em
ploy
ees i
n loc
al bu
rea
ucra
cy (Z
Pt)
aver
age n
umbe
r of
empl
oyee
s in
budg
etary
use
rs
(ZPK
)
Pers
onne
l exp
ens
es fo
r loc
al bu
reau
crac
y (R
Zt)
Pers
onne
l exp
ens
es fo
r bud
ge
tary
use
rs (R
ZK)
N16
816
816
816
816
816
816
816
816
8Sa
rgan
test
(p-v
alue)
0.999
91.0
000
1.000
01.0
000
0.999
40.9
883
0.993
30.9
995
1.000
0AR
(1) t
est
0.013
9 0.0
140
0.384
40.0
280
0.011
30.0
003
0.002
60.0
363
0.047
5AR
(2) t
est
0.678
50.9
105
0.086
10.0
609
0.438
50.6
835
0.130
00.5
006
0.792
7
Not
e: *
, **,
***
den
otes
stat
istic
al si
gnifi
canc
e at
the
leve
l of 1
%, 5
% a
nd 1
0%. S
tand
ard
erro
rs in
par
enth
eses
.
Sour
ce: C
alcu
late
d by
aut
hor.

velib
or m
ač
kić:
politic
al b
ud
get c
yc
les at the m
un
icipa
l level in c
ro
atiafin
an
cia
l theo
ry an
d pr
ac
tice
38 (1) 1-35 (2014)
26
ta
bl
e 5
The
resu
lts o
f dyn
amic
pan
el d
ata
anal
ysis
: par
liam
enta
ry e
lect
ions
budg
et ba
lance
(s
al)
tota
l exp
endi
tu
res (
UR)
curr
ent e
xpen
di
ture
s (tc
)ot
her e
xpen
di
ture
s (tc
_ost
)ca
pita
l exp
endi
tu
res (
RnfI
)av
erag
e num
ber
of em
ploy
ees i
n loc
al bu
rea
ucra
cy (Z
Pt)
aver
age n
umbe
r of
empl
oyee
s in
budg
etary
use
rs
(ZPK
)
Pers
onne
l exp
ens
es fo
r loc
al bu
reau
crac
y (R
Zt)
Pers
onne
l exp
ens
es fo
r bud
ge
tary
use
rs (R
ZK)
Depe
nden
t var
iable
-.173
4933
** (
.0866
908)
-.031
8814
(.0
9950
42)
-.408
451*
(.1
5199
03)
.1589
668*
*
(.075
9598
).28
8284
4**
(.1
3471
61)
.1326
647*
(.0
5039
74)
-.121
2022
(.1
3361
6).16
0849
4*
(.0
2300
38)
.1414
747*
* (.0
5592
79)
GDP
gap
1.44e
-09*
(4
.44e-
10)
-2.07
e-09
*
(6.33
e-10
)1.2
2e-0
9*
(4.43
e-10
)-7
.42e-
10*
(2
.56e-
10)
-2.36
e-09
*
(4.79
e-10
)-5
.92e-
11*
(2
.51e-
12)
-1.52
e-10
*
(8.48
e-12
)-1
.56e-
11
(1.02
e-10
)3.8
7e-1
0**
(1
.56e-
10)
GDP
pc4.4
9e-0
6*
(1.01
e-06
)-5
.62e-
06*
(1
.43e-
06)
-1.35
e-06
**
(5.37
e-07
)-1
.62e-
07
(6.37
e-07
)-4
.72e-
06*
(9
.39e-
07)
-8.12
e-08
*
(4.35
e-09
)-2
.08e-
07*
(2
.04e-
08)
-4.04
e-07
(2
.81e-
07)
-9.91
e-08
(3
.32e-
07)
Total
popu
lation
6.28e
-06
(3
.94e-
06)
-8.17
e-06
**
(3.88
e-06
)5.1
5e-0
7
(2.65
e-06
)1.3
3e-0
6
(2.31
e-06
)-8
.93e-
06*
(3
.04e-
06)
7.32e
-08*
**
(4.19
e-08
)3.3
4e-0
7***
(1
.84e-
07)
3.81e
-07
(6
.64e-
07)
5.92e
-07
(1
.42e-
06)
IDEO
.0116
954
(.0
0973
28)
-.021
3806
**
(.009
9305
).01
1176
6
(.009
4053
).01
1082
8**
(.0
0559
44)
-.025
8052
**
(.012
0865
)-.0
0009
87**
(.0
0004
82)
-.000
2981
*
(.000
1134
).00
0612
3
(.006
0345
)-.0
0857
7
(.007
873)
Elec
tion y
ear
.0445
553*
(.0
1244
94)
-.021
568
(.0
1487
52)
-.007
5801
(.0
0592
56)
-.002
812
(.0
0277
31)
.0012
691
(.0
1527
77)
-.000
5471
*
(.000
0461
)-.0
0156
61*
(.0
0010
54)
.0065
418*
(.0
0115
63)
-.001
9676
(.0
0291
24)
Pre-e
lectio
n yea
r (-1
).02
0952
9**
(.009
9074
)-.0
0091
08(.0
1211
03)
.0074
85(.0
0928
9)-.0
0601
79(.0
0457
41)
.0093
077
(.010
3009
).00
0508
8*(.0
0002
62)
.0014
028*
(.000
1245
)-.0
0005
89(.0
0108
96)
-.001
2595
(.001
8583
)Po
st-ele
ction
year
(+
1)-.0
0356
83(.0
1264
67)
.0126
291
(.014
3909
)-.0
0229
76(.0
0993
55)
-.019
377*
(.004
7772
).01
3785
1(.0
1213
86)
-.000
1373
*(.0
0003
55)
-.000
7269
*(.0
0011
82)
.0024
779
(.001
6217
).00
8812
1*(.0
0328
07)
Crise
s-.0
5472
07*
(.01
4053
5).07
5029
6*
(.017
0365
).06
6768
3*
(.013
9985
).00
5025
9
(.008
1244
).00
7547
2
(.018
6699
).00
1167
*
(.000
0819
).00
2556
8*
(.000
2581
).01
6279
5*
(.003
5466
).01
8282
*
(.006
2298
)
Mar
gin.00
5664
(.0
1341
77)
-.011
6937
(.0
1393
65)
-.012
8702
(.0
1130
66)
-.003
9785
(.0
0518
02)
.0258
05
(.018
3804
).00
0347
7*
(.000
0705
).00
0527
6***
(.0
0029
4)-.0
0495
63**
(.0
0230
88)
-.011
5283
***
(.0
0457
06)
_con
s-1
.0080
21*
(.301
3278
)2.3
0590
1*
(.305
6829
)1.1
0609
6*
(.294
6027
).00
5556
6
(.224
8378
)1.5
9868
6*
(.3
0607
91)
-.000
5666
(.0
0366
33)
-.009
0438
(.0
2738
11)
.0398
282
(.0
7541
64)
.0541
969
(.1
3911
31)

velib
or m
ač
kić:
politic
al b
ud
get c
yc
les at the m
un
icipa
l level in c
ro
atiafin
an
cia
l theo
ry an
d pr
ac
tice
38 (1) 1-35 (2014)27
budg
et ba
lance
(s
al)
tota
l exp
endi
tu
res (
UR)
curr
ent e
xpen
di
ture
s (tc
)ot
her e
xpen
di
ture
s (tc
_ost
)ca
pita
l exp
endi
tu
res (
RnfI
)av
erag
e num
ber
of em
ploy
ees i
n loc
al bu
rea
ucra
cy (Z
Pt)
aver
age n
umbe
r of
empl
oyee
s in
budg
etary
use
rs
(ZPK
)
Pers
onne
l exp
ens
es fo
r loc
al bu
reau
crac
y (R
Zt)
Pers
onne
l exp
ens
es fo
r bud
ge
tary
use
rs (R
ZK)
N16
816
816
816
816
816
816
816
816
8Sa
rgan
test
(p-v
alue)
0.999
91.0
000
1.000
01.0
000
0.999
40.9
883
0.993
30.9
995
1.000
0AR
(1) t
est
0.013
90.0
140
0.384
40.0
280
0.011
30.0
003
0.002
60.0
363
0.047
5AR
(2) t
est
0.678
50.9
105
0.086
10.0
609
0.438
50.6
835
0.130
00.5
006
0.792
7
Not
e: *
, **,
***
den
otes
stat
istic
al si
gnifi
canc
e at
the
leve
l of 1
%, 5
% a
nd 1
0%. S
tand
ard
erro
rs in
par
enth
eses
.
Sour
ce: C
alcu
late
d by
aut
hor.

velib
or m
ač
kić:
politic
al b
ud
get c
yc
les at the m
un
icipa
l level in c
ro
atiafin
an
cia
l theo
ry an
d pr
ac
tice
38 (1) 1-35 (2014)
28 The dummy variable margin indicates a decrease of personnel expenditures for local bureaucracy (on average, by 0.49% of total revenues) and for budgetary users (on average, by 1.15% of total revenues). At the same time, personnel ex-penditures for a local bureaucracy, on average, decreases in each of the three pe-riods, with the most significant coefficient in the post-election year (on average, by 0.66% of total revenues). On the other hand, personnel expenditures for bud-getary users, in a pre-election year, showed a statistically significant increase, on average, by 1.07% of total revenues. Having all that in mind, one can conclude that in the case of local elections too there is a certain amount of restructuring among expenditure items in order to finance the increased number of personnel. The increase in ‟visible” expenditures (the average number of employees and personnel expenditures) in combination with an increase in the budget deficit re-fers to the theoretical assumptions of Rogoff’s PBC model.
Given the budget constraints that apply to the local level, incumbents are aware that the budget deficit created may be minimal as confirmed by the items that change in the election years (the average number of employees and personnel expenditures for the local bureaucracy). Thus, the legislator took a ‟weapon” from the incumbents’ hands at the local level, but did not manage to diminish their mo-tives and their tendency to opportunistic behaviour. Furthermore, the existence of budget constraints for borrowing de facto abolishes the distinction between com-petent and incompetent incumbent. In the selected period, the average value of the budgetary balance (appendix, print out A1) indicates an average deficit in the observed time period, meaning that all incumbents take their toll in creating a deficit. The only question is how the incumbents restructure expenditure items and guess the preferences of the electorate.
Identical variables are statistically significant for the dummy variable crisis (SAL, UR, TC, ZPT, ZPK, RZT and RZK), as they were in the joint analysis of local and parliamentary elections. All estimated coefficients are positive and lower than those estimated for the joint analysis, except for the coefficient related to perso-nnel expenditures for local bureaucracy, which, on average, increases by 1.62% of total revenue. In addition, estimated coefficients have the same sign and size in both local and parliamentary elections.
The variables SAL, ZPT, ZPK and RZT are statistically significant in the analysis of parliamentary elections, but they have opposite signs of the estimated coeffi-cients in relation to the analysis of local elections. That is, budget deficit decrea-ses, on average, by 4.45% of total revenue as well as the average number of em-ployees in local bureaucracy (by 0.05% of the total population on average) and in budgetary users (by 0.15 % of the total population on average). The last two re-sults are equivalent to those obtained in the joint sample, while the personnel expenditure for local bureaucracy in the election year increases, on average, by 0.65 % of total revenue. In a pre-election year, the average number of employees

velib
or m
ač
kić:
politic
al b
ud
get c
yc
les at the m
un
icipa
l level in c
ro
atiafin
an
cia
l theo
ry an
d pr
ac
tice
38 (1) 1-35 (2014)29in the local bureaucracy and in budgetary users increases, while the budgetary
deficit decreases. A post-election year records a statistically significant decrease in other expenditures and in the average number of employees in the local bureau-cracy and budgetary users, with a simultaneous increase in personnel expenses for budgetary users. The signs and estimated coefficients on the dummy variables margin and crisis have exactly the same sign and size in both local and parliamen-tary elections.
6 conclusionFrom the viewpoint of political economy, analysis of the informational, technical and political constraints faced by incumbents and by other participants in PCT is becoming increasingly relevant in an environment characterized by fiscal consoli-dation. In accordance with Aristotle’s notion that man is ‟a political animal”, ev ery individual, directly or indirectly, creates an environment in which market and non-market activities take place. Therefore, any analysis of non-market deci-sion making processes (such as decisions in the budget process) that ignores poli-tical constraints is incomplete and inadequate.
This paper investigates the relationship between PBC theory and its empirical implications on a sample of Croatian cities. The fiscal strategies of incumbents seeking re-election within the institutional constraints placed at the local level have also been analysed. The correlation between budget items in selected Croa-tian cities (19 county centres, the City of Zagreb and Pula) with the election re-sults in the period 2003-11 has been empirically tested. Dynamic panel models have been estimated using the Arellano and Bond two-step GMM estimator. The paper presents not only the empirical part but also various theoretical models of PBC as well as a review of empirical research on the existence of PBC in develo-ped, transition and developing countries. A total of 27 econometric models in th-ree different samples have been estimated. The first nine models were related to the joint analysis of the impact of local and parliamentary elections on budgetary variables in a selected sample of cities; the following nine on impacts of local elections and the last nine on impacts of the parliamentary elections.
The results of dynamic panel analysis on the joint sample indicate a rejection of the hypothesis that opportunistic PBCs exist at the level of the observed Croatian cities. In election years, the budget deficit and total expenditures decrease as op-posed to the theoretical assumptions of the model. Due to the institutional con-straints on local level public borrowing incumbents manipulate the structure of total expenditure in order to maximize re-election. The results indicate that budget constraints on public borrowing result in a decrease of opportunistically motiva-ted PBCs. This has important repercussions when applied to the level of consoli-dated central government and consolidated general government.

velib
or m
ač
kić:
politic
al b
ud
get c
yc
les at the m
un
icipa
l level in c
ro
atiafin
an
cia
l theo
ry an
d pr
ac
tice
38 (1) 1-35 (2014)
30 An increase in current expenditures (personnel expenditure for local bureaucracy and other expenditures) and a decrease in capital expenditures represents a second best strategy for incumbents. This underscores the rent-seeking role of the bureau-cracy in the electoral process, which is consistent with Niskanen’s assumptions on the maximization of the bureaucrats’ budget. At the same time this represents a rational decision on behalf of incumbents, who count on a turnout of public ser-vants in the elections that is high compared to the rest of electorate. In a situation in which the outcome of the election is uncertain, the estimated models suggest that incumbents increase the average number of employees in local bureaucracy and in budgetary users. In addition to that, there is an increase in capital expendi-tures with a simultaneous reduction of current expenditures.
In the sample of parliamentary elections, the results of the analysis do not differ significantly from those obtained from the joint sample. The budget deficit redu-ces in election years, while total expenditures are not statistically significant at standard levels of significance. Incumbents’ strategy in election years is marked by an increase in the average number of employees in local bureaucracy and in budgetary users, combined with a reduction in personnel expenditures.
Confirmation of the hypothesis of the existence of opportunistic PBC’s at the level of observed Croatian cities was found in a sample analysing only local elections. Estimated coefficients in models with budget balance, average number of emplo-yees in local bureaucracy and an average number of employees in budgetary users are statistically significant and in line with the theoretical predictions of Rogoff’s PBC model presented in chapter 3.
The results of the dynamic panel analysis in none of the three samples confirm the additional hypothesis that an increase of public expenditure follows when the in-cumbents at the central and local level share the same party membership. Given that the central and local levels are connected via financing of the decentralized functions and through the fiscal equalization model, incumbents at the central le-vel do not have any additional space for discretion in the election cycle.
The limitation of this study stems from the relatively short time series. Further-more, a more complete analysis of the opportunistic motives of incumbents at the local level should include utility companies owned by local units and their respective budget. It is through utility companies and their excessive short-term borrowing that the municipalities are able to circumvent budget constraints on public borrowing. The latter also represents a direction for future research. Also, according to the theoretical foundations of the model of an incumbent’s asymme-tric preferences and the extreme fiscal centralization in Croatia, it would be inte-resting to analyse the impact of spending from the central government budget targeted to specific social groups and/or geographical areas, and the results of elections at local and regional levels.

velib
or m
ač
kić:
politic
al b
ud
get c
yc
les at the m
un
icipa
l level in c
ro
atiafin
an
cia
l theo
ry an
d pr
ac
tice
38 (1) 1-35 (2014)31appendix
print out a1Descriptive analysis
. summarize bdp_jaz bdp_pc br_stan rnfi rzk rzt sal tc tc_ost ur zpk zpt
Variable | Obs Mean Std. Dev. Min Max----------------+------------------------------------------------------------------------------------- bdp_jaz | 210 5.80e-06 1.48e+07 -3.05e+07 2.07e+07 bdp_pc | 210 55889.54 19930.38 27905.64 138195 br_stan | 210 91873.93 160860.7 11832 793616 rnfi | 210 .2295255 .1035899 .0362604 .677106 rzk | 210 .1434883 .048639 0 .2378531----------------+------------------------------------------------------------------------------------- rzt | 210 .0787342 .0377541 0 .2968779 sal | 210 -.0153087 .0838408 -.2339418 .2229724 tc | 210 .7857832 .0865491 .4152943 .9790033 tc_ost | 210 .1535218 .0713549 .0187538 .5186317 ur | 210 1.015309 .0838408 .7770276 1.233942----------------+------------------------------------------------------------------------------------- zpk | 210 .0056085 .003115 0 .0149832 zpt | 210 .001921 .001066 0 .0066568
Source: Calculated by author.
print out a2Correlation matrix (on 5% significance level)
. pwcorr bdp_jaz bdp_pc br_stan ideo izb_god izb_god__1_ izb_god__1_01 kriza margina rnfi rzk rzt sal tc tc_ost ur zpk zpt, star(5)
| bdp_jaz bdp_pc br_stan ideo izb_god izb_g~1_ izb_g~01-----------------+------------------------------------------------------------------------------------------ bdp_jaz | 1.0000 bdp_pc | -0.1743 * 1.0000 br_stan | -0.0007 0.6933 * 1.0000 ideo | -0.0907 -0.2661 * -0.1590 * 1.0000 izb_god | 0.1218 0.0121 -0.0012 0.0042 1.0000 izb_god__1_ | 0.2694 * -0.0904 0.0006 0.0042 -0.4286 * 1.0000 izb_god__~01 | -0.4331 * 0.0477 0.0006 0.0190 -0.3273 * -0.3273 * 1.0000 kriza | 0.4836 * 0.2090 * -0.0031 -0.1621 * 0.0476 0.0476 -0.3273 * margina | -0.1873 * 0.0037 -0.0450 0.0942 0.2124 * -0.2124 * -0.1217 rnfi | -0.3095 * -0.0062 -0.0415 0.0986 -0.0858 -0.1245 0.2160 * rzk | 0.0874 0.1149 -0.0856 -0.0843 0.0257 -0.1797 * 0.0591 rzt | 0.2156 * -0.1055 -0.1412 * 0.0005 0.0727 0.0495 -0.0948 sal | 0.0393 -0.0262 0.0184 0.0392 0.1707 * 0.0851 -0.1483 * tc | 0.3324 * 0.0328 0.0318 -0.1560 * -0.0627 0.0666 -0.1149 tc_ost | -0.0996 0.0689 -0.0713 0.0040 0.0220 -0.0184 -0.0387 ur | -0.0393 0.0262 -0.0184 -0.0392 -0.1707 * -0.0851 0.1483 * zpk | -0.3643 * 0.3172 * 0.1675 * -0.0234 -0.3391 * 0.1210 0.1117 zpt | -0.3186 * 0.3861 * 0.2391 * 0.0255 -0.3687 * 0.1662 * 0.1043
| kriza margina rnfi rzk rzt sal tc-----------------+------------------------------------------------------------------------------------------ kriza | 1.0000 margina | 0.0000 1.0000 rnfi | -0.3008 * -0.0258 1.0000 rzk | 0.3994 * -0.0203 -0.1004 1.0000 rzt | 0.1116 -0.0298 -0.0395 -0.2065 * 1.0000 sal | -0.0301 0.0636 -0.5912 * -0.0883 -0.1959 * 1.0000 tc | 0.3892 * -0.0308 -0.6242 * 0.2057 * 0.2370 * -0.2611 * 1.0000 tc_ost | 0.0041 0.0670 -0.1634 * -0.2424 * -0.1447 * -0.0390 0.2333 * ur | 0.0301 -0.0636 0.5912 * 0.0883 0.1959 * -1.0000 0.2611 * zpk | -0.1948 * 0.0357 0.1179 -0.0526 -0.1997 * -0.0053 -0.1360 * zpt | -0.1616 * 0.0318 0.1140 -0.1044 0.0458 -0.0599 -0.0784
| tc_ost ur zpk zpt-----------------+-------------------------------------------------- tc_ost | 1.0000 ur | 0.0390 1.0000 zpk | 0.1236 0.0053 1.0000 zpt | -0.0246 0.0599 0.6653 * 1.0000
Source: Calculated by author.

velib
or m
ač
kić:
politic
al b
ud
get c
yc
les at the m
un
icipa
l level in c
ro
atiafin
an
cia
l theo
ry an
d pr
ac
tice
38 (1) 1-35 (2014)
32 references1. Akhmedov, A., and Zhuravskaya, E., 2004. Opportunistic Political Cycles:
Test in a Young Democracy Setting. Quarterly Journal of Economics, 119(4), pp. 1301-1338. doi: 10.1162/0033553042476206
2. Alesina, A., 1988. Macroeconomics and Politics. NBER Macroeconomics Annual, 3, pp. 13-62. doi: 10.2307/3584936
3. Alesina, A. [et al.], 1997. Political Cycles and the Macroeconomy. London: The MIT Press.
4. Alt, J. and Lassen, D., 2006. Transparency, Political Polarization, and Political Budget Cycles in OECD Countries. American Journal of Political Science, 50(3), pp. 530-550. doi: 10.1111/j.1540-5907.2006.00200.x
5. Arellano, M. and Bond, S., 1991. Some Test of Specification for Panel data, Monte Carlo Evidence and Application to Employment Equations. Review of Economic Studies, 58(2), pp. 277-297. doi: 10.2307/2297968
6. Arnsperger, C. and Varoufakis, Y., 2006. What is Neoclassical Economics? [online]. Available at: <http://www.paecon.net/PAEReview/issue38/Arnsper-gerVaroufakis38.htm>.
7. Bajo, A. and Bronić, M., 2007. Assessments of the Effectiveness of the Croa-tian Fiscal Equalisation Model. Financial Theory and Practice, 31(1), pp. 1-26.
8. Bajo, A. and Jurlina Alibegović, D., 2008. Javne financije lokalnih jedinica vlasti. Zagreb: Školska knjiga.
9. Baltagi, B. H., 2008. Econometric Analysis of Panel Data. West Sussex: JohnWiley&Sons.
10. Bond, S. R., 2002. Dynamic panel data models: a guide to micro data methods and practice. Portuguese Economic Journal, 1(2), pp. 141-162. doi: 10.1007/s10258-002-0009-9
11. Bratić, V., 2008. Odlučivanje o lokalnim proračunima: između sna i jave. Za-greb: Institut za javne financije.
12. Brender, A. and Drazen, A., 2004. Political Budget Cycles in New versus Esta-blished Democracies. NBER Working Paper Series, No. 10539, pp. 1-28.
13. Brender, A. and Drazen, A., 2009. How do Budget Deficits and Economic Growth Affect Reelection Prospects? Evidence from a Large Panel of Coun-tries. American Economic Review, 98(5), pp. 2203-2220. doi: 10.1257/aer.98.5.2203
14. Bronić, M., 2010. Evaluating the current equalization grant to counties in Cro-atia. Financial Theory and Practice, 34(1), pp. 25-52.
15. Buchanan, J. M., 2005. Public Choice Society [online]. Available at: <http://www.gmu.edu/centers/publicchoice/pdf%20links/Booklet.pdf>.
16. Drazen, A., 2000. Political Economy in Macroeconomics. New Jersey: Prince-ton University Press.

velib
or m
ač
kić:
politic
al b
ud
get c
yc
les at the m
un
icipa
l level in c
ro
atiafin
an
cia
l theo
ry an
d pr
ac
tice
38 (1) 1-35 (2014)3317. Drazen, A. and Eslava, M., 2005. Electoral Manipulation via Expenditure
Composition: Theory and Evidence. NBER Working Paper Series, No. 11085, pp. 1-27.
18. Drazen, A. and Eslava, M., 2006. Pork Barrel Cycles. NBER Working Paper Series, No. 12190, pp. 1-34.
19. DZS, 2013. Statistički ljetopis 2012. [online]. Zagreb: Državni zavod za stati-stiku. Available at: <http://www.dzs.hr/>.
20. DIP, 2013. Arhiva izbora [online]. Zagreb: Državno izborno povjeren stvo. Available at: <http://www.izbori.hr/izbori/dip_ws.nsf/public/index?Open Form>.
21. Eslava, M., 2011. The Political Economy of Fiscal Deficits: A Survey. Journal of Economic Survey, 25(4), pp. 645-673. doi: 10.1111/j.1467-6419.2010. 00647.x
22. Franić, J., 2012. Employment at the local government level in the Republic of Croatia during the economic crisis. Newsletter, No. 71. doi: 10.3326/nle.2012.71
23. Galli, E. and Rossi, S. P., 2002. Political budget cycles: The case of the We-stern German Laender. Public choice, 110(3-4), pp. 283-303. doi: 10.1023/ A:1013089504557
24. Gonzales, M., 2002. Do Changes in Democracy affect the Political Budget Cycle? Evidence from Mexico. Review of Development Economics, 6(2), pp. 204-224. doi: 10.1111/1467-9361.00150
25. Hair, J. F. [et al.], 1995. Multivariate Data Analysis. New Jersey: Prentice Hall.
26. Hallerberg, M. and de Souza, L. V., 2000. The Political Business Cycles of EU Accession Countries. European Union Politics, 3(2), pp. 231-250. doi: 10.1177/1465116502003002005
27. Jurlina Alibegović, D. [et al.], 2010. Analitičke podloge za učinkovitu decen-tralizaciju u Hrvatskoj: projektna studija. Zagreb: Ekonomski institut.
28. Katsimi, M. and Sarantides, V., 2012. Do Elections Affect the Composition of Fiscal Policy in Developed, Established Democracies? Public Choice, 151(1-2), pp. 325-362. doi: 10.1007/s11127-010-9749-8
29. Khemani, S., 2004. Political cycles in a developing economy: effect of elec-tions in Indian states. Journal of Development Economics, 73(1), pp. 125-154. doi: 10.1016/j.jdeveco.2003.01.002
30. Klašnja, M., 2008. Electoral rules, forms of government and political budget cycles in transition countries. Paneconomicus, 55(2), pp. 185-218. doi: 10.2298/PAN0802185K
31. Lemieux, P., 2004. The Public Choice Revolution [online]. Available at: <http://www.cato.org/pubs/regulation/regv27n3/v27n3-2.pdf>.

velib
or m
ač
kić:
politic
al b
ud
get c
yc
les at the m
un
icipa
l level in c
ro
atiafin
an
cia
l theo
ry an
d pr
ac
tice
38 (1) 1-35 (2014)
34 32. Lohmann, S., 2006. The Non-Politics of Monetary Policy in: B. R. Weingast and D. A. Wittman, eds. The Oxford Handbook of Political Economy. New York: Oxford University Press Inc, pp. 523-544.
33. Maurel, M., 2006. The Political Business Cycles in the EU enlarged. Slove-nian Journal for Money and Banking, 55(11), pp. 38-41.
34. McLean, I., 1997. Uvod u javni izbor. Zagreb: Fakultet političkih znanosti.35. Ministarstvo financija RH, 2013. Lokalni proračun arhiva [online]. Available
at: <http://www.mfin.hr/hr/lokalni-proracun-2002>.36. Mueller, D. C., 2003. Javni izbor III. Zagreb: Masmedija.37. Naruhiko Sakurai, S. and Menezes-Filho, N., 2011. Opportunistic and Partisan
Election Cycles in Brazil: New Evidence at the Municipal Level. Public Cho-ice, 148(1), pp. 233-247. doi: 10.1007/s11127-010-9654-1
38. Persson, T. and Tabellini, G., 2000. Political Economics. London: The MIT Press.
39. Persson, T. and Tabellini, G., 2002. Do electoral cycles differ across political systems? Innocenzo Gasparini Institute for Economic Research (IGIER), Uni-versità Bocconi, Working Papers, No. 232, pp. 1-23.
40. Petak, Z., 2008. Javne politike i problemi modernog upravljanja. Hrvatska javna uprava, 8(2), pp. 443-462.
41. Pettersson Lidbom, P., 2000. A test of the rational electoral-cycle hypothesis in: P. Pettersson, ed. Elections, party Politics and Economic Policy. Stockholm: IIES, Stockholm University, pp. 1-26.
42. Primorac, M., 2011. Local Governmentand Utility Firms’ Debt. Financial Theory and Practise, 35(4), pp. 443-464.
43. Rašić Bakarić, I. [et al.], 2013. Ekonomska uspješnost gradova u Hrvatskoj – statistička analiza. Faculty of Economics and Business Zagreb Working Paper Series, 13-08, pp. 1-21.
44. Rogić Lugarić, I., 2010. Financijski aspekti položaja velikih gradova. Hr-vatska javna uprava, 10(3), pp. 683-708.
45. Rogić Lugarić, T., 2012. Financiranje velikih gradova. Zagreb: Pravni faku -ltet Sveučilišta u Zagrebu, Studijski centar za javnu upravu i javne financije.
46. Rogoff, K., 1990. Equilibrium Political Budget Cycles. The American Econo-mic Review, 80(1), pp. 21-36.
47. Rogoff, K. and Siebert, A., 1988. Elections and Macroeconomic Policy Cycles. Review of Economic Studies, 55(1), pp. 1-16. doi: 10.2307/2297526
48. Rose, S., 2006. Do Fiscal Rules Dampen the Political Business Cycle. Public Choice, 128(3-4), pp. 407-431. doi: 10.1007/s11127-005-9007-7
49. Schneider, C. J., 2010. Fighting with one hand tied behind the back: political budget cycles in the West German states. Public Choice, 142(1), pp. 125-150. doi: 10.1007/s11127-009-9480-5

velib
or m
ač
kić:
politic
al b
ud
get c
yc
les at the m
un
icipa
l level in c
ro
atiafin
an
cia
l theo
ry an
d pr
ac
tice
38 (1) 1-35 (2014)3550. Schuknecht, L., 2000. Fiscal policy cycles and public expenditure in develo-
ping countries. Public Choice, 102(1-2), pp. 115-130.51. Seitz, H., 2000. Fiscal policy, deficits and politics of sub national governments:
The case of German Laender. Public Choice, 102(3-4), pp. 183-218. doi: 10.1023/A:1005000124300
52. Shi, M. and Svensson, J., 2003. Political Budget Cycles: A Review of Recent Developments. Nordic Journal of Political Economy, 29, pp. 67-76.
53. Shi, M., and Svensson, J., 2006. Political budget cycles: Do they differ across countries and why? Journal of Public Economics, 90(8-9), pp. 1367-1389. doi: 10.1016/j.jpubeco.2005.09.009
54. Snowdon, B. and Vane, H. R., 2005. Modern Macroeconomics: Its Origins, Development and Current State. London: Edward Elgar, Cheltenham.
55. Stigler, G. J, 1984. Economics-The Imperial Science? Scandinavian Journal of Economics, 86(3), pp. 301-313. doi: 10.2307/3439864
56. Škrabić, B., 2009. Determinante razvoja financijskog sustava zemalja središnje i istočne Europe. Magistarski rad. Zagreb: Ekonomski fakultet Zagreb, Sveučilište u Zagrebu.
57. Tullock, G., 1972. Economic Imperialism in: J. M. Buchanan, R. D. Tollison and G. Tullock, eds. Theory of Public Choice: Political Applications. Ann Ar-bor: University of Michigan Press, pp. 317-29.
58. Tullock, G., 1987. Public Choice in: S. N. Durlauf, ed. The New Palgrawe: Dictionary of Economics. New York: Palgrawe Macmillan, pp. 1040-1044.
59. Udehn, L., 2003. The Methodology of Rational Choice in: S. M., Cahn, ed. The Blackwell Guide to the Philosophy of the Social Sciences. Malden: Blackwell Publishing Ltd.MA, pp. 143-166.
60. Veiga, L. G. and Veiga, F. J., 2007. Political business cycles at the municipal level. Public Choice, 131(1-2), pp. 45-64. doi: 10.1007/s11127-006-9104-2
61. Višić, J. and Škrabić Perić, B., 2011. The determinants of value of incoming cross-border mergers & acquisitions in European transition countries. Com-munist and Post-Communist Studies, 44(3), pp. 173-182. doi: 10.1016/j.post-comstud.2011.07.004
62. Vučković, V., 2011. Političko-poslovni ciklusi: postoje li u Hrvatskoj. Priv-redna kretanja i ekonomska politika, 20(125), pp. 61-88.


br
un
a ška
ric
a:d
eterm
ina
nts o
f no
n-perfo
rm
ing lo
an
s in cen
tra
l an
d easter
n eur
opea
n co
un
tries
fina
nc
ial th
eory a
nd
pra
ctic
e38 (1) 37-59 (2014)
37Determinants of non-performing loans in Central and Eastern European countries
BRUNA ŠKARICA*
Article**JEL: E32, E44, E52, G10doi: 10.3326/fintp.38.1.2
* The author would like to thank two anonymous referees for their helpful comments and suggestions as well as Dr Petar Sorić for his mentorship.
** Received: June 1, 2013 Accepted: December 28, 2013The article won the prize for the best student category paper in the annual award of the Prof. Dr. Marijan Hanžeković Prize for 2013. Bruna ŠKARICAUniversity of Zagreb, Faculty of Economics and Business, J. F. Kennedy 6, 10000 Zagreb, Croatiae-mail: [email protected]

br
un
a ška
ric
a:d
eterm
ina
nts o
f no
n-perfo
rm
ing lo
an
s in cen
tra
l an
d easter
n eur
opea
n co
un
tries
fina
nc
ial th
eory a
nd
pra
ctic
e38 (1) 37-59 (2014)
38 abstractThis paper analyses the determinants of the changes in the non-performing loan (NPL) ratio in selected European emerging markets. The model was estimated on a panel dataset using a fixed effects estimator for seven Central and Eastern Eu-ropean (CEE) countries between Q3:2007 and Q3:2012. The countries analyzed are Bulgaria, Croatia, Czech Republic, Hungary, Latvia, Romania and Slovakia. Although the literature on NPLs is quite extensive, this is the first empirical rese-arch on the countries of CEE region using aggregate, country-level data on pro-blem loans. The results suggest that the primary cause of high levels of NPLs is the economic slowdown, which is evident from statistically significant and econo-mically large coefficients on GDP, unemployment and the inflation rate.
Keywords: non-performing loans, macro-financial linkages, Central and Eastern Europe, panel regressions, financial stability
1 introductionThe recent financial crisis has left a legacy of extremely high levels of NPLs in the CEE region. In 2008, countries that had based their economic growth on the boo-ming banking sector (Sirtaine and Skamnelos, 2007) at the beginning of the past decade found themselves faced with a sudden credit growth halt (European Banking Coordination ‟Vienna” Initiative, 2012). This is attributable to both the reduced demand for financing and reduced willingness to lend on the part of the European banks. The high levels of NPLs are becoming a growing issue, given that experiences from past financial crises show that a lasting recovery requires a ‟clean-up” of the financial sector. It is also clear that NPLs induce uncertainty and impact the banks’ willingness and ability to keep lending, therefore affecting ag-gregate demand and investments. Furthermore, unresolved NPLs suppress the economic activity of currently overextended borrowers and trap resources in unproductive uses. All of these problems are particularly prominent in the CEE region, where recovery following the extreme economic slowdown has been very weak. To illustrate the strong impact of the global recession on the economic per-formance of CEE countries, it is sufficient to state that in 2009 all of the 7 coun-tries analyzed in this paper suffered negative annual real GDP growth rates of over 4% (Latvia’s economy, for example, contracted by 17.7% in 2009, on a year-to-year basis).
Moreover, despite the efforts from the banking sector and regulatory institutions, NPL levels still remain high, especially compared with the advanced economies in Western Europe. Table 1 shows World Bank data on annual NPL levels for 10 selected advanced European economies. According to the data, the levels of NPLs grew throughout the four-year crisis period in these economies as well, but have not risen above 5%. In the CEE region, on the other hand, Bulgaria, Romania, Latvia and Croatia finished 2011 with NPL ratios of 16.87%, 14.3%, 17.23% and 12.27% respectively.

br
un
a ška
ric
a:d
eterm
ina
nts o
f no
n-perfo
rm
ing lo
an
s in cen
tra
l an
d easter
n eur
opea
n co
un
tries
fina
nc
ial th
eory a
nd
pra
ctic
e38 (1) 37-59 (2014)
39figure 1 Annual levels of NPLs, 2008-2011
2008 2009 2010 2011
4.5
4.0
3.5
3.0
2.5
2.0
1.5
1.0
0.5
0.0
Source: World Bank.
Although the literature on NPLs is quite extensive, this is the first empirical rese-arch on the countries of CEE region using aggregate, country-level data on pro-blem loans. This empirical analysis includes 7 countries of the CEE region: Bul-garia, Croatia, Czech Republic, Hungary, Latvia, Romania and Slovakia. It needs pointing out that the choice of the countries analyzed (as well as the observed time period) was determined primarily by the scarcity of data on NPLs. The data was collected from quarterly financial stability reports by central banks of the 7 countries included in the research; no earlier data were available for all 7 coun tries (or other CEE countries) – therefore, in order to have a balanced panel for all 7 countries, with aggregate data, this time period was chosen. The model was esti-mated on a panel dataset using ordinary least squares and including fixed effects. The results suggest that the primary cause of high levels of NPLs is the extreme economic slowdown.
The rest of the paper is organized as follows. Section two provides a summary of the relevant literature discussing the determinants of NPLs. Section three descri-bes some stylized facts about recent developments in the banking sectors of the CEE countries, data used in the analysis and states the potential impact of each variable on the NPL ratio. This is followed by a description of methodology and the presentation of results. Section five concludes.
2 literature overviewThe macroeconomic determinants of NPLs, or the quality of bank assets in gene-ral, have generated a substantial amount of interest since the outbreak of the finan-cial crisis in the autumn of 2008.
There is a rich theoretical literature on the subject of the interactions between the financial system and the wider economy. The most prominent examples are Ber-nanke and Gertler (1989) and Bernanke, Gertler and Gilchrist (1998) who develo-

br
un
a ška
ric
a:d
eterm
ina
nts o
f no
n-perfo
rm
ing lo
an
s in cen
tra
l an
d easter
n eur
opea
n co
un
tries
fina
nc
ial th
eory a
nd
pra
ctic
e38 (1) 37-59 (2014)
40 ped the concept of the ‟financial accelerator”, arguing that credit markets are procyclical and that information asymmetries between lenders and borrowers as well as the balance sheet effect work to amplify and propagate credit market shocks to the economy. The Kiyotaki and Moore (1997) model showed how rela-tively small shocks might suffice to explain business cycle fluctuations, if credit markets are imperfect.
2.1 empirical studies: single economy analysesKeaton and Morris (1987) introduced one of the earliest empirical studies on NPLs investigating the causes of loan loss diversity on a sample of 2,500 banks in the USA. Their study showed that a substantial part of the variation in loan losses was due to differences in local economic conditions and to unusually poor perfor-mance in particular industries like agriculture and energy. On the other hand, only a minor part of the remaining variation in losses can be attributed to bank-level factors, such as banks deliberately taking greater risks and granting loans that they knew had a high probability of default. Gambera (2000) also analyzed quarterly data on US loans to prove the link between macroeconomic dynamics and bank asset quality. The empirical results suggest that a limited number of regional and national macroeconomic variables are often good predictors of problem loan ra-tios, and that simple, bivariate VAR systems of one bank variable, one macroeco-nomic variable, and seasonal dummies can be quite effective. These variables in-clude bankruptcy filings, farm income (particularly for countries where farming has an important role), state annual product, housing permits, and unemployment. Furthermore, VAR methodology was also used in the studies by Blaschke and Jones (2001) for USA, Baboučak and Jančar (2005) for Czech Republic and Hog-garth, Logan and Zicchino (2005) for the United Kingdom. The latter employed UK quarterly data to evaluate the dynamics between banks’ write-off-to-loan ratio and several macroeconomic variables. They found that the important factors in-fluencing financial stability and loan portfolio quality were the dynamics of infla-tion and interest rates. Baboučak and Jančar (2005) found evidence of positive correlation between the NPLs, unemployment rate and consumer price inflation, whereas GDP growth decelerates the NPL ratio. They also found that the real ef-fective exchange rate appreciation does not exacerbate the NPL ratio. Salas and Saurina (2002) compared the determinants of problem loans of Spanish commer-cial and savings banks, taking into account both the macroeconomic and indivi-dual bank-level variables. The GDP growth rate, corporate and family in-debtedness, rapid past credit or branch expansion, inefficiency, portfolio compo-sition, size, net interest margin, capital ratio, and market power are all variables that explain credit risk. Jimenez and Saurina (2006) presented an extended piece of research on NPL determinants in Spain, demonstrating that the acceleration of GDP, as well as the decline in real interest rates, brings about a decline in problem loans. They also found that credit growth lagged four years has a positive and si-gnificant influence on NPLs, proving that the rapid credit growth today results in lower credit standards and, eventually in higher levels of problem loans. Rajan

br
un
a ška
ric
a:d
eterm
ina
nts o
f no
n-perfo
rm
ing lo
an
s in cen
tra
l an
d easter
n eur
opea
n co
un
tries
fina
nc
ial th
eory a
nd
pra
ctic
e38 (1) 37-59 (2014)
41and Dahl (2003) used panel regression models to suggest that credit terms have a significant effect on Indian non-performing loans in the presence of bank size in-duced risk preferences and macroeconomic shocks. The changes in the cost of credit in terms of expectations of higher interest rates induce a rise in NPLs. On the other hand, factors like the horizon of maturity of credit, better credit culture, favorable macroeconomic and business conditions all lead to the lowering of NPLs. Quagliariello (2003) presented a regression between the evolution of Ita-lian NPLs as the dependent variable and a set of explanatory variables: the real GDP growth rate, growth of real gross fixed investment and consumption, change in the unemployment rate, CPI, real exchange rate and M2 growth rate. He sho-wed that the declining GDP growth and increasing unemployment rate have a si-gnificant negative effect on loan portfolio quality in Italy. Arpa et al. (2001) also applied regression analysis showing that risk provisions in the total loans of the Austrian banking sector vary with real GDP growth, CPI inflation, real estate price inflation and real interest rates. Shu (2002) examined the NPL ratio in Hong Kong using regression models. His analysis showed that the increasing NPL ratio can be attributed to the increasing nominal interest rates and the number of bankruptcies, whereas the NPL ratio decreases with higher CPI inflation, economic growth and property price inflation. Louzis, Vouldis and Metaxas (2011) explored both bank-specific and macroeconomic determinants of NPLs in Greece, using dynamic pa-nel data sets separately for each loan category (consumer, business loans and mortgages). Their study shows that all categories of Greek NPLs can be explained by macroeconomic variables (GDP growth, unemployment, interest rates, public debt) as well as by management quality.
2.2 panel analysesThe Espinoza and Prasad (2010) study on the determinants of NPLs in the Gulf Cooperation Council (GCC) banking sector is one of the first examples of regional empirical research on the topic. It uses a bank-wise panel dataset and fixed effect, difference GMM, and System GMM models. They found strong evidence of a significant inverse relationship between real (non-oil) GDP and NPLs. Their study also attempted to estimate the feedback from rising NPLs to the real economy using a panel VAR. Overall, the model suggested that there is strong but short- lived feedback effect on non-oil growth in the GCC. Nkusu (2011) analyzed NPL determinants and feedback effects for a panel of 26 advanced economies. The findings are in line with previous studies and expectations. They confirm that de-terioration in the macroeconomic environment (proxied by slower growth, higher unemployment or falling asset prices) is associated with debt service problems, reflected into rising NPLs. Finally, according to Beck, Jakubik and Piloiu (2013), who used a panel of 75 countries, real GDP growth, share prices, exchange rate and lending interest rate significantly affect NPL ratios. Overall, it can be stated that a considerable amount of empirical evidence regarding the anti-cyclical beha-vior of NPLs can be found. The common finding of all these studies is that when

br
un
a ška
ric
a:d
eterm
ina
nts o
f no
n-perfo
rm
ing lo
an
s in cen
tra
l an
d easter
n eur
opea
n co
un
tries
fina
nc
ial th
eory a
nd
pra
ctic
e38 (1) 37-59 (2014)
42 there is a slowdown in the economy, the NPL level is likely to increase, as une-mployment rises and borrowers face greater difficulties in repaying their debt.
3 data and stylized factsIn the following chapter, a discussion on the common treatment of the non-perfo-rming loans in macroeconomic statistics will be presented. In addition, the varia-bles used in the analysis and their expected channel of impact on the NPL ratio will be introduced, as well as a short overview of the banking sector in the CEE region.
3.1 dataThe dependent variable here is the ratio of NPLs to total (gross) loans. The defini-tion of NPLs differs across countries and regions, so it is necessary to be cautious when making international comparisons. The main problem with the NPL data is that there is no internationally accepted standard for NPL measurement. Some of the most commonly used definitions are those by the IMF, Basel Committee for Banking Supervision (BCBS), Institute of International Finance (IIF) and the In-ternational Financial Reporting Standards (IFRS). The IMF’s definition of NPLs was developed in the framework of the Financial Soundness Indicators (FSIs). The FSI Compilation Guide of March 2006 (IMF, 2006) recommends that ‟loans (and other assets) should be classified as NPL when (1) payments of principal and interest are past due by three months (90 days) or more, or (2) interest payments equal to three months (90 days) interest or more have been capitalized (re-inve-sted into the principal amount), refinanced, or rolled over (i.e. payment has been delayed by arrangement).” BIS (2006) also advises the 90 days rule, more preci-sely, ‟a default is considered to have occurred with regard to a particular obligor when the obligor is past due more than 90 days on any material credit obligation to the banking group.” Many national regulations follow the IIF recommendation (IIF, 1999) for classifying loans as standard, watch, substandard, doubtful and loss; non-performing loans usually comprise the categories substandard (interest and/or principal are more than 90 days overdue), doubtful (interest and/or princi-pal are overdue more than 180 days) and loss loans (where the loan is virtually uncollectible; interest and/or principal are overdue for more than a year). The FSI website as well as the World Bank’s database offer cross-country comparative presentations of NPL time series. However, for most developing countries, the NPL data presented by both sources are not yet comprehensive, as the time series are rather limited. The data on the NPL ratio in this study is therefore collected from the central banks’ databases of each country included in the analysis. This data set contains quarterly observations for 7 countries of the Central and Eastern Europe (CEE) region, from the third quarter of 2007 to the third quarter of 2012. The countries included in the sample are: Bulgaria, Croatia, Czech Republic, Hungary, Latvia, Romania and Slovakia. Reassuringly, the NPL series are highly correlated with the FSI data. Furthermore, recent research by Barisitz (2011) lo-oks into the national definitions of NPLs in the CEE region and concludes that

br
un
a ška
ric
a:d
eterm
ina
nts o
f no
n-perfo
rm
ing lo
an
s in cen
tra
l an
d easter
n eur
opea
n co
un
tries
fina
nc
ial th
eory a
nd
pra
ctic
e38 (1) 37-59 (2014)
43NPL definitions based on national credit quality classifications of CEE countries largely appear to be comparable as they are based on the ‟90-days-past-due crite-rion”.
However, it should be noted that apart from the days of overdue, there are other differences among the definitions and NPL classification criteria across countries. These include taking into account whether or not a judicial procedure has been started against the debtor (e.g. Romania), reporting NPL levels net of provisions (instead of in gross terms, which is the international standard) and the role of col-lateral and guarantees.
3.2 variables and expected channels of impactThe independent variables are commonly used country-specific macroeconomic indicators and the level of loans in the banking sector. The aforementioned macro-economic aggregates include the real GDP growth, unemployment rate, nominal effective exchange rate (NEER), harmonised index of consumer prices (HICP), share prices index and the 3 month money market interest rate. The data on real GDP growth, unemployment rates, HICP, 3 month money market interest rates and the share prices indices are obtained from Eurostat. Nominal effective exch-ange rates are calculated as geometric weighted averages of bilateral exchange rates, with 61 economies included in the basket, and are taken from the Bank for International Settlements database. The data on total loans refers to outstanding amounts of domestic loans in all currencies (originally in millions of euro) at the end of each period (quarter), and are retrieved from the European Central Bank statistics.
The relevance and expected signs of the relationships between NPL ratio and the selected variables are as follows:
– Following the results of previous empirical studies on NPLs and their pro-ven countercyclical nature, it can be expected that real GDP growth and employment will be negatively associated with NPLs. A growing economy increases borrowers’ income and ability to repay debts and it generally in-creases overall financial stability.
– An increase of NEER represents an appreciation of the domestic currency. Currency appreciation can weaken debt-servicing capabilities of export-oriented firms and thus increase the NPL ratio. However, it could also posi-tively affect private debtors whose loans are denominated in foreign cur-rency, reducing the NPL ratio. The sign of the relationship between NEER and the NPL ratio is thus indeterminate. However, it should be noted that the countries of the CEE regions are known for a large proportion of foreign currency loans.
– The HICP gives comparable measures of inflation in the countries in the sample. The relationship between NPLs and inflation is ambiguous. Theore-tically, inflation should reduce the real value of debt and hence make debt

br
un
a ška
ric
a:d
eterm
ina
nts o
f no
n-perfo
rm
ing lo
an
s in cen
tra
l an
d easter
n eur
opea
n co
un
tries
fina
nc
ial th
eory a
nd
pra
ctic
e38 (1) 37-59 (2014)
44 servicing easier. However, high inflation may pass through to nominal inte-rest rates, reducing borrowers’ loan-servicing capacity or it can negatively affect borrowers’ real income when wages are sticky. It is also necessary to emphasize the short run relationship between inflation and NPLs as well. If the income does not increase in line with inflation, a rise in inflation increa-ses costs (for both households and corporates) and thus lowers the amount of available funds for debt repayment. Finally, price stability is generally considered a prerequisite for economic growth. Bearing in mind this background, the relationship between NPLs and inflation can be positive or negative. Rinaldi and Sanchis-Arellano (2006) find a positive relationship between the inflation rate and non-performing loans, while Shu (2002) re-ports a negative relation.
– An increase in interest rates weakens borrowers’ debt servicing capacity, more so if loan rates are variable. Therefore, NPL is expected to be positi-vely related to interest rates.
– In the case of share prices, the direct impact on NPLs in not obvious. Beck, Jakubik and Piloiu (2013) use this variable in their examination of NPL de-terminants, assuming that share prices are correlated with housing prices, on which there are insufficient data. Empirical analysis should then reflect the notion that a drop in the value of collateral for housing loans could negati-vely affect the quality of consumer loans. At the same time, shares, while rarely used as collateral, might be correlated with other risky assets which serve as a collateral for loans.
– NPLs should increase following rapid credit growth; therefore the increase of domestic loans should be associated with higher levels of NPLs. How-ever, high loan levels could indicate high debt burdens, which make debtors more vulnerable to adverse shocks affecting their wealth or income, thereby raising the likelihood of running into debt-servicing problems.
3.3 stylized factsThe CEE region was hit very hard by the global economic slowdown in 2009, especially given the high positive growth rates in the region in the period between 2000 and 2007, i.e. prior to the global recession. In these years, Latvia, for exa-mple, had an average annual real GPD growth rate of 8.5%. However, in 2008 Latvia was (alongside Estonia, which is not analyzed in this paper) the only co-untry in the region with a contracting economy – GDP decreased by 2.8% from 2007. In 2009, however, all of the countries in the sample had a negative GDP growth rate. The quarterly data shows that in 2009, in the third quarter, Latvia had an almost incredible GDP decrease of 18.9%; the GDP numbers were also follo-wed by a strong rise in the unemployment figures. In the third quarter of 2007 the unemployment rate in this country was 6.6%, whereas in the first quarter of 2010 it reached 21.1%. Despite dramatic GDP figures from 2009, in 2011 all the cou-ntries in the region had positive real GDP growth rates – apart from Croatia.

br
un
a ška
ric
a:d
eterm
ina
nts o
f no
n-perfo
rm
ing lo
an
s in cen
tra
l an
d easter
n eur
opea
n co
un
tries
fina
nc
ial th
eory a
nd
pra
ctic
e38 (1) 37-59 (2014)
45 Economic recovery in this country has been very slow, with persistently high unemployment rates. In 2012, however, two more countries slid back into reces-sion – Czech Republic and Hungary.
figure 2 Real GDP growth rates
15
10
5
0
-5
-10
-15
-20
07Q
3
Q4
08Q
1
Q2
Q3
Q4
09Q
1
Q2
Q3
Q4
10Q
1
Q2
Q3
Q4
11Q
1
Q2
Q3
Q4
12Q
1
Q2
Q3
Romania SlovakiaBulgaria Croatia
Source: Eurostat.
Figure 3 shows quarterly growth rates of all domestic loans, as compared to the same quarter in the previous year. A strong downwards trend in loan growth rates can be noticed in the graph for virtually all the countries of the CEE region in the period between the third quarter of 2007 and the beginning of 2009. As presented in the banking overview section of this paper, a halt in credit demand, particularly by households, is still a big problem in the countries of the region, and has been slowing down further economic recovery.
figure 3 Loans growth rates
Romania SlovakiaBulgaria Croatia
50
40
30
20
10
0
-10
-20
07Q
3
Q4
08Q
1
Q2
Q3
Q4
09Q
1
Q2
Q3
Q4
10Q
1
Q2
Q3
Q4
11Q
1
Q2
Q3
Q4
12Q
1
Q2
Q3
Source: ECB.

br
un
a ška
ric
a:d
eterm
ina
nts o
f no
n-perfo
rm
ing lo
an
s in cen
tra
l an
d easter
n eur
opea
n co
un
tries
fina
nc
ial th
eory a
nd
pra
ctic
e38 (1) 37-59 (2014)
46 Apart from the second half of 2008 and the beginning of 2009 (the start of the global recession) – especially in Romania and Bulgaria, NEER has been relatively stable in all the analyzed countries. It can be argued that NEER is not an appro-priate measure for exchange rate volatility in this analysis, and this will be further elaborated in the empirical section of the paper. Finally, inflation rates (as measu-red by Eurostat’s HICP) have been rising steadily in all CEE countries, but parti-cularly in Hungary, Romania, Bulgaria and Latvia.
3.4 banking sector overview in ceeThe banking sector development of CEE countries has been a vital part of their overall economic growth and financial integration. As a part of the economic tran-sition, domestic banks had been sold to strategic foreign investors, who were ex-pected to import better bank governance, more modern banking practices and in-duce better supervision by home authorities. High foreign ownership is still one of the main characteristics of banking sectors throughout the region, as BIS data show that bank assets owned by foreign banks exceed 50 percent of GDP in vir-tually all countries. This translates into dominant market shares, in some places as high as 90 percent (IMF, 2013c). High foreign ownership has led to high foreign funding in the mid-2000s when foreign banks provided financing to CEE through their own subsidiaries, fueled by high global liquidity and rapid economic growth in the region (IMF, 2013c). This led to a credit boom in the region and a surge in foreign currency loans which raised concerns about the increasing systemic risks to financial stability emerging from such a large exposure of households and the corporate sector to foreign currency risks. Between 2008 and 2012, however, there was substantial deleveraging in CEE countries, where most of the outflows were the result of a reduction in loans to banks. The following section will give a brief overview of the current state of the banking system for each of the analyzed countries.
According to the Banks Bulletin publication of Croatian National Bank (CNB, 2012) (last data available), at the end of June 2012, there were 31 banks operating in Croatia. A total of 17 banks were in majority foreign ownership, the largest number of banks (6) belonging to Austrian shareholders. What is more, these 6 banks alone accounted for 61.6% of total assets of all banks. According to the CNB, a steady rise of NPLs in total bank loans can primarily be attributed to the worsening of the corporate loan quality (especially loans to the construction sector – where NPLs reached 37.8% in June 2012). However, currency risk is a signifi-cant issue for Croatian banks given that in, for example, the third quarter of 2012, 56% of total loans were foreign currency-indexed kuna loans, 17% were foreign currency-denominated loans and the rest (27%) were kuna loans. Non-kuna loans are dominantly euro loans, the share of which has increased since 2007 due to the appreciation of CHF/HRK exchange rate. In the third quarter of 2012, 8% of all franc-denominated loans to households were classified as non-performing, com-pared to 3.3% of those in euro. Finally, the Croatian banking sector is also cha-

br
un
a ška
ric
a:d
eterm
ina
nts o
f no
n-perfo
rm
ing lo
an
s in cen
tra
l an
d easter
n eur
opea
n co
un
tries
fina
nc
ial th
eory a
nd
pra
ctic
e38 (1) 37-59 (2014)
47racterized by a current halt in credit demand. The CNB states that, regardless of ‟a number of measures taken by the CNB to encourage more favorable financing of the economy, loans granted held steady in 2012”.
The Czech banking system grew rapidly in the run-up to the global recession, but growth has been moderate since 2009. The banking sector is concentrated; the 5 largest banks control 70% of total assets, and they are wholly or majority-owned subsidiaries of big European financial conglomerates (IMF, 2012b). Unlike the other countries in the CEE region, the Czech banking sector has a conservative balance sheet, with a high share of resident deposits and loans denominated in local currency. Credit growth is fueled mainly by domestic deposits with a loans-to-deposits ratio of 70%, and only one fifth of loans are denominated in foreign currency. All of this made the Czech banking sector one of the few in the CEE region which did not need any exceptional measures during crisis. Even though, as of 2012, banks report strong capital, liquidity, and profitability, credit growth is slow and NPLs are at around 5%, which is comparable to NPL levels in advanced economies. Slovakia is very similar to the Czech Republic – its banking sector is also dominated by foreign bank subsidiaries, but the banking system’s reliance on external funding is limited, as lending is mostly financed through domestic retail deposits. NPL ratios are relatively low – around 4% in 2012, and have been decli-ning steadily after peaking in 2010 at 5.28% (IMF, 2012b).
The Hungarian banking system and overall financial stability were heavily af-fected by the global financial crisis. After a slowdown in economic activity, the Hungarian government was forced to implement some rather non-standard mea-sures to balance the budget – such as the banking tax. In this difficult landscape, banks are, naturally, scaling down their operations. Credit growth is projected to remain negative in 2013 on the back of weak household demand and banks’ limi-ted appetite to lend (IMF, 2013b). High levels of NPLs (over 16% since Q2:2012) are associated with a high level of Swiss franc-denominated loans and the weake-ning of the forint. This has prompted the Hungarian monetary authorities to under-take various ‟unorthodox” measures, compiled under the name of Funding for Growth (MNB, 2013). One part of this plan was to enable the replacement of fo-reign exchange loans with low-interest forint loans, as well as introduce a tempo-rary exchange-rate limit program. Under the program, borrowers may cap their repayments based on the exchange-rate limit for up to five years. The difference between the capped exchange-rate and the actual exchange-rate during the period is placed in a special account, the balance of which the borrowers will repay later. Nevertheless, levels of NPLs have been increasing steadily up to the third quarter of 2012. The ratio of non-performing loans to total loans is expected to peak at the end of 2013.
Domestic banks in Bulgaria had a market share of 26.4% in 2012, whereas EU subsidiary banks’ share was 65.3%. The five largest banks held 49.5% of the
br
un
a ška
ric
a:d
eterm
ina
nts o
f no
n-perfo
rm
ing lo
an
s in cen
tra
l an
d easter
n eur
opea
n co
un
tries
fina
nc
ial th
eory a
nd
pra
ctic
e38 (1) 37-59 (2014)
48 system’s balance sheet assets at the year’s close (BNB, 2012). Furthermore, in the same year the share of gross loans denominated in euro was 61.3%, where loans in levs accounted for 34.6% of the total loans. Bulgaria is also struggling with the decline of household credit demand, but in 2012 there was an increase in credit demand by the corporate sector. However, despite very high levels of NPLs, the IMF argues that ‟...macroeconomic and financial stability has been maintained in recent years” (IMF, 2012a).
Despite the economic growth observed in Latvia in 2012, credit institutions’ as-sets continued to shrink, primarily because of private sector deleveraging and low lending activity (BoL, 2012). Latvia had dramatically high levels of NPLs in the period observed – for example, in 2010 NPL ratio was higher than 19%, but as of that peak in mid – 2010, the banking sector has been slowly recovering. The im-provement in the corporate loan portfolio has been more marked than the hou-sehold loan portfolio; partly because the latter was particularly hard hit by the collapse of the housing bubble (over three-fourths of household loans comprise mortgage lending). The share of NPLs is now about 11 percent for corporate lo-ans, but 16 percent for household loans.
At the end of 2012, there were 31 banks in Romanian banking system, with addi-tional 8 foreign bank branches. Two of these 31 banks had fully or majority state-owned capital, and a total of 26 banks had majority foreign capital – 81.8% of the total assets was owned by foreign banks. The top five (largest) banks held 54.7% of aggregate assets in 2012. At the end of 2012, foreign currency denominated loans still held the highest share (62.5 percent) in total loans. However, in Roma-nia the plummeting real estate prices are mentioned as the leading cause of credit portfolio quality deterioration (NBR, 2012).
Finally, to sum up, the lowest levels of NPLs in the sample are recorded in Czech Republic and Slovakia, where NPLs peaked at just over 5 percent in the third quarter of 2010. In the same quarter, NPLs in Latvia reached their highest level (19.43 percent of total loans), whereas in Croatia, Romania, Bulgaria and Hu-ngary, NPL ratios show no sign of slowing down (peaking at 13.89 percent, 17.34 percent, 18.34 percent and 16.19 percent respectively, in the third quarter of 2012 – the last for which the data are available). Interestingly, as previously mentioned, among the countries in this study, the Czech Republic and Slovakia have the lo-west levels of foreign currency loans, and the Czech Republic has also had the lowest growth of overall indebtedness over the five years to 2009. In Latvia, for example, loans denominated in currencies other than domestic made up over 92% of total loans (in the final quarter of 2009 and throughout 2010).

br
un
a ška
ric
a:d
eterm
ina
nts o
f no
n-perfo
rm
ing lo
an
s in cen
tra
l an
d easter
n eur
opea
n co
un
tries
fina
nc
ial th
eory a
nd
pra
ctic
e38 (1) 37-59 (2014)
49figure 4 Non-performing loans ratio
Romania SlovakiaBulgaria Croatia
20
18
16
14
12
10
8
6
4
2
0
07Q
3
Q4
08Q
1
Q2
Q3
Q4
09Q
1
Q2
Q3
Q4
10Q
1
Q2
Q3
Q4
11Q
1
Q2
Q3
Q4
12Q
1
Q2
Q3
Source: Central banks of selected countries.
4 methodologyIn this study, panel data techniques are used to analyze and quantify the impact of the macroeconomic and financial variables described above on asset quality du-ring the period between the Q3:2007 and Q3:2012. The estimation technique used is a fixed effects model, which allows controlling for time-constant unobserved heterogeneity across countries. If the equation for the fixed effects model is:
yit = x'it β + αi + εit (1)
the fixed effects approach takes αi to be a group-specific constant term in the re-gression model (as usual, β denotes the vector of parameters being estimated, and εit is the disturbance term). The term fixed is used to indicate that the term does not vary over time, not that it is nonstochastic, which does not have to be the case (Greene, 2002). When using fixed effects estimators, it is assumed that something within the individual entity (country in this case) may impact or bias the predictor or outcome variables, and it is necessary to control for this. This is the rationale behind the assumption of the correlation between entity’s error term and predictor variables. The fixed effects estimator removes the impact of those time-invariant characteristics from the predictor variables, so the predictor’s net effect can be assessed. Another important assumption of the fixed effects model is that these time-invariant characteristics are unique to each individual entity and should not be correlated with other individual characteristics. Each entity is different, there-fore, the entity’s error term and constant (which captures the individual characte-ristics) should not be correlated with others. If the error terms are correlated, then the fixed effects model is not suitable. The suitability of the fixed effects model can be assessed using the F-test. Because this analysis is limited to a very specific set of countries, and all of the observed variables are time-varying, it is reasonable

br
un
a ška
ric
a:d
eterm
ina
nts o
f no
n-perfo
rm
ing lo
an
s in cen
tra
l an
d easter
n eur
opea
n co
un
tries
fina
nc
ial th
eory a
nd
pra
ctic
e38 (1) 37-59 (2014)
50 to use this particular estimation technique. Finally, dynamic panel methodology is not applied in this study, as Pesaran, Shin and Smith (1999) argue that in the case where T dimension in larger than N ‟traditional procedures for estimation of poo-led models produce inconsistent, and potentially very misleading estimates of the average values of the parameters in dynamic panel data models”.
4.1 stationarity testingThere is a variety of tests for unit roots or stationarity in panel datasets. The Levin, Lin and Chu (2002), Harris and Tzavalis (1999), Breitung and Das (2005), Im, Pesaran and Shin (2003), and Fisher-type (Choi, 2001) tests have as the null hypo-thesis that all the panels contain a unit root. The Hadri (2000) Lagrange multiplier (LM) test has the null hypothesis that all the panels are (trend) stationary. The assorted tests make different asymptotic assumptions regarding the number of cross-section units in the dataset and the number of time periods for each unit.
Here, the Levin-Lin-Chu test is applied to examine whether any of the series con-tain a unit root. The null hypothesis is that the series contains a unit root, and the alternative is that the series is stationary. The Levin-Lin-Chu test assumes a com-mon autoregressive parameter for all panels, so it does not allow for the possibi lity that some countries’ data time series contain unit roots while other countries’ data time series do not. The Levin-Lin-Chu test requires that the number of time pe-riods grows more quickly than the cross-section dimension, so the ratio of cross-sections to time periods tends to zero. For this reason, this particular test is well suited for datasets with a larger number of time periods than cross-sections – such as the one presented in this paper.1
The variables are defined as follows: nplgr denotes the yearly percentage changes in NPL ratio, rgdpgr is the real GDP yearly growth rate, unplgr is the yearly per-centage change in the unemployment rate, hicpgr denotes annual percentage change in inflation, neergr tracks yearly percentage change in the nominal effec-tive exchange rate, eqgr denotes the share price indices annual percentage change and loansgr are the yearly percentage changes of the quarterly levels of outstan-ding loans for each country; ir are the 3 month money market interest rates.
The Levin-Lin-Chu test decisively rejects the null hypothesis of non-stationarity, at 1 percent, for all variables, except the interest rates, which are thus excluded from further analysis.
1 It should be noted, however, that the use of presented unit root tests in relatively small samples might be problematic.

br
un
a ška
ric
a:d
eterm
ina
nts o
f no
n-perfo
rm
ing lo
an
s in cen
tra
l an
d easter
n eur
opea
n co
un
tries
fina
nc
ial th
eory a
nd
pra
ctic
e38 (1) 37-59 (2014)
51table 1 Stationarity testing
Variables tstatistic pvaluenplgr -2.3394 0.0097unplgr -5.7601 0.0000rgdpgr -3.8437 0.0001neergr -5.0462 0.0000eqgr -9.0780 0.0000hicpgr -2.3952 0.0083loansgr -4.4803 0.0000ir -0.6689 0.2518
Source: Author’s calculations.
4.2 model specification and resultsAccording to the above considerations, the following equation is estimated:
nplgri,t = β0 + β1rgpdgri,t + β2unplgri,t + β3hicpgri,t + β4neergri,t
+ β5eqgri,t + β6loansgri,t + αi + εi,t (2)
All variables are expressed as logarithmic differences of the original series in or-der to ensure data stationarity. The βs are parameters, αi is the unobserved country effect, εi,t denotes the disturbances; i and t denote cross-section and time indica-tors, respectively.
Because of the relatively short time series, this data panel is estimated with ordi-nary least squares and it includes country fixed effects, which should account for all unobserved country heterogeneity.
Estimation results broadly confirm the postulated relationships between the cho-sen explanatory variables and the NPL ratio.
The suitability of the fixed effects model can be assessed using the F-test, which is strongly justified in this case (F(6, 105) = 7.55, p-value = 0.000). Furthermore, Wooldridge test for autocorrelation in panel data shows that at 5% the null hypo-thesis of no auto-relation cannot be rejected.
The estimates indicate that a 1 percentage point higher GDP growth rate lowers the NPL ratio growth rate by 3.97 percentage points. A 1 percentage point incre ase in the unemployment growth rate increases the NPL ratio growth rate by 1.006 percentage points. These estimates confirm the results obtained from previous empirical studies on NPLs, regarding their countercyclical nature: their levels are rising in recessions and falling in business cycle upturns. Both of these coeffi-cients are highly statistically significant and economically very large, showing

br
un
a ška
ric
a:d
eterm
ina
nts o
f no
n-perfo
rm
ing lo
an
s in cen
tra
l an
d easter
n eur
opea
n co
un
tries
fina
nc
ial th
eory a
nd
pra
ctic
e38 (1) 37-59 (2014)
52 that recent economic developments in CEE countries have a strong negative im-pact on their financial stability.
table 2 Estimation results
Dependent variable: nplgrexplanatory variable Coefficient std. error tstatistic (prob.)rgdpgr -3.970 0.636 -6.24 (0.000)unplgr 1.006 0.129 7.82 (0.000)hicpgr 1.657 0.868 1.91 (0.059)neergr 0.624 0.426 1.46 (0.146)eqgr 0.083 0.056 1.49 (0.140)loansgr 0.128 0.326 0.39 (0.696)cons 19.122 3.358 5.69 (0.000)Observations 118
R-squaredwithin = 0.83
between = 0.33 overall = 0.77
Source: Author’s calculations.
The NPL ratio growth increases following an increase in inflation rates. This esti-mate indicates that in this sample of CEE countries, inflation negatively affects banks’ asset quality. It can be concluded that the effect of higher interest rates due to inflation and the declining economic conditions usually associated with rising inflation prevails over the positive impact that inflation might have on borrowers’ debt servicing capacities. It is important to state that the central banks of the countries in the dataset all name maintaining price stability as their principal objective, as can be verified in the national laws on the said central banks (for example, Law on the Bulgarian National Bank, Article 2: ‟...the primary objective of the Bulgarian National Bank shall be to maintain price stability through ensu-ring the stability of the national currency and implementing monetary policy as provided for by this Law.”). Such an objective and the overall focus of central banks on keeping inflation low are justified by this particular result within this analysis.
It is not surprising that the coefficient on the share price index is not significant – the countries of the CEE region have small stock market capitalization, and the interactions between macroeconomic or financial sector indicators and stock mar-kets are rarely confirmed in countries with underdeveloped financial markets. Beck, Jakubik and Pilou (2013) have shown that a decline in stock market indices can significantly contribute to an increase in NPLs, but in countries with relatively large stock markets. For countries with small stock markets capitalization relative to GDP, the effect is not statistically significant.
br
un
a ška
ric
a:d
eterm
ina
nts o
f no
n-perfo
rm
ing lo
an
s in cen
tra
l an
d easter
n eur
opea
n co
un
tries
fina
nc
ial th
eory a
nd
pra
ctic
e38 (1) 37-59 (2014)
53The effect of the growth of the current level of indebtedness is statistically insigni-ficant. This can be attributed to the levels of outstanding loans in the observed period. The data on loan level growth covers the time between the Q3:2007 and Q3:2012 when credit growth in the CEE countries was abruptly halted due to global liquidity shocks caused by the global financial crisis. The NPL ratio in all the countries in our sample, on the contrary, grew rapidly throughout the afore-mentioned period.
It is somewhat surprising that the coefficient on the increase of NEER is not signi-ficant. The countries of the CEE region are characterized by high level of foreign currency loans, and it is expected that the NPL ratio will react strongly to excha-nge rate volatility. Exchange rate depreciations are, thus, expected to lead to an increase of NPL ratio (growth rate) in countries with a high degree of lending in foreign currency to unhedged borrowers. In this analysis, the country with the highest level of foreign currency denominated loans in total loans is Latvia. How-ever, Latvia has maintained its currency board arrangement vis-à-vis the euro du-ring the crisis, so the exchange rate could not have affected NPLs significantly. On the other hand, since interest rates had to increase to defend the currency board, higher lending rates might have contributed to the large increase of NPLs in that country. Hungary and Croatia are two other countries in the sample where foreign currency lending is widespread. In both countries the depreciation of the national currency against the Swiss franc was associated with the deterioration of bank assets’ quality. However, NEER is calculated as the geometric weighted averages of bilateral exchange rates, where the most recent weights are based on trade in 2008-2010. For both countries, the largest weight is on the euro exchange rate (for Croatia 60.6% of the index, for Hungary 51.5%) – which has remained relatively stable during the crisis.
5 conclusionThe econometric analysis of the empirical determinants of NPLs presented in this paper, show that the real GDP growth was the main driver of the increase of the NPL ratio during the past 5 years in CEE countries. The coefficient of the stated explanatory variable is economically large, proving that the slowdown in the eco-nomic activity has greatly affected the financial stability of the region. High levels of NPLs across the region are a legacy of the crisis, and as economic recovery came to the countries of the region relatively late and can be described as weak, they are still expected to cause problems.
Given that an increase in inflation rates is estimated to cause growth in the NPL ratio, it can be said that the central banks in the countries of the CEE region are faced with an ambiguous outcome (concerning NPLs) when trying to stimulate growth. On one hand, to support economic recovery (which would lead to a drop in NPL levels), central banks can implement expansionary monetary policy, thus, up to a certain point, increasing GDP and aggregate demand. However, this would

br
un
a ška
ric
a:d
eterm
ina
nts o
f no
n-perfo
rm
ing lo
an
s in cen
tra
l an
d easter
n eur
opea
n co
un
tries
fina
nc
ial th
eory a
nd
pra
ctic
e38 (1) 37-59 (2014)
54 significantly increase inflation rates, which, as estimated, causes NPL ratios to grow. The countries of the region are, however, persistent in keeping inflation ra-tes low, which is, of course, related also to the general economic conditions in each country (high levels of both public and private foreign currency-denomi-nated debt, the obligation to respect Maastricht guidelines, etc.). Finally, it must be emphasized also that some of the countries of the region have very limited space for expansionary monetary policy. Slovakia is a member of the Eurozone, Bulgaria has a currency board arrangement, and some other counties in the sample have effectively pegged exchange rates, which limits the scope of monetary po-licy.
Except for economic growth, the solution to the problem of NPLs would be a proactive and cooperative approach of creditors, debtors and the regulatory sy-stem. This kind of comprehensive approach is particularly important in the CEE region, given that any restructuring would help spur economic recovery, thereby also helping lift the value of collateral backing other loans. Further research would require a longer time series for non-performing loans for each country, which would enable exploring country-specific determinants of NPLs. This in turn would help policy makers to get a clearer image of the steps necessary to stabilize the banking sector in the post-crisis period.

br
un
a ška
ric
a:d
eterm
ina
nts o
f no
n-perfo
rm
ing lo
an
s in cen
tra
l an
d easter
n eur
opea
n co
un
tries
fina
nc
ial th
eory a
nd
pra
ctic
e38 (1) 37-59 (2014)
55appendix
table a1 Robustness tests
Dependent variable: nplgrexplanatory variable 1 2 3 4 5 6 7
rgdpgr -3.970 [0.636]***
-3.939 [0.628]***
-3.465 [0.541]***
-3.554 [0.549]***
-3.712 [0.555]***
-3.410 [0.633]***
-3.611 [0.616]***
unplgr 1.006[0.129]***
1.009[0.128]***
1.076[0.120]***
1.047[0.122]***
0.977[0.120]***
0.961[0.124]***
0.962[0.124]***
hicpgr 1.657[0.868]*
1.831[0.743]**
1.468[0.704]**
1.614[0.714]**
1.573[0.831]*
1.112[0.756]
neergr 0.624[0.426]
0.699[0.378]*
0.896[0.356]**
0.872[0.415]**
0.613[0.366]*
eqgr 0.083[0.056]
0.074[0.050]
0.156[0.058]***
0.166[0.058]***
loansgr 0.128[0.326]
-0.477[0.363]
loansgr_lag 0.697[0.214]***
0.553[0.184]***
cons 19.122[3.358]
18.897[3.296]
18.744[3.312]
17.221[3.323]
23.388[1.933]
17.081[3.276]
18.119[3.189]
Observations 118 118 118 118 118 118 118R-squared within 0.83 between 0.33 overall 0.77
0.83 0.35 0.77
0.83 0.31 0.77
0.82 0.42 0.77
0.81 0.27 0.75
0.85 0.43 0.80
0.84 0.34 0.78
Standard errors are in parenthesis. * indicates 10% significance level, ** indicates 5% signifi-cance level, and *** indicates 1% significance level.
Source: Author’s calculations.
Several nested models are estimated in order to test the stability of the proposed model. According to the results, in all of the specifications both the quarterly growth rate of GDP and the change in unemployment are highly significant, with expected coefficient signs. This confirms the main conclusion of the analysis, which is that the slowdown in economic activity has been the main driver of the increase in NPLs in the CEE region. The coefficient on the increase in inflation rates is also significant in every specification (at 5% and 10% significance level), but one, where lagged loans growth rate is included in the analysis. According to specifications 6 and 7 higher growth rate of loans in previous periods results in higher current growth rate of problem loans, which is in accordance with econo-mic intuition.

br
un
a ška
ric
a:d
eterm
ina
nts o
f no
n-perfo
rm
ing lo
an
s in cen
tra
l an
d easter
n eur
opea
n co
un
tries
fina
nc
ial th
eory a
nd
pra
ctic
e38 (1) 37-59 (2014)
56 refrences1. Arpa, M. [et al.], 2001. The influence of macroeconomic developments on
Austrian banks: implications for banking supervision. BIS Papers, 1, pp. 91-116. Available at: <https://www.bis.org/publ/bppdf/bispap01.pdf#page=99>.
2. Babouček, I. and Jančar, M., 2005. Effects of macroeconomic shocks to the quality of the aggregate loan portfolio. Czech National Bank Working Paper Series, No. 1. Available at: <http://www.cnb.cz/miranda2/export/sites/www.cnb.cz/en/research/research_publications/cnb_wp/download/cnbwp_2005_ 01.pdf>.
3. Barisitz, S., 2011. Nonperforming Loans in CESEE – What do they Comprise? Focus on European Economic Integration Q, 4, pp. 46-68.
4. Beck, R., Jakubik, P. and Piloiu, A., 2013. Non-performing loans: what mat-ters in addition to the economic cycle? ECB Working Paper Series, No. 1515. Available at: <http://www.ecb.europa.eu/pub/pdf/scpwps/ecbwp1515.pdf>.
5. Bernanke, B. and Gertler, M., 1989. Agency Costs, Net Worth, and Business Fluctuations. The American Economic Review, 79(1), pp. 14-31.
6. Bernanke, B., Gertler, M. and Gilchrist, S., 1998. The Financial Accelerator in a Quantitative Business Cycle Framework. NBER Working Paper, No. 6455. Available at: <http://www.nber.org/papers/w6455.pdf?new_window=1>.
7. BIS, 2006. Basel II: International Convergence of Capital Measurement and Capital Standards: A Revised Framework – Comprehensive Version. Basel: Basel Committee on Banking Supervision. Available at: <http://www.bis.org/publ/bcbs128.pdf>.
8. BNB, 2012. Annual Report – 2012. Sofia: Bulgarian National Bank. Avail able at: <http://www.bnb.bg/bnbweb/groups/public/documents/bnb_publication/anual_report_2012_en.pdf>.
9. BoL, 2012. Annual Report – 2012. Riga: Bank of Latvia. Available at: <http://m.bank.lv/images/stories/pielikumi/parlatvijasbanku/gada_parskati/BoL_Annual_Report_2012.pdf>.
10. Breitung, J. and Das, S., 2005. Panel Unit Root Tests Under Cross Sectional Dependence. Statistica Neerlandica, 59(4), pp. 414-433. Doi: 10.1111/ j.1467-9574.2005.00299.x
11. Choi, I., 2001. Unit Root Tests for Panel Data. Journal of International Money and Finance, 20(2), pp. 249-272. Doi: 10.1016/S0261-5606(00)00048-6
12. CNB, 2012. Banks Bulletin, No. 25. Zagreb: Croatian National Bank. Availa-ble at: <http://www.hnb.hr/publikac/bilten-o-bankama/ebilten-o-bankama-25.pdf>.
13. Espinoza, R. and Prasad, A., 2010. Nonperforming Loans in the GCC Banking Systems and their Macroeconomic Effects. IMF Working Paper, 10/224. Avai-lable at: <http://www.imf.org/external/pubs/ft/wp/2010/wp10224.pdf>.

br
un
a ška
ric
a:d
eterm
ina
nts o
f no
n-perfo
rm
ing lo
an
s in cen
tra
l an
d easter
n eur
opea
n co
un
tries
fina
nc
ial th
eory a
nd
pra
ctic
e38 (1) 37-59 (2014)
5714. European Banking Coordination ‟Vienna” Initiative, 2012. Working Group on NPLs in CESEE. Available at: <http://www.imf.org/external/region/eur/pdf/2012/030112.pdf>.
15. Gambera, M., 2000. Simple forecasts of bank loan quality in the business cycle. Emerging Issues. Available at: <http://www.chicagofed.org/digital_as-sets/publications/risk_management_papers/sr_2000_3.pdf >.
16. Green, W. H., 2004. Econometric analysis. Singapore: Pearson Education.17. Hadri, K., 2000. Testing for Stationarity in Heterogeneous Panel Data. Econo-
metrics, Journal, 3(2), pp. 148-161. Doi: 10.1111/1368-423X.0004318. Harris, R. D. F. and Tzavalis, E., 1999. Inference for Unit Roots in Dynamic
Panels where the Time Dimension is Fixed. Journal of Econometrics, 91(2), pp. 201-226. Doi: 10.1016/S0304-4076(98)00076-1
19. Hoggarth, G., Logan, A. and Zicchino, L., 2005. Macro stress tests of UK banks. BIS papers, No. 22. Available at: <http://citeseerx.ist.psu.edu/viewdoc/download?rep=rep1&type=pdf&doi=10.1.1.225.3146>.
20. IIF, 1999. Report of the Working Group on Loan Quality, 1999. Washington: Institute of International Finance. Available at: <www.iif.com>.
21. Im, K.S., Pesaran, M. H. and Shin, Y., 2003. Testing for Unit Roots in Hetero-genous Panels. Journal of Econometrics, 115(1), pp. 53-74. doi: 10.1016/S0304-4076(03)00092-7
22. IMF, 2006. The Financial Soundness Indicators Compilation Guide of March 2006. Available at: <http://www.imf.org/external/pubs/ft/fsi/guide/2006/>.
23. IMF, 2012a. Bulgaria: 2013 Article IV Consultation. IMF Country Report, No. 12/328. Washington: IMF. Available at: <http://www.imf.org/external/pubs/ft/scr/2012/cr12328.pdf>.
24. IMF, 2012b. Czech Republic: Financial System Stability Assessment Update. IMF Country Report, No. 12/177. Available at: <http://www.imf.org/external/pubs/ft/scr/2012/cr12177.pdf>.
25. IMF, 2013a. Slovak Republic: 2013 Article IV Consultation. IMF Country Report, No. 13/262. Available at: <http://www.imf.org/external/pubs/ft/scr/2013/cr13262.pdf>.
26. IMF, 2013b. Hungary: 2013 Article IV Consultation. IMF Country Report, No. 13/85. Available at: <http://www.imf.org/external/pubs/cat/longres.aspx?sk=40438.0>.
27. IMF, 2013c. Financing Future Growth: The Evolving Role of the Banking Sy-stems in CESEE. Available at: <http://www.imf.org/external/pubs/ft/reo/2013/eur/eng/pdf/tn0413.pdf>.
28. Keeton, W. and Morris, C., 1987. Why Do Banks’ Loan Losses Differ? Econo-mic Review, pp. 3-21. Available at: <http://www.kansascityfed.org/PUBLI-CAT/ECONREV/econrevarchive/1987/2q87keet.pdf>.

br
un
a ška
ric
a:d
eterm
ina
nts o
f no
n-perfo
rm
ing lo
an
s in cen
tra
l an
d easter
n eur
opea
n co
un
tries
fina
nc
ial th
eory a
nd
pra
ctic
e38 (1) 37-59 (2014)
58 29. Kiyotaki, N. and Moore, J., 1997. Credit chains. Journal of Political Economy, 105(21), pp. 211-248. doi: 10.1086/262072
30. Levin, A., Lin, C. and Chu, C. J., 2002. Unit Root Tests in Panel Data: Asym-ptotic and Finite-sample Properties. Journal of Econometrics, 108(1), pp. 1-24. doi: 10.1016/S0304-4076(01)00098-7
31. Louzis, D. P., Vouldis, A. T. and Metaxas, V. L., 2011. Macroeconomic and bank-specific determinants of non-performing loans in Greece: A comparative study of mortgage, business and consumer loan portfolios. Journal of Banking & Finance, 36(4), pp. 1012–1027. Doi: 10.1016/j.jbankfin.2011.10.012
32. Majnoni, G. [et al.], 2001. Stress Testing of Financial Systems: An Overview of Issues Methodologies and FSAP Experiences. Washington: International Mo-netary Fund.
33. MNB, 2013. Report on Financial Stability – May 2013. Budapest: Magyar Nemzeti Bank. Available at: <http://english.mnb.hu/Root/Dokumentumtar/ENMNB/Kiadvanyok/mnben_stabil/mnben_stab_jel_201305/jelentes_pen-zugyi_stabilitas_201305_en.pdf>.
34. NBR, 2012. Annual Report – 2012. Bucharest: National Bank of Romania. Available at: <http://www.piraeusbankgroup.com/~/media/Com/Piraeus-Bank-Documents/Enimerosi-Ependiton/Etisies-Ekthesis/2012/PiraeusBank_AR_ENG_Edit6.ashx>.
35. Nkusu, M., 2011. Nonperforming Loans and Macrofinancial Vulnerabilities in Advanced Economies. IMF Working Paper, No 11/161. Available at: <http://www.imf.org/external/pubs/ft/wp/2011/wp11161.pdf>.
36. Pesaran, M. H., Shin, Y. and Smith, R. P., 1999. Pooled Mean Group Estima-tion of Dynamic Heterogeneous Panels. Journal of the American Statistical Association, 94(446), pp. 621-634. doi: 10.1080/01621459.1999.10474156
37. Quagliariello, M., 2003. Are Macroeconomic Indicators Useful in Predicting Bank Loan Quality? Evidence from Italy. Bank of Italy, Paper Series, (1).
38. Rajan, R. and Dahl, S. C., 2003. Non-performing Loans and Terms of Credit of Public Sector Banks in India: An Empirical Assessment. Reserve Bank of India Occasional Papers, 24(3), pp. 81-121. Available at: <http://rbidocs.rbi.org.in/rdocs/Publications/PDFs/60613.pdf>.
39. Rinaldi, L. and Sanchis-Arellano, A., 2006. Household Debt Sustainability: What Explains Household Non-performing Loans? An Empirical Analysis. ECB Working Paper, No. 570. Available at: <http://www.ecb.europa.eu/pub/pdf/scpwps/ecbwp570.pdf>.
40. Salas, V. and Saurina, J., 2002. Credit risk in two institutional regimes: Spa-nish commercial and savings banks. Journal of Financial Services Research, 22(3), pp. 203-224. doi: 10.1023/A:1019781109676
41. Saurina, G. and Jiménez, G., 2006. Credit cycles, credit risk, and prudential regulation. Documentos de trabajo del Banco de España, No. 3, pp. 9-34.

br
un
a ška
ric
a:d
eterm
ina
nts o
f no
n-perfo
rm
ing lo
an
s in cen
tra
l an
d easter
n eur
opea
n co
un
tries
fina
nc
ial th
eory a
nd
pra
ctic
e38 (1) 37-59 (2014)
5942. Shu, C., 2002. The Impact of macroeconomic environment on the asset quality of Hong Kong’s banking sector. Hong Kong Monetary Authority Research Memorandums.
43. Sirtaine, S. and Skamnelos, I., 2007. Credit growth in emerging Europe: a cause for stability concerns? World Bank Publications, Vol. 4281. Available at: <http://elibrary.worldbank.org/doi/book/10.1596/1813-9450-4281>.
44. World Bank Open Data. Available at: <http://data.worldbank.org/indicator/FB.AST.NPER.ZS>.


mir
oslav v
erb
ič, mitja č
ok, d
ar
ija šink
ov
ec: so
me ev
iden
ce fo
r implem
entin
g an en
ha
nc
ed relatio
nsh
ip in slov
enia
fina
nc
ial th
eory a
nd
pra
ctic
e38 (1) 61-80 (2014)
61Some evidence for implementing an enhanced relationship in Slovenia
MIROSLAV VERBIČ, PhD*MITJA ČOK, PhD*DARIJA ŠINKOVEC, MSc*
Review article**JEL: H11, H20, H26doi: 10.3326/fintp.38.1.3
* The authors would like to thank two anonymous referees for their helpful comments and suggestions.** Received: May 10, 2013 Accepted: September 23, 2013 Miroslav VERBIČUniversity of Ljubljana, Faculty of Economics, Kardeljeva ploščad 17, 1000 Ljubljana, Sloveniae-mail: [email protected]
Mitja ČOKUniversity of Ljubljana, Faculty of Economics, Kardeljeva ploščad 17, 1000 Ljubljana, Sloveniae-mail: [email protected]
Darija ŠINKOVECTax Administration of the Republic of Slovenia, Šmartinska cesta 55, 1000 Ljubljana, Sloveniae-mail: [email protected]
mir
oslav v
erb
ič, mitja č
ok, d
ar
ija šink
ov
ec: so
me ev
iden
ce fo
r implem
entin
g an en
ha
nc
ed relatio
nsh
ip in slov
enia
fina
nc
ial th
eory a
nd
pra
ctic
e38 (1) 61-80 (2014)
62 abstractFostering an enhanced relationship between the tax administration and taxpayers is a promising approach for transforming traditional vertical relationships into a partnership based on trust and close, proactive cooperation. This article exami-nes an example of such efforts, based on a pilot project in Slovenia called Hori-zontal Monitoring. After two years of operation, the project has justified its exi-stence and represents a solid basis for extension to a larger group of taxpayers.
Keywords: enhanced relationship, horizontal monitoring, pilot project, Slovenia, voluntary tax compliance
1 introductionThe typical relationship between a tax administration and a taxpayer involves a taxpayer that completes tax returns and discloses the minimum amount of infor-mation needed to administer the required tax. However, the tax administration can demand additional information about the tax declaration and, if necessary, impose enforcement measures. In this relationship, tax intermediaries are not involved as direct parties, although they play an important role in influencing the taxpayer’s behavior (OECD, 2007). Because of the prevalence of aggressive tax planning, the OECD (2008) published a report focusing on the trilateral relationships among tax authorities, taxpayers, and tax intermediaries. It recommends creating a co-operative, trust-based relationship with taxpayers, whereby tax authorities need to demonstrate certain key attributes: understanding through commercial awareness, impartiality, proportionality, disclosure and transparency, and responsiveness. This approach should lead to cooperative, trust-based relationships between tax authorities and taxpayers; that is, an ‟enhanced relationship.”
In addition, in 2009 the OECD published a report that focuses on the role of banks in aggressive tax planning and on identifying the benefits of including banks as large taxpayers in the process of an enhanced relationship (OECD, 2009a), and another study from the same year (OECD, 2009b) extends the coverage of a spe-cial relationship from large taxpayers and banks to professional associations and government bodies. Several tax administrations have thus recently started to launch special strategies and programs aimed at managing tax compliance, espe-cially in relation to large taxpayers (important with respect to tax revenue).
In enhanced relationship programs, the tax administration’s primary goal is to stimulate the taxpayer and tax intermediary to cooperate and increase voluntary tax compliance. A high level of tax enforcement does not always increase tax compliance. In contrast, there are tax systems with a low level of tax enforcement and, simultaneously, a low level of tax avoidance. The key question for any tax administration is thus how to balance out the use of tax enforcement with stimu-lation for voluntary tax compliance.
mir
oslav v
erb
ič, mitja č
ok, d
ar
ija šink
ov
ec: so
me ev
iden
ce fo
r implem
entin
g an en
ha
nc
ed relatio
nsh
ip in slov
enia
fina
nc
ial th
eory a
nd
pra
ctic
e38 (1) 61-80 (2014)
63The OECD (2008) has identified three basic mechanisms applicable in the adop-tion of an enhanced relationship: (1) a unilateral statement of the tax administra-tion, comprising the enhanced relationship process, and the consequences for taxpayers and tax intermediaries in the event of cooperation and non-cooperation; (2) a charter adopted by the tax administration, taxpayers, and tax intermediaries, defining how they intend to work together and what they are expected to do, and setting out the consequences if they fail to do so; and (3) an agreement between the tax administration and a specific taxpayer, designed to meet their specific needs.
Supported by the OECD and other professional organizations, such as the Euro-pean Commission (Fiscalis Risk Management Platform Group, 2010) and the In-tra-European Organization of Tax Administrations (IOTA, 2012), the enhanced relationship programs are largely based on a series of studies devoted to tax avoi-dance and tax ethics.1 The literature on enhanced relationships, especially rese-arch, has been very scant so far. One of the purposes of this article is therefore to present an overview of the implementation of enhanced relationships worldwide, with an emphasis on the case of Slovenia.
We also present and analyze an enhanced relationship pilot project that was imple-mented in 2010 in Slovenia called Horizontal Monitoring. Horizontal monitoring is an example of an enhanced relationship in line with the third mechanism of the OECD (2008) classification (given above). It was launched by the Tax Admini-stration of the Republic of Slovenia (DURS) and includes eighteen of the largest Slovenian corporate taxpayers.2 The main hypothesis of the article is that horizo-ntal monitoring has proved to be successful, with implicit potential to be applied on a larger scale, throughout the taxpayer community. To support this idea, we introduce a survey among non-participating large taxpayers that was designed and conducted especially for this purpose. In accordance with the findings, we can conclude that the concept of an enhanced relationship is widely supported, altho-ugh further promotion is needed for the mechanisms to become established in practice. A discussion of the initial implementation of an enhanced relationship and the analysis of non-participation in an enhanced relationship are thus two additional contributions from this article.
The article proceeds as follows. Section two provides an overview of the imple-mentation of enhanced relationships around the world. Section three describes and discusses the elements involved in an introduction of an enhanced relationship in the case of Slovenia, where we focus on the agreement with taxpayers, implemen-tation issues, and evaluation. Section four analyzes non-participation in the en-
1 In addition to the economic factors, several other sociological and psychological factors determine the com-plex individual attitude toward taxes (Allingham and Sandmo, 1972; Torgler, 2003).2 In 2011, these eighteen taxpayers employed 20.1% of employees in large corporate taxpayers and 7.9% of all employees in Slovenia (AJPES, 2012).

mir
oslav v
erb
ič, mitja č
ok, d
ar
ija šink
ov
ec: so
me ev
iden
ce fo
r implem
entin
g an en
ha
nc
ed relatio
nsh
ip in slov
enia
fina
nc
ial th
eory a
nd
pra
ctic
e38 (1) 61-80 (2014)
64 hanced relationship process based on our survey. The final section concludes with the main findings.
2 overview of implementing an enhanced relationship around the worldAmong the initiators of an enhanced relationship were the Netherlands, Ireland, and the UK. The Netherlands started an enhanced relationship program called Horizontal Monitoring in 2005, initially including twenty large corporate taxpa-yers.3 The program represents an attempt by the Dutch Tax and Customs Admini-stration (TCA) to build greater trust in relation to taxpayers as a mechanism to encourage greater disclosure of tax uncertainties and risks. It is based on transpa-rency, understanding, and trust. The TCA and participating taxpayers signed a non-binding agreement obliging taxpayers to notify the TCA of any issues entai-ling a potential and significant tax risk. The basic requirement is that agreements are concluded with taxpayers whose tax control frameworks are solid. In excha-nge, the TCA assures tax certainty (OECD, 2007).
In 2007, the program was extended to medium- and small-sized companies, tax intermediaries (such as financial and tax advisors or accountants), and various professional trade and industry organizations. The next phase in the program in-troduces horizontal monitoring to software producers, in order to enable reliable reporting and monitoring in the entire chain from business transaction to tax re-turn. The TCA emphasizes the importance of the attitude of participating taxpa-yers’ top management to horizontal monitoring (the ‟tone-at-the-top” principle) because this is crucial for increasing taxpayers’ willingness to adopt voluntary tax compliance and for improving the internal tax control framework. From the point of view of a tax administration, it is essential for employees to have excellent knowledge not only of the particular taxpayer’s business, but also of its specific branch of industry in order to work with a particular taxpayer (TCA, 2008). The Slovenian Horizontal Monitoring program, introduced in 2010, is based on the Dutch experience and is being implemented with support from the TCA.
Ireland introduced its enhanced relationship program, called the Cooperative Compliance Programme, in 2005 (Revenue – Irish Tax and Customs, 2005; Grif-fin, 2006). It aims to include large taxpayers that exceed certain turnover and asset thresholds. This program includes comprehensive supervision of all cases related to tax compliance issues. For this purpose, a special department has been establi-shed inside the tax administration. Each participating taxpayer is assigned to a particular employee of this unit in order to enable prompt reactions.
3 In the Netherlands, as early as 2002, the Scientific Council for Government Policy recommended changing the relationship between the government and citizens from vertical to horizontal; that is, a move towards more equal relationships, as a consequence of international and social development (TCA, 2008). The government included the recommendations in the Other Government (Andere Overheid) program. These principles were also a basis for TCA pilot projects for developing new forms of cooperation with taxpayers and tax interme-diaries; one of these was Horizontal Monitoring in 2005.
mir
oslav v
erb
ič, mitja č
ok, d
ar
ija šink
ov
ec: so
me ev
iden
ce fo
r implem
entin
g an en
ha
nc
ed relatio
nsh
ip in slov
enia
fina
nc
ial th
eory a
nd
pra
ctic
e38 (1) 61-80 (2014)
65The UK started its enhanced relationship program, called the High Risk Corpora-tes Programme, in 2006 based on a unilateral approach; that is, the relationship arises from an assessment of the risk connected with a particular taxpayer (Freedman et al., 2012; HMRC, 2012). The High Risk Corporates Programme has three strategic aims: (1) to induce corporate customers to take a less aggressive approach to tax mitigation and tax filing positions, (2) to increase the openness with which they disclose transactions and their tax impact, and (3) to collect the correct amount of tax from their transactions and profits as effectively as possible — if necessary, determining this through litigation (OECD, 2009c). In 2009, the UK also introduced a Code of Practice on Taxation for Banks. As of 30 June 2010, over 100 banks had adopted this code and many more, including most of the lar-gest banks, were actively working towards adopting it (OECD, 2010).
In the EU, a form of enhanced relationship is also currently being implemented in Belgium, Denmark, Germany, Austria, Spain, and Sweden (Stevens et al., 2012). The concept is also known in Switzerland (Bugnon, 2012), in southeast Europe Macedonia introduced a program of horizontal monitoring (European Commi-ssion, 2011), and the Croatian tax administration has been preparing to introduce a pilot enhanced-relationship program funded by the Matra-flex short-term pro-gram (Government of the Republic of Croatia, 2012). As in Slovenia, both southe-ast European projects are being supported by the TCA.
Among the OECD countries, Australia, Canada, New Zealand, and the U.S. have also introduced such programs (Stevens et al., 2012). For example, the Compli-ance Assurance Process (CAP) in the U.S. started in 2005 and represents a real-time, year-by-year audit program devoted to large companies. The seventy-three taxpayers participating at the time of its introduction turned into 160 participants by 2012. The program starts at the beginning of a taxpayer’s financial year and finishes after its tax return is submitted. The taxpayer discloses all transactions and connected tax positions in real time, and any open issues are resolved with the tax administration before the tax return is completed (OECD, 2007; IRS, 2012).
However, there are several theoretical and practical concerns related to the enhan-ced relationship, deriving from constitutional (legal) and practicability issues (Burton and Dabner, 2008; Druen, 2012; Stevens et al., 2012), such as conflicts of interest or unequal treatment of taxpayers. Freedman et al. (2012) found that the enhanced relationship program overall has been successful in achieving some aims (such as better allocation of resources within the tax authority), but not others (such as moderating the tax planning of certain types of corporate taxpayers). In a similar way, Burton and Dabner’s (2012) analysis of enhanced relationships in Australia, New Zealand, and the UK summarizes the difficulties in implementing the enhanced relationship as ideological tensions, legislative constraints, institu-tional and internal constraints, and international pressures.

mir
oslav v
erb
ič, mitja č
ok, d
ar
ija šink
ov
ec: so
me ev
iden
ce fo
r implem
entin
g an en
ha
nc
ed relatio
nsh
ip in slov
enia
fina
nc
ial th
eory a
nd
pra
ctic
e38 (1) 61-80 (2014)
66 3 the enhanced relationship in slovenia: the horizontal monitoring processIn Slovenia, an enhanced relationship project started in 2010 under the title Hori-zontal Monitoring as a consequence of establishing the DURS strategic business plan for 2010-2013 (DURS, 2010). It became obvious while preparing the strate-gic business plan that a small tax administration with limited resources needs an alternative approach to the standard vertical relationship with taxpayers and tax intermediaries, especially in the context of the complex environment of the on-going (late-2000s) economic and financial crisis.
The new business strategy has therefore set increased voluntary tax compliance as the first strategic objective (DURS, 2010). Its implementation requires the servi-ces of DURS to be provided in such a way that (Šinkovec, 2012a): (1) procedures are simplified for taxpayers that are willing to comply, (2) all necessary assistance is given to taxpayers that strive for compliance but are not always successful, (3) taxpayers that are not willing to comply are deterred from doing so with fast and effective identification of the evasion and avoidance of their tax obligations, and (4) all possible enforcement measures provided by law are applied to taxpayers determined not to comply.
In addition to the new business strategy, the initiation of the horizontal monitoring project was based on a series of studies and guidelines of relevant international organizations, such as the IOTA mentioned above, the EC/Fiscalis Risk Manage-ment Platform Group, and the OECD, as well as some domestic analyses (Filipović, 2009; Centa-Debeljak, 2010). These analyses revealed an already high level of voluntary tax compliance among the largest taxpayers. As a result, it was decided to commence a two-year pilot enhanced relationship project. From the outset, the TCA actively cooperated through the transfer of experience and know-how, resulting in many similarities between the Slovenian and Dutch enhanced relationship processes.
3.1 agreement with taxpayersIn March 2010, the first public presentation of horizontal monitoring was organi-zed in cooperation with the TCA, followed by a public call to all large corporate taxpayers4 that had already established a system of internal tax control (Centa-Debeljak, 2011) to join the pilot project in May 2010. At this stage, organizations of professions were involved, such as the Bank Association of Slovenia, to inform and motivate large corporate taxpayers to participate. In the introductory phase of an enhanced relationship project, the tax administration usually approaches large corporate taxpayers first because they are typically low-risk taxpayers with a se-ries of external advisors that also indirectly become part of this process. In this
4 There were 721 large corporate taxpayers in Slovenia in 2010, representing 1.3% of all companies. They were very important from the viewpoint of public revenues, contributing 53% of the entire amount of corpo-rate income tax collected, 54% of revenue generated, and involving 40% of all employees (Šinkovec, 2012b).

mir
oslav v
erb
ič, mitja č
ok, d
ar
ija šink
ov
ec: so
me ev
iden
ce fo
r implem
entin
g an en
ha
nc
ed relatio
nsh
ip in slov
enia
fina
nc
ial th
eory a
nd
pra
ctic
e38 (1) 61-80 (2014)
67way, all three participant groups become involved. As a result, the starting number of participating taxpayers was fairly small; out of 721 large corporate taxpayers in 2010, eighteen responded and were included in the pilot project of horizontal mo-nitoring.5 Table 1 presents the structure by industry of large corporate taxpayers in Slovenia in 2010.
table 1Structure of large corporate taxpayers by industry in Slovenia, 2010
Industry all large corporate taxpayers Included in horizontal monitoringnumber Percent number Percent
Finance and insurance 90 12.5 13 72.2
Pharmaceuticals 2 0.3 2 11.1Others 629 87.2 3 16.7Total 721 100.0 18 100.0
Source: Own calculations.
Once the responses were obtained, meetings took place between the top manage-ment of those taxpayers and the management of the tax administration, where details of the project were presented. From the very beginning, the project was based on the following grounds: (1) taxpayers joined the program with the expec-tation that horizontal monitoring would increase tax certainty, which is required for everyday business; (2) the tax administration made it clear from the outset that during the program it would not perform tax advising in the sense of optimizing tax liabilities; and (3) rights and obligations deriving from existing regulations would remain unchanged.
Based on these initial meetings, cooperation agreements were signed with the participating taxpayers. The taxpayers thereby committed themselves to infor-ming the tax administration about issues related to their operations that may invo-lve tax risks. On the other hand, the tax administration offered to provide prompt opinions based on existing regulations and to monitor internal control mecha-nisms of the participants.
The agreements do not interfere with the ongoing tasks of the tax administration.6 However, the Horizontal Monitoring pilot project may lead to potential amen-dments to the tax regulation, enabling the project’s permanent implementation.
5 In 2011, there were 695 large corporate taxpayers, their share in total turnover amounting to 54.4% and employing 39.2% of all employees in Slovenia (AJPES, 2012). Of the eighteen large corporate taxpayers that responded to the public call, thirteen were financial and/or insurance companies with 11,427 employees, two were pharmaceutical companies with 6,136 employees, and three were other companies with 17,774 employees altogether (Šinkovec, 2012c).6 During the Horizontal Monitoring project, the tax administration performs all of its ordinary services, such as supervision procedures or interpretation of tax legislation. Should the tax administration and taxpayer disa-gree about the interpretation of tax laws, a supervision procedure can be carried out according to the provi-sions of the Tax Procedure Act.
mir
oslav v
erb
ič, mitja č
ok, d
ar
ija šink
ov
ec: so
me ev
iden
ce fo
r implem
entin
g an en
ha
nc
ed relatio
nsh
ip in slov
enia
fina
nc
ial th
eory a
nd
pra
ctic
e38 (1) 61-80 (2014)
68 Compared to tax audits, which are retrospective in nature and concentrate on irre-gularities in tax returns already submitted, Horizontal Monitoring focuses on the present and future operations of taxpayers and their interactions with the tax ad-ministration. Horizontal Monitoring is derived from business processes and on-going transactions; it examines the existence and efficiency of internal tax con-trols and focuses on risks that appear before taxpayers submit their tax returns. Current issues related to the project are resolved at meetings with members of working groups. Where such topics are relevant to other taxpayers, the results are published on the tax administration’s website.
Operating in a complex environment that is subject to changes, these issues are especially significant for large corporate taxpayers. They have to operate interna-tionally and face complex financial and fiscal structures related to tax risks in areas such as transfer prices, permanent establishments, and offshore activities. They encounter constant amendments to legislation, which they need to comply with and adjust to by changing their business processes, computer software, or even complex information systems. Due to these ongoing changes, possible subsequent audits performed by DURS represent a great burden on taxpayers that are generally willing to voluntarily comply with tax regulations.
Therefore, following the introduction of horizontal monitoring, taxpayers expect a (limited) tax audit, primarily based on a review of the operations of internal tax controls. Instead of extensive and time-consuming audits, covering several years in the past, accuracy controls should be performed to a small extent, based on sampling.
Based on the results of the horizontal monitoring process so far, the advantages that taxpayers perceive in the enhanced relationship are: (1) a reduction of time-consuming components of tax compliance, (2) updated and improved knowledge, and (3) greater tax certainty. Taxpayers expect better responsiveness from DURS to their questions and a confirmation of having accurately understood explana-tions of the legislation, which holds consequences for management’s decisions regarding the financial and tax statements of their companies. They also expect proposals for the improvement of processes and internal control systems. They are willing to participate in preparing proposed amendments to legislation and would like to play an active role in formulating tax standards and legal bases.
3.2 implementation issues of horizontal monitoringAgreements signed between DURS and the participating taxpayers represented a basis for setting up three working groups for implementing horizontal monitoring in the tax administration (Šinkovec, 2012a): (1) a finance and insurance compa-nies group, (2) a pharmaceutical companies group, and (3) a group for other large companies.

mir
oslav v
erb
ič, mitja č
ok, d
ar
ija šink
ov
ec: so
me ev
iden
ce fo
r implem
entin
g an en
ha
nc
ed relatio
nsh
ip in slov
enia
fina
nc
ial th
eory a
nd
pra
ctic
e38 (1) 61-80 (2014)
69Finance and insurance institutions were selected as the first target group based on the studies of international organizations already mentioned because they form the most appropriate group for the pilot project. The mandatory application of Inter-national Financial Reporting Standards, the supervision of the Bank of Slovenia, membership in the Bank Association of Slovenia, and statutory internal audits provide for a high level of tax transparency. This was backed by the DURS analysis for tax audits in banks from 2005 onwards (Centa-Debeljak, 2010), where a relatively low number of tax irregularities emerged in comparison to other indu-stries. The selection of pharmaceutical companies to participate in the pilot project is due to their international status regarding taxation and associated risks (pres-ence on the global market, transfer pricing, and residency status), and the third group includes the remaining large corporate taxpayers, including Mercator,7 the biggest retailer in Slovenia.
Each working group consists of tax administration staff members, who are tax auditors with long-term experience in working with large taxpayers. On the other hand, participating taxpayers also appoint a contact person to communicate with the relevant working group. These working groups perform the project in four steps: (1) they prepare and continue to update the taxpayer’s profile, (2) they con-duct the introductory interview, (3) they monitor the taxpayer’s internal tax con-trols, and (4) they are in charge of continuous monitoring of each participant taxpayer.
The purpose of a taxpayer’s profile is to inform working group members about the taxpayer’s business and tax compliance records. It includes data from tax admini-stration databases (register of taxpayers, tax returns, control data for assessing personal income tax, implemented audit procedures and controls), data from other supervisory authorities, publicly available data about the taxpayer (i.e. from an-nual reports, newspaper articles, websites), and data submitted by the taxpayer itself. This last element is particularly important because in the cooperation agre-ement the taxpayer accepts the responsibility to inform the tax administration about all potential tax risk activities substantially and in a timely manner. The taxpayer’s profile is used by the working group’s members to define the critical segments of the taxpayer’s activities that their attention should focus on.
Equipped with the taxpayer’s profile, the working group organizes an introductory interview in order to establish personal contact with the taxpayer’s representatives and obtain additional internal data on business details, strategic goals, and existing
7 Mercator d.d. is one of the largest Slovenian companies, with 12,000 employees in 2010 (AJPES, 2012). In October 2010, Mercator signed an agreement with DURS to take part in the Horizontal Monitoring pilot pro-ject. The company's participation in the pilot project started on 1 January 2011 and will presumably last for two years. The main benefit the company expects from taking part in the project is greater certainty regarding taxation. In 2011, the operation of internal controls was reviewed in value-added tax accounting. In addition, DURS responded instantly and professionally to questions submitted by the company, and thus contributed to mitigating tax risks regarding major business decisions. For 2012, an audit of internal controls is planned in personal taxes and corporate income tax (Mercator, 2012).

mir
oslav v
erb
ič, mitja č
ok, d
ar
ija šink
ov
ec: so
me ev
iden
ce fo
r implem
entin
g an en
ha
nc
ed relatio
nsh
ip in slov
enia
fina
nc
ial th
eory a
nd
pra
ctic
e38 (1) 61-80 (2014)
70 external and internal control mechanisms so as to further extend its profile. Based on the TCA experience, the introductory interview opens a discussion in five cru-cial areas: (1) the strategic goals of the taxpayer, (2) the internal tax control fra-mework, (3) the information system, (4) tax functions, and (5) external supervi-sion.
The key topic related to strategic goals is the participant’s long-term commitment to voluntarily compliance with tax legislation. At this stage, the top management of the taxpayer is usually included. It turns out that only a few participants (banks) officially accepted the internal tax policy act as an independent document devoted to tax activity (Šinkovec, 2012b). Discussions about the internal tax control fra-mework seek to determine how the taxpayer administers its tax risks. Here the condition that the tax administration set out in the first public call becomes rele-vant, that is, that taxpayers must already have an appropriate internal tax control framework in place. It turns out that companies that are subsidiaries of multinatio-nal corporations generally have a professional approach to tax policy. Several multinationals have introduced codes of conduct and demanded that all members of the group (including Slovenian subsidiaries) comply with specific standards and models (COSO, the Sarbanes-Oxley Act, and the Savings Law). The informa-tion system represents the technical basis and as such plays an important role in exercising tax functions within a taxpayer. Emphasis is thus placed on controlling mechanisms of the information system such as level of risk regarding data loss or accessibility of the information system.
In the introductory interview, the organization of tax functions is also presented. It may be organized in many different ways, depending on the taxpayer’s size and the complexity of its tax obligations, and is usually implemented in several orga-nizational units (accounting, HRM, or sales). It turns out that almost all partici-pants employ at least one tax specialist. During the interview, there is an emphasis on how the company transfers knowledge of tax changes and the tax strategy among its employees, along with how tax risks are recognized and controlled for. It is thus important to find out how tax returns for different taxes are completed.
Another integral part of the introductory interview is obtaining information on the roles of external auditors, advisors, and supervisors in the process of monitoring and facilitating tax compliance at the taxpayer level. This includes information about the frequency of their services (regularly vs. occasionally, or only in the case of difficulties); about the supervision of their performance, and what their attitude is to the taxpayer’s participation in the Horizontal Monitoring program.
The analysis of a taxpayer’s internal tax controls is the most important step in the horizontal monitoring process because its key principle is that the tax administra-tion will rely to the greatest extent possible on the internal tax controls established by the taxpayer. It includes the examination and testing of tax control mechanisms

mir
oslav v
erb
ič, mitja č
ok, d
ar
ija šink
ov
ec: so
me ev
iden
ce fo
r implem
entin
g an en
ha
nc
ed relatio
nsh
ip in slov
enia
fina
nc
ial th
eory a
nd
pra
ctic
e38 (1) 61-80 (2014)
71already established within a particular taxpayer, definition of potential risks regar-ding these mechanisms, and their evaluation. Internal tax controls are evaluated with respect to their accuracy, timely tax reporting, and tax payments, and focus on the following issues (Šinkovec, 2011): (1) who is responsible for various inter-nal controls in the company (including tax controls), (2) how the company exami-nes implementation of the internal control procedures, (3) the level of cooperation among internal ‟controllers”, i.e. the tax specialist, the accountant, and the inter-nal auditor, (4) the approach to tax risks (how often the company discusses them), (5) the relationship between tax compliance and ethics (tax morality), and (6) the degree of tax transparency within the company.
Internal tax control mechanisms are examined for all tax types. Due to its rele-vance among government revenues, its complexity, and the numerous taxpayer questions about its implementation, value added tax (VAT) was covered for all participants as the first tax in this step. The examination includes checking internal control mechanisms for sales and purchase of goods and services (resulting in output and input VAT), verification of VAT documentation, and, finally, the accu-racy of the VAT returns. The selection of documentation for testing purposes is performed with the help of Audit Command Language (ACL) software, such that standard verifications are performed and documents with risks detected are submitted to the taxpayer. Internal controls in VAT go hand in hand with the infor-mation system due to the volume of VAT transactions.
Following the analysis and testing, final reports are prepared by the working groups. Apart from findings of irregularities and deficiencies that may influence tax compliance, final reports include recommendations to the taxpayer’s manage-ment in areas that may influence tax compliance.
The last step in implementing horizontal monitoring is the ongoing process of the continuous monitoring of a taxpayer, based on the taxpayer’s profile already esta-blished and updated, and on access to its internal tax control mechanisms. It inclu-des checking whether the recommendations have been adopted (e.g. establishing additional control points). The scale of continuous monitoring performed by the working group thus mostly depends on the level of internal and external control mechanisms provided by the taxpayer. The more it is able to monitor its processes, the less intensive the tax administration’s activity.
In line with these steps, the tax administration provides tax certainty to the parti-cipating companies because the cooperation agreement obligates the tax admini-stration to respond promptly to every question regarding current legislation. From 1 January 2011 to 30 September 2012, DURS provided 131 answers to the eigh-teen participating taxpayers, with the majority referring to VAT (42.7%), followed by personal income tax (24.4%) and corporate income tax (16.8%), as shown in table 2. During the project, regular meetings between the management of the tax

mir
oslav v
erb
ič, mitja č
ok, d
ar
ija šink
ov
ec: so
me ev
iden
ce fo
r implem
entin
g an en
ha
nc
ed relatio
nsh
ip in slov
enia
fina
nc
ial th
eory a
nd
pra
ctic
e38 (1) 61-80 (2014)
72 administration and the management of taxpayers are organized to promptly re-view and assess phases of the project already performed.
table 2Answers provided by DURS to participating taxpayers, 2011-2012
area of interest number Percent Value added tax 56 42.7Personal income tax 32 24.4Corporate income tax 22 16.8Tax procedure 8 6.1Double taxation avoidance 8 6.1Financial instruments 1 0.8Interests directive 1 0.8Insurance contracts tax 1 0.8Pension insurance 1 0.8Real property transaction tax 1 0.8Total 131 100.0
Source: Šinkovec (2012c), own calculations.
3.3 evaluation of horizontal monitoringFollowing the OECD’s Tax Intermediaries Study of team requirements for suc-cessfully engaging taxpayers within enhanced relationship programs (OECD, 2007), we can perform a qualitative evaluation of the Slovenian Horizontal Moni-toring project.
Regarding the first requirement (i.e. commercial awareness), we can conclude that DURS has made its best efforts to achieve this first by dividing taxpayers in the pilot project into three groups (finance and insurance, pharmaceuticals, and others), and then by appointing the most experienced tax auditors as members of each of these working groups. In so doing, the tax administration increased its ability to understand the given business, the major characteristics of the taxpa-yer’s industry, and its risk appetites. However, the need for additional knowledge and experience, which mainly refers to particular features of individual industries, still increases.
The second requirement is an impartial approach to the resolution of potential disputes. This is reflected in the reasonable expectation of the participant taxpayer that, if disagreements arise as a result of voluntarily disclosed information in the course of the program, the tax authority will act objectively and fairly, and exe-rcise its discretion in a considered, revenue-detached, and proportionate manner. The next requirement, connected to the previous one, is proportionality, aiming to assess whether the total amount of tax declared in the participant’s tax return is in line with the tax authority’s understanding of the underlying tax regulations. Be-cause enhanced communication is an important tool for reducing potential uncer-

mir
oslav v
erb
ič, mitja č
ok, d
ar
ija šink
ov
ec: so
me ev
iden
ce fo
r implem
entin
g an en
ha
nc
ed relatio
nsh
ip in slov
enia
fina
nc
ial th
eory a
nd
pra
ctic
e38 (1) 61-80 (2014)
73tainties and misunderstandings of the tax duties imposed, the program is believed to have been successful in these respects, although the results are difficult to me-asure.
Disclosure and transparency are also essential elements of the reciprocity of the relationship. As stated above, the increased number of questions from taxpayers and opinions answered by DURS in the course of the pilot project reflect a mutual readiness for open discussions, a higher level of mutual trust, and to some extent an influence on drafting amendments to the existing tax regulations. The last re-quirement on the OECD (2007) list is responsiveness. Notwithstanding its limited resources, DURS is taking important steps to improve its promptness and effi-ciency, as well as the professional level of its operations during the program, par-tially due to the incorporation of the experiences of other European tax authorities and a more focused, hands-on approach and communication with individual par-ticipants.
4 non-participation in the enhanced relationshipAfter the public call to all 721 large corporate taxpayers initiated in May 2010 ended, and the eighteen large corporate taxpayers that responded to the call were included in the pilot project of horizontal monitoring, the remaining 703 large corporate taxpayers were subject to a survey of non-participation, designed and implemented in order to determine the reasons for non-participation, the attitude towards horizontal monitoring, and willingness to participate in the future. In line with the experience of TCA with implementing the enhanced relationship, the survey was addressed to the senior management of a company, and this was veri-fied in the questionnaire8 with a question on the position in the company of the actual respondent to the survey. Due to questions on willingness to fulfill tax lia-bilities and to cooperate with the tax administration, the anonymity of the respon-dent was ensured by a return envelope being enclosed.
In order to minimize the costs of the survey, 20% of the non-participating large corporate taxpayers were randomly selected, resulting in a sample of 140 large corporate taxpayers9 to whom the questionnaires were sent. Out of 140 compa-nies, fifty-one responded, with a response rate of 36.4% and covering 7.3% of all non-participating large corporate taxpayers in Slovenia. Table 3 presents the struc-ture of the sample of non-participating large corporate taxpayers by industry. The information on the industry of a large corporate taxpayer that responded to the survey was gathered by introducing a corresponding question in the survey que-stionnaire.
8 Due to obvious spatial limitations, the survey questionnaire is not included in the article, but it is available upon request. In this article, only the results of the most relevant questions are addressed.9 In 2011, the 140 large corporate taxpayers from the survey sample had a 10.6% share in total turnover and employed 7.6% of all employees in Slovenia (AJPES, 2012).
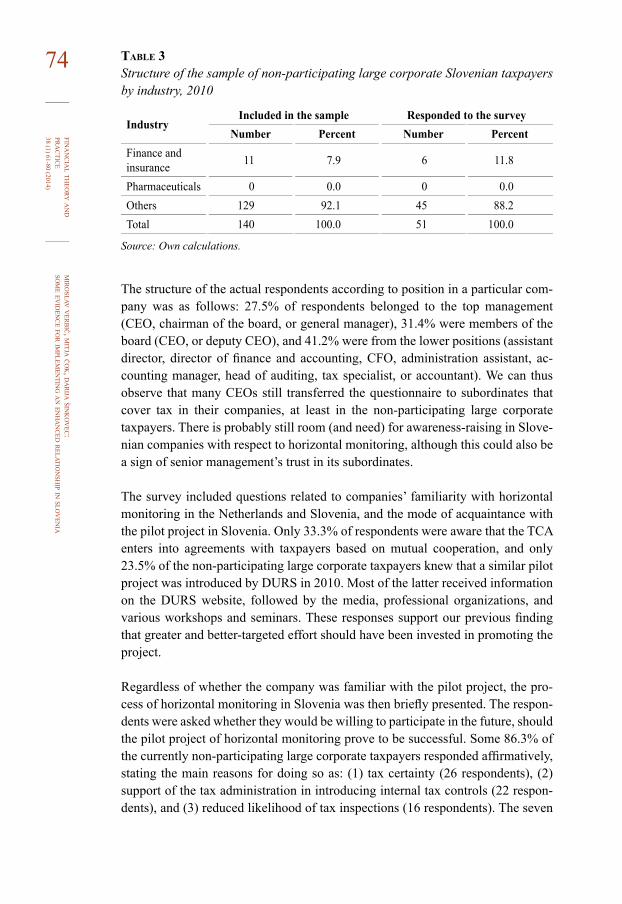
mir
oslav v
erb
ič, mitja č
ok, d
ar
ija šink
ov
ec: so
me ev
iden
ce fo
r implem
entin
g an en
ha
nc
ed relatio
nsh
ip in slov
enia
fina
nc
ial th
eory a
nd
pra
ctic
e38 (1) 61-80 (2014)
74 table 3Structure of the sample of non-participating large corporate Slovenian taxpayers by industry, 2010
IndustryIncluded in the sample Responded to the survey
number Percent number PercentFinance and insurance 11 7.9 6 11.8
Pharmaceuticals 0 0.0 0 0.0Others 129 92.1 45 88.2Total 140 100.0 51 100.0
Source: Own calculations.
The structure of the actual respondents according to position in a particular com-pany was as follows: 27.5% of respondents belonged to the top management (CEO, chairman of the board, or general manager), 31.4% were members of the board (CEO, or deputy CEO), and 41.2% were from the lower positions (assistant director, director of finance and accounting, CFO, administration assistant, ac-counting manager, head of auditing, tax specialist, or accountant). We can thus observe that many CEOs still transferred the questionnaire to subordinates that cover tax in their companies, at least in the non-participating large corporate taxpayers. There is probably still room (and need) for awareness-raising in Slove-nian companies with respect to horizontal monitoring, although this could also be a sign of senior management’s trust in its subordinates.
The survey included questions related to companies’ familiarity with horizontal monitoring in the Netherlands and Slovenia, and the mode of acquaintance with the pilot project in Slovenia. Only 33.3% of respondents were aware that the TCA enters into agreements with taxpayers based on mutual cooperation, and only 23.5% of the non-participating large corporate taxpayers knew that a similar pilot project was introduced by DURS in 2010. Most of the latter received information on the DURS website, followed by the media, professional organizations, and various workshops and seminars. These responses support our previous finding that greater and better-targeted effort should have been invested in promoting the project.
Regardless of whether the company was familiar with the pilot project, the pro-cess of horizontal monitoring in Slovenia was then briefly presented. The respon-dents were asked whether they would be willing to participate in the future, should the pilot project of horizontal monitoring prove to be successful. Some 86.3% of the currently non-participating large corporate taxpayers responded affirmatively, stating the main reasons for doing so as: (1) tax certainty (26 respondents), (2) support of the tax administration in introducing internal tax controls (22 respon-dents), and (3) reduced likelihood of tax inspections (16 respondents). The seven
mir
oslav v
erb
ič, mitja č
ok, d
ar
ija šink
ov
ec: so
me ev
iden
ce fo
r implem
entin
g an en
ha
nc
ed relatio
nsh
ip in slov
enia
fina
nc
ial th
eory a
nd
pra
ctic
e38 (1) 61-80 (2014)
75respondents that would not like to participate in the project justified their response with: (1) distrust of DURS (three respondents), (2) possible costs related to intro-ducing internal tax controls (two respondents), (3) insufficient information about the project (five respondents), and (4) lack of resources in general (two respon-dents).
There was also a question in the survey about the importance of internal tax con-trols. Some 35.3% of respondents found them important and stated that they are already established in their companies, and another 41.2% thought that internal tax controls are important and would like to receive support from DURS in order to establish them. Moreover, an additional 11.8% of non-participating large cor-porate taxpayers deemed internal tax controls important, although they would like to establish them with the support of external experts. The responses demonstrate a high level of readiness of taxpayers to establish a system of internal tax controls, which is an important condition for voluntary exercise of tax liabilities.
The results presented in this section provide important information for future de-cision-making by the tax authorities with respect to horizontal monitoring. Alongside more and better-targeted promotion of the project in the future, DURS should probably place more emphasis on the particular benefits of participating in horizontal monitoring, with demonstrations of existing good practices in Slove-nia.10
5 concluding remarksThe enhanced relationship represents a modern approach of the tax administration to taxpayers and tax intermediaries. Even though this concept is relatively new, it has already proven successful in several countries, and it is leading to improved cooperation between tax administrations and taxpayers. It is resulting in better supervision and a higher level of voluntary tax compliance. With the cooperation of the TCA, in 2010 DURS launched a pilot version of an enhanced relationship project called Horizontal Monitoring, with the main purpose of improving the relationship with a selected group of large taxpayers that are willing to comply voluntarily. The key characteristic of such an enhanced relationship is that it tran-sforms the standard methods of vertical taxpayer supervision into a horizontal partnership.
So far, horizontal monitoring has proved to be successful. Based on experience and evidence to date, taxpayers are showing greater willingness to cooperate with DURS and disclose their operations related to tax risks. They benefit from greater tax certainty through prompt and regular two-way communication with DURS. Both parties thus benefit from experience and mutually recognized know-how because the project has already induced additional training of employees in charge
10 The outlook is nevertheless encouraging because DURS has been receiving many inquiries, especially in 2012, from companies for inclusion in the project (Šinkovec, 2012c).

mir
oslav v
erb
ič, mitja č
ok, d
ar
ija šink
ov
ec: so
me ev
iden
ce fo
r implem
entin
g an en
ha
nc
ed relatio
nsh
ip in slov
enia
fina
nc
ial th
eory a
nd
pra
ctic
e38 (1) 61-80 (2014)
76 of individual tax procedures. DURS employees are benefiting not only from the new type of relations with taxpayers that are more willing to openly discuss sen-sitive tax issues, but also from cooperation with the TCA. In addition, the results of the project have already enabled improvement of the system of internal tax controls for some participating taxpayers. In the long term, DURS expects to spend fewer resources supervising taxpayers, and thus be able to direct resources to other areas of its work.
Nonetheless, the project has also revealed some shortcomings. The greatest chal-lenge for the participating taxpayers is the implementation of internal tax controls, because this is a time-consuming and expensive process. Some participating taxpayers might also understand horizontal monitoring as a free ‟tax optimization service” provided by DURS, without implementing the disclosure of tax risks. Others are concerned about the disclosure of sensitive data related to their day-to-day business. In addition, some concerns have emerged that participation in the project may violate the principle of equality with respect to tax authorities’ tre-atment of participating and non-participating taxpayers (Hauptman, 2011). The results of the survey revealed that DURS should improve promotion of the project in the future, and place more emphasis on particular benefits of participating in horizontal monitoring.
The key elements of the pilot project – transparency, trust, and understanding – have nevertheless been fulfilled, and the project represents the right direction for further development of DURS. Because the final phase of the incipient implemen-tation of enhanced relationship has passed (December 2012), the tax administra-tion must determine whether the Slovenian tax environment is sufficiently deve-loped to allow the general introduction of such an approach, whereby all taxpayers that are willing to comply voluntarily disclose their risks and establish an effective system of internal tax controls. Given the experience and evidence from the pilot project to date, it would be reasonable to include (at least) other appropriate large taxpayers.
However, several legal amendments would be necessary for the large-scale intro-duction of horizontal monitoring, and even amended legislation cannot cover all taxpayers, although it could definitely include additional groups of suitable and motivated companies. Based on existing Slovenian experience and following the TCA approach, serious long-term candidates include consulting and accounting companies. It is also planned that at the end of the pilot project DURS will publish new recommendations for taxation standards, in cooperation with external ex-perts. In the long run, the project is contributing to an improved tax culture and to the tax system in general, and is thereby increasing the international tax attracti-veness of the country.

mir
oslav v
erb
ič, mitja č
ok, d
ar
ija šink
ov
ec: so
me ev
iden
ce fo
r implem
entin
g an en
ha
nc
ed relatio
nsh
ip in slov
enia
fina
nc
ial th
eory a
nd
pra
ctic
e38 (1) 61-80 (2014)
77However, despite our best efforts to analyze and evaluate the process of horizontal monitoring, these conclusions are still based on mostly qualitative findings. The literature on the topic, especially research, has been very scant so far, and quanti-tative measurement of the project effectiveness is still lacking. This is neverthe-less an issue related to horizontal monitoring in general (Stevens et al., 2012). This article is thus only an attempt to narrow the gap between ongoing practical implementation and research on horizontal monitoring, and for the long-term suc-cess of this concept, first and foremost, a set of well-founded measures (perfor-mance indicators) should be designed and enforced.

mir
oslav v
erb
ič, mitja č
ok, d
ar
ija šink
ov
ec: so
me ev
iden
ce fo
r implem
entin
g an en
ha
nc
ed relatio
nsh
ip in slov
enia
fina
nc
ial th
eory a
nd
pra
ctic
e38 (1) 61-80 (2014)
78 references1. AJPES, 2012. Informacija o poslovanju gospodarskih družb v Republiki Slo-
veniji v letu 2011. Ljubljana: Agencija RS za javnopravne evidence in storitve.2. Allingham, M. G. and Sandmo, A., 1972. Income Tax Evasion: A Theoretical
Analysis. Journal of Public Economics, 1(3-4), pp. 323-338. doi: 10.1016/0047-2727(72)90010-2
3. Bugnon, M., 2012. Horizontal Treatment – New Forms and Experiences of Achieving Enhanced Relationship between Tax Administrations, Taxpayers and Tax Intermediaries: The Swiss Approach – With a Focus on the Ruling Practice. Tax Tribune 28, pp. 176-180.
4. Burton, M. and Dabner, J., 2008. The Partnership Model of the Relationship between Tax Administrators and Tax Practitioners: Drivers, Challenges and Prospects. Journal of Australian Taxation, 11(2), pp. 108-137.
5. Centa-Debeljak, M., 2010. Horizontalni monitoring in: Zbornik referatov XXV. posvetovanja Društva računovodij, finančnikov in revizorjev. Marior: Društvo računovodij, finančnikov in revizorjev, pp. 64-75.
6. Centa-Debeljak, M., 2011. Uvedba pilotnega projekta horizontalnega monito-ringa, in: Zbornik referatov 11. davčno-finančne konference. Planet GV, Portorož, pp. 103-113.
7. Dabner, J. and Burton, M., 2012. The ‘Enhanced Relationship’ Model Collides with Reality – The Determinants of the Relationship between Tax Administra-tors and Tax Intermediaries. 2012 International Conference on Law and Socie-ty. Honolulu, HI: The Law and Society Association.
8. Drüen, K.-D., 2012. Enhanced Relationship – A New Impetus for Tax Enforce-ment? Tax Governance: The Future Role of Tax Administration in a Networ-king Society. Vienna: Vienna University of Economics and Business.
9. DURS, 2010. Business Strategy for the Period 2010-2013. Ljubljana: Tax Ad-ministration of the Republic of Slovenia.
10. European Commission, 2011. The Former Yugoslav Republic of Macedonia 2011 Progress Report. Commission Staff Working Paper. Brussels: European Commission.
11. Filipović, V., 2009. Merjenje davčne morale pri podjetnikih posameznikih v Sloveniji. Maribor: Ekonomsko-poslovna fakulteta, Univerza v Mariboru.
12. Fiscalis Risk Management Platform Group, 2010. Compliance Risk Manage-ment Guide for Tax Administrations. Administrative Cooperation and Fight Against Fiscal Fraud, Indirect Taxation and Tax Administration, Directorate-General Taxation and Customs Union. Brussels: European Commission.
13. Freedman, J., Loomer, G. and Vella, J., 2012. Analyzing the Enhanced Rela-tionship Between Corporate Taxpayers and Revenue Authorities: A U.K. Case Study in: Oats, L. (ed.). Taxation: A Fieldwork Research Handbook. London: Routledge, pp. 103-148.

mir
oslav v
erb
ič, mitja č
ok, d
ar
ija šink
ov
ec: so
me ev
iden
ce fo
r implem
entin
g an en
ha
nc
ed relatio
nsh
ip in slov
enia
fina
nc
ial th
eory a
nd
pra
ctic
e38 (1) 61-80 (2014)
7914. Government of the Republic of Croatia, 2012. Programme of the Government of the Republic of Croatia for the Adoption and Implementation of the Acquis for 2012, Zagreb: Government of the Republic of Croatia.
15. Griffin, J., 2006. The Cooperative Approach to Tax Compliance – Working with Large Business. Tax Tribune, 23, pp. 8-10.
16. Hauptman, L., 2011. Davčni management in upravljanje z davčnimi tveganji in: Zbornik referatov XXVI. posvetovanja Društva računovodij, finančnikov in revizorjev. Maribor: Društvo računovodij, finančnikov in revizorjev, pp. 62-81.
17. HMRC, 2012. Tax Compliance Risk Management (TCRM) Manual. London: HM Revenue & Customs.
18. IOTA, 2012. IOTA Knowledge Database ‘Voluntary Compliance Policies and Strategies for Large Taxpayers’. Large Taxpayer Treatment and Audit (LTTA) Area Group. Budapest: Intra-European Organisation of Tax Administrations.
19. IRS, 2012. Internal Revenue Manual (IRM). Washington, DC: Internal Reve-nue Service.
20. Mercator, 2012. Mercator – Annual Report 2011. Ljubljana: Mercator Group & Poslovni sistem Mercator d.d.
21. OECD, 2007. OECD Tax Intermediaries Study. Working Paper 6 – The En-hanced Relationship. Paris: OECD.
22. OECD, 2008. Study into the Role of Tax Intermediaries. Paris: OECD.23. OECD, 2009a. Building Transparent Tax Compliance by Banks. Paris: OECD.24. OECD, 2009b. Managing and Improving Compliance: Recent Developments
in Compliance Risk Treatments, Information Note, Compliance Sub-group, Forum on Tax Administration. Paris: OECD.
25. OECD, 2009c. Experiences and Practices of Eight OECD Countries, Guidan-ce Note, Compliance Management of Large Business Task Group, Forum on Tax Administration. Paris: OECD.
26. OECD, 2010. A Framework for a Voluntary Code of Conduct for Banks and Revenue Bodies, Sixth Meeting of the OECD Forum on Tax Administration. Paris: OECD.
27. Revenue – Irish Tax and Customs, 2005. The Cooperative Approach to Tax Compliance – Revenue Working with Large Business. Dublin: Revenue – Irish Tax and Customs.
28. Šinkovec, D., 2011. Izkušnje s horizontalnim monitoringom prvo leto po uvedbi pilotskega projekta na DURS in: Zbornik referatov XXVI. posveto-vanja Društva računovodij, finančnikov in revizorjev. Maribor: Društvo računovodij, finančnikov in revizorjev, pp. 114-124.
29. Šinkovec, D., 2012a. Practical Experience in Implementing the Horizontal Monitoring Pilot Project in Slovenia. Tax Tribune, 28, pp. 172-175.

mir
oslav v
erb
ič, mitja č
ok, d
ar
ija šink
ov
ec: so
me ev
iden
ce fo
r implem
entin
g an en
ha
nc
ed relatio
nsh
ip in slov
enia
fina
nc
ial th
eory a
nd
pra
ctic
e38 (1) 61-80 (2014)
80 30. Šinkovec, D., 2012b. Izkušnje pri uvajanju horizontalnega monitoringa v praksi in: Zbornik referatov 12. davčno-finančne konference. Portorož: Planet GV, pp. 199-213.
31. Šinkovec, D., 2012c. Status horizontalnega monitoringa. Portorož: Posvet računovodij v bankah, Združenje bank Slovenije.
32. Stevens, L. G. M. [et al.], 2012. Tax Supervision – Made to Measure. The Ha-gue: Committee Horizontal Monitoring Tax and Custom Administration.
33. TCA, 2008. Tax Control Framework – From a Focus on Risks to Being in Control: A Different Approach. Heerlen: TCF Working Group, Co-ordination Group on the Treatment of Very Large Businesses, Netherlands Tax and Cu-stoms Administration.
34. Torgler, B., 2003. Tax Morale, Rule-governed Behaviour and Trust. Constitu-tional Political Economy, 14(2), pp. 119-140. doi: 10.1023/A:1023643622283

siniša slijepč
ević, b
ra
nim
ir bla
ško
vić:
statistica
l detec
tion o
f fra
ud in th
e repo
rting o
f cr
oatia
n pub
lic co
mpa
nies
fina
nc
ial th
eory a
nd
pra
ctic
e38 (1) 81-96 (2014)
81
* The authors would like to thank three anonymous referees for their helpful comments and suggestions.** Received: June 1, 2013 Accepted: December 11, 2013The article was submitted for the 2013 annual award of the Prof. Dr. Marijan Hanžeković Prize.
Siniša SLIJEPČEVIĆUniversity of Zagreb, Department of Mathematics, Bijenička 30, 10000 Zagreb, Croatiae-mail: [email protected]
Branimir BLAŠKOVIĆUniversity of Zagreb, Department of Mathematics, Bijenička 30, 10000 Zagreb, Croatia e-mail: [email protected]
Statistical detection of fraud in the reporting of Croatian public companies
SINIŠA SLIJEPČEVIĆ, PhD.*BRANIMIR BLAŠKOVIĆ, M.A.*
Preliminary communication**JEL: C12, M38, M42doi: 10.3326/fintp.38.1.4

siniša slijepč
ević, b
ra
nim
ir bla
ško
vić:
statistica
l detec
tion o
f fra
ud in th
e repo
rting o
f cr
oatia
n pub
lic co
mpa
nies
fina
nc
ial th
eory a
nd
pra
ctic
e38 (1) 81-96 (2014)
82 abstractStatistical methods based on Benford’s distribution, Z- and χ2-statistics are being successfully applied to detect likely accounting and reporting fraud, for example in the daily usage of the Internal Revenue Service in the USA, and in historical analysis of Greek macroeconomic reporting. We adapt and apply the methodology to the analysis of the reporting of some leading Croatian public companies. We find indications of reporting fraud in several of the companies analyzed. In parti-cular we find correlation between the likelihood of reporting fraud, measured as a deviation from Benford’s law, and reported net income losses, for companies large enough (with a revenue of at least 1 billion kuna). Finally, we suggest appli-cation of the methodology to improve the internal processes, efficiency and effec-tiveness of the State Auditing Office.
Data availability: The data used in the study are corporate data in the public do-main. For legal reasons, however, the identities of the companies are disguised. Contact the first author for the sanitized data sets that can be used to verify and replicate the analysis.
Keywords: Benford’s law, public companies, reporting, fraud detection, auditing
1 introductionThe usage of statistical methods in the analysis and detection of fraud in financial reporting is becoming widespread and necessary. Perhaps the simplest and best known, but still effective test is based on Benford’s law. Newcomb (1881) and later Benford (1938) noted that in a sufficiently large collection of numerical data expressed in a decimal form, the distribution of occurrences of first digits is not uniform (we explain Benford’s distribution in more detail in section 2). Many authors, including Carslaw (1988), Guan et al. (2006), Kinnunen and Koskela (2003), Nigrini (2005), Niskanen and Keloharju (2000), Skousen et al. (2004), Thomas (1989) and Van Caneghem (2002, 2004) investigated the applicability of this fact in accounting and auditing, and specifically in the detection of ‟cosmetic earning management”. It has been shown that the distribution of first digits in fi-nancial reports normally complies with Benford’s law. If, however, there have been a-posteriori ‟cosmetic interventions”, then for both statistical and psycholo-gical reasons, the distribution of first digits changes. As a result, the likelihood of ‟cosmetic earning management” can be statistically verified, and at least theoreti-cally, the reliability of a specific financial report can be quantified.
In Croatia, we applied these statistical fraud detection tools to the financial reports of 7 large Croatian public and state-owned companies, and one publicly traded company with a substantial share owned by the state of Croatia. By analyzing publicly available data for the years 2010 and 2011, we found that at a level of significance 1% and less, the financial reports of 7 (out of 16) annual reports de-viate from Benford’s law.

siniša slijepč
ević, b
ra
nim
ir bla
ško
vić:
statistica
l detec
tion o
f fra
ud in th
e repo
rting o
f cr
oatia
n pub
lic co
mpa
nies
fina
nc
ial th
eory a
nd
pra
ctic
e38 (1) 81-96 (2014)
83While these statistical results are not conclusive evidence of accounting and re-porting fraud, they should be used as an indication for further focused investiga-tion of the State Auditing Office (SAO).
We explain the methodology of application of Benford’s law and its limitations in section 2, including the discussion on why Benford’s law is expected to appear in annual reports for companies large enough. We also put our research in the context of similar analysis done, e.g. by Nigrini and Mittermaier (1997) for accounting data, and by Rauch et al. (2011) in analyzing reported Greek macroeconomic data. We then present our findings in section 3.
In section 4, we consider whether our suggested tests and other more sophisticated statistical tools could be used by the State Auditing Office when planning audits, managing internal resources, and performing actual audits. We also propose some changes to the processes and applicable laws regarding SAO in section 4.
2 the approach, methodology and examples2.1 benford’s distribution in financial reportsPerhaps counter-intuitively, the frequency of occurrence of first digits in a random collection of data is very often not uniform. It was noted first by Newcomb (1881) that ‟how much faster the first pages [of logarithmic tables] wear out than the last ones”, with a heuristic explanation in the form of Benford’s law. Physicist Frank Benford (1938) rediscovered the law. Benford showed that in 20 different tables, ‟including1 such diverse data as areas of 335 rivers, specific heats of 1,389 com-pounds, American League baseball statistics and numbers gleaned from Reader’s Digest articles”, the occurrence of first digits obeys Benford’s law. Several au-thors, most rigorously Hill (1995a, 1995b) with an explicit statistical derivation, demonstrated that in a collection of approximately independent data of different orders of magnitude, the frequency of the first digit d=1,…,9 is approximately
π(d) = log10 d + 1
d (1)
(see table 1 for the actual values).
We can thus observe Benford’s distribution of first digits in many statistical sam-ples, e.g. the heights of the tallest buildings in the world; the production of copper/country, and so on. Benford’s distribution does not occur if the observed values are from a relatively small range, or if the numbers are assigned (e.g. telephone numbers) or fabricated by people, cf. Nigrini (2000). The theoretical reason for this is that the Benford distribution is the only distribution of first digits (see Ben-ford, 1938) invariant for scaling; that is, the distribution does not change if we for example change the currency. This was rigorously shown by Pinkham (1961).
1 Summary from Hill, 1995b.

siniša slijepč
ević, b
ra
nim
ir bla
ško
vić:
statistica
l detec
tion o
f fra
ud in th
e repo
rting o
f cr
oatia
n pub
lic co
mpa
nies
fina
nc
ial th
eory a
nd
pra
ctic
e38 (1) 81-96 (2014)
84 Hill relatively recently gave a more precise theoretical foundation for the ubiquity of Benford’s law (Hill, 1995b). He proved that the sum of independent random variables, which themselves have different (random) distributions, has Benford’s distribution for sufficiently large samples and collections of random variables. Mathematically, the distribution of the sum of random variables converges in di-stribution to Benford’s distribution, which is a form of the Central Limit Theorem (Hill, 1995b:360)2. Hill then concludes (1995b:354) that ‟This helps explain why the significant-digit phenomenon appears in many empirical contexts, and helps explain its recent application to computer design, mathematical modeling, and detection of fraud in accounting data.”
The methods of application of Benford’s law in auditing and tax auditing have been developed by Möller (2009), Nigrini (1996), Nigrini and Mittermaier (1997) and Watrin et al. (2008). As a result, today these statistical methods are actively used for example by the Internal Revenue Service in the USA, by the ‟big four” international auditing companies, and have been implemented as a standard tool in market-leading auditing software tools (e.g. ‟ACL data analytics”). While these statistical methods cannot prove fraud in financial reporting conclusively, as it is not a-priori clear (though probable as explained below) that a financial report obeys Benford’s distribution, it can be at the very least used as a ‟warning tool”. Tax offices and auditing companies use it to identify areas where detailed analysis is required, and so manage its resources and accuracy with much more efficiency.
For companies large enough, financial reports are typically assembled as a collec-tion of individual financial reports of different company units. These units are typically of different sizes, have different business scopes, thus the individual di-stributions of first digits in financials by business unit is expected to be different. By the Hill criterion (1995b), the cumulative financial reports for the entire com-pany should then comply with Benford’s law if the company is large and complex enough.
table 1Benford distribution of first digit, π(d)=log10((d+1)/d)
D 1 2 3 4 5 6 7 8 9π(d) 0.301 0.176 0.125 0.097 0.079 0.067 0.058 0.051 0.046
The statistical tests developed to analyze Benford’s law typically start with testing the following standard criteria for the applicability of Benford’s distribution (Ni-grini and Mittermaier, 1997):
– median is smaller than the arithmetic mean, – skewness is positive.
2 Hill, 1995b, p. 360: ‟Roughly speaking, this law says that if probability distributions are selected at ran-dom and random samples are then taken from each of these distributions in any way so that the overall pro-cess is scale (or base) neutral, then the significant-digit frequencies of the combined sample will converge to the logarithmic distribution.”
siniša slijepč
ević, b
ra
nim
ir bla
ško
vić:
statistica
l detec
tion o
f fra
ud in th
e repo
rting o
f cr
oatia
n pub
lic co
mpa
nies
fina
nc
ial th
eory a
nd
pra
ctic
e38 (1) 81-96 (2014)
85Following that, various statistical tests measure the discrepancy of data sets from Benford’s law. Given a particular sample, such as a collection of financial num-bers from a financial report (balance sheets, profit and loss accounts, cash flows, notes to the report), the appropriate statistical test for the Benford distribution fit is the Pearson χ2-statistics with 8 degrees of freedom (Ramachadran and Tsokos, 2009, section 7.6.3).
χ2 = n i = 1
9 (π(d) − r(d))2
π(d)∑ (2)
here n is the size of the sample, π(d) is the Benford probability of occurrence of the digit d, and r(d) is the actual relative frequency of occurrence of the digit d in the data sample. The χ2 statistics is then used to verify the hypothesis of Benford data fit and report reliability. Thus the null hypothesis is rejected at 5% signifi-cance if the χ2 statistic exceeds 15.51, 1% significance, if χ2 exceeds 20.09, and at 0.1% significance, if the χ2 exceeds 26.13. An illustrative but not entirely accurate interpretation is that it represents 95%, 99%, respectively 99.9% likelihood of fraud.
Another statistics, standardly used for verification of whether the frequency of certain digit significantly varies from Benford’s law is Z statistics:
Zd = n π(d)(1 − π(d)
|π(d) − r(d)| − 1/(2n) , (3)
where d=1,…,9 is a fixed digit, and n, π(d), r(d) is as above. This is for example used in Nigrini and Mittermaier (1997), and further explained in Durtschi, Hilison and Pacini (2004). As checking and analyzing the values of Zd statistics for each value of d is beyond the scope of this communication (this is, for example, typi-cally used to pinpoint locations of possible fraud more precisely), we consider the average of Z statistics for all digits
Z = Zd .d = 1
919 ∑ (4)
Here the hypothesis rejection values are as they usually are for Z-statistics.
It is noted for example by Rauch et al. (2011) that χ2 statistics is also typically larger for larger samples. To compensate for this and verify the methodology, we also calculate χ2/n, where n is the size of the sample for each country. In addition, we consider an alternative statistics, the normalized Euclidian distance measure
d* = ∑9
d=1((π(d) − r(d))2
∑8d=1π(d)2 + (1 − π(9))2
(5)

siniša slijepč
ević, b
ra
nim
ir bla
ško
vić:
statistica
l detec
tion o
f fra
ud in th
e repo
rting o
f cr
oatia
n pub
lic co
mpa
nies
fina
nc
ial th
eory a
nd
pra
ctic
e38 (1) 81-96 (2014)
86 as in Cho and Gaines (2007) and the distance measure
a* = |μe
− μb|9 − μb
(6)
where µe and µb are the average of the first digit in the data and for Benford’s di-stribution respectively, as in Judge and Schechter (2009).
Several authors (e.g. Nigrini and Mittermaier, 1997) also use analysis of frequen-cies of second, third digits, etc. The Benford distribution of second digits is also non-uniform, and is expected to appear in data samples by the same argument as in Pinkham (1961) and Hill (1996). (One of the authors in Slijepčević (1998) ex-plicitly calculated second digit Benford’s frequencies, and proved that they appear in certain series of numbers.) However the variation in Benford’s frequencies of second digits is much smaller than the variation of first digits (and this difference diminishes with the third digit and so on), and typically requires large data sam-ples (over 10,000 data points in individual samples in e.g. Nigrini and Mitterma-ier, 1997).
Finally, we note the similarity of our techniques to those of Rauch et al. (2011), who studied macroeconomic data for various European Union (EU) companies. In a way similar to ours, Rauch et al. (2011) studied a limited set of publicly availa-ble (mostly) financial data of different meanings and types, and obtained results quantitatively close to ours. This is similar to our approach to the outside-in analysis of published financial reports, and differs from e.g. Nigrini and Mitterma-ier (1997), a work analyzing confidentially obtained data of the same type.
2.2 the methodologyWe focus in our analysis on publicly available data, obtained from annual reports of large companies. Our approach, partially by necessity-driven by the availability of data, differs somewhat from the typical approach in the literature when ac-counting data are statistically checked for fraud. Typically authors analyze large data sets of transactions of the same or similar type obtained from the companies themselves and not publicly available. For example Nigrini (1996) analyzes the amounts of total interest paid from 200,000 tax returns; and Nigrini and Mitterma-ier (1997) consider the sample of over 30,000 invoices paid by the same company.
We, however, choose to use all financial data3 from publicly available financial reports. We then test the hypothesis H0: the distribution of first digits in financial reports obeys Benford’s law.
3 In practice, we data mined all the numbers from financial reports (available in pdf format), and then manu-ally excluded all non-financial data (such as years, numbers of employees, etc.).
siniša slijepč
ević, b
ra
nim
ir bla
ško
vić:
statistica
l detec
tion o
f fra
ud in th
e repo
rting o
f cr
oatia
n pub
lic co
mpa
nies
fina
nc
ial th
eory a
nd
pra
ctic
e38 (1) 81-96 (2014)
87We explained in the previous section why financial data of large companies should obey Benford’s distribution. A valid question is whether the companies in our sample are large enough for a meaningful statistical analysis. We argue that this is indeed the case. In section 4 we show that we obtain statistically similar discre-pancies from Benford’s law for 4 smaller companies in our sample (defined in accordance to revenue, as these with annual revenue less than 1 billion kuna), and for 4 larger companies. If the studied companies had been too small for this analysis, the statistical deviation would have been significantly higher for smaller companies, as we would not have reached the threshold for which the Hill argu-ment (1995b) applies.
Our approach consisted of five steps: (1) data mining, (2) descriptive statistics and verification of Benford’s law in the entire sample, (3) application of χ2 statistics, Z statistics and other tests to individual financial reports, (4) ranking of the compa-nies according to χ2 and χ2/n statistics, and finally (5) consideration of correlations of findings with the company size, the amount of data, and reported financial re-sults.
Our intention was to analyze all available data for Croatian public companies and institutions, with at least several hundred (in our case at least 300) financial data points. Only 7 public companies satisfied that criteria. We also added one publicly traded company with a large share owned by the State of Croatia (the State is the controlling shareholder), to the sample.
For legal reasons, we do not reveal the names of the companies. In this analysis we denote them consistently with letters A, B, C, D, E, F, G, H. We sorted them so that A is the largest company by annual revenue, and H the smallest. Here A, B, C, D are the ‟larger” companies, with annual revenues exceeding 1 billion kuna, and E, F, G, H are ‟smaller” companies, with annual revenues less than 1 billion kuna; but in no case less than 300 million kuna. The companies in the sample cover a range of industries, including financial services, energy, transport and infrastruc-ture, and consumer goods.
Unfortunately, available data for some major Croatian public companies, inclu-ding Hrvatske šume (National Forests), Hrvatske vode (National Water Com-pany), Hrvatska lutrija (National Lottery), and HAC (Croatian Motorways), were not sufficient, as the published annual reports typically include only sparse bala-nce sheet and profit and loss summaries without details. The published reports on audits of various ministries, public institutions and companies on the web page of the State Auditing Office (www.revizija.hr) contained in all instances we looked into also too few data points. We would be happy to extend our analysis if given access to further information.

siniša slijepč
ević, b
ra
nim
ir bla
ško
vić:
statistica
l detec
tion o
f fra
ud in th
e repo
rting o
f cr
oatia
n pub
lic co
mpa
nies
fina
nc
ial th
eory a
nd
pra
ctic
e38 (1) 81-96 (2014)
88 The first step, data mining, included developing a simple software tool to extract all data from an annual report in a PDF format, downloaded from web pages of respective companies. All the data had to be manually checked for consistency. We had to manually verify that the extracted data contain only financial informa-tion, and exclude numbers such as years, percentages, etc. We then applied several tools of descriptive statistics as a first check of applicability of Benford’s law. We first noted that the cumulative data (n=24,596) from the financial reports for all eight companies for years 2010 and 2011 indeed fit Benford’s distribution as ex-pected. We also demonstrate that all data sets pass the median vs. arithmetic mean, and skewness tests.
We then ranked the companies and reports (all 16 data samples), in accordance to all five statistics χ2, Z, χ2/n, d* and a*. Our analysis will show that rankings are consistent.
We also considered testing the frequency of second (and later) digits. However as explained in section 2.1, our data samples are too small to statistically significa-ntly detect variations in these distributions.
We finally consider as the final step whether our analysis can be interpreted in such a way as to indicate likelihood of fraud. More precisely, our hypothesis is H0: discrepancy from Benford’s law is not correlated with the reported net income; while its alternative is H1: discrepancy from Benford’s law is positively correlated with reported losses. The rationale for this is that both the accounting fraud, and reported losses of public companies are expected to be correlated with less com-petent management and corruption. In other words, we conjecture that public companies reporting losses would report even worse financial results without ‟co-smetic management” of reports.
We analyze this by first considering the correlation of deviation from Benford’s law, measured by χ2 and Z statistics, with the company size. Then we consider the correlation of likelihood of fraud and reported net losses. As our data set is limited and the actual net income numbers are disguised in this analysis, we study corre-lation by comparing rankings rather than more precise tools such as regression.
3 findings: statistical analysis of annual reports3.1 applicability of the methodologyPrior to applying the statistical tests to the analyzed financial data of eight large public companies in Croatia, we confirmed that Benford’s law statistical tests are probably applicable. Firstly, each data set contained at least 300 individual num-bers (see N in table 4). Here we included only financial data, and excluded as

siniša slijepč
ević, b
ra
nim
ir bla
ško
vić:
statistica
l detec
tion o
f fra
ud in th
e repo
rting o
f cr
oatia
n pub
lic co
mpa
nies
fina
nc
ial th
eory a
nd
pra
ctic
e38 (1) 81-96 (2014)
89 required all other numbers from the financial report. In each instance, we verified that the financial data in the sample indeed includes the values of several (at least four) orders of magnitude.
figure 1First digit frequency in the cumulative sample (below)
9,000
8,000
7,000
6,000
5,000
4,000
3,000
2,000
1,000
01 2 3 4 5 6 7 8 9
Note: We plot the frequency of first digits in the cumulative data set (n=24,596) – full line, com-pared with the expected Benford’s law frequency – dashed line.
We then showed that the aggregate data set, that means all the financial data from all 16 financial reports, complies fairly well with Benford’s law, as shown in figu-re 1 and table 2.
table 2First digit frequencies in the aggregate data sample (observed and predicted by Benford’s law)
d observed benford1 7,911 7,4002 4,084 4,3283 2,944 3,0714 2,280 2,3825 2,019 1,9466 1,627 1,6467 1,459 1,4268 1,275 1,2579 982 1,125Total 24,581 24,581
We compared for each of 16 data sets whether the arithmetic mean is larger than median, and whether skewness is positive, as these are standard ‟tell-tale” signs for Benford’s law (Nigrini and Mittermaier, 1997). As shown in table 3, each of 16 data sets satisfies these criteria. In table 3 we also for illustrative purposes show these numbers for the aggregate data set, and for the actual theoretical Benford distribution. In addition, we list ratios of frequencies of digits 1 versus 2, and 1 versus 9, confirming Benford-like behavior.

siniša slijepč
ević, b
ra
nim
ir bla
ško
vić:
statistica
l detec
tion o
f fra
ud in th
e repo
rting o
f cr
oatia
n pub
lic co
mpa
nies
fina
nc
ial th
eory a
nd
pra
ctic
e38 (1) 81-96 (2014)
90 table 3Arithmetic mean, median, skewness, ratios of frequencies if 1 vs. 2, 1 vs. 9; all for 16 data samples, the aggregate data sample, and the Benford distribution
company Year Mean Median skewness 1 vs. 2 1 vs. 9A 2010 3.20 2.0 0.91 2.3 11.2A 2011 3.38 3.0 0.78 2.1 9.6B 2010 3.30 3.0 0.90 1.7 7.6B 2011 3.27 2.0 0.86 1.9 8.9C 2010 3.39 3.0 0.80 1.9 7.4C 2011 3.47 3.0 0.74 1.8 7.6D 2010 4.13 3.0 0.41 2.0 2.5D 2011 3.30 3.0 0.80 2.8 26.3E 2010 3.72 3.0 0.56 2.0 7.0E 2011 3.78 3.0 0.58 1.9 4.6F 2010 3.41 3.0 0.77 2.0 8.4F 2011 3.57 3.0 0.70 2.0 5.9G 2010 3.77 3.0 0.63 1.1 3.8G 2011 3.40 3.0 0.80 1.5 7.7H 2010 3.02 2.0 1.04 2.0 13.3H 2011 3.10 2.0 0.95 2.2 13.1Aggregate 3.38 3.0 0.80 1.9 8.1Benford 3.44 3.0 0.80 1.7 6.6
3.2 statistical results and rankingAs we show in table 4, we found out by applying the χ2-test, that the annual reports for four companies deviate at the significance level of 0.1% from Benford’s law. The same 7 data sets deviate from Benford’s law by the average Z statistics at the average significance level of 5% (significance of selected individual digits is thus smaller). We see that in our sample, the χ2-test and the average Z-test ‟flag” the same data sets, and also have completely consistent rankings.
An additional argument in favor of the possible unreliability of some financial reports is the relative consistency in the ranking of the 16 analyzed financial re-ports in accordance with all five statistics considered (χ2, Z, χ2/n, d* and a*). Table 4 shows that the annual reports of H and D relatively consistently lead the ranking for all the considered statistics. We conclude that the financial reports of H, D, and F for both years 2010 and 2011, and A for the year 2010 should be scrutinized by the authorities.
In table 5 we compare the size of data set and the values of χ2 and χ2/n statistics with the aggregate values from Rauch et al. (2011) and find out that our data be-have similarly, as the key values are within the factor 2 of the ones reported in Rauch et al. (2011), as shown in table 5. This is relevant, as Rauch et al. (2011) report on data with known ‟cosmetic management” of reports, and as such a use-ful benchmark.

siniša slijepč
ević, b
ra
nim
ir bla
ško
vić:
statistica
l detec
tion o
f fra
ud in th
e repo
rting o
f cr
oatia
n pub
lic co
mpa
nies
fina
nc
ial th
eory a
nd
pra
ctic
e38 (1) 81-96 (2014)
91table 4Results of statistical tests and ranking
Rankingcompany Year n χ2 Z chi/n χ2 Z chi/n d a*H* 2010 2,120 111.7 3.02 0.053 1 1 4 5 3H* 2011 2,230 84.8 2.54 0.038 2 2 5 6 4D* 2011 294 67.3 2.45 0.229 3 3 1 2 10D* 2010 293 59.0 1.97 0.201 4 4 2 3 2F* 2010 2,353 37.0 1.88 0.016 5 5 10 11 15A* 2010 1,135 32.2 1.70 0.028 6 6 7 7 8F* 2011 2,577 29.8 1.65 0.012 7 7 12 1 1E 2010 641 23.3 1.23 0.036 8 8 6 8 7A 2011 1,272 19.9 1.24 0.016 9 9 11 12 12G 2010 275 18.6 1.25 0.068 10 10 3 4 6E 2011 751 16.9 1.17 0.022 11 11 8 9 5C 2011 4,216 16.1 1.02 0.004 12 12 15 16 16B 2011 891 14.7 1.03 0.016 13 13 9 10 9C 2010 3,709 10.9 1.02 0.003 14 14 16 15 13G 2011 1,027 7.9 0.80 0.008 15 15 14 14 14B 2010 812 7.7 0.80 0.009 16 16 13 13 11
Note: N – the size of the sample. Statistical tests and their ranking as explained in section 2.2.
* Companies and reports deviating from Benford’s law at significance level of 0.1% (χ2 test), res-pectively 5% (the average Z test).
table 5Comparison of the aggregate data sets in our sample and Rauch et al.
aggregate data set size of the sample χ2 χ2/nOur analysis 24,596 80.87 0.0033Rauch et al. (2011) 39,691 69.64 0.0018
3.3 correlations of resultsAs discussed in section 2.1, it is a valid question whether the analyzed companies and data samples are large enough for them to be expected to comply with the Benford distribution. Extrapolating from our limited data sample, it seems that in Croatia, companies with at least 1 billion kuna annual turnover are large enough for meaningful analysis. In table 6, we show the number of data samples identified as significantly deviating from the Benford law, as explained in the previous sec-tion (7 in total). We sort them by company size. We see that, at least in our small data sample, there seems to be no significant correlation of company size and compliance with Benford’s law. We conclude that at least the four larger compa-nies in our sample are large enough for this type of scrutiny. If this were not the case and the companies in our sample were not large and complex enough for Benford’s law to occur (in accordance with Hill’s argument discussed in section 2.1), we would have observed a significantly better Benford fit for larger compa-
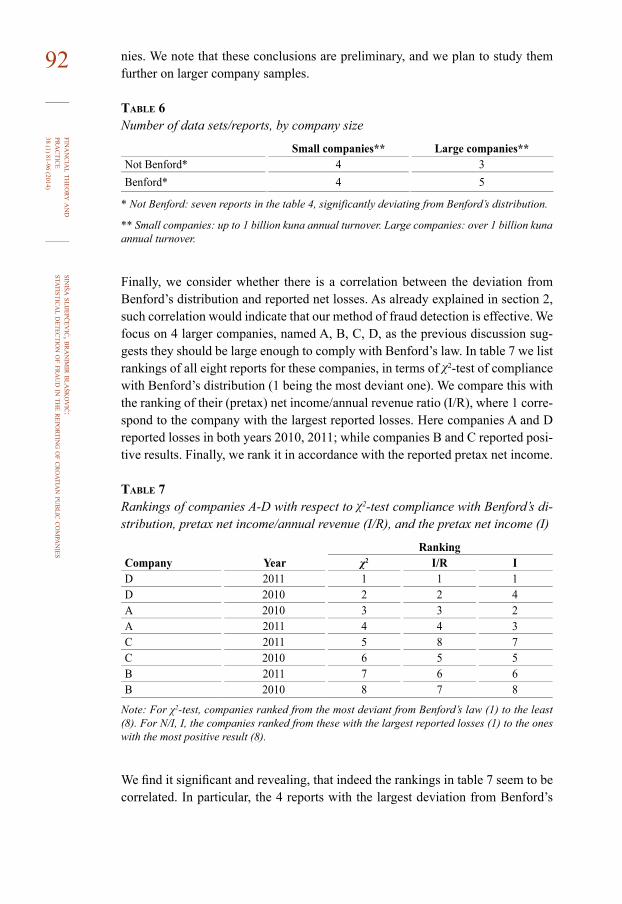
siniša slijepč
ević, b
ra
nim
ir bla
ško
vić:
statistica
l detec
tion o
f fra
ud in th
e repo
rting o
f cr
oatia
n pub
lic co
mpa
nies
fina
nc
ial th
eory a
nd
pra
ctic
e38 (1) 81-96 (2014)
92 nies. We note that these conclusions are preliminary, and we plan to study them further on larger company samples.
table 6Number of data sets/reports, by company size
small companies** large companies**Not Benford* 4 3Benford* 4 5
* Not Benford: seven reports in the table 4, significantly deviating from Benford’s distribution.
** Small companies: up to 1 billion kuna annual turnover. Large companies: over 1 billion kuna annual turnover.
Finally, we consider whether there is a correlation between the deviation from Benford’s distribution and reported net losses. As already explained in section 2, such correlation would indicate that our method of fraud detection is effective. We focus on 4 larger companies, named A, B, C, D, as the previous discussion sug-gests they should be large enough to comply with Benford’s law. In table 7 we list rankings of all eight reports for these companies, in terms of χ2-test of compliance with Benford’s distribution (1 being the most deviant one). We compare this with the ranking of their (pretax) net income/annual revenue ratio (I/R), where 1 corre-spond to the company with the largest reported losses. Here companies A and D reported losses in both years 2010, 2011; while companies B and C reported posi-tive results. Finally, we rank it in accordance with the reported pretax net income.
table 7Rankings of companies A-D with respect to χ2-test compliance with Benford’s di-stribution, pretax net income/annual revenue (I/R), and the pretax net income (I)
Rankingcompany Year χ2 I/R ID 2011 1 1 1D 2010 2 2 4A 2010 3 3 2A 2011 4 4 3C 2011 5 8 7C 2010 6 5 5B 2011 7 6 6B 2010 8 7 8
Note: For χ2-test, companies ranked from the most deviant from Benford’s law (1) to the least (8). For N/I, I, the companies ranked from these with the largest reported losses (1) to the ones with the most positive result (8).
We find it significant and revealing, that indeed the rankings in table 7 seem to be correlated. In particular, the 4 reports with the largest deviation from Benford’s

siniša slijepč
ević, b
ra
nim
ir bla
ško
vić:
statistica
l detec
tion o
f fra
ud in th
e repo
rting o
f cr
oatia
n pub
lic co
mpa
nies
fina
nc
ial th
eory a
nd
pra
ctic
e38 (1) 81-96 (2014)
93law are also the 4 reports with annual net losses, and their rankings of χ2-test (and average Z-test) and I/R coincide. A possible interpretation is that the losses of companies A and D were even larger than reported, and then cosmetically reduced in the final published reports. Again, this analysis is preliminary, and we hope to study it further and confirm for sets of more companies, large enough for a more precise analysis (e.g. linear regression, etc.).
4 summary and conclusionAccounting data are collected from a wide variety of sources. Benford’s law, which defines the empirical distribution of first digits in diverse data sets, can be used to detect manipulated data in financial reporting. We showed that the finan-cial data of large Croatian public and state-owned companies do on average com-ply with Benford’s law, while we found indication of reporting manipulation at the significance level of 1% and less for several of them. Furthermore, we found indi-cation of correlation of deviation from Benford’s law, and reported losses, which is a further indication of reporting fraud.
Here we outline possible implications and recommendations regarding the opera-tions of the State Auditing Office in Croatia. In table 8 we list the year for which SAO completed the audit for the considered companies. It is perhaps striking that for the eight analyzed companies, we found in total only 5 SAO audits for the last five full reporting and audited years 2006-2011. The only company from the con-sidered ones audited for 2011 is company D, where SAO had a qualified opinion.
table 8The last years audited by the State Auditing Office
company YearA 2009B N/AC N/AD 2011E 2009F N/AG 2006H 2007
Source: Državni ured za reviziju.
Independent auditors, however, audit yearly financial statements of the analyzed companies. The auditors auditing analyzed companies include Ernst&Young, BDO Croatia and Deloitte. We found audited annual reports for 7 companies from our sample; and for one of them we could not find a report.
We believe there is a need for more frequent and thorough audits by SAO. We give a few supporting facts. SAO audited in 2012 (i.e. for the year 2011) 23 state owned

siniša slijepč
ević, b
ra
nim
ir bla
ško
vić:
statistica
l detec
tion o
f fra
ud in th
e repo
rting o
f cr
oatia
n pub
lic co
mpa
nies
fina
nc
ial th
eory a
nd
pra
ctic
e38 (1) 81-96 (2014)
94 companies, and issued only 2 unqualified opinions, 20 qualified opinions, and one adverse opinion, as reported in the State Auditing Office (Državni ured za reviziju, 2012). In the specific comparable case of company D, its auditor issued in the annual report an unqualified opinion for 2011, contrary to the SAO opinion. The company management chooses the independent auditor, thus possibly it may have some influence over its opinion in particular in the current challenging market conditions in Croatia. In any case the scope of the SAO audit is typically wider than that of the independent auditors, as it includes for example verification of compliance with public procurement procedures.
SAO audits only the most important and largest public institutions annually and all the others much less frequently, as noted in table 8 and clearly visible in the list of executed audits on www.revizija.hr.
We believe that incorporation of the statistical methods including but not restricted to Benford’s law χ2 and Z statistics could improve effectiveness and efficiency of SAO. For example, SAO could:
– more frequently (at least once annually), in a relatively automated way, look for statistical indications of ‟cosmetic manipulations” for all public institu-tions and companies,
– focused audits could then be performed for the subjects with significant de-viations,
– statistical methods could also assist auditors in focusing their work when auditing a specific subject.
We believe in such a way SAO could, even with the existing, surely limited and constraining, resources, perform better its public service.

siniša slijepč
ević, b
ra
nim
ir bla
ško
vić:
statistica
l detec
tion o
f fra
ud in th
e repo
rting o
f cr
oatia
n pub
lic co
mpa
nies
fina
nc
ial th
eory a
nd
pra
ctic
e38 (1) 81-96 (2014)
95references1. Benford, F., 1938. The law of anomalous numbers. Proceedings of the Ameri-
can Philosophical Society, 78(4), pp. 551-572.2. Carslaw, C. A. P., 1988. Anomalies in income numbers: evidence of goal
oriented behavior. Accounting Review, 63(2), pp. 321-327.3. Cho, W. K. T. and Gaines, B. J., 2007. Breaking the (Benford) Law: Statistical
Fraud Detection in Campaign Finance. American Statistician, 61, pp. 218-223. doi: 10.1198/000313007X223496
4. Državni ured za reviziju. Available at: <www.revizija.hr>.5. Državni ured za reviziju, 2012. Izvješće o radu Državnog ureda za reviziju za
2012. [online]. Available at: <http://www.revizija.hr/izvjesca/2012-rr-2012/izvjesce_o_radu_drzavnog_ureda_za_reviziju_za_2012.pdf>.
6. Durtschi, C., Hillison, W. and Pacini, C., 2004. The effective use of Benford’s law to assist in detecting fraud in accounting data. Journal of Forensic Ac-counting, 5, pp. 17-34.
7. European Commission, 2010a. Report on Greek Government Deficit and Debt Statistics [online]. Available at: <http://epp.eurostat.ec.europa.eu/cache/ITY_PUBLIC/COM_2010_REPORT_GREEK/EN/COM_2010_REPORT_GREEK-EN.PDF>.
8. European Commission, 2010b. Proposal for a Council Regulation (EU) amen-ding Regulation (EC) No 479/2009 as Regards the Quality of Statistical Data in the Context of the Excessive Deficit Procedure [online]. Available at: <http://www.europarl.europa.eu/meetdocs/2009_2014/documents/com/com_com(2010)0053_/com_com(2010)0053_en.pdf>.
9. Guan, L., He D. and Yang, D., 2006. Auditing, Integral Approach to Quarterly Reporting, and Cosmetic Earnings Management. Managerial Auditing Journal, 21(6), pp. 569-581. doi: 10.1108/02686900610674861
10. Hill, T. P., 1995a. Base-Invariance Implies Benford’s Law. Proceedings of the American Mathematical Society, 123(3), pp. 887-895.
11. Hill, T. P., 1995b. A statistical derivation of the significant-digit law. Statistical Science, 10(4), pp. 354-363.
12. Judge, G. and Schechter, L., 2009. Detecting Problems in Survey Data using Benford’s Law. Journal of Human Resources, 44(1), pp. 1-24. doi: 10.1353/jhr.2009.0010
13. Kinnunen, J. and Koskela, M., 2003. Who is Miss World in Cosmetic Earnings Management? A Cross-National Comparison of Small Upward Rounding of Net Income Numbers among Eighteen Countries. Journal of International Ac-counting Research, 2(1), pp. 39-68. doi: 10.2308/jiar.2003.2.1.39
14. Möller, M., 2009. Measuring the Quality of Auditing Services with the Help of Benford’s Law – An Empirical Analysis and Discussion of this Methodical Approach [online]. Available at: <http://ssrn.com/abstract=1529307>.
siniša slijepč
ević, b
ra
nim
ir bla
ško
vić:
statistica
l detec
tion o
f fra
ud in th
e repo
rting o
f cr
oatia
n pub
lic co
mpa
nies
fina
nc
ial th
eory a
nd
pra
ctic
e38 (1) 81-96 (2014)
96 15. Newcomb. S., 1881. Note on the frequency of use of the different digits in natural numbers. American Journal of Mathematics, 4(1), pp. 39-40. doi: 10.2307/2369148
16. Nigrini, M. J. and Mittermaier L. J., 1997. The Use of Benford’s Law as an Aid in Analytical Procedures. Auditing A Journal of Practice and Theory, 16(2), pp. 52-67.
17. Nigrini, M. J., 1996. A Taxpayer Compliance Application of Benford’s Law: Tests and Statistics for Auditors. Journal of the American Taxation Associa-tion, 18, pp. 72-91.
18. Nigrini, M. J., 2000. Digital Analysis Using Benford’s Law. Vancouver, BC.19. Nigrini, M. J., 2005. An Assessment of the Change in the Incidence of Ear-
nings Management around the Enron-Andersen Episode. Review of Accounting and Finance, 4(1), pp. 92-110. doi: 10.1108/eb043420
20. Niskanen, J. and Keloharju, M., 2000. Earnings Cosmetics in a Tax-Driven Accounting Environment: Evidence from Finnish Public Firms. European Ac-counting Review, 9(3), pp. 443-452. doi: 10.1080/09638180020017159
21. Pinkham, R., 1961. On the distribution of first significant digits. Annals of Mathematical Statistics, 32(4), pp. 1223-1320. doi: 10.1214/aoms/1177704862
22. Ramachadran, K. M. and Tsokos, C. P., 2009. Mathematical Statistics with Applications. Burlington: Elsevier AP.
23. Rauch, B. [et al.], 2011. Fact and fiction in EU-governmental data. German Economic Review, 12(3), pp. 243-255. doi: 10.1111/j.1468-0475.2011.00542.x
24. Skousen, C. J., Guan, L. and Wetzel, T. S., 2004. Anomalies and Unusual Pat-terns in Reported Earnings: Japanese Managers Round Earnings. Journal of International Financial Management and Accounting, 15(3), pp. 212-234. doi: 10.1111/j.1467-646X.2004.00108.x
25. Slijepčević, S., 1998. A note on initial digits of recurrence sequences. Fibo-nacci Quarterly, 36(4), pp. 305-308.
26. Thomas, J. K., 1989. Unusual Patterns in Reported Earnings. Accounting Re-view, 64, pp. 773-787.
27. Van Caneghem, T., 2002. Earnings Management Induced by Cognitive Refe-rence Points. British Accounting Review, 34(2), pp. 167-178. doi: 10.1006/bare.2002.0190
28. Van Caneghem, T., 2004. The Impact of Audit Quality on Earnings Rounding-Up Behaviour: Some UK Evidence. European Accounting Review, 13(4), pp. 771-786. doi: 10.1080/0963818042000216866
29. Watrin, C., Struffert, R. and Ullmann, R., 2008. Benford’s Law: An Instrument for Selecting Tax Audit Targets? Review of Managerial Science, 2(3), pp. 219-237. doi: 10.1007/s11846-008-0019-9

the w
or
ld ba
nk:
glo
ba
l fina
nc
ial d
evelo
pmen
t repo
rt 2013: r
ethin
kin
g the r
ole o
f the state in fin
an
ce
fina
nc
ial th
eory a
nd
pra
ctic
e38 (1) 97-101 (2014)
97
* Received: June 10, 2013 Accepted: June 11, 2013 Marijana BAĐUN, PhDInstitute of Public Finance, Smičiklasova 21, 10000 Zagreb, Croatiae-mail: [email protected]
Global Financial Development Report 2013: Rethinking the Role of the State in Finance
The World Bank, Washington D.C., 2012, pp. 194
Book review by MARIJANA BAĐUN* doi: 10.3326/fintp.38.1.5

the w
or
ld ba
nk:
glo
ba
l fina
nc
ial d
evelo
pmen
t repo
rt 2013: r
ethin
kin
g the r
ole o
f the state in fin
an
ce
fina
nc
ial th
eory a
nd
pra
ctic
e38 (1) 97-101 (2014)
98 Both markets and governments fail. Government intervention is most often advo-cated in order to correct market failures but government officials can use state power to achieve different goals: help friends, families, cronies, and political con-stituents. When this occurs, the government can do serious damage in the financial system.
The World Bank's first-ever Global Financial Development Report re-examines a basic question highlighted by the crisis: what is the proper role of the state in fi-nancial development? In the Report the state includes not only the country’s go-vernment but also autonomous or semiautonomous agencies such as a central bank or a financial supervision agency. As it is usually the case with World Bank publications, the Report is very user-friendly. It is organized in five chapters and each of them has the main messages highlighted at the beginning. Moreover, there is an ‟Overview” that summarizes the whole Report. The publication also has an accompanying website (http://www.worldbank.org/financialdevelopment) that contains new datasets and research papers.
What are the main messages highlighted by the authors in the Report? Firstly, there should be caution when it comes to the state's role in financial development. Active state involvement may be helpful in the short run but there is also evidence of potential longer-term negative effects. The state has an important role in provi-ding supervision, ensuring healthy competition and strengthening financial infra-structure, but direct interventions are less welcome. Secondly, incentives are cru-cial in the financial sector. Policies aimed at the financial sector should better align private incentives with public interest without taxing or subsidising private risk-taking. Thirdly, when it comes to regulation and supervision, the basic ingredient is a solid, transparent and not too complex institutional framework. Supervisory action should be strong, timely and anticipatory.
Fourthly, competition is good; it can improve efficiency and enhance access to financial services without necessarily undermining financial stability. Instead of restricting competition, it is necessary to deal with distorted competition, improve the flow of information, and strengthen the contractual environment. The state should encourage contestability through the healthy entry of well-capitalized and the timely exit of insolvent institutions. Fifth, lending by state-owned banks can play a positive role in stabilizing aggregate credit in a downturn, but it can also lead to resource misallocation and deterioration of the quality of intermediation due to the serving of political interests. Oversight of state banks is challenging, especially in weak institutional environments. Finally, the state’s role can be use-ful in promoting transparency of information and reducing counterparty risk, par-ticularly when there are significant monopoly rents that discourage information sharing. These are the common lessons and guidelines but appropriate policies differ across countries and time.

the w
or
ld ba
nk:
glo
ba
l fina
nc
ial d
evelo
pmen
t repo
rt 2013: r
ethin
kin
g the r
ole o
f the state in fin
an
ce
fina
nc
ial th
eory a
nd
pra
ctic
e38 (1) 97-101 (2014)
99The Report makes it clear that the main reasons, besides macroeconomic factors, behind the global financial crisis were major regulatory and supervisory failures. The main weakness in the pre-crisis approach was that it focused on risks to indi-vidual institutions and did not sufficiently take into account systemic risk. The second weakness was that regulation and supervision of banks, insurance and se-curities markets was not complemented by strong oversight at the financial group level. This enabled transactions to be carried through entities that were subject to weaker regulation, or even to completely avoid regulation. Third, some regula-tions were poorly designed, for example the Basel capital adequacy measures con-siderably misrepresented the solvency of banks. Fourth, implementation of the rules was constrained by the capacity and incentives of regulators and supervisors. Financial institutions grew too complex and became interconnected. Some regu-lators lacked independence and others found it difficult to resist pressures and temptations coming from the financial industry.
Common features of non-crisis countries were: a more stringent definition of ca-pital, higher capital levels, and a less complex regulatory framework. They had stricter auditing procedures, limits on related party exposures and asset classifica-tion standards. In addition their supervisors were more likely to require sharehol-ders to support distressed banks with new equity. Furthermore, non-crisis coun-tries were also characterized by better quality of financial information and greater incentive to use that information – among other reasons because they had relati-vely less generous deposit insurance coverage.
The Report stresses that ‟finance is central to development”. In other words, ‟fi-nance matters, both when it functions well and when it functions poorly”. Almost the same message was given in the Foreword of another World Bank (2001) report published more than a decade ago. The authors of both reports claim that finance causes economic growth and even though they acknowledge that there are diffe-rent opinions on this issue, the references they quote are from the last century (e.g. Lucas, 1988; and Robinson, 1952). The authors ignore a vast recent literature that casts doubt on finance as an engine of growth (for a literature review see Bađun, 2009).
Researchers working at the World Bank must be given a lot of credit for collecting and organizing data in a new Global Financial Development Database (available online), which is a great supplement to previously released Financial Deve-lopment and Structure Dataset. The former has data organized in four main cate-gories: financial depth, access, efficiency, and stability. It shows that financial sy-stems widely differ.
Even though conclusions and policies from the Report seem straightforward, an impression stays that it is all easier said than done. The introductory sentence from the 2001 Report was: ‟As the dust settles from the great financial crises of 1997-

the w
or
ld ba
nk:
glo
ba
l fina
nc
ial d
evelo
pmen
t repo
rt 2013: r
ethin
kin
g the r
ole o
f the state in fin
an
ce
fina
nc
ial th
eory a
nd
pra
ctic
e38 (1) 97-101 (2014)
100 98, the potentially disastrous consequences of weak financial markets are appa-rent”. The dust has still not settled from the last financial crisis, far from it, but the mere fact that it happened again shows that John Steinbeck was partly right when in The Grapes of Wrath he wrote: ‟The bank is something more than men, I tell you. It’s the monster. Men made it, but they can’t control it.” However, the same could be said about government.
It seems that the relationship between government and banks/financial sector will always be strong because history shows that crises are inherent to the financial sector, which means that bankers will always be looking for a safety net and re-scue by the government. In addition, bankers have a vested interest in promoting government deficits, which they finance and earn interest on that. Furthermore, the government has a constant conflict of interest since it both regulates banks and uses them as a source of finance. Also, government officials are not benevolent social planners and they will try, if not prevented by law, to maximize their own wealth, not social welfare. Finally, banks can capture the regulators. In the end, the taxpayers or future generations of taxpayers ‟foot the bill” of this complex relationship.

the w
or
ld ba
nk:
glo
ba
l fina
nc
ial d
evelo
pmen
t repo
rt 2013: r
ethin
kin
g the r
ole o
f the state in fin
an
ce
fina
nc
ial th
eory a
nd
pra
ctic
e38 (1) 97-101 (2014)
101references1. Bađun, M. 2009. Financial Intermediation by Banks and Economic Growth: A
Review of Empirical Evidence. Financial Theory and Practice, 33(2), pp. 121-152.
2. Lucas, R. E., 1988. On the Mechanics of Economic Development. Journal of Monetary Economics, 22(1), pp. 3-42. doi: 10.1016/0304-3932(88)90168-7
3. Robinson, J., 1952. The Rate of Interest and Other Essays. London: Macmil-lan.
4. World Bank, 2001. Washington: The World Bank. Available at: <http://www-wds.worldbank.org/external/default/WDSContentServer/IW3P/IB/2001/06/08/000094946_01052404084811/Rendered/PDF/multi0page.pdf>.

PublisherInstitute of Public Finance, Smičiklasova 21, Zagreb, Croatia
Editor-in-ChiefKatarina Ott
Production EditorMarina Nekić
Editorial Board (Institute of Public Finance)Marijana Bađun Anto BajoPredrag BejakovićVjekoslav BratićMihaela BronićMartina FabrisKatarina Ott Ivica UrbanGoran Vukšić
Editorial Advisory BoardHrvoje Arbutina (Faculty of Law, Zagreb, Croatia) Will Bartlett (London School of Economics and Political Science, London, UK)Helena Blažić (Faculty of Economics, Rijeka, Croatia) Balázs Égert (OECD, Paris, France)Edgar L. Feige (Professor of Economics Emeritus at the University of Wisconsin, Madison,
Wisconsin, USA) Božidar Jelčić (Faculty of Law, Zagreb, Croatia) Evan Kraft (American University, Washington D.C., USA and Croatian National Bank,
Zagreb, Croatia)Peter J. Lambert (University of Oregon, Department of Economics, Eugene, USA)Olivera Lončarić-Horvat (Faculty of Law, Zagreb, Croatia) Dubravko Mihaljek (Bank for International Settlements, Basel, Switzerland) Peter Sanfey (European Bank for Reconstruction and Development, London, UK)Bruno Schönfelder (Technical University Bergakademie Freiberg, Faculty of Economics
and Business Administration, Freiberg, Germany)Tine Stanovnik (Faculty of Economics, Ljubljana, Slovenia) Athanasios Vamvakidis (Bank of America Merrill Lynch, London, UK)Hrvoje Šimović (Faculty of Economics and Business, Zagreb, Croatia)
Financial Theory and Practice is abstracted and indexed in: DOAJ (Directory of Open Access Journals, Lund University, Sweden) EBSCO Publishing DatabaseEconLit (American Economic Association’s electronic database), JEL (Journal
of Economic Literature, Pittsburgh, Pennsylvania, USA) HRČAK (Portal of Scientific Journals of Croatia)IBSS (International Bibliography of the Social Sciences, ProQuest, Cambridge, UK) RePEc (Research Papers in Economics)
Editorial OfficeInstitute of Public Finance – Financial Theory and PracticeSmičiklasova 21, Zagreb, Croatia, P.O. BOX 320phone: +385 (0)1 4886 444; 4819 363; fax: +385 (0)1 4819 365web-site: www.fintp.hr; e-mail: [email protected]
SubscriptionAnnual subscription amounts to 400 kuna Payments to account no. HR7024840081100661775, Institut za javne financije, Zagreb; quoting: subscription to Financial Theory and Practice, 2014
Printed in 115 copies
The journal comes out four times a year
The journal is co-financed by the Ministry of Science, Education and Sport of the Republic of Croatia
Computer typesetting and printingKerschoffset Zagreb d.o.o., Zagreb, Ježdovečka 112
Pursuant to the requirements of Article 34 Paragraph 3 of the Media Law (Official Gazette no. 59/2004), in 2013 the total income from sales of the journal Financial Theory and Practice was 33,523.60 kuna and the average print order was 200 copies.

VELIBOR MAČKIĆPolitical budget cycles at the municipal level in Croatia
38 (1) 2014
BRUNA ŠKARICADeterminants of non-performing loans in Central and Eastern European countries
MIROSLAV VERBIČ, MITJA ČOK and DARIJA ŠINKOVEC Some evidence for implementing an enhanced relationship in Slovenia
SINIŠA SLIJEPČEVIĆ and BRANIMIR BLAŠKOVIĆStatistical detection of fraud in the reporting of Croatian public companies
Vol. 38, No. 1 | pp. 1-101March 2014 | Zagreb
udc 336issn 1846-887x
1/2014