Embed Size (px)
Citation preview
DOI: 10.1126/science.1246172, 84 (2014);344 Science et al.Yi Ge Zhang
A 12-Million-Year Temperature History of the Tropical Pacific Ocean
This copy is for your personal, non-commercial use only.
clicking here.colleagues, clients, or customers by , you can order high-quality copies for yourIf you wish to distribute this article to others
here.following the guidelines
can be obtained byPermission to republish or repurpose articles or portions of articles
): April 3, 2014 www.sciencemag.org (this information is current as of
The following resources related to this article are available online at
http://www.sciencemag.org/content/344/6179/84.full.htmlversion of this article at:
including high-resolution figures, can be found in the onlineUpdated information and services,
http://www.sciencemag.org/content/suppl/2014/04/02/344.6179.84.DC1.html can be found at: Supporting Online Material
http://www.sciencemag.org/content/344/6179/84.full.html#relatedfound at:
can berelated to this article A list of selected additional articles on the Science Web sites
http://www.sciencemag.org/content/344/6179/84.full.html#ref-list-1, 9 of which can be accessed free:cites 32 articlesThis article
http://www.sciencemag.org/content/344/6179/84.full.html#related-urls1 articles hosted by HighWire Press; see:cited by This article has been
http://www.sciencemag.org/cgi/collection/oceansOceanography
subject collections:This article appears in the following
registered trademark of AAAS. is aScience2014 by the American Association for the Advancement of Science; all rights reserved. The title
CopyrightAmerican Association for the Advancement of Science, 1200 New York Avenue NW, Washington, DC 20005. (print ISSN 0036-8075; online ISSN 1095-9203) is published weekly, except the last week in December, by theScience
on
Apr
il 3,
201
4w
ww
.sci
ence
mag
.org
Dow
nloa
ded
from
o
n A
pril
3, 2
014
ww
w.s
cien
cem
ag.o
rgD
ownl
oade
d fr
om
on
Apr
il 3,
201
4w
ww
.sci
ence
mag
.org
Dow
nloa
ded
from
o
n A
pril
3, 2
014
ww
w.s
cien
cem
ag.o
rgD
ownl
oade
d fr
om
on
Apr
il 3,
201
4w
ww
.sci
ence
mag
.org
Dow
nloa
ded
from
A 12-Million-Year Temperature Historyof the Tropical Pacific OceanYi Ge Zhang,1* Mark Pagani,1 Zhonghui Liu2
The appearance of permanent El Niño–like conditions prior to 3 million years ago is foundedon sea-surface temperature (SST) reconstructions that show invariant Pacific warm pooltemperatures and negligible equatorial zonal temperature gradients. However, only a few SSTrecords are available, and these are potentially compromised by changes in seawater chemistry,diagenesis, and calibration limitations. For this study, we establish new biomarker-SST recordsand show that the Pacific warm pool was ~4°C warmer 12 million years ago. Both the warmpool and cold tongue slowly cooled toward modern conditions while maintaining a zonaltemperature gradient of ~3°C in the late Miocene, which increased during the Plio-Pleistocene.Our results contrast with previous temperature reconstructions that support the supposition of apermanent El Niño–like state.
Temperatures of the low-latitude PacificOcean substantially influence regional andglobal climates. In particular, the El Niño–
Southern Oscillation (ENSO) dominates Earth’sinterannual climate variability. El Niño is initiatedby the eastward propagation of warm westernPacific equatorial waters that deepen thermoclinedepths and attenuate upwelling rates across theeastern equatorial Pacific (EEP) (1, 2). Region-al sea-surface temperature (SST) change associ-ated with El Niño affects the position and vigorof theWalker circulation andHadley cell, leadingto substantially reduced equatorial SST gradients,higher global mean temperatures, extratropicalheat export, and regional hydrological impacts(1, 2).
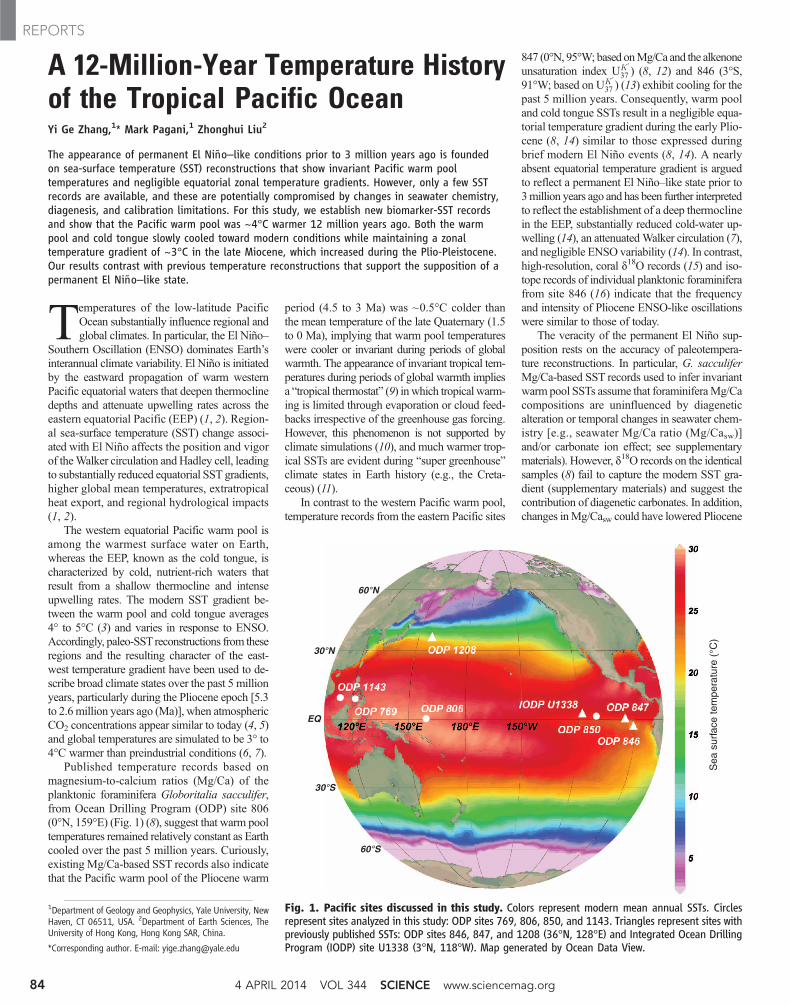
The western equatorial Pacific warm pool isamong the warmest surface water on Earth,whereas the EEP, known as the cold tongue, ischaracterized by cold, nutrient-rich waters thatresult from a shallow thermocline and intenseupwelling rates. The modern SST gradient be-tween the warm pool and cold tongue averages4° to 5°C (3) and varies in response to ENSO.Accordingly, paleo-SSTreconstructions from theseregions and the resulting character of the east-west temperature gradient have been used to de-scribe broad climate states over the past 5 millionyears, particularly during the Pliocene epoch [5.3to 2.6million years ago (Ma)], when atmosphericCO2 concentrations appear similar to today (4, 5)and global temperatures are simulated to be 3° to4°C warmer than preindustrial conditions (6, 7).
Published temperature records based onmagnesium-to-calcium ratios (Mg/Ca) of theplanktonic foraminifera Globoritalia sacculifer,from Ocean Drilling Program (ODP) site 806(0°N, 159°E) (Fig. 1) (8), suggest that warm pooltemperatures remained relatively constant as Earthcooled over the past 5 million years. Curiously,existing Mg/Ca-based SST records also indicatethat the Pacific warm pool of the Pliocene warm
period (4.5 to 3 Ma) was ~0.5°C colder thanthe mean temperature of the late Quaternary (1.5to 0 Ma), implying that warm pool temperatureswere cooler or invariant during periods of globalwarmth. The appearance of invariant tropical tem-peratures during periods of global warmth impliesa “tropical thermostat” (9) in which tropical warm-ing is limited through evaporation or cloud feed-backs irrespective of the greenhouse gas forcing.However, this phenomenon is not supported byclimate simulations (10), and much warmer trop-ical SSTs are evident during “super greenhouse”climate states in Earth history (e.g., the Creta-ceous) (11).
In contrast to the western Pacific warm pool,temperature records from the eastern Pacific sites
847 (0°N, 95°W; based onMg/Ca and the alkenoneunsaturation index UK ′
37 ) (8, 12) and 846 (3°S,91°W; based on UK ′
37 ) (13) exhibit cooling for thepast 5 million years. Consequently, warm pooland cold tongue SSTs result in a negligible equa-torial temperature gradient during the early Plio-cene (8, 14) similar to those expressed duringbrief modern El Niño events (8, 14). A nearlyabsent equatorial temperature gradient is arguedto reflect a permanent El Niño–like state prior to3million years ago and has been further interpretedto reflect the establishment of a deep thermoclinein the EEP, substantially reduced cold-water up-welling (14), an attenuatedWalker circulation (7),and negligible ENSO variability (14). In contrast,high-resolution, coral d18O records (15) and iso-tope records of individual planktonic foraminiferafrom site 846 (16) indicate that the frequencyand intensity of Pliocene ENSO-like oscillationswere similar to those of today.
The veracity of the permanent El Niño sup-position rests on the accuracy of paleotempera-ture reconstructions. In particular, G. sacculiferMg/Ca-based SST records used to infer invariantwarm pool SSTs assume that foraminiferaMg/Cacompositions are uninfluenced by diageneticalteration or temporal changes in seawater chem-istry [e.g., seawater Mg/Ca ratio (Mg/Casw)]and/or carbonate ion effect; see supplementarymaterials). However, d18O records on the identicalsamples (8) fail to capture the modern SST gra-dient (supplementary materials) and suggest thecontribution of diagenetic carbonates. In addition,changes inMg/Casw could have lowered Pliocene
1Department of Geology and Geophysics, Yale University, NewHaven, CT 06511, USA. 2Department of Earth Sciences, TheUniversity of Hong Kong, Hong Kong SAR, China.
*Corresponding author. E-mail: [email protected]
Sea
sur
face
tem
pera
ture
(°C
)
60°N
30°N
EQ
30°S
60°S
Fig. 1. Pacific sites discussed in this study. Colors represent modern mean annual SSTs. Circlesrepresent sites analyzed in this study: ODP sites 769, 806, 850, and 1143. Triangles represent sites withpreviously published SSTs: ODP sites 846, 847, and 1208 (36°N, 128°E) and Integrated Ocean DrillingProgram (IODP) site U1338 (3°N, 118°W). Map generated by Ocean Data View.
4 APRIL 2014 VOL 344 SCIENCE www.sciencemag.org84
REPORTS
SST estimates because fluid inclusion (17) andcarbonate veins (18) data indicate lower Mg/Caswduring the Pliocene. Notably, other warm pooltemperature records derived fromUK ′
37 values (19)are limited by the nature of the temperature proxyitself, which reaches a maximum calculable SSTvalue of ~28.5°C (20) and thus compromises itscapacity to record even higher SSTs (supplemen-tary materials).
In summary, given possible diagenetic over-printing, seawater chemistry changes, and cali-bration limitations, available SST records likelyunderestimate maximum warm pool temperaturesand potentially distort zonal SSTgradient estimates.
For this study, we established new equatorialPacific SST records using the TEX86 temperatureproxy. TEX86 thermometry is founded on the dis-tribution of the archaeal lipid membranes, glycer-ol dialkyl glycerol tetraethers, primarily producedby archaea from the phylum Thaumarchaeota.Thaumarchaeota are aerobic ammonia oxidizers(21), raising concerns that the TEX86 index canalso reflect subsurface temperatures rather than amixed-layer SST. However, available compound-specific carbon-isotope evidence indicates that theTEX86 temperature signal largely derives fromthe ocean mixed-layer (22). Using the current cal-ibration [e.g., (23)], TEX86 tends to overestimateSSTs in the high latitudes and underestimatetemperatures in the low latitudes (24). Indeed,TEX86 SSTs derived from surface sediments ofthe tropical Pacific show slightly lower tem-perature estimates than observed SSTs (see sup-
plementary materials). Nevertheless, the latePleistocene TEX86-derived zonal SST gradientagrees with the modern gradient between sites806 and 850 (supplementary materials) andbroadly captures the temperature characteristicsof these distinct regions. Finally, TEX86 temper-ature reconstructions can record much higherSSTs compared to the alkenone proxy (25),making it a more suitable proxy to evaluate theevolution of warm pool temperatures.
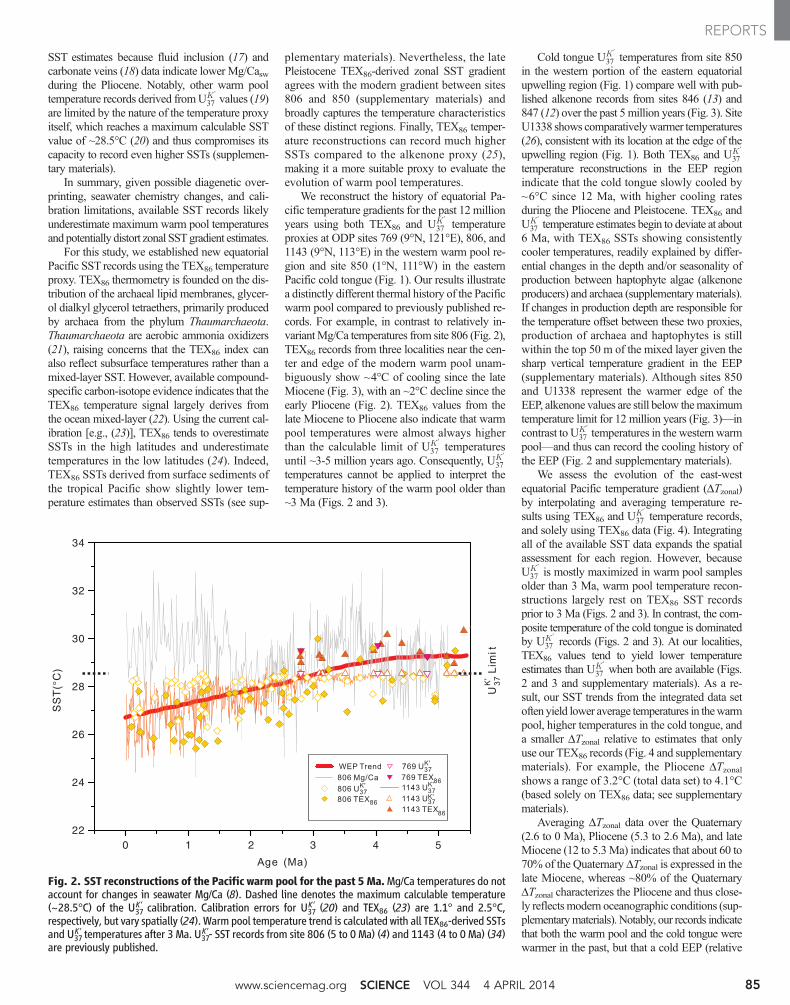
We reconstruct the history of equatorial Pa-cific temperature gradients for the past 12 millionyears using both TEX86 and UK ′
37 temperatureproxies at ODP sites 769 (9°N, 121°E), 806, and1143 (9°N, 113°E) in the western warm pool re-gion and site 850 (1°N, 111°W) in the easternPacific cold tongue (Fig. 1). Our results illustratea distinctly different thermal history of the Pacificwarm pool compared to previously published re-cords. For example, in contrast to relatively in-variantMg/Ca temperatures from site 806 (Fig. 2),TEX86 records from three localities near the cen-ter and edge of the modern warm pool unam-biguously show ~4°C of cooling since the lateMiocene (Fig. 3), with an ~2°C decline since theearly Pliocene (Fig. 2). TEX86 values from thelate Miocene to Pliocene also indicate that warmpool temperatures were almost always higherthan the calculable limit of UK ′
37 temperaturesuntil ~3-5 million years ago. Consequently, UK ′
37temperatures cannot be applied to interpret thetemperature history of the warm pool older than~3 Ma (Figs. 2 and 3).
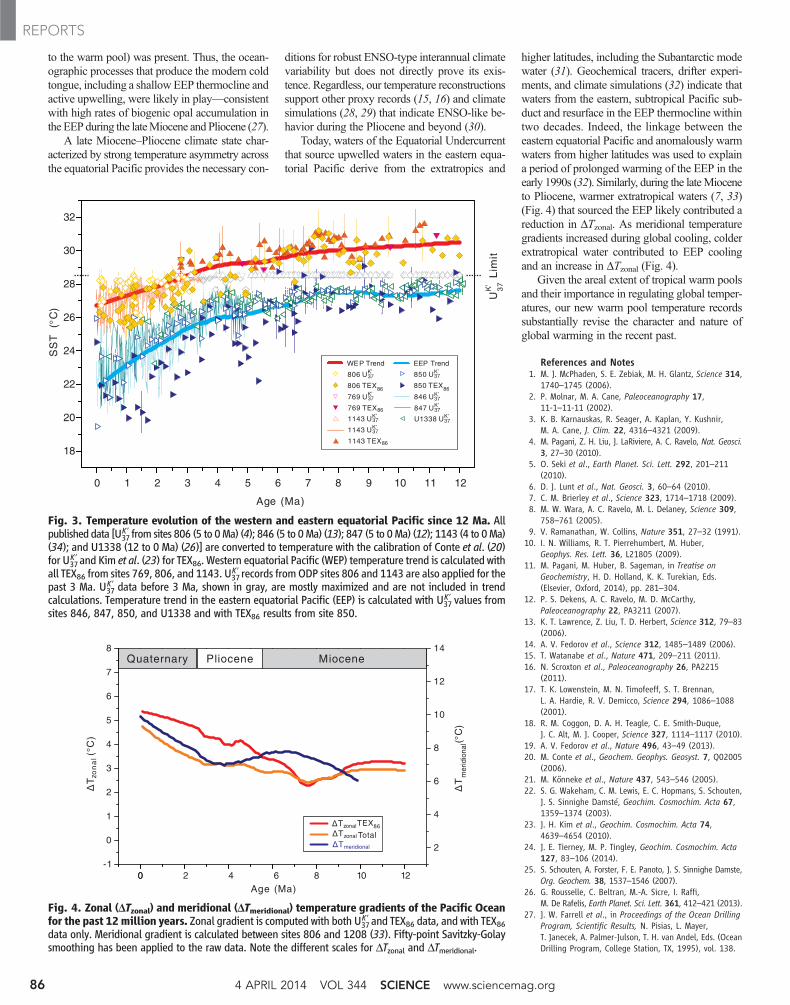
Cold tongue UK ′
37 temperatures from site 850in the western portion of the eastern equatorialupwelling region (Fig. 1) compare well with pub-lished alkenone records from sites 846 (13) and847 (12) over the past 5 million years (Fig. 3). SiteU1338 shows comparativelywarmer temperatures(26), consistent with its location at the edge of theupwelling region (Fig. 1). Both TEX86 and UK ′
37temperature reconstructions in the EEP regionindicate that the cold tongue slowly cooled by~6°C since 12 Ma, with higher cooling ratesduring the Pliocene and Pleistocene. TEX86 andUK ′
37 temperature estimates begin to deviate at about6 Ma, with TEX86 SSTs showing consistentlycooler temperatures, readily explained by differ-ential changes in the depth and/or seasonality ofproduction between haptophyte algae (alkenoneproducers) and archaea (supplementarymaterials).If changes in production depth are responsible forthe temperature offset between these two proxies,production of archaea and haptophytes is stillwithin the top 50 m of the mixed layer given thesharp vertical temperature gradient in the EEP(supplementary materials). Although sites 850and U1338 represent the warmer edge of theEEP, alkenone values are still below themaximumtemperature limit for 12 million years (Fig. 3)—incontrast to UK ′
37 temperatures in the western warmpool—and thus can record the cooling history ofthe EEP (Fig. 2 and supplementary materials).
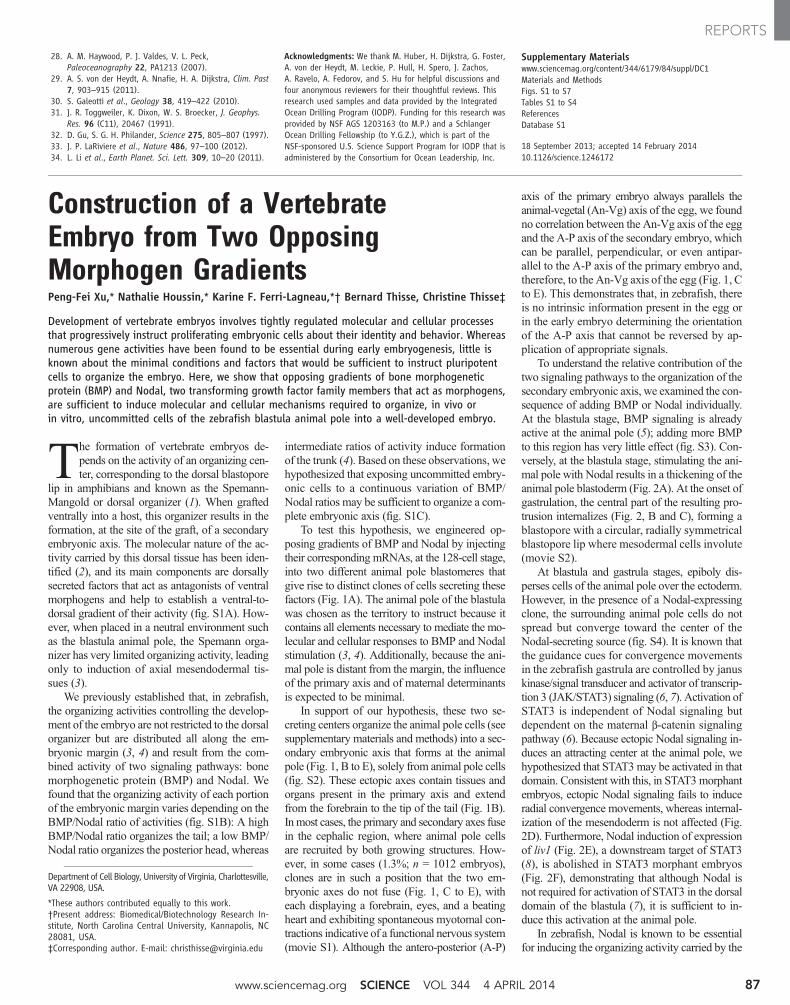
We assess the evolution of the east-westequatorial Pacific temperature gradient (DTzonal)by interpolating and averaging temperature re-sults using TEX86 and UK ′
37 temperature records,and solely using TEX86 data (Fig. 4). Integratingall of the available SST data expands the spatialassessment for each region. However, becauseUK ′
37 is mostly maximized in warm pool samplesolder than 3 Ma, warm pool temperature recon-structions largely rest on TEX86 SST recordsprior to 3 Ma (Figs. 2 and 3). In contrast, the com-posite temperature of the cold tongue is dominatedby UK ′
37 records (Figs. 2 and 3). At our localities,TEX86 values tend to yield lower temperatureestimates than UK ′
37 when both are available (Figs.2 and 3 and supplementary materials). As a re-sult, our SST trends from the integrated data setoften yield lower average temperatures in thewarmpool, higher temperatures in the cold tongue, anda smaller DTzonal relative to estimates that onlyuse our TEX86 records (Fig. 4 and supplementarymaterials). For example, the Pliocene DTzonalshows a range of 3.2°C (total data set) to 4.1°C(based solely on TEX86 data; see supplementarymaterials).
Averaging DTzonal data over the Quaternary(2.6 to 0 Ma), Pliocene (5.3 to 2.6 Ma), and lateMiocene (12 to 5.3Ma) indicates that about 60 to70% of the Quaternary DTzonal is expressed in thelate Miocene, whereas ~80% of the QuaternaryDTzonal characterizes the Pliocene and thus close-ly reflectsmodern oceanographic conditions (sup-plementarymaterials). Notably, our records indicatethat both the warm pool and the cold tongue werewarmer in the past, but that a cold EEP (relative
Fig. 2. SST reconstructions of the Pacific warm pool for the past 5Ma.Mg/Ca temperatures do notaccount for changes in seawater Mg/Ca (8). Dashed line denotes the maximum calculable temperature(~28.5°C) of the U37
K′ calibration. Calibration errors for U37K ′ (20) and TEX86 (23) are 1.1° and 2.5°C,
respectively, but vary spatially (24). Warm pool temperature trend is calculated with all TEX86-derived SSTsand U37
K ′ temperatures after 3 Ma. U37K′- SST records from site 806 (5 to 0 Ma) (4) and 1143 (4 to 0 Ma) (34)
are previously published.
www.sciencemag.org SCIENCE VOL 344 4 APRIL 2014 85
REPORTS
to the warm pool) was present. Thus, the ocean-ographic processes that produce the modern coldtongue, including a shallow EEP thermocline andactive upwelling, were likely in play—consistentwith high rates of biogenic opal accumulation inthe EEPduring the lateMiocene and Pliocene (27).
A late Miocene–Pliocene climate state char-acterized by strong temperature asymmetry acrossthe equatorial Pacific provides the necessary con-
ditions for robust ENSO-type interannual climatevariability but does not directly prove its exis-tence. Regardless, our temperature reconstructionssupport other proxy records (15, 16) and climatesimulations (28, 29) that indicate ENSO-like be-havior during the Pliocene and beyond (30).
Today, waters of the Equatorial Undercurrentthat source upwelled waters in the eastern equa-torial Pacific derive from the extratropics and
higher latitudes, including the Subantarctic modewater (31). Geochemical tracers, drifter experi-ments, and climate simulations (32) indicate thatwaters from the eastern, subtropical Pacific sub-duct and resurface in the EEP thermocline withintwo decades. Indeed, the linkage between theeastern equatorial Pacific and anomalously warmwaters from higher latitudes was used to explaina period of prolonged warming of the EEP in theearly 1990s (32). Similarly, during the lateMioceneto Pliocene, warmer extratropical waters (7, 33)(Fig. 4) that sourced the EEP likely contributed areduction in DTzonal. As meridional temperaturegradients increased during global cooling, colderextratropical water contributed to EEP coolingand an increase in DTzonal (Fig. 4).
Given the areal extent of tropical warm poolsand their importance in regulating global temper-atures, our new warm pool temperature recordssubstantially revise the character and nature ofglobal warming in the recent past.
References and Notes1. M. J. McPhaden, S. E. Zebiak, M. H. Glantz, Science 314,
1740–1745 (2006).2. P. Molnar, M. A. Cane, Paleoceanography 17,
11-1–11-11 (2002).3. K. B. Karnauskas, R. Seager, A. Kaplan, Y. Kushnir,
M. A. Cane, J. Clim. 22, 4316–4321 (2009).4. M. Pagani, Z. H. Liu, J. LaRiviere, A. C. Ravelo, Nat. Geosci.
3, 27–30 (2010).5. O. Seki et al., Earth Planet. Sci. Lett. 292, 201–211
(2010).6. D. J. Lunt et al., Nat. Geosci. 3, 60–64 (2010).7. C. M. Brierley et al., Science 323, 1714–1718 (2009).8. M. W. Wara, A. C. Ravelo, M. L. Delaney, Science 309,
758–761 (2005).9. V. Ramanathan, W. Collins, Nature 351, 27–32 (1991).
10. I. N. Williams, R. T. Pierrehumbert, M. Huber,Geophys. Res. Lett. 36, L21805 (2009).
11. M. Pagani, M. Huber, B. Sageman, in Treatise onGeochemistry, H. D. Holland, K. K. Turekian, Eds.(Elsevier, Oxford, 2014), pp. 281–304.
12. P. S. Dekens, A. C. Ravelo, M. D. McCarthy,Paleoceanography 22, PA3211 (2007).
13. K. T. Lawrence, Z. Liu, T. D. Herbert, Science 312, 79–83(2006).
14. A. V. Fedorov et al., Science 312, 1485–1489 (2006).15. T. Watanabe et al., Nature 471, 209–211 (2011).16. N. Scroxton et al., Paleoceanography 26, PA2215
(2011).17. T. K. Lowenstein, M. N. Timofeeff, S. T. Brennan,
L. A. Hardie, R. V. Demicco, Science 294, 1086–1088(2001).
18. R. M. Coggon, D. A. H. Teagle, C. E. Smith-Duque,J. C. Alt, M. J. Cooper, Science 327, 1114–1117 (2010).
19. A. V. Fedorov et al., Nature 496, 43–49 (2013).20. M. Conte et al., Geochem. Geophys. Geosyst. 7, Q02005
(2006).21. M. Könneke et al., Nature 437, 543–546 (2005).22. S. G. Wakeham, C. M. Lewis, E. C. Hopmans, S. Schouten,
J. S. Sinnighe Damsté, Geochim. Cosmochim. Acta 67,1359–1374 (2003).
23. J. H. Kim et al., Geochim. Cosmochim. Acta 74,4639–4654 (2010).
24. J. E. Tierney, M. P. Tingley, Geochim. Cosmochim. Acta127, 83–106 (2014).
25. S. Schouten, A. Forster, F. E. Panoto, J. S. Sinnighe Damste,Org. Geochem. 38, 1537–1546 (2007).
26. G. Rousselle, C. Beltran, M.-A. Sicre, I. Raffi,M. De Rafelis, Earth Planet. Sci. Lett. 361, 412–421 (2013).
27. J. W. Farrell et al., in Proceedings of the Ocean DrillingProgram, Scientific Results, N. Pisias, L. Mayer,T. Janecek, A. Palmer-Julson, T. H. van Andel, Eds. (OceanDrilling Program, College Station, TX, 1995), vol. 138.
Fig. 4. Zonal (DTzonal) and meridional (DTmeridional) temperature gradients of the Pacific Oceanfor the past 12million years. Zonal gradient is computed with both U37
K ′ and TEX86 data, and with TEX86data only. Meridional gradient is calculated between sites 806 and 1208 (33). Fifty-point Savitzky-Golaysmoothing has been applied to the raw data. Note the different scales for DTzonal and DTmeridional.
Age (Ma)
SS
T(°
C)
U
Lim
itK
'
37
18
20
22
24
26
28
30
32
806 TEX86
806 UK’37
1143 UK’37
1143 TEX86
769 TEX86
850 UK’37
850 TEX86
846 UK’37
847 UK’37
U1338 UK’37
37769 UK’
1143 UK’37
WEP Trend EEP Trend
0 1 2 3 4 5 6 7 8 9 10 11 12
Fig. 3. Temperature evolution of the western and eastern equatorial Pacific since 12 Ma. Allpublished data [U37
K ′ from sites 806 (5 to 0Ma) (4); 846 (5 to 0Ma) (13); 847 (5 to 0Ma) (12); 1143 (4 to 0Ma)(34); and U1338 (12 to 0 Ma) (26)] are converted to temperature with the calibration of Conte et al. (20)for U37
K′ and Kim et al. (23) for TEX86. Western equatorial Pacific (WEP) temperature trend is calculated withall TEX86 from sites 769, 806, and 1143. U37
K ′ records fromODP sites 806 and 1143 are also applied for thepast 3 Ma. U37
K′ data before 3 Ma, shown in gray, are mostly maximized and are not included in trendcalculations. Temperature trend in the eastern equatorial Pacific (EEP) is calculated with U37
K′ values fromsites 846, 847, 850, and U1338 and with TEX86 results from site 850.
4 APRIL 2014 VOL 344 SCIENCE www.sciencemag.org86
REPORTS
28. A. M. Haywood, P. J. Valdes, V. L. Peck,Paleoceanography 22, PA1213 (2007).
29. A. S. von der Heydt, A. Nnafie, H. A. Dijkstra, Clim. Past7, 903–915 (2011).
30. S. Galeotti et al., Geology 38, 419–422 (2010).31. J. R. Toggweiler, K. Dixon, W. S. Broecker, J. Geophys.
Res. 96 (C11), 20467 (1991).32. D. Gu, S. G. H. Philander, Science 275, 805–807 (1997).33. J. P. LaRiviere et al., Nature 486, 97–100 (2012).34. L. Li et al., Earth Planet. Sci. Lett. 309, 10–20 (2011).
Acknowledgments: We thank M. Huber, H. Dijkstra, G. Foster,A. von der Heydt, M. Leckie, P. Hull, H. Spero, J. Zachos,A. Ravelo, A. Fedorov, and S. Hu for helpful discussions andfour anonymous reviewers for their thoughtful reviews. Thisresearch used samples and data provided by the IntegratedOcean Drilling Program (IODP). Funding for this research wasprovided by NSF AGS 1203163 (to M.P.) and a SchlangerOcean Drilling Fellowship (to Y.G.Z.), which is part of theNSF-sponsored U.S. Science Support Program for IODP that isadministered by the Consortium for Ocean Leadership, Inc.
Supplementary Materialswww.sciencemag.org/content/344/6179/84/suppl/DC1Materials and MethodsFigs. S1 to S7Tables S1 to S4ReferencesDatabase S1
18 September 2013; accepted 14 February 201410.1126/science.1246172
Construction of a VertebrateEmbryo from Two OpposingMorphogen GradientsPeng-Fei Xu,* Nathalie Houssin,* Karine F. Ferri-Lagneau,*† Bernard Thisse, Christine Thisse‡
Development of vertebrate embryos involves tightly regulated molecular and cellular processesthat progressively instruct proliferating embryonic cells about their identity and behavior. Whereasnumerous gene activities have been found to be essential during early embryogenesis, little isknown about the minimal conditions and factors that would be sufficient to instruct pluripotentcells to organize the embryo. Here, we show that opposing gradients of bone morphogeneticprotein (BMP) and Nodal, two transforming growth factor family members that act as morphogens,are sufficient to induce molecular and cellular mechanisms required to organize, in vivo orin vitro, uncommitted cells of the zebrafish blastula animal pole into a well-developed embryo.
The formation of vertebrate embryos de-pends on the activity of an organizing cen-ter, corresponding to the dorsal blastopore
lip in amphibians and known as the Spemann-Mangold or dorsal organizer (1). When graftedventrally into a host, this organizer results in theformation, at the site of the graft, of a secondaryembryonic axis. The molecular nature of the ac-tivity carried by this dorsal tissue has been iden-tified (2), and its main components are dorsallysecreted factors that act as antagonists of ventralmorphogens and help to establish a ventral-to-dorsal gradient of their activity (fig. S1A). How-ever, when placed in a neutral environment suchas the blastula animal pole, the Spemann orga-nizer has very limited organizing activity, leadingonly to induction of axial mesendodermal tis-sues (3).
We previously established that, in zebrafish,the organizing activities controlling the develop-ment of the embryo are not restricted to the dorsalorganizer but are distributed all along the em-bryonic margin (3, 4) and result from the com-bined activity of two signaling pathways: bonemorphogenetic protein (BMP) and Nodal. Wefound that the organizing activity of each portionof the embryonic margin varies depending on theBMP/Nodal ratio of activities (fig. S1B): A highBMP/Nodal ratio organizes the tail; a low BMP/Nodal ratio organizes the posterior head, whereas
intermediate ratios of activity induce formationof the trunk (4). Based on these observations, wehypothesized that exposing uncommitted embry-onic cells to a continuous variation of BMP/Nodal ratios may be sufficient to organize a com-plete embryonic axis (fig. S1C).
To test this hypothesis, we engineered op-posing gradients of BMP and Nodal by injectingtheir corresponding mRNAs, at the 128-cell stage,into two different animal pole blastomeres thatgive rise to distinct clones of cells secreting thesefactors (Fig. 1A). The animal pole of the blastulawas chosen as the territory to instruct because itcontains all elements necessary to mediate the mo-lecular and cellular responses to BMP and Nodalstimulation (3, 4). Additionally, because the ani-mal pole is distant from the margin, the influenceof the primary axis and of maternal determinantsis expected to be minimal.
In support of our hypothesis, these two se-creting centers organize the animal pole cells (seesupplementary materials and methods) into a sec-ondary embryonic axis that forms at the animalpole (Fig. 1, B to E), solely from animal pole cells(fig. S2). These ectopic axes contain tissues andorgans present in the primary axis and extendfrom the forebrain to the tip of the tail (Fig. 1B).Inmost cases, the primary and secondary axes fusein the cephalic region, where animal pole cellsare recruited by both growing structures. How-ever, in some cases (1.3%; n = 1012 embryos),clones are in such a position that the two em-bryonic axes do not fuse (Fig. 1, C to E), witheach displaying a forebrain, eyes, and a beatingheart and exhibiting spontaneous myotomal con-tractions indicative of a functional nervous system(movie S1). Although the antero-posterior (A-P)
axis of the primary embryo always parallels theanimal-vegetal (An-Vg) axis of the egg, we foundno correlation between the An-Vg axis of the eggand the A-P axis of the secondary embryo, whichcan be parallel, perpendicular, or even antipar-allel to the A-P axis of the primary embryo and,therefore, to the An-Vg axis of the egg (Fig. 1, Cto E). This demonstrates that, in zebrafish, thereis no intrinsic information present in the egg orin the early embryo determining the orientationof the A-P axis that cannot be reversed by ap-plication of appropriate signals.
To understand the relative contribution of thetwo signaling pathways to the organization of thesecondary embryonic axis, we examined the con-sequence of adding BMP or Nodal individually.At the blastula stage, BMP signaling is alreadyactive at the animal pole (5); adding more BMPto this region has very little effect (fig. S3). Con-versely, at the blastula stage, stimulating the ani-mal pole with Nodal results in a thickening of theanimal pole blastoderm (Fig. 2A). At the onset ofgastrulation, the central part of the resulting pro-trusion internalizes (Fig. 2, B and C), forming ablastopore with a circular, radially symmetricalblastopore lip where mesodermal cells involute(movie S2).
At blastula and gastrula stages, epiboly dis-perses cells of the animal pole over the ectoderm.However, in the presence of a Nodal-expressingclone, the surrounding animal pole cells do notspread but converge toward the center of theNodal-secreting source (fig. S4). It is known thatthe guidance cues for convergence movementsin the zebrafish gastrula are controlled by januskinase/signal transducer and activator of transcrip-tion 3 (JAK/STAT3) signaling (6, 7). Activation ofSTAT3 is independent of Nodal signaling butdependent on the maternal b-catenin signalingpathway (6). Because ectopic Nodal signaling in-duces an attracting center at the animal pole, wehypothesized that STAT3may be activated in thatdomain. Consistent with this, in STAT3morphantembryos, ectopic Nodal signaling fails to induceradial convergence movements, whereas internal-ization of the mesendoderm is not affected (Fig.2D). Furthermore, Nodal induction of expressionof liv1 (Fig. 2E), a downstream target of STAT3(8), is abolished in STAT3 morphant embryos(Fig. 2F), demonstrating that although Nodal isnot required for activation of STAT3 in the dorsaldomain of the blastula (7), it is sufficient to in-duce this activation at the animal pole.
In zebrafish, Nodal is known to be essentialfor inducing the organizing activity carried by the
Department of Cell Biology, University of Virginia, Charlottesville,VA 22908, USA.
*These authors contributed equally to this work.†Present address: Biomedical/Biotechnology Research In-stitute, North Carolina Central University, Kannapolis, NC28081, USA.‡Corresponding author. E-mail: [email protected]
www.sciencemag.org SCIENCE VOL 344 4 APRIL 2014 87
REPORTS

www.sciencemag.org/344/6179/84/suppl/DC1
Supplementary Materials for A 12-Million-Year Temperature History of the Tropical Pacific Ocean
Yi Ge Zhang,* Mark Pagani, Zhonghui Liu
*Corresponding author. E-mail: [email protected]
Published 4 April 2014, Science 344, 84 (2014)
DOI: 10.1126/science.1246172
This PDF file includes:
Materials and Methods Supplementary Text Figs. S1 to S7 Tables S1 to S4 Caption for database S1 References
Other Supplementary Material for this manuscript includes the following: (available at www.sciencemag.org/344/6179/84/suppl/DC1)
Database S1: TEX86- and 37UK ′ -SSTs at ODP Site 769, 806, 850 and 1143, and the equatorial Pacific zonal temperature gradient for the past 12 million years.
2
Materials and Methods
Summary and chronology for Sites 769, 806, 850 and 1143
Sites 769 (Sulu Sea) and 1143 (South China Sea) are located in the marginal seas of
the western Pacific, whereas Pacific Ocean Site 806 is from the Ontong Java plateau of
the open Pacific Ocean. Hole 769B is about 290 m in length and spans the Neogene (1).
The upper Pliocene to Holocene section is a mixture of pelagic biogenic carbonate
sediment and hemipelagic clay. Sediments are primarily clay from the middle Miocene to
upper Pliocene, with minor marls and silts. Hole 1143C is 500 m long and ranges from
the late Miocene to Pleistocene. This core represents continuous hemipelagic
sedimentation of fine-grained terrigenious material and calcareous nannofossils (2). Hole
806B is ~743 m, includes the lowermost Miocene, and composed of foraminifer
nannofossil ooze and chalk to nannofossil ooze and chalk with foraminifers (3). Site 850
is from the eastern equatorial Pacific (EEP), ~400 m deep, captures the middle Miocene
to Pleistocene, and is comprised of nannofossil ooze with varying proportions of other
microfossil constituents (4).
Sample ages were determined by interpolating sample depth to the established
chronology framework detailed in Table S2. Absolute age determinations were calibrated
to the Geomagnetic Polarity Time Scale (GPTS) of Berggren et al. (5, 6). Age data of the
SST time-series from Sites 846 (7),847 (8), 1208 (9) and U1338 (10) derive from their
original publications.
For the past 12 million years, the geographic location of our studied sites moved due
to plate tectonics. The impact of this effect on the paleotemperature records, however, is
difficult to specifically assess. Nevertheless, our multi-site approach demonstrates that
this effect is likely small. For example, Site 850 is currently north of the equator (~1°N)
and reconstructions indicate that it was slightly south of the equator at 5 Ma (4). However,
the record from Site 850 compares well with that from Site 846 (~3°S), which
probably remained in its current position for the entire 5 million years (7).
Lipid extraction and analyses
Sediment samples (30-80g) from Sites 769, 806, 850 and 1143 were freeze-dried
and subject to total lipid extraction using a Dionex ASE 300 extractor with 2:1 (v/v)
dichloromethane/methanol. Total lipid extracts (TLEs) were concentrated under a stream
of purified N2 and subsequently separated into compound fractions by silica-gel
chromatography. Ashed Pasteur pipettes loaded with approximately 0.5 g deactivated
silica gel (70–230 mesh) were sequentially eluted with 2 ml hexane, 4 ml
dichloromethane and 4 ml of methanol to obtain aliphatic, aromatic and polar fractions,
respectively. The methanol fraction containing tetraethers was further purified through a
column of activated alumina dissolved in dichloromethane/methanol (1:1, v/v), dried
3
under pure N2 stream, dissolved in an azeotrope of hexane/isopropanol (99:1, v/v),
filtered through 0.7μm glass microfiber filter, and analyzed on an Agilent 1200 series
high performance liquid chromatography coupled with an Agilent 6130 atmospheric
pressure chemical ionization – mass spectrometer following the methodology of
Hopmans et al., (2000) (11).
Quantification of GDGTs was based on peak intensities of the [M+H]+ ion. Relative
abundances of GDGTs were used to calculate the TEX86 index and then converted to
SSTs using the logarithmic calibration of Kim et al. 2010 (12). Other calibrations
including, the linear (13) and reciprocal relationships (14) were also applied (Fig. S2).
Repeated measurements of an in-house laboratory standard indicate that analytical
precision was ±0.01 TEX86 unit.
The ketone fraction was analyzed on a Thermo Trace 2000 gas chromatography
equipped with a Restek column (60m × 0.25mm × 0.25μm), a Programmable
Temperature Vaporization (PTV) injector and a Flame Ionization Detector (FID).
Relative abundances of C37:3 and C37:2 alkenones were used to compute and
subsequently converted to SSTs using the surface sediment linear calibration of Conte et
al. (2006) (15). Analytical precision, determined through multiple measurements of an in-
house alkenone standard, was ±0.05 unit.
Supplementary Text
1. Uncertainty with Published Mg/Ca-thermometry
Potential biases and complications associated with Mg/Ca records include secular
changes in seawater Mg/Ca, preservation and diagenesis of carbonate material, and non-
temperature controls on Mg partitioning (e.g. salinity and pH).
1.1. Changes in Seawater Mg/Ca
Mg/Ca ratios of Globoritalia sacculifer from Site 806 suggest that Pacific warm
pool temperatures were relatively stable over the past 5 million years (16) — key for
maintaining the appearance of a negligible Pacific zonal temperature gradient during the
Pliocene. Mg/Ca-derived SSTs do not agree with organic temperature proxies and
TEX86, which indicate an ~4°C temperature decrease since the late Miocene and an ~2°C
cooling of the western Pacific warm pool since the early Pliocene. Also, a constant warm
pool temperature over the past 5 Ma is difficult to explain by greenhouse gas forcing,
with atmospheric CO2 levels shown to be some 100 ppm higher in the Pliocene than the
glacial-interglacial levels (17, 18). Previous studies that use the warm pool to calibrate
Earth System climate sensitivity argue that this region is very sensitive to CO2 radiative
forcing (19, 20).

4
Although the evolution of seawater Mg/Ca is not known in detail and Pliocene
seawater ratios have not been directly determined, existing evidence using fluid
inclusions and carbonate veins found on the flanks of mid-ocean ridges support a clear
pattern of increasing Mg/Ca ratios through the Neogene toward the present (21-23).
Geochemical modeling used to simulate Mg/Casw variations (24) have been applied to
correct for foraminiferal Mg/Ca-SSTs for Site 806 (16). These corrections increase warm
pool temperatures in the Pliocene, but when the same correction is applied to the cold
tongue Site 847, the equatorial zonal temperature gradient remains small (25).
1.2. Diagenetic Alterations
The tests of shallow-dwelling foraminifera fall through the water column into
undersaturated (with respect to calcite) waters and interact with pore-water and
potentially experience partial dissolution, recrystallization and the addition of diagenetic
(secondary) calcite. These processes alter the original geochemical signal of the primary
calcite test and might be particularly pronounced for planktonic foraminifera collected
from tropical oceans because of the large surface-to-bottom temperature gradient (26).
Diagenetic abiotic calcite formed in cool bottom waters will have disparate δ18
O values
from planktonic biogenic material and inclusion of this secondary carbonate in the whole-
shell analyses increases δ18
O values and leads to cold-biased temperature estimates. More
pristine foraminiferal tests often have a “glassy” appearance, whereas diagenetically
altered tests appear “frosty” (27). Well-preserved “glassy” foraminifera are often found in
near shore environments with high clay mineral content (28), whereas open ocean
environments of the tropics are associated with carbonate-rich sediments. Indeed,
carbonate diagenesis was responsible for the appearance of cool tropical surface waters
during periods of extreme global warming of the Cretaceous, and promoted the
supposition of a “cool tropic paradox” (29). However, subsequent δ18
O analyses of
“glassy” foraminifera yield distinctly warmer temperature estimates for this period (30).
In particular, well-preserved foraminifera from tropical waters of Tanzania during the
Eocene provide tropical temperature estimates that are higher by 10˚C from previous
estimates (31) and these warmer temperatures agree well with TEX86-SST analyzed on
the same samples. Recently, advances of in situ microanalysis techniques, such as
secondary ion mass spectrometry (SIMS) on foraminifera shells, allow the detection of
diagenetic crystallites from biogenic carbonates and show that the oxygen isotopic values
could differ as much as 4.8‰ on the same test (28).
Foraminifer preservation at tropical Pacific Sites 806 and 847 have not been
thoroughly evaluated. However, late Quaternary stable oxygen isotope records from the
identical samples used for the Mg/Ca records from Site 806 and 847 show a much
smaller Pacific zonal temperature gradient compared to the modern conditions,
highlighting the possible impact of carbonate diagenesis. For example, we converted G.

5
sacculifer δ18
O values (16) to SST, considering modern salinity and seawater δ18
O
differences at the two sites (Table S3). Calculations were made for 0-130 kyr (roughly
the last glacial-interglacial cycle) and 0-500 kyr assuming a range of values for δ18
Osw
from modern to glacial values. The value of glacial δ18
Osw was approximated by adding
0.8‰ to modern δ18
Osw, as suggested by pore-fluid evidence for the last glacial
maximum (32). The resulting SST differences between Sites 806 and 847 is 3.6°C for the
past 130 kyr and 2.9°C since 500 kyr, and represent temperature gradients that are
substantially smaller than the modern gradient of 4.8°C between these two sites.
The diagenetic impact of foraminiferal trace metal content is more complicated than
for oxygen isotopes. The dissolution of foraminiferal tests, which preferentially removes
magnesium, could occur as early as the shell reaches the deeper part of the water column
above lysocline (33, 34) and surface sediments (35). A universal dissolution correction
(36) is not able to account for regional-specific Mg losses (35). The addition of
diagenetic carbonates, on the other hand, could contribute to a much higher Mg/Ca ratio
in the whole shell. This is because the partition coefficient for Mg2+
between seawater
and calcite predict much more Mg incorporation during inorganic precipitation of calcite
(37) relative to foraminiferal calcification. To date, information on the dissolution history
and carbonate regrowth for foraminifera in our studied tropical Pacific sites is not
available. Although δ18
O evidence indicate that diagenetic carbonates at Sites 806 and
847 samples are very likely, the exact influence on foraminiferal Mg/Ca thermometry
cannot be precisely assessed.
1.3. Carbonate Ion Influence
Mg/Ca temperatures are also potentially compromised by seawater carbonate ion
concentration during Mg incorporation into foraminiferal tests. Culture experiments on
Orbulina universa and Globigerina bulloides show that Mg/Ca ratios decrease by 7 ±5%
to 16 ±6% per 0.1 unit increase in pH when average pH is below 8.2 (38). Notably,
surface water pH is usually below 8 in the Pacific cold tongue due to intense upwelling of
cold, CO2-rich deep waters (39). More acidic condition in this region would facilitate
higher Mg incorporation and contribute to overestimates of SST and the appearance of a
reduced zonal temperature gradient. Since deep-water upwelling in the cold tongue
probably persisted over the Pliocene and beyond (e.g. Fig. 4), we anticipate that the
carbonate ion effect would reduce the Mg/Ca and temperature offset between the western
and eastern equatorial Pacific in the Pliocene.
2. Applications of in the tropical Pacific
Another line of evidence that has been used to show invariant temperatures of
Pacific warm pool during the Plio-Pleistocene are -based SSTs from Site 806 (40).
6
But, because the index reaches a maximum value of 1 at about 28.5°C, the proxy is
incapable of recording higher temperatures. 46% of the high-resolution alkenone
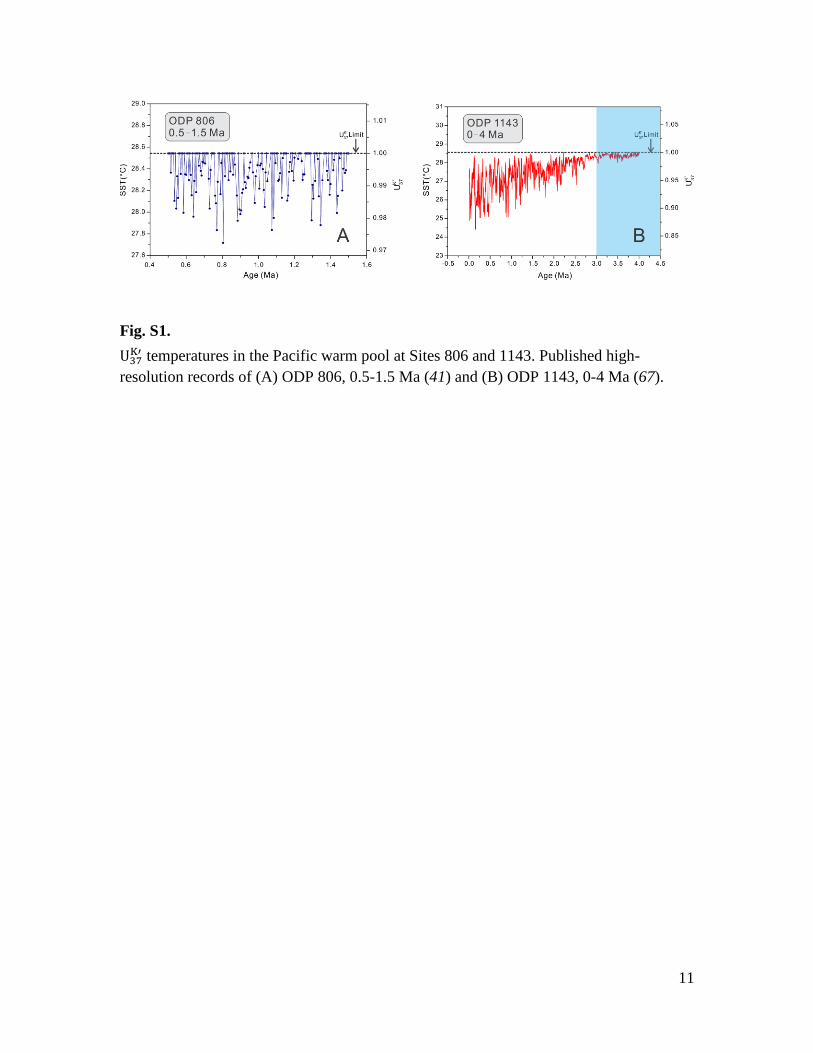
measurements from warm pool Site 806 (Fig. S1A) reach the maximum possible SST
value between 0.5-1.5 Ma (41). Alkenone data from warm pool Site 1143 (Fig. S1B)
shows slightly cooler temperatures during the Pleistocene compared with Site 806 —
consistent with the site’s position ~9° further north of the equator and on the edge of the
current warm pool (43). Nevertheless, almost all of the data from Site 1143 reach
maximum values prior to 3 Ma (Fig. S1B), and when values are below this upper limit, a
long-term cooling trend of the warm pool is expressed between 3 to 0 Ma (Fig. S1B),
consistent with patterns of global cooling during this time. However, it has been argued
that a “contraction” of the warm pool dimensions since 3 Ma contributed to the apparent
cooling at Site 1143 (40) and that the southern South China Sea, Site 1143, reflects
regional temperature change, rather than the thermal history of the warm pool, and
therefore should not be included in the compilation (40). Several lines of evidence argue
against this assertion. First, Site 1143 has a modern SST of 28.43°C and is within the
western Pacific warm pool defined by the 28°C isotherm (42). Second, the modern
temperature difference between Sites 1143 and 806 (29.33°C) in the center of the warm
pool is only 0.9°C. Temperature records show that Site 1143 cooled by over 2˚C over the
past 3 million years, implying that Site 1143 was warmer than Site 806 and established
the modern gradient as Site 806 SSTs remained invariant. If valid, this would suggest that
the warm pool shifted eastward and did not simply contract, thus requiring a revision of
oceanographic assumptions and interpretations of the position of the warm pool. Third,
our new TEX86 temperature record from Site 806 is highly consistent with patterns of
cooling at Site 1143, and the totality of these data strongly suggest the entire region
cooled over the past 3 million years. We conclude that the supposition of a “stable” warm
pool at Site 806 since the early Pliocene as viewed through ODP 806 temperatures is
largely an artifact of the proxy limitations.
The is perhaps the best sea surface proxy available for this line of work, in
terms of calibration uncertainty which is about ± 1.1˚C (15). In a geologic context,
uncertainty is related to changes in ecology (43), nutrient level and light limitation (44),
depth/season of production (45) and perhaps diagenesis (46). In modern studies,
community distributions of haptophyte algae across the tropical Pacific (47) show a
major shift in the dominant species, from Emiliania huxleyi to Gephyrocapsa oceanica,
from north to south of the equator. These two species have different responses to
temperature and -SST calibrations (43) and changes in distribution over time have the
capacity to impact temperature interpretations. Indeed, Emiliania huxleyi originated only
recently (48, 49) and the use of a single calibration over time is not necessary the most
correct approach.

7
In the South China Sea, core-top sediments show that the -SST relationship
yields reliable SSTs (50). Within our study area in the tropical Pacific, Kienast et al.,
2012 (51) examined hundreds of alkenone measurements in the surface sediments of the
EEP region and concluded that most records follow the global relationship between SST
and values, except a few sites that overestimate SSTs which might be biased towards
El Niño events. If the impact of El Niño events during our studied interval influenced our
records, then EEP temperature reconstructions are likely biased towards higher values
and again suggest that our calculated Pacific zonal temperature gradients are conservative
estimates. Our application of alkenone thermometry in the tropical Pacific show that
records compare well with other sites from the same region (e.g. Sites 850 and U1338, 0-
12 Ma; Sites 846, 847, 850 and U1338, 0-5 Ma), and suggest that reconstructed
temperatures based on this proxy are robust.
In Fig. 2 and 3 we apply the linear calibration of Conte et al., 2006 (15) to convert
alkenone measurements to SSTs. Applying other calibrations including the polynomial
relationship derived from surface seawater (15) and the core-top calibration of Müller et
al., 1998 (52) yields very similar temperature estimates (see Database S1).
3. Applications of TEX86 in the tropical Pacific
TEX86 is a relatively new proxy based on the distribution of archaeal membrane
lipids glycerol dialkyl glycerol tetraethers (GDGTs). Marine core-top sediments (53, 54),
water column (55, 56), mesocosm incubations (57, 58) and pure culture incubations (59)
reveal that Thaumarchaeota, the phylum of the cosmopolitan archaea that produce
GDGTs in seawater, respond to growth temperature by adjusting their relative GDGT
distribution. Incubation experiments indicate that marine archaeal can live up to 40°C
(58). Thus, the application of TEX86 thermometry in the reconstruction of very warm
pool SSTs has an advantage over . However, the
calibration has a significantly
larger uncertainty compared to the (e.g. ±2.5°C for the
calibration, (12), see
below).
Some TEX86-derived paleoemperatures appear to deviate from other proxy-based
temperature records (e.g. in the Miocene – Pliocene, (60, 61); in the Eocene, (14, 62)).
Here we examine the applicability of this proxy in the tropical Pacific by evaluating the
available core-top and late Pleistocene samples from this region, perform a detailed
comparison between TEX86- and - derived SST records, and discuss the potential
causes for offsets between proxies.
Recent work examining global TEX86-based SST offsets from observed SST by
employing the most popular non-linear calibrations (e.g. reciprocal (14), hereafter refer to
8
as Liu09 and logarithmic (12), hereafter refer to as Kim10) found distinct patterns for
low-latitudes in contrast to high-latitudes (63). TEX86 tends to overestimate SSTs in the
high latitudes and underestimate SSTs in the tropics, and the most recent attempt at
improving the calibration applies a spatially-varying coefficient model (63). We
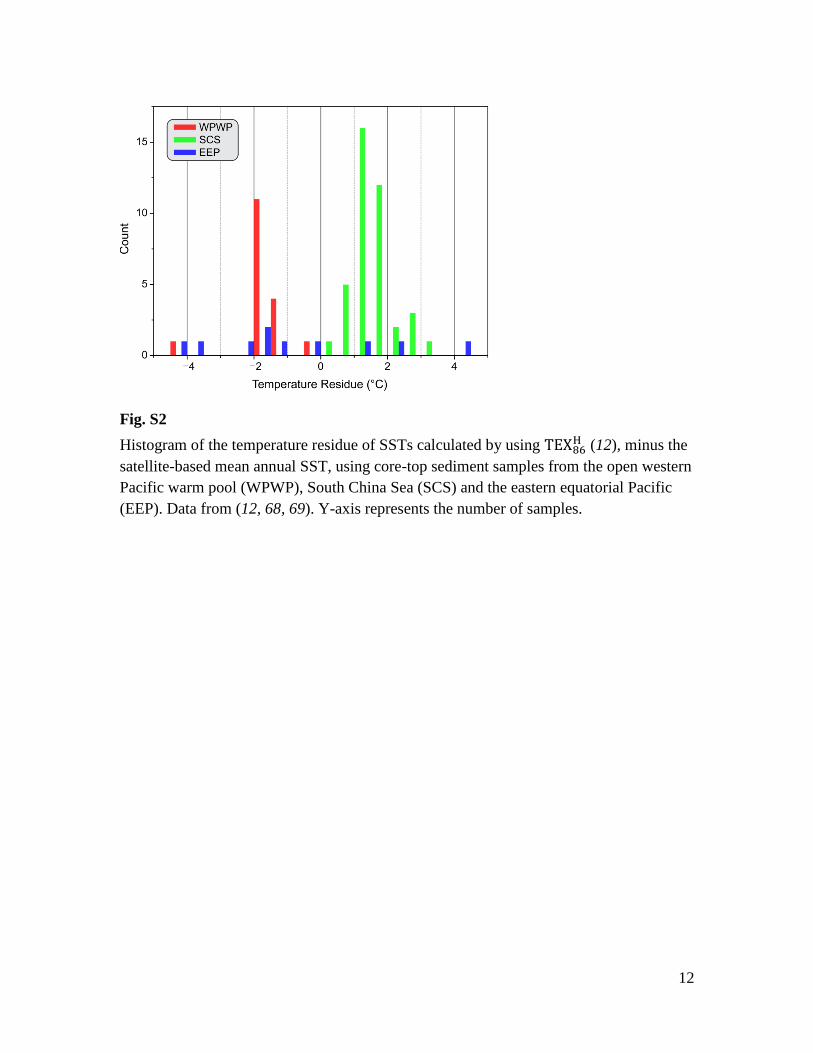
evaluated 67 available surface sediment TEX86 measurements from the tropical Pacific.
In general, TEX86-SSTs using the calibration of Kim10 (12) agree well with satellite
SSTs, with the mean residue = 0.37°C, SD = 1.87°C. However, when samples are divided
into three geographic regions: the open western Pacific warm pool (WPWP), the South
China Sea (SCS) and the eastern equatorial Pacific (EEP), regional-specific residual
patterns emerge (Fig S2). Specifically, we note:
a) TEX86 in the WPWP tends to slightly underestimate SSTs (mean residual = -
1.69°C, SD = 0.78°C, n = 17), consistent with the pattern found in open tropical
oceans (63).
b) TEX86 in the Pacific marginal sea of the SCS appears to slightly overestimate
SSTs (mean residue = 1.51°C, SD = 0.60°C, n = 40).
c) TEX86 in the EEP shows more scattered SST residuals with slightly cooler TEX86
temperatures on average and large standard deviations (mean residue = -0.73°C,
SD = 2.80°C, n = 10).
There is a limited number of core-top data in the tropical Pacific, especially in the EEP
and WPWP, and this contributes to a larger uncertainty using the current regional-
specific Bayesian regression calibration (63).
We estimated the accuracy of TEX86-SSTs for the late Quaternary at Sites 806 and
850 using various TEX86 calibrations (Table S4). Ideally, Holocene TEX86 should be
used to compare with modern temperatures. However, due to the limitation of sample
resolution, TEX86-SSTs are averaged for 0-500 kyr, 0-1000 kyr, and 3-4.5 Ma (the
Pliocene warm period). All late Quaternary estimates appear cooler than modern SSTs at
these two sites. Even if glacial-interglacial variations are considered, which lowers the
“expected” late Quaternary value by 1-2°C (e.g., 64), TEX86-derived SSTs are still on the
low end. This is consistent with core-top data which suggest that current universal
calibrations for TEX86 underestimate SSTs in the open tropical Pacific. However, the
modern temperature gradient between Sites 806 and 850 (4.4°C) are in fact well
documented by applying the Kim et al., 2008 (13) (hereafter refer to Kim08) calibration
for the past 500 kyr (4.5°C), and the Kim10 calibration for the past 1000 kyr (4.4°C). If
we assume the modern temperature gradient at Sites 806 and 850 was maintained over
the past a few glacial-interglacial cycle, agreement between TEX86-based estimation and
the modern gradient suggests that this proxy is a robust tool to survey zonal temperature
gradient of the tropical Pacific in the geological past (Fig. 4). Using Kim08 and Kim10
calibrations, the zonal gradient during the Pliocene warm period was 3.4°C on average
9
(Table S4), consistent with our estimates utilizing all available data (Fig. 4), but different
from the foraminiferal δ18
O thermometry which shows almost no difference across the
equatorial Pacific. (Table S4).
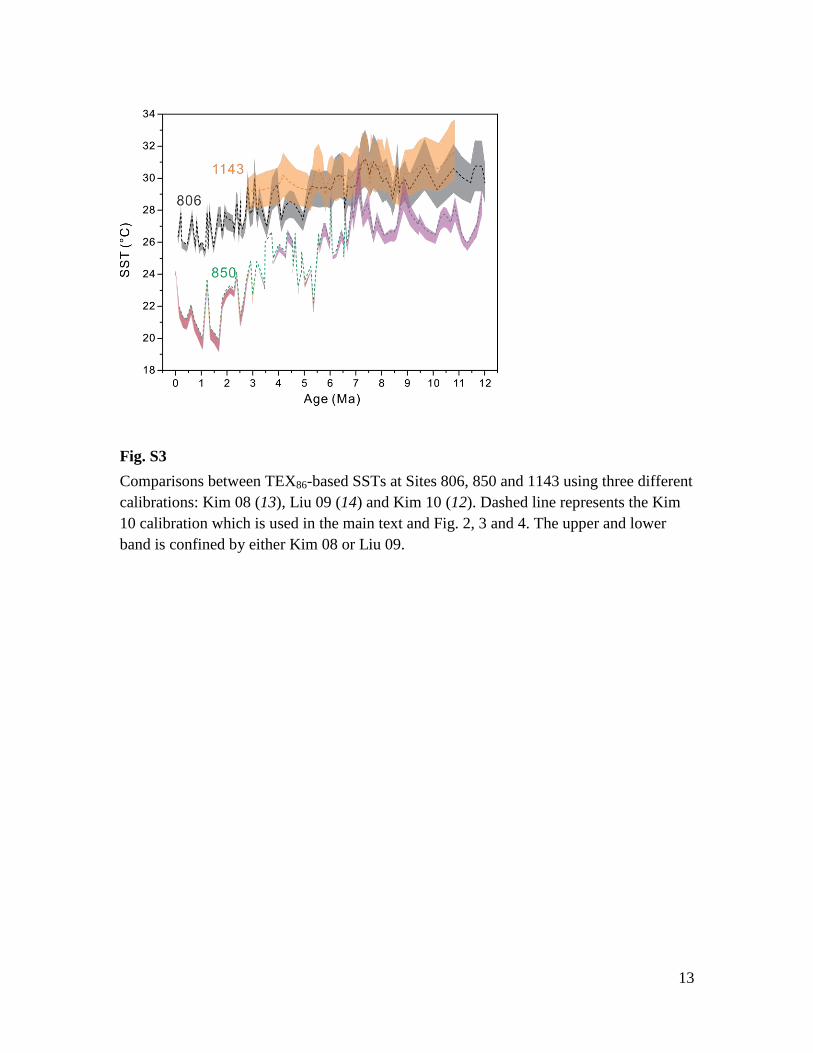
Unlike the variety of calibrations for which have small impacts on the
differences of temperature estimate (Database S1), application of existing TEX86
calibrations alter SST estimates by several degrees (Database S1, Fig. S3). This is
particularly valid for reconstructions of very warm temperatures (e.g. the Miocene part of
the records from Sites 806 and 1143, Fig. S3), which could be partially explained by the
differences between liner calibration (Kim08) and nonlinear calibrations (Liu09, Kim10).
Culture experiments up to 40°C reveal a linear response of TEX86 to temperature changes
(58). In our application, the Kim08 calibration yields the largest cooling of the warm pool
and the largest zonal temperature gradient in the tropical Pacific, whereas the Liu09
calibration yields the smallest cooling and smallest gradient. Estimates using Kim10
calibration provide results in between Kim08 and Liu09 (Fig. S3). Importantly,
applications of a range of TEX86 calibrations do not change our conclusions regarding the
long-term evolution of temperature and temperature gradients in the tropical Pacific.
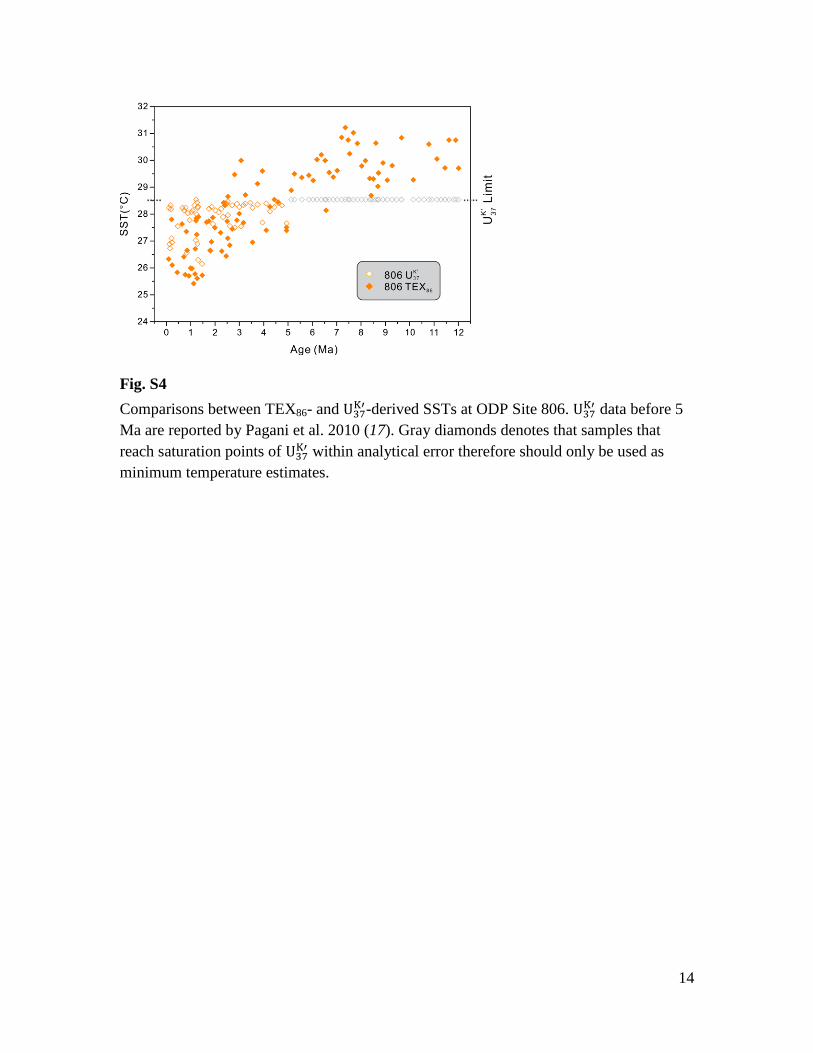
4. Comparisons between TEX86 and
Available data from Sites 806 and 850 have the appropriate temporal range and
resolution for a detailed TEX86- and -SST comparison (Fig. S4, S5).
-SST data
since 5 Ma were previously published for Site 806 (17) and range between ~26-28.5°C
for 0-3 Ma. Between 3-5 Ma, many SST estimates approach the upper calibration limit of
28.5°C. After 5 Ma, all data reach the maximum limit of values within analytical
uncertainties. We also note slightly cooler temperatures from Pagani et al., 2010 (17)
compared to McClymont et al., 2005 (41) when the data overlap between 0.5-1.5 Ma at
Site 806. We suspect that this is because larger sediment volume was used in the Pagani
et al. study (~50 cc) which allowed higher compound abundances and better detection of
the C37:3 alkenone. Given these constraints, the range of variability gradually
increases from 5 Ma, suggesting that the frequency of temperature reaching the 28.5°C
threshold decreases (Fig. S4). This could imply that (1) the warm pool cooled and SST
variability increased, or (2) the warm pool cooled and variability was similar but the
upper limit is not expressed by the limitations of the proxy itself. Evidence for the warm-
pool cooling trend is supported by the TEX86-SST between 5 to 0 Ma, although TEX86
tends to yield lower temperature estimates relative to . Before 5 Ma,
values are
pinned to the upper limit of the calibration while TEX86 values record an even warmer
late Miocene compared to the Pliocene. In the cold tongue Site 850, both TEX86 and
exhibit long-term cooling since ~12 Ma (Fig. S5). TEX86-SST is generally more scattered
than , but the average value agrees well before ~6 Ma. After 6 Ma, TEX86 tends to

10
give lower temperature estimates until ~1.5 Ma when the temperature offsets reaches the
highest value of ~4°C. Since 1.5 Ma, the deviation between proxies is characterized by a
broad decreasing trend, with TEX86 1-2°C cooler than in the latest Quaternary (Fig.
S5).
Lower TEX86-SSTs relative to in the tropical Pacific could be the result of a
cold bias of current TEX86 calibrations. However, the appearance of a temperature offset
at Site 850 only emerges after ~6 Ma and suggest changes in season and/or depth of
production related to Haptophyte algae or archaea. Given the fact that Thaumarchaeota
are ammonia-oxidizers, the biosynthesis of GDGTs probably occur throughout the entire
water column, with a particular focus near the chlorophyll maximum. However, current
evidence argues that the sedimentary TEX86 signal is primarily exported form the surface.
Carbon isotopic compositions of GDGTs show agreement between surface sediments and
the surface seawater, but not deeper waters (65). This is interpreted as reflecting active
grazing and repackaging of large particles which occur in the photic zone (55). Also, the
slope of the regression between TEX86 values from suspended particles and in situ
temperature measured within the upper 100 m in the ocean is similar to the global core-
top calibration (66). If a substantial subsurface water-column component was associated
with surface sediments, one would expect that the correlation between TEX86 from
suspended particles and temperature would have a much steeper slope relative to the
core-top calibration (66). Regardless, given the shallow thermocline depth in the EEP, as
well as the sharp temperature change with depth (Fig. S6), it is remarkable that TEX86
and estimates agree so well, and offsets easily explained by only slight differences in
production depth between Haptophyte algae and archaea (both within the top 50 m in
modern condition).
To examine if long-term cooling and zonal temperature gradient trends shown in Fig.
2 and 3 are biased by certain sites or proxies, we plot individual SST records from each
site (Sites 806, 1143 and 850) using smoothed lines (Fig. S7). This exercise shows that
the broad cooling trends since 12 Ma that characterize the integrated “warm pool” and
“cold tongue” temperatures (Fig. 3) are also expressed at each individual site (Fig. S7A).
At the same time, a clear temperature offset between the warm pool and the cold tongue
sites is maintained throughout the entire time period. Temperature changes relative to the
late Pleistocene values show a faster cooling rate in the cold tongue than the warm pool
(Fig. S7B), which explains the increasing zonal temperature gradient since late Miocene
(Fig. 4).
11
Fig. S1.
temperatures in the Pacific warm pool at Sites 806 and 1143. Published high-
resolution records of (A) ODP 806, 0.5-1.5 Ma (41) and (B) ODP 1143, 0-4 Ma (67).
12
Fig. S2
Histogram of the temperature residue of SSTs calculated by using (12), minus the
satellite-based mean annual SST, using core-top sediment samples from the open western
Pacific warm pool (WPWP), South China Sea (SCS) and the eastern equatorial Pacific
(EEP). Data from (12, 68, 69). Y-axis represents the number of samples.
13
Fig. S3
Comparisons between TEX86-based SSTs at Sites 806, 850 and 1143 using three different
calibrations: Kim 08 (13), Liu 09 (14) and Kim 10 (12). Dashed line represents the Kim
10 calibration which is used in the main text and Fig. 2, 3 and 4. The upper and lower
band is confined by either Kim 08 or Liu 09.
14
Fig. S4
Comparisons between TEX86- and -derived SSTs at ODP Site 806.
data before 5
Ma are reported by Pagani et al. 2010 (17). Gray diamonds denotes that samples that
reach saturation points of within analytical error therefore should only be used as
minimum temperature estimates.
15
Fig. S5
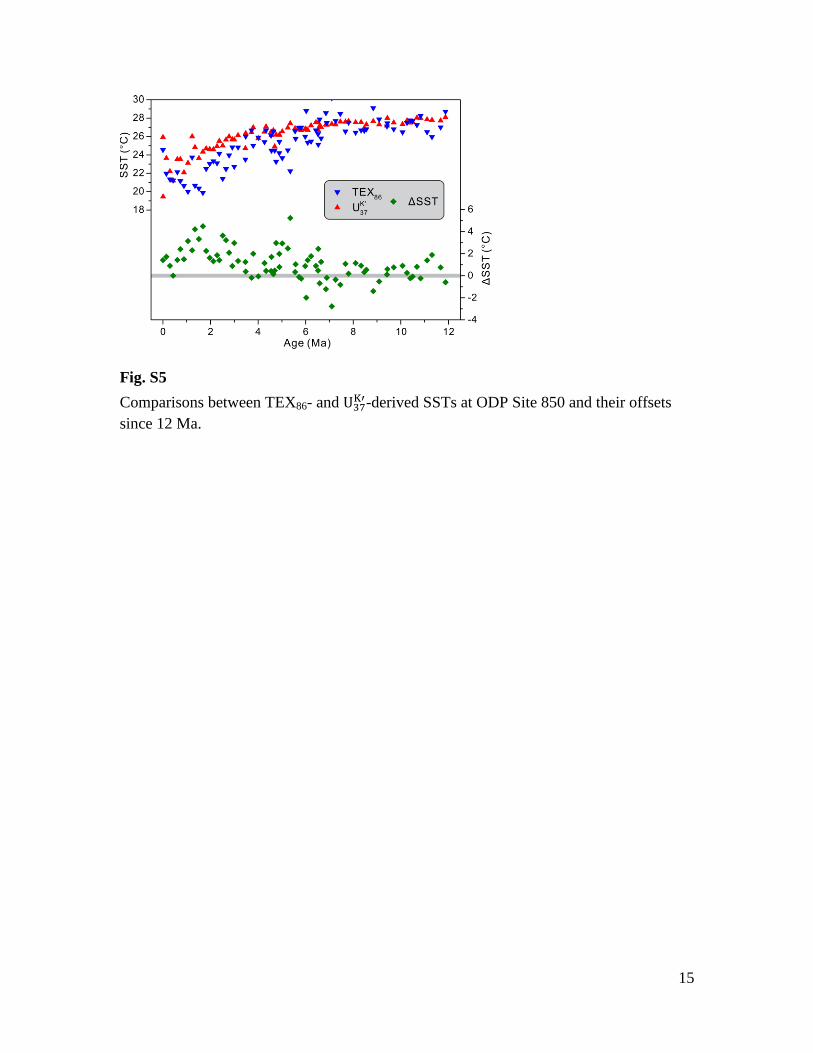
Comparisons between TEX86- and -derived SSTs at ODP Site 850 and their offsets
since 12 Ma.

16
Fig. S6
Modern water temperature distribution versus depth near ODP Site 850 (0.5°N, 110.5°W).
Different lines represent different seasons (JFM: January – March; AMJ: April – June;
JAS: July – September; OND: October – December). Data from World Ocean Atlas 09
(70).
17
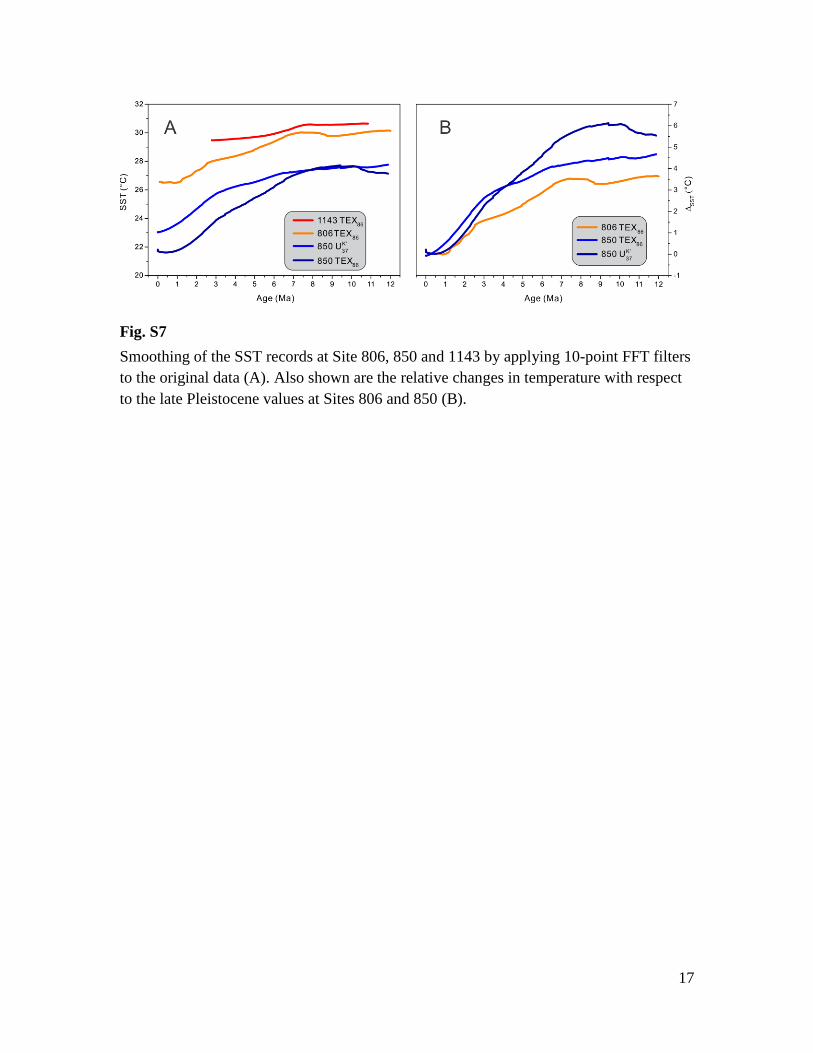
Fig. S7
Smoothing of the SST records at Site 806, 850 and 1143 by applying 10-point FFT filters
to the original data (A). Also shown are the relative changes in temperature with respect
to the late Pleistocene values at Sites 806 and 850 (B).
18
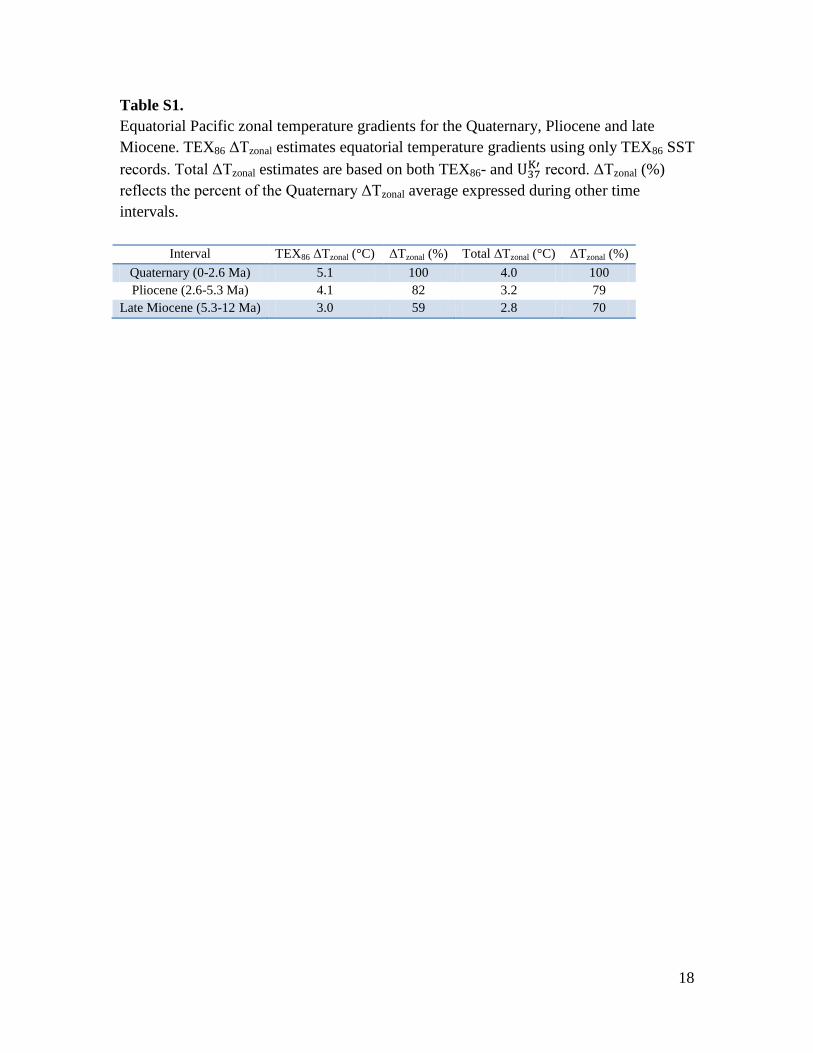
Table S1.
Equatorial Pacific zonal temperature gradients for the Quaternary, Pliocene and late
Miocene. TEX86 ΔTzonal estimates equatorial temperature gradients using only TEX86 SST
records. Total ΔTzonal estimates are based on both TEX86- and record. ΔTzonal (%)
reflects the percent of the Quaternary ΔTzonal average expressed during other time
intervals.
Interval TEX86 ΔTzonal (°C) ΔTzonal (%) Total ΔTzonal (°C) ΔTzonal (%)
Quaternary (0-2.6 Ma) 5.1 100 4.0 100
Pliocene (2.6-5.3 Ma) 4.1 82 3.2 79
Late Miocene (5.3-12 Ma) 3.0 59 2.8 70

19
Table S2.
Summary and chronology for ODP Sites 769, 806, 850 and 1143. Modern SSTs
according to World Ocean Atlas (70).
Sites Coordinates Water
Depth (m)
SST
(°C)
Bio Ref Magneto Ref Foram
δ18
O
Ref
769 8°47' N /
121°18' E
3643
28.49
Y (CN,
PF, D, R)
(71) Yes (71) No N/A
806 0°19' N /
159°22' E
2520
29.33
Y (CN,
PF, D, R)
(3,
72)
Yes (3) Yes (73)
850 1°18' N /
110°31' W
3786
24.93
Y (CN,
PF, D, R)
(4,
74)
Yes (4, 74) No N/A
1143 9°21' N /
113°17' E
2774
28.43
Y (CN,
PF)
(2,
75)
Yes (2) Yes (76)
Abbreviations: Bio – biostratigraphy, Magneto – magnetostratigraphy, CN – calcareous
nannofossils, PF – planktonic foraminifers, D – diatoms, R – radiolarians.

20
Table S3.
Converting foraminiferal oxygen isotopes to SSTs at ODP Sites 806 and 847, using the
equation of Erez and Luz (77). Modern δ18
Osw is interpolated from the global dataset of
LeGrande and Schmidt (78). Last glacial maximum (LGM) δ18
Osw is calculated by
adding 0.8‰ (32) to the modern value at each individual site.
Sites δ18
Osw δ18
OCarb SST
(°C)
Zonal Gradient
(°C)
Comments
806 0.34 29.33 4.8 Modern
0.34 -1.51 25.3 3.5 δ18
OCarb: last 130 kyr. δ18
Osw: modern
1.14 -1.51 29.2 3.7 δ18
OCarb: last 130 kyr. δ18
Osw: LGM
0.34 -1.24 24.0 2.8 δ18
OCarb: last 500 kyr. δ18
Osw: modern
1.14
-1.24
27.8
3.0 δ18
OCarb: last 500 kyr. δ18
Osw: LGM
-1.41
δ18
OCarb: the Pliocene warm period (3-4.5
Ma)
847 0.22 24.53 4.8 Modern
0.22 -0.87 21.8 3.5 δ18
OCarb: last 130 kyr. δ18
Osw: modern
1.02 -0.87 25.5 3.7 δ18
OCarb: last 130 kyr. δ18
Osw: LGM
0.22 -0.74 21.2 2.8 δ18
OCarb: last 500 kyr. δ18
Osw: modern
1.02 -0.74 24.9 3.0 δ18
OCarb: last 500 kyr. δ18
Osw: LGM
-1.43 δ18
OCarb: the Pliocene warm period (3-4.5
Ma)
21
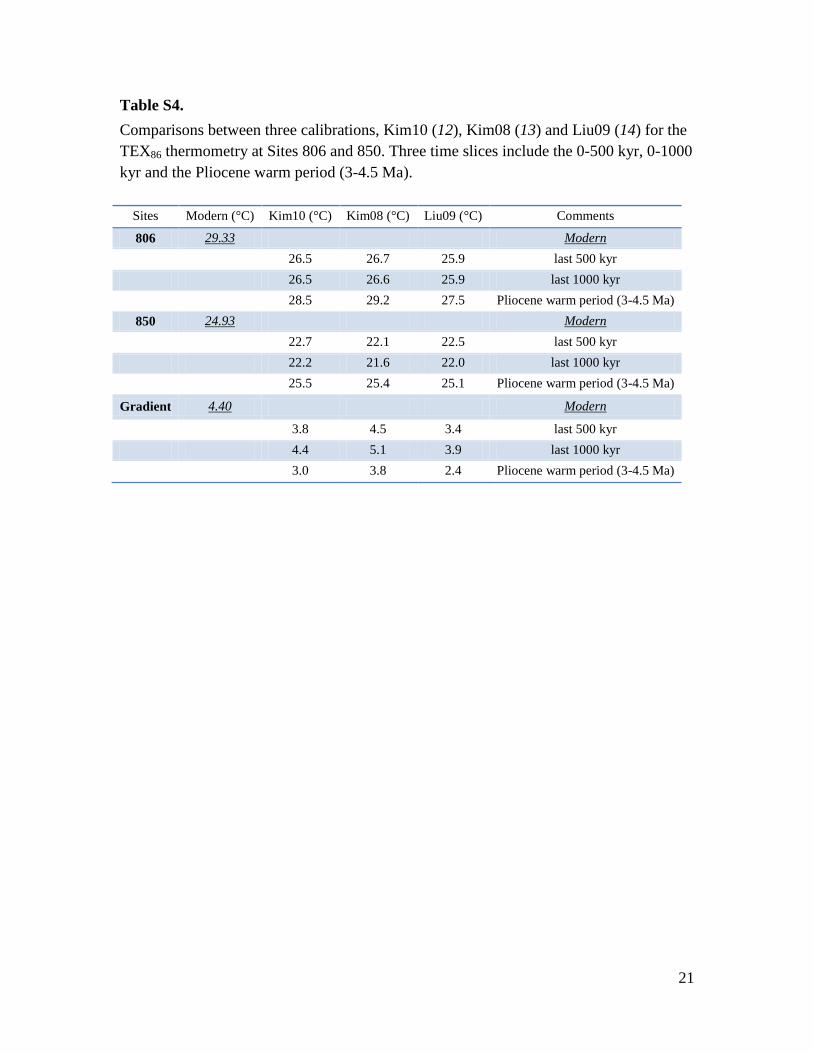
Table S4.
Comparisons between three calibrations, Kim10 (12), Kim08 (13) and Liu09 (14) for the
TEX86 thermometry at Sites 806 and 850. Three time slices include the 0-500 kyr, 0-1000
kyr and the Pliocene warm period (3-4.5 Ma).
Sites Modern (°C) Kim10 (°C) Kim08 (°C) Liu09 (°C) Comments
806 29.33 Modern
26.5 26.7 25.9 last 500 kyr
26.5 26.6 25.9 last 1000 kyr
28.5 29.2 27.5 Pliocene warm period (3-4.5 Ma)
850 24.93 Modern
22.7 22.1 22.5 last 500 kyr
22.2 21.6 22.0 last 1000 kyr
25.5 25.4 25.1 Pliocene warm period (3-4.5 Ma)
Gradient 4.40 Modern
3.8 4.5 3.4 last 500 kyr
4.4 5.1 3.9 last 1000 kyr
3.0 3.8 2.4 Pliocene warm period (3-4.5 Ma)
22
Additional Data table S1 (separate file)
TEX86- and -SSTs at ODP Site 769, 806, 850 and 1143, and the equatorial Pacific
zonal temperature gradient for the past 12 million years.
23
References
1. Shipboard Scientific Party, in Proc. ODP, Init. Rep., C. Rangin, E. A. Silver, M.
T. von Breyman, Eds. (Ocean Drilling Program, College Station, TX, 1990), vol.
124, pp. 299-342.
2. Shipboard Scientific Party, in Proc. ODP, Init. Repts., P. Wang, W. L. Prell, P.
Blum, Eds. (Ocean Drilling Program, College Station, TX, 2000), vol. 184, pp. 1-
103.
3. Shipboard Scientific Party, in Proc. ODP, Init. Repts., L. W. Kroenke, W. H.
Berger, T. Janecek, Eds. (Ocean Drilling Program, College Station, TX, 1991),
vol. 130, pp. 291-367.
4. Shipboard Scientific Party, in Proc. ODP, Init. Repts., L. Mayer, N. Pisias, T.
Janecek, Eds. (Ocean Drilling Probram, College Station, 1992), vol. 138, pp. 809-
889.
5. W. A. Berggren, D. V. Kent, C. C. Swisher, M.-P. Aubry, in Geochronology, time
scales and global stratigraphic correlation, W. A. Berggren, D. V. Kent, M.-P.
Aubry, J. Hardenbol, Eds. (SEPM Society for Sedimentary Geology, Tulsa, OK,
1995), vol. 54, pp. 129-212.
6. W. A. Berggren, D. V. Kent, J. Van Couvering, in The Geochronology and the
geological record, N. J. Snelling, Ed. (Geological Society of London, London,
UK, 1985), pp. 211-260.
7. K. T. Lawrence, Z. H. Liu, T. D. Herbert, Evolution of the Eastern Tropical
Pacific through Plio-Pleistocene glaciation. Science 312, 79 (2006).
8. P. S. Dekens, A. C. Ravelo, M. D. McCarthy, Warm upwelling regions in the
Pliocene warm period. Paleoceanography 22, PA3211 (2007).
9. J. P. LaRiviere et al., Late Miocene decoupling of oceanic warmth and
atmospheric carbon dioxide forcing. Nature 486, 97 (2012).
10. G. Rousselle, C. Beltran, M.-A. Sicre, I. Raffi, M. De Rafelis, Changes in sea-
surface conditions in the Equatorial Pacific during the middle Miocene-Pliocene
as inferred from coccolith geochemistry. Earth Planet. Sci. Lett. 361, 412 (2013).
11. E. C. Hopmans, S. Schouten, R. D. Pancost, M. T. J. van der Meer, J. S. Sinnighe
Damste, Analysis of intact tetraether lipids in archaeal cell material and sediments
by high performance liquid chromatography/atmospheric pressure chemical
ionization mass spectrometry. Rapid Commun. Mass Spectrom. 14, 585 (2000).
12. J. H. Kim et al., New indices and calibrations derived from the distribution of
crenarchaeal isoprenoid tetraether lipids: Implications for past sea surface
temperature reconstructions. Geochim. Cosmochim. Acta 74, 4639 (2010).
13. J. H. Kim, S. Schouten, E. C. Hopmans, B. Donner, J. S. Sinnighe Damste, Global
sediment core-top calibration of the TEX86 paleothermometer in the ocean.
Geochim. Cosmochim. Acta 72, 1154 (2008).
14. Z. Liu et al., Global Cooling During the Eocene-Oligocene Climate Transition.
Science 323, 1187 (2009).
15. M. Conte, M.-A. Sicre, C. Ruhlemann, Global temperature calibration of the
alkenone unsaturation index (UK'37) in surface waters and comparison with
surface sediments. Geochem. Geophys. Geosyst. 7, Q02005 (2006).

24
16. M. W. Wara, A. C. Ravelo, M. L. Delaney, Permanent El Nino-like conditions
during the Pliocene Warm Period. Science 309, 758 (2005).
17. M. Pagani, Z. H. Liu, J. LaRiviere, A. C. Ravelo, High Earth-system climate
sensitivity determined from Pliocene carbon dioxide concentrations. Nat. Geosci.
3, 27 (2010).
18. O. Seki et al., Alkenone and boron-based Pliocene pCO2 records. Earth Planet.
Sci. Lett. 292, 201 (2010).
19. D. W. Lea, The 100 000-yr cycle in tropical SST, greanhouse forcing and climate
sensitivity. J. Clim. 17, 2170 (2004).
20. K. A. Dyez, A. C. Ravelo, Late Pleistocene tropical Pacific temperature
sensitivity to radiative greenhouse gas forcing. Geology 41, 23 (2013).
21. S. Rausch, F. Böhm, W. Bach, A. Klügel, A. Eisenhauer, Calcium carbonate veins
in ocean crust record a threefold increase of seawater Mg/Ca in the past 30
million years. Earth Planet. Sci. Lett. 362, 215 (2013).
22. R. M. Coggon, D. A. H. Teagle, C. E. Smith-Duque, J. C. Alt, M. J. Copper,
Reconstructing past seawater Mg/Ca and Sr/Ca from Mid-Ocean Ridge flank
calcium carbonate veins. Science 327, 1141 (2010).
23. T. K. Lowenstein, M. N. Timofeeff, S. T. Brennan, L. A. Hardie, R. V. Demicco,
Oscillations in Phanerozoic seawater chemistry: Evidence from fluid inclusions.
Science 294, 1086 (2001).
24. M. S. Fantle, D. DePaolo, Sr isotopes and pore fluid chemistry in carbonate
sediment of the Ontong Java Plateau: Calcite recrystallization rates and evidence
for a rapid rise in seawater Mg over the last 10 million years. Geochim.
Cosmochim. Acta 70, 3883 (2006).
25. M. Medina-Elizalde, D. W. Lea, M. S. Fantle, Implications of seawater Mg/Ca
variability for Plio-Pleistocene tropical climate reconstruction. Earth Planet. Sci.
Lett. 269, 585 (2008).
26. D. P. Schrag, D. J. DePaolo, F. M. Richter, Reconstructing past sea surface
temperatures: Correcting for diagenesis of bulk marine carbonate. Geochim.
Cosmochim. Acta 59, 2265 (1995).
27. P. F. Sexton, P. A. Wilson, P. N. Pearson, Microstructural and geochemical
perspectives on planktic foraminiferal preservation: "Glassy" versus "Frosty".
Geochem. Geophys. Geosyst. Q12P19, (2006).
28. R. Kozdon et al., In situ 18O and Mg/Ca analyses of diagenetic and planktic
foraminiferal calcite preserved in deep-sea record of the Paleocene-Eocene
thermal maximum. Paleoceanography 28, 517 (2013).
29. S. D'Hondt, M. A. Arthur, Late Cretaceous oceans and the cool tropic paradox.
Science 271, 1838 (1996).
30. P. N. Pearson et al., Warm tropical sea surface temperatures in the Late
Cretaceous and Eocene epochs. Nature 413, 481 (2001).
31. P. N. Pearson et al., Stable warm tropical climate through the Eocene Epoch.
Geology 35, 211 (2007).
32. D. P. Schrag, G. Hampt, D. W. Murray, Pore fluid constraints on the temperature
and oxygen isotopic composition of the glacial ocean. Science 272, 1930 (1996).
25
33. Y. Rosenthal, G. P. Lohmann, K. C. Lohmann, R. M. Sherrell, Incorporation and
preservation of Mg in Globigerinoides sacculifer: Implications for reconstructing
the temperature and 18
O/16
O of seawater. Paleoceanography 15, 135 (2000).
34. S. J. Brown, H. Elderfield, Variations in Mg/Ca ans Sr/Ca ratios of planktonic
foraminifera caused by postdepositional dissolution: Evidence of shallow Mg-
dependent dissolution. Paleoceanography 11, 543 (1996).
35. J. E. Hertzberg, M. W. Schmidt, Refining Globigerinoides ruber Mg/Ca
paleothermometry in the Atlantic Ocean. Earth Planet. Sci. Lett. 383, 123 (2013).
36. P. S. Dekens, D. W. Lea, D. K. Pak, H. J. Spero, Core top calibration of Mg/Ca in
tropical foraminifera: Refining paletemperature estimation. Geochem. Geophys.
Geosyst. 3, (2002).
37. A. Mucci, J. W. Morse, The incorporation of Mg2+
and Sr2+
into calcite
overgrowths - Influences of growth-rate and solution composition. Geochim.
Cosmochim. Acta 47, 217 (1983).
38. A. D. Russell, B. Hönisch, H. J. Spero, D. W. Lea, Effects of seawater carbonate
ion concentration and temperature on shell U, Mg, and Sr in cultured planktonic
foraminifera. Geochim. Cosmochim. Acta 68, 4347 (2004).
39. S. C. Doney, The dangers of ocean acidification. Scientific American, 58 (2006).
40. A. V. Fedorov et al., Patterns and mechanisms of early Pliocene warmth. Nature
496, 43 (2013).
41. E. L. McClymont, A. Rosell-Mele, Links between the onset of modern Walker
circulation and mid-Pleistocene climate transition. Geology 33, 389 (2005).
42. X.-H. Yan, C.-R. Ho, Q. Zheng, V. Klemas, Temperature and size variabilities of
the Western Pacific Warm Pool. Science 258, 1643 (1992).
43. J. K. Volkman, S. M. Barrett, S. I. Blackburn, E. L. Sikes, Alkenones in
Gephyrocapsa oceanica: Implications for studies of paleoclimate. Geochim.
Cosmochim. Acta 59, 513 (1995).
44. F. G. Prahl, G. V. Wolfe, M. A. Sparrow, Physiological impacts on alkenone
paleothermometry. Paleoceanography 18, 1025 (2003).
45. F. G. Prahl, B. N. Popp, D. M. Karl, M. A. Sparrow, Ecology and
biogeochemistry of alkenone production at Station ALOHA. Deep-Sea Res. I 52,
699 (2005).
46. C. Huguet, J. H. Kim, G. J. de Lange, J. S. S. Damste, S. Schouten, Effects of
long term oxic degradation on the UK'37), TEX86 and BIT organic proxies. Org.
Geochem. 40, 1188 (2009).
47. H. Okada, S. Honjo, The distribution of oceanic coccolithophorids in the Pacifc.
Deep-Sea Research 20, 355 (1973).
48. A. McIntyre, Gephyrocapsa protohyxleyi sp. n. as possible phyletic link and index
fossil for the Pleistocene. Deep Sea Res. I 17, 187 (1970).
49. W. W. Hay, in Oceanic Micropaleontology, A. T. S. Ramsey, Ed. (Academic
Press, London, UK, 1977), vol. 2.
50. C. Pelejero, J. O. Grimalt, The correlation between the Uk'37 index and sea
surface temperatures in the warm boundary: The South China Sea. Geochim.
Cosmochim. Acta 61, 4789 (1997).
26
51. M. Kienast et al., Alkenone unsaturation in surface sediments from the eastern
equatorial Pacific: Implications for SST reconstructions. Paleoceanography 27,
PA1210 (2012).
52. P. J. Muller, G. Kirst, G. Ruhland, I. von Storch, A. Rosell-Mele, Calibration of
the alkenone paleotemperature index Uk'37 based on core-tops from the eastern
South Atlantic and the global ocean (60N-60S). Geochim. Cosmochim. Acta 62,
1757 (1998).
53. S. Schouten, E. C. Hopmans, R. D. Pancost, J. S. Sinnighe Damste, Widespread
occurrence of structurally diverse tetraether membrane lipids: Evidence for the
ubiquitous presence of low-temperature relatives of hyperthermophiles. Proc.
Natl. Acad. Sci. 97, 14421 (2000).
54. S. Schouten, E. C. Hopmans, E. Schefuss, J. S. S. Damste, Distributional
variations in marine crenarchaeotal membrane lipids: a new tool for
reconstructing ancient sea water temperatures? Earth Planet. Sci. Lett. 204, 265
(2002).
55. C. Wuchter, S. Schouten, S. G. Wakeham, J. S. S. Damste, Temporal and spatial
variation in tetraether membrane lipids of marine Crenarchaeota in particulate
organic matter: Implications for TEX86 paleothermometry. Paleoceanography 20,
(2005).
56. C. Wuchter, S. Schouten, S. G. Wakeham, J. S. S. Damste, Archaeal tetraether
membrane lipid fluxes in the northeastern Pacific and the Arabian Sea:
Implications for TEX86 paleothermometry. Paleoceanography 21, (2006).
57. C. Wuchter, S. Schouten, M. J. L. Coolen, J. S. Sinnighe Damste, Temperature-
dependent variation in the distribution of tetraether membrane lipids of marine
Crenarchaeota: Implications for TEX86 paleothermometry. Paleoceanography 19,
(2004).
58. S. Schouten, A. Forster, F. E. Panoto, J. S. Sinnighe Damste, Towards calibration
of the TEX86 palaeothermometer for tropical sea surface temperatures in ancient
greenhouse worlds. Org. Geochem. 38, 1537 (2007).
59. S. Schouten et al., Intact membrane lipids of "Candidatus Nitrosopumilus
maritimus," a cultivated representative of the cosmopolitan mesophilic group I
crenarchaeota. Appl. Environ. Microbiol. 74, 2433 (2008).
60. F. Rommerskirchen, T. Condon, G. Mollenhauer, L. Dupont, E. Schefuss,
Miocene to Pliocene development of surface and subsurface temperatures in the
Benguela Current system. Paleoceanography 26, (2011).
61. O. Seki et al., Paleoceanographic changes in the Eastern Equatorial Pacific.
Paleoceanography 27, PA3224 (2012).
62. C. J. Hollis et al., Tropical sea temperatures in the high-latitude South Pacific
during the Eocene. Geology 37, 99 (2009).
63. J. E. Tierney, M. P. Tingley, A Bayesian, spatially-varying calibration model for
the TEX86 proxy. Geochim. Cosmochim. Acta 127, 83 (2014).
64. D. W. Lea, Climate impact of late Quaternary equatorial Pacific sea temeprature
variations. Science 289, 1719 (2000).
65. S. G. Wakeham, C. M. Lewis, E. C. Hopmans, S. Schouten, J. S. Sinnighe
Damste, Archaea mediate anaerobic oxidation of methane in deep euxinic waters
of the Black Sea. Geochim. Cosmochim. Acta 67, 1359 (2003).
27
66. S. Schouten, E. C. Hopmans, J. S. Sinnighe Damste, The organic geochemistry of
glycerol dialkyl glycerol tetraether lipids: A review. Org. Geochem. 54, 19 (2013).
67. L. Li et al., A 4-Ma record of thermal evolution in the tropical western Pacific and
its implications on climate change. Earth Planet. Sci. Lett. 309, 10 (2011).
68. S. L. Ho, M. Yamamoto, G. Mollenhauer, M. Minagawa, Core top TEX86 values
in the south and equatorial Pacific. Org. Geochem. 42, 94 (2011).
69. G. Jia, J. Zhang, J. Chen, P. a. Peng, C. L. Zhang, Archaeal tetraether lipids
record subsurface water temperature in the South China Sea. Org. Geochem. 50,
68 (2012).
70. R. A. Locarnini et al., in NOAA Atlas NESDIS 68 S. Levitus, Ed. (U.S.
Government Printing Office, Washington, D.C., 2010).
71. J.-P. Shyu et al., in Proc. ODP, Sci. Results, E. A. Silver, C. Rangin, M. T. von
Breyman, Eds. (Ocean Drilling Program, College Station, TX, 1991), vol. 124, pp.
11-35.
72. W. P. Chaisson, R. M. Leckie, in Proc. ODP, Sci Results, W. H. Berger, L. W.
Kroenke, L. A. Mayer, Eds. (Ocean Drilling Program, College Station, TX, 1993),
vol. 130, pp. 137-178.
73. S. A. Nathan, R. M. Leckie, Early history of the Western Pacific Warm Pool
during the middle to late Miocene (~13.2-5.8 Ma): Role of sea-level change and
implications for equatorial circulation. Palaeogeogr. Palaeoclimatol. Palaeoecol.
274, 140 (2009).
74. N. J. Shackleton, S. Crowhurst, T. Hagelberg, N. G. Pisias, D. A. Schneider, in
Proc. ODP, Sci. Results, N. G. Pisias, L. A. Mayer, T. Janecek, A. Palmer-Julson,
T. H. van Andel, Eds. (Ocean Drilling Program, College Station, TX, 1995), vol.
138, pp. 73-101.
75. S. A. Nathan, R. M. Leckie, in Proc. ODP, Sci. Results, W. L. Prell, P. Wang, P.
Blum, D. K. Rea, S. C. Clemens, Eds. (Ocean Drilling Program, College Station,
TX, 2003), vol. 184, pp. 1-43.
76. J. Tian, P. X. Wang, X. R. Cheng, Q. Y. Li, Astronomically tuned Plio-
Pleistocene benthic delta O-18 record from South China Sea and Atlantic-Pacific
comparison. Earth Planet. Sci. Lett. 203, 1015 (2002).
77. J. Erez, B. Luz, Temperature control of oxygen-isotope fractionation of cultured
planktonic foraminifera. Nature 297, 220 (1982).
78. A. N. LeGrande, G. A. Schmidt, Global gridded data set of the oxygen isotopic
composition in seawater. Geophys. Res. Lett. 33, L12604 (2006).