Embed Size (px)
Citation preview


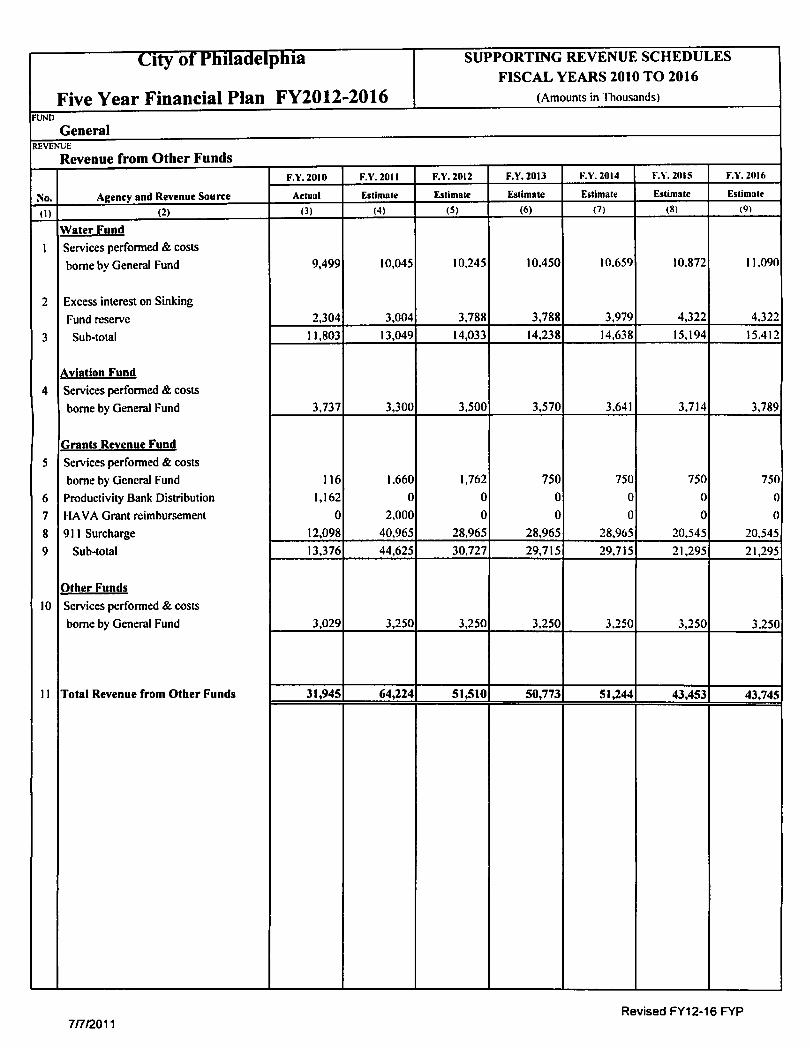


City of PhiladelphiaGeneral Fund
FY 2012 - 2016 Five Year Financial PlanSummary by Class
Actual Budgeted Projected Projected Projected Projected Projected Projected
Expenditure Class FY 10 FY 11 FY 11 FY 12 FY 13 FY 14 FY 15 FY 16
Class 100 - Wages 1,360,000,423 1,369,164,221 1,363,788,383 1,330,088,233 1,331,929,519 1,332,627,385 1,333,117,312 1,333,481,563
Class 100 - Benefits 829,855,069 964,887,316 979,887,316 1,022,702,609 1,148,167,205 1,160,848,491 1,107,620,760 1,130,151,425
Class 200 - Contracts / Leases 1,111,393,188 1,153,830,801 1,130,775,677 758,994,393 768,395,384 772,573,403 768,054,302 768,901,999
Class 300/400 - Supplies, Equipment 68,693,694 80,098,146 80,694,252 78,960,385 76,163,874 77,593,874 77,593,874 77,593,874
Class 500 - Indemnities / Contributions 128,042,365 135,765,046 109,416,853 117,543,800 117,103,800 117,164,400 117,725,600 117,287,400
Class 700 - Debt Service 105,513,466 121,394,847 110,414,263 130,739,164 134,681,761 149,834,740 149,707,708 152,465,005
Class 800 - Payments to Other Funds 26,055,692 27,955,623 27,955,623 27,065,946 31,137,816 32,219,276 33,291,441 33,291,441
Class 900 - Advances / Misc. Payments 24,171,817 0 0 4,000,100 4,000,100 4,000,100 4,000,100 4,000,100
Total 3,653,725,714 3,853,096,000 3,802,932,366 3,470,094,630 3,611,579,459 3,646,861,669 3,591,111,097 3,617,172,807

City of Philadelphia
FY 2012 - 2016 Five Year Financial Plan
General Fund
Summary by Department
Actual Budgeted Projected Projected Projected Projected Projected Projected
Department FY 10 FY 11 FY 11 FY 12 FY 13 FY 14 FY 15 FY 16
Art Museum Subsidy 2,300,000 2,300,000 2,300,000 2,300,000 2,300,000 2,300,000 2,300,000 2,300,000
Atwater Kent Museum Subsidy 298,059 248,630 268,630 268,630 268,630 268,630 268,630 268,630
Auditing Department (City Controller's Office) 7,408,017 7,291,566 7,948,052 7,556,052 7,356,052 7,356,052 7,356,052 7,356,052
Board of Building Standards 61,283 71,601 71,601 71,601 71,601 71,601 71,601 71,601
Board of Ethics 705,545 810,000 810,000 810,000 810,000 810,000 810,000 810,000
Board of L & I Review 127,040 155,721 155,721 155,721 155,721 155,721 155,721 155,721
Board of Revision of Taxes 7,463,012 6,502,559 2,084,029 723,000 723,000 723,000 723,000 723,000
City Commissioners 9,021,144 8,794,177 9,221,677 9,104,177 9,029,177 9,029,177 9,029,177 9,029,177
City Council 13,373,484 15,048,972 15,048,972 15,049,272 15,049,272 15,049,272 15,049,272 15,049,272
City Planning Commission 2,904,020 2,551,249 2,257,200 2,257,200 2,257,200 2,257,200 2,257,200 2,257,200
City Representative 906,162 945,591 907,766 907,766 907,766 907,766 907,766 907,766
Commerce Department 1,696,371 2,190,276 2,124,813 2,274,813 2,124,813 2,124,813 2,124,813 2,124,813
Commerce Department-Economic Stimulus 1,452,386 1,452,386 1,372,143 1,372,143 1,372,143 1,372,143 1,372,143 1,372,143
City Treasurer 647,559 904,699 904,699 904,699 904,699 904,699 904,699 904,699
Civil Service Commission 154,111 170,309 170,309 170,309 170,309 170,309 170,309 170,309
Clerk of Quarter Sessions 4,509,567 4,549,313 0 0 0 0 0 0
Community College Subsidy 26,467,924 26,467,924 25,409,207 25,409,207 25,409,207 25,409,207 25,409,207 25,409,207
Convention Center Subsidy 24,171,817 15,000,000 15,000,000 15,000,000 15,000,000 15,000,000 15,000,000 15,000,000
Debt Service (Sinking Fund) 185,464,327 211,035,690 197,918,470 223,906,507 233,290,528 249,566,713 249,298,594 248,693,173
District Attorney 30,071,519 29,062,121 30,522,121 31,054,996 31,054,996 31,054,996 31,054,996 31,054,996
Division of Technology 38,521,370 67,432,032 63,582,751 63,942,751 63,942,751 63,942,751 55,521,887 55,521,887
Finance Department 15,895,412 12,171,642 13,583,509 12,703,760 12,023,542 12,023,542 12,523,542 12,023,542
Finance - Contib. School Dist./Tax Cuts 38,540,000 38,600,000 38,600,000 48,930,000 48,990,000 49,050,600 49,111,800 49,173,600
Finance - Employee Benefits 829,855,069 964,887,316 979,887,316 1,022,702,609 1,148,167,205 1,160,848,491 1,107,620,760 1,130,151,425
Finance - PGW Rental Reimbursement 18,000,000 18,000,000 0 0 0 0 0 0
Fire Department 188,887,804 188,762,090 190,998,695 190,031,950 188,466,528 188,967,406 189,468,310 189,468,310
First Judicial District 107,227,069 99,096,983 110,113,478 110,817,323 109,380,935 109,380,935 109,380,935 109,380,935
Fleet Management Office 44,600,981 47,437,489 45,539,989 45,151,989 45,151,989 45,151,989 45,151,989 45,151,989
Fleet Mgmt. - Vehicle Purchase 2,722,425 4,000,000 5,500,000 8,500,000 9,500,000 11,500,000 11,500,000 11,500,000
Free Library 32,481,012 32,968,362 32,968,362 33,863,362 33,863,362 33,863,362 33,863,362 33,863,362
Hero Scholarship Awards 42,500 25,000 37,000 25,000 25,000 25,000 25,000 25,000
Historical Commission 386,824 403,942 387,784 387,784 387,784 387,784 387,784 387,784
Human Relations Commission 1,983,420 2,066,937 1,984,260 2,039,260 2,039,260 2,039,260 2,039,260 2,039,260
Human Services Department 561,082,074 576,365,473 549,365,506 111,934,770 111,934,770 111,934,770 111,934,770 111,934,770
Indemnities 32,718,289 42,000,000 35,040,904 33,120,000 33,120,000 33,120,000 33,120,000 33,120,000
Labor Relations, Mayor's Office of 523,171 523,350 502,416 552,416 552,416 552,416 552,416 552,416
Law Department 17,889,976 18,665,480 17,918,861 13,119,245 13,119,245 13,119,245 13,119,245 13,119,245
Legal Services (incl. Defenders Assoc.) 35,941,188 35,941,187 36,616,187 37,566,187 37,566,187 37,566,187 37,566,187 37,566,187

City of Philadelphia
FY 2012 - 2016 Five Year Financial Plan
General Fund
Summary by Department
Actual Budgeted Projected Projected Projected Projected Projected Projected
Department FY 10 FY 11 FY 11 FY 12 FY 13 FY 14 FY 15 FY 16
Licenses and Inspections Department 22,696,814 23,068,925 19,146,168 21,780,905 21,780,905 21,780,905 21,780,905 21,780,905
Managing Director's Office 16,471,347 17,983,836 16,413,517 22,972,270 22,972,270 22,972,270 22,972,270 22,972,270
Mayor's Office 3,597,579 3,838,884 3,639,665 3,786,915 3,786,915 3,786,915 3,786,915 3,786,915
Mayor - Mural Arts Program 973,182 1,000,000 960,000 1,060,000 960,000 960,000 960,000 960,000
Mayor's Office of Transportation 482,014 500,000 480,000 480,000 480,000 480,000 480,000 480,000
Mayor - Scholarships 193,305 200,000 200,000 200,000 200,000 200,000 200,000 200,000
Off. of Arts and Culture and the Creative Economy 3,943,042 3,905,113 2,545,113 2,670,238 2,670,238 2,670,238 2,670,238 2,670,238
Off. of Behavioral Health/Mental Retardation Svcs. 14,238,870 14,271,572 14,271,572 14,271,572 14,271,572 14,271,572 14,271,572 14,271,572
Office of Housing & Community Development 2,800,000 2,800,000 1,820,000 3,020,000 3,020,000 3,020,000 3,020,000 3,020,000
Office of Human Resources 4,047,043 5,185,757 5,055,127 5,228,327 4,978,327 4,978,327 4,978,327 4,978,327
Office of the Inspector General 1,145,973 1,379,677 1,281,451 1,281,451 1,211,451 1,211,451 1,211,451 1,211,451
Office of Property Assessment 0 0 6,108,530 11,740,696 11,650,696 11,650,696 11,650,696 11,650,696
Office of Supportive Housing 38,386,664 38,473,558 36,466,253 36,466,253 36,466,253 36,466,253 36,466,253 36,466,253
Parks and Recreation 45,407,386 49,828,904 44,787,748 46,325,925 46,325,925 46,325,925 46,325,925 46,325,925
Police Department 528,853,734 538,403,280 530,035,214 550,686,244 551,514,375 551,642,241 552,132,168 552,496,419
Prisons System 233,814,188 234,139,870 233,139,870 227,172,870 228,672,870 228,672,870 228,672,870 228,672,870
Procurement Department 4,397,299 4,238,574 4,151,574 4,151,574 4,151,574 4,151,574 4,151,574 4,151,574
Public Health Department 111,098,894 113,962,348 113,724,556 110,426,170 112,459,882 112,459,882 112,459,882 112,459,882
Public Property Department 51,545,939 51,027,711 53,227,711 52,027,433 55,598,451 56,179,033 56,750,294 56,750,294
Public Property - SEPTA Subsidy 64,164,000 65,878,000 65,878,000 66,360,000 69,244,000 71,064,000 72,909,000 74,805,000
Public Property - Space Rentals 15,039,531 15,083,108 15,421,472 18,221,209 17,568,450 17,819,751 18,148,902 18,486,204
Public Property - Utilities 32,537,690 32,890,000 32,890,000 32,224,809 32,071,440 31,777,280 32,326,136 32,947,232
Records 5,194,997 4,009,212 4,009,212 4,009,212 4,009,212 4,009,212 4,009,212 4,009,212
Refunds 781 250,000 125,500 250,000 250,000 250,000 250,000 250,000
Register of Wills 3,208,695 3,399,278 3,399,278 3,399,278 3,399,278 3,399,278 3,399,278 3,399,278
Revenue Department 16,399,279 15,049,812 15,538,009 19,899,715 19,665,715 19,665,715 19,665,715 19,665,715
Sheriff's Office 15,261,499 13,088,657 14,288,657 13,088,657 13,088,657 13,088,657 13,088,657 13,088,657
Streets Department 38,117,652 25,051,137 36,162,311 30,407,311 29,807,311 29,807,311 29,807,311 29,807,311
Streets - Sanitation Division 92,238,646 88,139,331 89,533,157 90,945,823 92,187,330 93,465,002 94,784,845 96,140,862
Witness Fees 104,142 171,518 171,518 171,518 171,518 171,518 171,518 171,518
Youth Commission 85,281 100,000 96,000 96,000 96,000 96,000 96,000 96,000
Zoning Board of Adjustment 310,775 377,871 362,756 362,756 362,756 362,756 362,756 362,756
Zoning Code Commission 467,542 500,000 480,000 225,000 0 0 0 0
Total 3,653,725,714 3,853,096,000 3,802,932,366 3,470,094,630 3,611,579,459 3,646,861,669 3,591,111,097 3,617,172,807
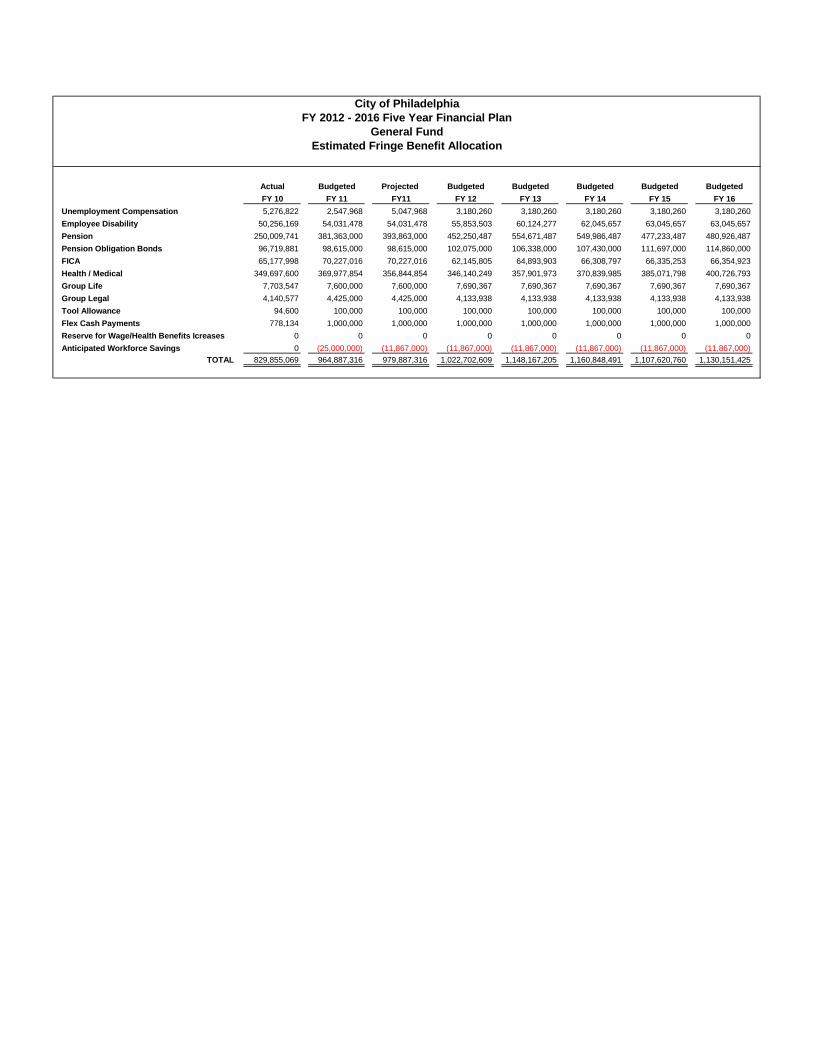
City of Philadelphia
FY 2012 - 2016 Five Year Financial Plan
General Fund
Estimated Fringe Benefit Allocation
Actual Budgeted Projected Budgeted Budgeted Budgeted Budgeted Budgeted
FY 10 FY 11 FY11 FY 12 FY 13 FY 14 FY 15 FY 16
Unemployment Compensation 5,276,822 2,547,968 5,047,968 3,180,260 3,180,260 3,180,260 3,180,260 3,180,260
Employee Disability 50,256,169 54,031,478 54,031,478 55,853,503 60,124,277 62,045,657 63,045,657 63,045,657
Pension 250,009,741 381,363,000 393,863,000 452,250,487 554,671,487 549,986,487 477,233,487 480,926,487
Pension Obligation Bonds 96,719,881 98,615,000 98,615,000 102,075,000 106,338,000 107,430,000 111,697,000 114,860,000
FICA 65,177,998 70,227,016 70,227,016 62,145,805 64,893,903 66,308,797 66,335,253 66,354,923
Health / Medical 349,697,600 369,977,854 356,844,854 346,140,249 357,901,973 370,839,985 385,071,798 400,726,793
Group Life 7,703,547 7,600,000 7,600,000 7,690,367 7,690,367 7,690,367 7,690,367 7,690,367
Group Legal 4,140,577 4,425,000 4,425,000 4,133,938 4,133,938 4,133,938 4,133,938 4,133,938
Tool Allowance 94,600 100,000 100,000 100,000 100,000 100,000 100,000 100,000
Flex Cash Payments 778,134 1,000,000 1,000,000 1,000,000 1,000,000 1,000,000 1,000,000 1,000,000
Reserve for Wage/Health Benefits Icreases 0 0 0 0 0 0 0 0
Anticipated Workforce Savings 0 (25,000,000) (11,867,000) (11,867,000) (11,867,000) (11,867,000) (11,867,000) (11,867,000)
TOTAL 829,855,069 964,887,316 979,887,316 1,022,702,609 1,148,167,205 1,160,848,491 1,107,620,760 1,130,151,425


City of Philadelphia
Fiscal Year 2012 Operating Budget
FY 2012-2016 Five Year Plan
General Fund Full-Time Positions
Filled FY 2011 Filled 12/10 FY 2012 FY 2013 FY 2014 FY 2015 FY 2016
Department Positions Adopted Increment Adopted Proposed Proposed Proposed Proposed
6/30/10 Budget Run Budget Budget Budget Budget Budget
Atwater Kent Museum 4 4 4 4 4 4 4 4
Auditing 120 123 113 122 122 122 122 122
Board of Building Standards 1 1 1 1 1 1 1 1
Board of L & I Review 2 2 2 2 2 2 2 2
Board of Ethics 7 9 7 9 9 9 9 9
Bd. of Revision of Taxes 112 110 6 10 10 10 10 10
City Commissioners 102 88 99 98 98 98 98 98
City Council 176 195 171 195 195 195 195 195
City Planning Commission 40 38 34 38 38 38 38 38
City Representative 7 7 7 7 7 7 7 7
City Treasurer 11 14 12 14 14 14 14 14
Civil Service Commission 2 2 2 2 2 2 2 2
Commerce 24 25 24 25 25 25 25 25
Clerk of Quarter Sessions 106 115 0 0 0 0 0 0
District Attorney - Total 410 421 419 422 422 422 422 422
Civilian 400 407 408 410 410 410 410 410
Uniformed 10 14 11 12 12 12 12 12
Division of Technology 174 283 262 284 284 284 284 284
Finance 141 144 141 145 145 145 145 145
Fire 2,187 2,327 2,149 2,229 2,327 2,327 2,327 2,327
Civilian 103 110 103 110 110 110 110 110
Uniformed 2,084 2,217 2,046 2,119 2,217 2,217 2,217 2,217
First Judicial District 1,756 1,776 1,857 1,977 1,977 1,977 1,977 1,977
Fleet Management 292 283 275 283 283 283 283 283
Free Library 602 636 593 641 641 641 641 641
Historical Commission 6 6 6 6 6 6 6 6
Human Relations Commission 33 33 32 32 32 32 32 32
Human Services 1,751 1,828 1,680 807 807 807 807 807
Labor Relations 7 7 6 8 8 7 7 7
Law 176 190 171 148 148 148 148 148
Licenses & Inspections 305 320 278 312 312 312 312 312
Managing Director 112 122 122 145 145 145 145 145
Mayor 38 39 35 35 35 35 35 35
Mayor's Office of Transportation 8 8 8 10 10 10 10 10
Mural Arts Program 12 12 11 12 12 12 12 12
Office of Arts and Culture 2 2 2 2 2 2 2 2
Office of Behavioral Health 22 24 21 21 20 19 19 19
Office of Human Resources 53 79 69 80 80 80 80 80
Office of Inspector General 15 19 14 18 18 18 18 18
Office of Property Assessment 0 0 136 228 228 228 228 228
Office of Supportive Housing 124 132 117 118 118 118 118 118
Parks & Recreation 591 689 592 627 627 627 627 627
Police 7,378 7,470 7,248 7,371 7,371 7,371 7,371 7,371
Civilian 782 846 779 846 846 846 846 846
Uniformed 6,596 6,624 6,469 6,525 6,525 6,525 6,525 6,525
Prisons 2,254 2,360 2,218 2,310 2,310 2,310 2,310 2,310
Procurement 46 50 42 49 49 49 49 49
Public Health 662 742 659 731 744 744 744 744
Public Property 123 136 125 129 129 129 129 129
Records 59 63 55 63 63 63 63 63
Register of Wills 63 64 62 65 65 65 65 65
Revenue 250 262 248 298 298 298 298 298
Sheriff 230 245 221 245 245 245 245 245
Streets 1,693 1,783 1,659 1,785 1,785 1,785 1,785 1,785
Youth Commission 1 1 1 1 1 1 1 1
Zoning Code Commission 2 2 2 2 0 0 0 0
Zoning Board of Adjustment 5 5 5 5 5 5 5 5
TOTAL GENERAL FUND 22,297 23,296 22,023 22,171 22,279 22,277 22,277 22,277
- The Adopted Budget position counts represent the maximum level of positions during the year. Attrition lowers the position count
throughout the year.