Embed Size (px)
Citation preview

To subscribe to our Daily Focus, please contact us at [email protected]
Mirae Asset Sekuritas Indonesia
12 April, 2019
Market Index
Last Trade Chg (%) MoM YoY
JCI 6,410.2 -1.1 2.0 2.7
MSCI Indonesia 25.8 -2.4 4.1 -5.6
MSCI EM 1,087.5 -0.8 4.2 -6.9
HANG SENG 29,839.5 -0.9 4.1 -2.3
KOSPI 2,224.4 -0.2 3.1 -8.9
FTSE 7,418.0 0 3.8 2.3
DJIA 26,143.1 -0.1 2.4 6.8
NASDAQ 7,947.4 -0.2 4.9 11.5
Valuation
2018F P/E (x) P/B (x) ROE (%)
JCI 15.6 2.3 17.8
Key Rates
Last Trade Chg (bps) MoM YoY
BI 7-Day RR 6.00 0 25 -100
3yr 7.07 -1 -20 98
10yr 7.68 0 -19 109
FX
Last Trade Chg (%) MoM YoY
USD/IDR 14,140.0 -0.1 -1.0 2.9
USD/KRW 1,139.2 0.0 0.8 6.5
USD/JPY 111.7 0.6 0.3 4.0
USD/CNY 6.7 0.1 -0.2 7.1
Commodities
Last Trade Chg (%) MoM YoY
WTI 63.6 -1.6 11.8 21.3
Gold 1,292.5 -1.2 -0.7 -3.2
Coal 84.2 2.4 -11.0 -10.1
Palm Oil 2,040.0 -0.8 3.0 -14.7
Rubber 142.7 0.1 0.4 9.5
Nickel 12,976.0 -1.9 -1.0 -5.4
Copper 6,408.0 -0.9 -1.0 -6.1
Tin 20,575.0 -1.3 -1.0 -0.7
JCI Index VS MSCI Emerging Markets
Market commentary
Hariyanto Wijaya CFA, CPA (Aust), CMT ([email protected])
IHSG ditutup melemah -1,1% pada hari Kamis dipimpin oleh BMRI sebagai
kontributor drag terbesar untuk JCI. Hampir semua sektor turun kecuali sektor
mining. Harga saham INDF turun setelah pengumuman rencananya untuk
memprivatisasi anak perusahaannya yang terdaftar di Singapura, Indofood Agri
Resources. Kami perkirakan IHSG akan trade mixed to lower hari ini. Investor
mengawasi data neraca perdagangan Indonesia Maret, yang akan dirilis pada 15
April (Senin).
Indeks AS ditutup relatif flat pada hari Kamis karena investor gelisah menjelang
1Q19 earnings seasons, yang akan dimulai Jumat ini dari JP Morgan dan Wells
Fargo. S&P 500’s 1Q19 earnings sekarang diperkirakan akan turun 4,2% YoY,
penurunan YoY earnings terbesar sejak kuartal pertama 2016. Investor menilai
pada earnings apakah potendi pertumbuhan YoY negatif dalam earnings 1Q19
hanya one-quarter blip atau justru menuju ke earnings recession.
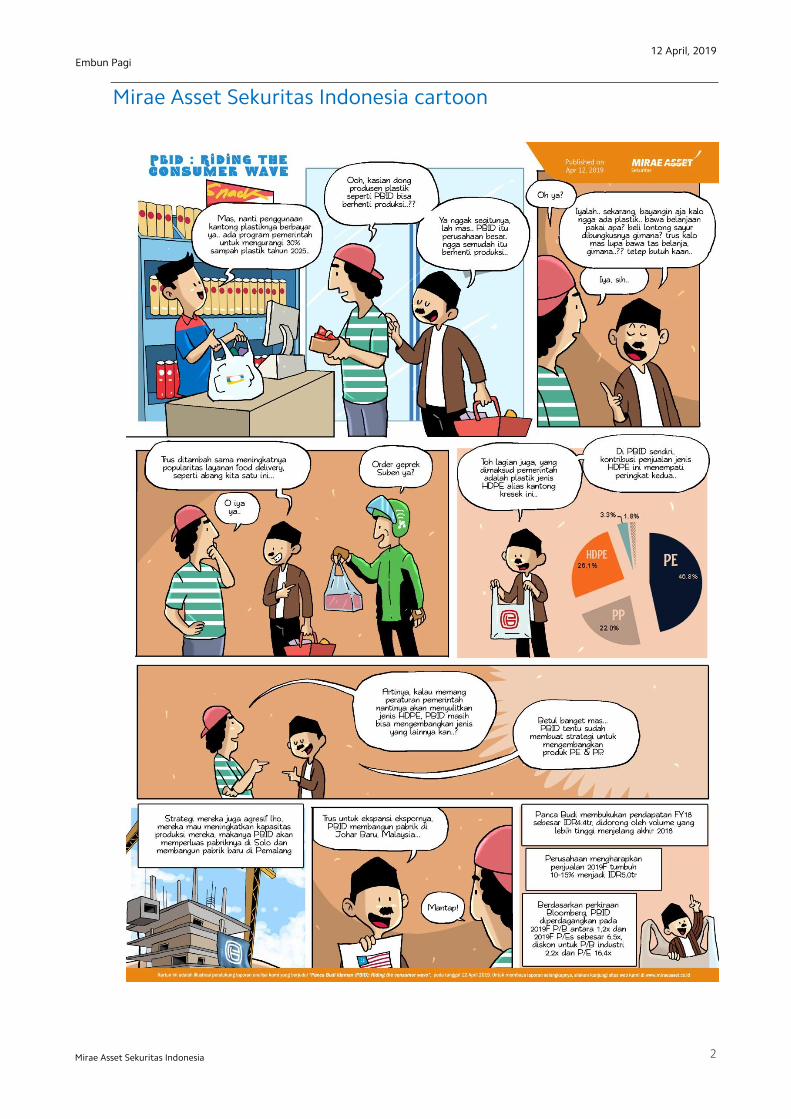
[Trend Focus] Panca Budi Idaman (PBID): Riding the consumer wave
Nur Marini ([email protected])
Kami bertemu dengan Bapak Sandri Oarto, Direktur Panca Budi Idaman (PBID) di
Kawasan Pusat Niaga, Daan Mogot, Tangerang. PBID adalah pemain terkemuka di
Indonesia dengan salah satu tingkat konsumsi kemasan plastik terendah di
ASEAN. Kegiatan bisnis perusahaan mencakup dari perdagangan resin plastik,
produksi kemasan plastik, dan distribusi kemasan plastik baik domestik maupun
ekspor. Perusahaan ini memperluas pabriknya di Jawa Tengah dan Johor Bahru,
Malaysia, yang akan membawa total kapasitas tahunan menjadi 122.000 ton per
tahun (+33,8% vs kapasitas saat ini) pada 2019F. Kami percaya peningkatan
kapasitas juga harus menjadi investasi positif bagi perusahaan, mengingat
kapasitas produksinya saat ini tidak dapat memenuhi permintaan yang lebih
tinggi untuk produk PBID.
Panca Budi membukukan pendapatan FY18 sebesar IDR4.4tr, didorong oleh volume
yang lebih tinggi menjelang akhir 2018. Perusahaan mengharapkan penjualan
2019F tumbuh 10-15% menjadi IDR5.0tr dengan laba bersih di atas 7%.
Berdasarkan perkiraan Bloomberg, PBID diperdagangkan pada 2019F P/B antara
1,2x dan 2019F P/Es sebesar 6,5x, diskon untuk P/B industri 2,2x dan P/E 16,4x.
550
800
1,050
1,300
1,550
4,000
5,000
6,000
7,000
01/1607/16 01/1707/17 01/1807/18 01/19
JCI MSCI EM (pt) (pt)
12 April, 2019
2
Embun Pagi
Mirae Asset Sekuritas Indonesia
Mirae Asset Sekuritas Indonesia cartoon
12 April, 2019
3
Embun Pagi
Mirae Asset Sekuritas Indonesia
Local flashes
BBCA: BCA jadi bank terbaik di Indonesia versi Forbes. PT Bank Central Asia Tbk (BBCA,
anggota indeks Kompas100 ini) mendapat predikat sebagai bank terbaik di tanah air oleh
Forbes. Riset yang dirilis akhir Februari lalu dilakukan Forbes dengan menggandeng
perusahaan riset Statista. Dalam risetnya Statista merilis peringkat bank di 23 negara
berbeda berdasarkan kualitas pelayanan lembaga keuangan atau bank di negara masing-
masing. (Kontan)
SDPC: Millenium Pharmacon (SDCP) akan bagi dividen Rp 19,44 miliar. PT Millenium
Pharmacon International Tbk (SDCP) akan membagikan dividen tunai dari hasil keuntungan
dari tahun buku 2018. Rencana tersebut telah mendapat restu dari para pemegang saham
pada Rapat Umum Pemegang Saham Tahunan (RUPST) yang diselenggarakan pada Selasa
(9/4). Mengutip keterbukaan informasi pada laman Bursa Efek Indonesia (BEI) pada Kamis
(11/4), SDCP akan membagikan dividen senilai Rp 3,82 miliar atau setara dengan 19,65% dari
laba bersih emiten farmasi ini sebesar Rp 19,44 miliar pada 2018. Setiap pemegang saham
akan memperoleh dividen tunai sebesar Rp 3 per saham. (Kontan)
DILD: Intiland Development (DILD) jalin kerja sama pengembangan Poins Square. PT
Intiland Development Tbk (DILD) tengah berupaya meningkatkan kinerjanya pada tahun
2019 ini. Hari ini (11/4), DILD lewat anak usahanya PT Inti Sarana Ekaraya menandatangani
nota perjanjian kerja sama dengan PT Menara Prambanan untuk proyek pengembangan
mixed use and high rise Poins Square Jakarta Selatan. Sekadar info, PT Menara Prambanan
merupakan pengembang yang membangun Poins Square pada tahun 2005. Poins Square
merupakan proyek mixed use and high rise terpadu seluas 2,5 hektare (ha) di Jalan RA Kartini,
Lebak Bulus, Jakarta Selatan. (Kontan)
ELSA: Elnusa (ELSA) siapkan belanja modal Rp 1 triliun tahun ini. PT Elnusa Tbk
menyiapkan belanja modal atau capital expenditure (capex) sebanyak Rp 1 triliun untuk
tahun ini, nilai tersebut meningkat 66,67% ketimbang alokasi belanja modal pada tahun lalu
Rp 600 miliar. Head of Corporate Communications Elnusa, Wahyu Irfan menyampaikan dana
belanja modal ini diperoleh dari pinjaman serta pembiayaan dari internal perusahaan.
(Kontan)
PBRX: PBRX tetap jalankan ekspansi sesuai rencana. PT Pan Brothers megalokasikan dana
US$ 17 juta untuk ekspansi. Berdasarkan data yang dihimpun Kontan.co.id, untuk mencapai
target produksi PT Pan Brother berencana menambah kapasitas dengan modernisasi,
otomisasi, digitalisasi produksi. PT Pan Brother juga akan meningkatkan kinerja sumber daya
manusia up-skilling dan re-skilling. Setidaknya dana sebesar US$ 12 juta dikucurkan untuk
peningkatan ini. Sementara itu, di kuartal II 2019 Pan Brothers berencana ekspansi
greenfield PBRX di Tasikmalaya. Setidaknya kapasitas yang ditambahkan setara 6 juta
potong polo Tshirt. Hingga akhir 2019, diperkirakan kapasitas produksi dapat mencapai 106
juta pieces. Untuk merealisasikan hal ini, sebesar US$ 5 juta ditanamkan untuk kapasitas di
Tasikmalaya (Kontan)
ADHI: Tahun politik tak buat ADHI tunda ekspansi. PT Adhi Karya (Persero) Tbk tak jadikan
Pemilu untuk menunda ekspansi. Hanya saja, sepanjang kuartal I ini pihaknya masih
menggarap proyek tahun lalu. Entus Asnawi, Direktur Keuangan PT Adhi Karya (Persero) Tbk
menyebutkan bahwa pihaknya tak terkendala dengan adanya Pemilu. "Sampai saat ini kami
masih jalan terus," ujarnya saat dihubungi kontan.co.id, Kamis (11/4). Menurutnya walaupun
Pemilu, proyek-proyeknya harus tetap bisa selesai. Hanya saja, sepanjang kuartal I ini
pihaknya masih menggarap proyek eksisting. Sedangkan untuk proyek jalan tol di Yogyakarta
pihaknya masing menunggu hasil perhitungan konsultan. "Sebab yang memprakasa sudah
ada, dan selanjutnya menunggu inspeksi konsultan,"(Kontan)

12 April, 2019
4
Embun Pagi
Mirae Asset Sekuritas Indonesia
Technical analysis
Tasrul +62-21-515-1140 [email protected]
Jakarta Composite Index (JCI) – Consolidation
IHSG akan coba bertahan sekitar normal lower band pada pola uptrend jangka
pendek.
IHSG saat ini berada dalam pola uptrend jangka pendek dimana korelasi pergerakkan
indeks ini masih relatif valid (r-squared = 0.860) sejak 130 hari terakhir dimana bergerak
normal dalam rentang +/- 1.48 std.deviasi dari centerline. Peluang IHSG bergerak di luar
pergerakan normal sekitar +14% atau sekitar 18 bar chart. Rata-rata volatilitas normal
pergerakan IHSG secara harian saat ini antara +0.43% / - 0.47% atau +27.56/ -30.13
point (rata-rata pergerakan normal positif / negatif selama periode analisis)
sebagaimana terlihat pada Figure 1.
Summary
Item Data Item Data
Close (April 11, 2019) 6,410.17(-1.05%) Trading range 6,401 - 6,431
8Average index performance (%) 2.40 Target
Period 130 - Daily 6,431
r-squared 0.8600 - Weekly 6,494
Volatility (+/-, %) +0.43/ -0.47 - Monthly 6,666
Volatility (+/-, point) +27.56/ -30.13 Stop loss 6,380
Source: Mirae Asset Sekuritas Indonesia Research
Figure 1. Daily , Short term trend – Uptrend
4 - 6,161 Source: Mirae Asset Sekuritas Indonesia Research
Created with AmiBroker - adv anced charting and technical analy sis sof tware. http://www.amibroker.com
_____ 6,459.0
_____ 6,401.0
Optimization Trading System - ©2010 - Powered by AMTA Optimization Trading System - ©2010 - Powered by AMTA Optimization Trading System - ©2010 - Powered by AMTA Optimization Trading System - ©2010 - Powered by AMTA
^JKSE [ ^JKSE ] - Daily - 4/11/2019 Open: 6,468 High: 6,473 Low: 6,410 Close: 6,410 Vol. 10,400,241,664
Prev. Avg. Price: 6,431.0
R-Squared: 0.8600
Period: 130
Std.Dev: 1.48
Volatility (+) : 0.0043
Volatility (-) : -0.0047
V-Ratio : 0.93
Chg.: -1.05%
6,410.17
6,380.65
6,467
6,468.22
6,493.56
6,646.14
6,646.14
6,798.73
6,911.64
Aug Sep Oct Nov Dec 2019 Feb Mar Apr
^JKSE - Volume = 10,400,241,664.00, MA(Volume,14) = 10,273,052,672.00
10,400,241,664
10,273,052,672
12 April, 2019
5
Embun Pagi
Mirae Asset Sekuritas Indonesia
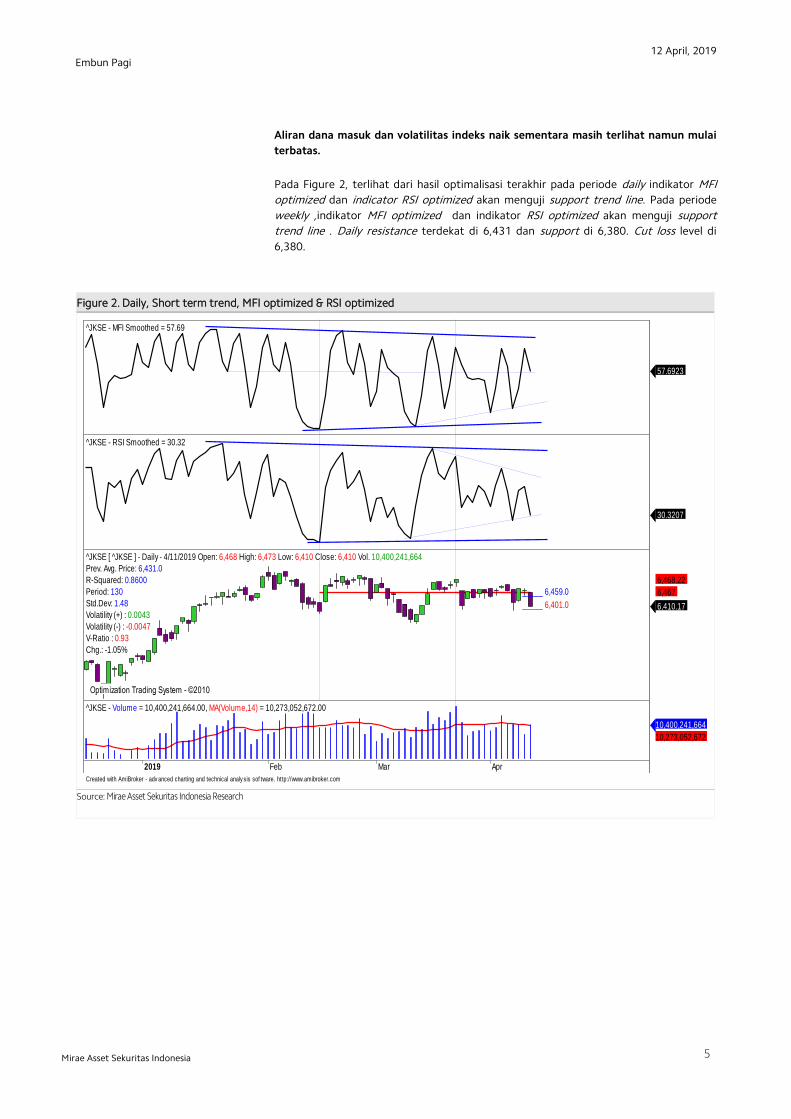
Aliran dana masuk dan volatilitas indeks naik sementara masih terlihat namun mulai
terbatas.
Pada Figure 2, terlihat dari hasil optimalisasi terakhir pada periode daily indikator MFI
optimized dan indicator RSI optimized akan menguji support trend line. Pada periode
weekly ,indikator MFI optimized dan indikator RSI optimized akan menguji support
trend line . Daily resistance terdekat di 6,431 dan support di 6,380. Cut loss level di
6,380.
Figure 2. Daily, Short term trend, MFI optimized & RSI optimized
X` x`x`
Source: Mirae Asset Sekuritas Indonesia Research
Created with AmiBroker - adv anced charting and technical analy sis sof tware. http://www.amibroker.com
^JKSE - MFI Smoothed = 57.69
57.6923
^JKSE - RSI Smoothed = 30.32
30.3207
_____ 6,459.0
_____ 6,401.0
Optimization Trading System - ©2010 Optimization Trading System - ©2010
^JKSE [ ^JKSE ] - Daily - 4/11/2019 Open: 6,468 High: 6,473 Low: 6,410 Close: 6,410 Vol. 10,400,241,664
Prev. Avg. Price: 6,431.0
R-Squared: 0.8600
Period: 130
Std.Dev: 1.48
Volatility (+) : 0.0043
Volatility (-) : -0.0047
V-Ratio : 0.93
Chg.: -1.05%
6,410.17
6,467
6,468.22
2019 Feb Mar Apr
^JKSE - Volume = 10,400,241,664.00, MA(Volume,14) = 10,273,052,672.00
10,400,241,664
10,273,052,672

12 April, 2019
6
Embun Pagi
Mirae Asset Sekuritas Indonesia
Figure 3. Weekly Trend – Uptrend, MFI optimized & W%R optimized
A
Source: Mirae Asset Sekuritas Indonesia Research
IHSG akan coba bertahan diatas level 6,431
Pada pergerakkan daily, rata-rata koreksi normal sekitar -0.47% saat ini di -1.09%
Sementara itu pada pergerakan weekly koreksi normal rata-rata sekitar -1.31%,
sementara saat ini di level +0.99%. Pada pergerakan monthly saat ini di level -0.91%,
normal koreksi -3.17%. Dengan demikian diperkirakan potensi koreksi sementara akan
tertahan pada pergerakkan daily. Pada Figure 4,5 dan 6 terlihat perkiraan normal trading
range untuk masing-masig periode.
Figure 4. Daily : 6,,401– 6,431 Figure 5. Weekly : 6,346 - 6,494 Figure 6. Monthly : 6,232 – 6,666
x
x x`
Source: Mirae Asset Sekuritas Indonesia Research
Source: Mirae Asset Sekuritas Indonesia Research
Source: Mirae Asset Sekuritas Indonesia Research
Created with AmiBroker - adv anced charting and technical analy sis sof tware. http://www.amibroker.com
^JKSE - MFI Smoothed = 41.42
41.4155
^JKSE - Will%R Smoothed = -49.23
-49.2341
_____ 6,493.5
_____ 6,345.5
Optimization Trading System - ©2010 Optimization Trading System - ©2010
^JKSE [ ^JKSE ] - Weekly - 4/11/2019 Open: 6,480 High: 6,488 Low: 6,391 Close: 6,410 Vol. 40,329,633,792
Prev. Avg. Price: 6,429.5
R-Squared: 0.8319
Period: 30
Std.Dev: 1.38
Volatility (+) : 0.0099
Volatility (-) : -0.0131
V-Ratio : 0.76
Chg.: -0.99%
6,410.17
6,302.58
6,467.52
Jul Oct 2018 Apr Jul Oct 2019 Apr
^JKSE - Volume = 40,329,633,792.00, MA(Volume,9) = 47,957,962,752.00
40,329,633,792
47,957,962,752
Created with AmiBroker - adv anced charting and technical analy sis sof tware. http://www.amibroker.com
_____ 6,459.0
_____ 6,401.0
6,431.0
6,380.0
^JKSE [ ^JKSE ] - Daily - 4/11/2019 Open:
Prev. Avg. Price: 6,431.0
R-Squared: 0.8600
Period: 130
Std.Dev: 1.48
Volatility (+) : 0.0043
Volatility (-) : -0.0047
V-Ratio : 0.93
Chg.: -1.05%
6,410.17
Mar Apr
^JKSE - Volume = 10,400,241,664.00
10,400,241,664
Created with AmiBroker - adv anced charting and technical analy sis sof tware. http://www.amibroker.com
_____ 6,493.5
_____ 6,345.5
6,429.5
^JKSE [ ^JKSE ] - Weekly - 4/11/2019 Open:
Prev. Avg. Price: 6,429.5
R-Squared: 0.8319
Period: 30
Std.Dev: 1.38
Volatility (+) : 0.0099
Volatility (-) : -0.0131
V-Ratio : 0.76
Chg.: -0.99%
6,410.17
Feb Mar Apr
^JKSE - Volume = 40,329,633,792.00
40,329,633,792
Created with AmiBroker - adv anced charting and technical analy sis sof tware. http://www.amibroker.com
_____ 6,665.6
_____ 6,232.0
6,435.9
^JKSE [ ^JKSE ] - Monthly - 4/11/2019 Open:
Prev. Avg. Price: 6,435.9
R-Squared: 0.8930
Period: 120
Std.Dev: 1.62
Volatility (+) : 0.0357
Volatility (-) : -0.0317
V-Ratio : 1.13
Chg.: -0.91%
6,410.17
Oct 2019
^JKSE - Volume = 81,919,909,888.00
81,919,909,888

12 April, 2019
7
Embun Pagi
Mirae Asset Sekuritas Indonesia
Stocks on our focus list
Surya Esa Perkasa (ESSA) – Daily , Buy on Weakness
Harga akan coba bertahan diatas normal lower band pada uptrend channel
Secara umum harga saham ini berada dalam pola uptrend channel periodedaily dimana
korelasi pergerakkan harga masih relatif valid (r-squared = 0.764) selama 181 hari
terakhir yang bergerak normal dalam rentang +/- 1.18 std.deviasi dari center line.
Peluang harga keluar dari pergerakan normal sekitar +23.64% (sekitar 43 bar chart ).
Rata-rata volatilitas normal pergerakan harga saat ini antara +10.80%/-8.89% atau
+10.80 rupiah/ -8.89 rupiah (rata-rata pergerakan normal positif / negatif, selama
periode analisis) sebagaimana terlihat pada Figure 7.
Summary
Item Data Item Data
Close (April 11, 2019) 366 (-3.17%) Trading range 362 - 382
Relative Avg. Price performance to JCI (%) 3.78 Target
β (beta) 1.07 - Daily 382
Corelation 0.77 - Weekly 402
Period 185 - Monthly 448
r-squared 0.764 Stop loss 360
Volatility (+/-, %) +2.95/ -2.43
Volatility (+/-, Rp.) +10.80/-8.89
Source: Mirae Asset Sekuritas Indonesia Research
Figure 7.Daily trend – Uptrend
ource: Mirae Asset Sekuritas Indonesia Research
Aliran dana masuk masih terlihat dan volatilitas harga turun mulai tertahan.
Created with AmiBroker - adv anced charting and technical analy sis sof tware. http://www.amibroker.com
_____ 381.6
_____ 361.7
Optimization Trading System - ©2010 Optimization Trading System - ©2010 Optimization Trading System - ©2010 Optimization Trading System - ©2010
ESSA.JK [ ESSA.JK ] - Daily - 4/11/2019 Open: 380 High: 380 Low: 366 Close: 366 Vol. 22,695,800
Prev. Avg. Price: 370.7
R-Squared: 0.7636
Period: 185
Std.Dev: 1.18
Volatility (+) : 0.0295
Volatility (-) : -0.0243
V-Ratio : 1.22
Chg.: -3.17% 366
365.965
360.911
323.238
392.985
399.617
399.617
433.27
475.997
Jun Jul Aug Sep Oct Nov Dec 2019 Feb Mar Apr
ESSA.JK - Volume = 22,695,800.00, MA(Volume,22) = 36,998,868.00
22,695,800
36,998,868

12 April, 2019
8
Embun Pagi
Mirae Asset Sekuritas Indonesia
Pada Figure 8, terlihat dari hasil optimasi pada indikator MFI optimized masih
cenderung naik dan W%R optimized akan menguji support trend line. Daily support
362 dan resistance di 382. Cut loss level di 360.
Figure 8. Daily, MFI optimized & W%R optimized
X`Source: Mirae Asset Sekuritas Indonesia Research
Created with AmiBroker - adv anced charting and technical analy sis sof tware. http://www.amibroker.com
ESSA.JK - MFI Smoothed = 34.63
34.6329
ESSA.JK - RSI Smoothed = 20.20
20.1981
_____ 381.6
_____ 361.6
Optimization Trading System - ©2010 Optimization Trading System - ©2010
ESSA.JK [ ESSA.JK ] - Daily - 4/11/2019 Open: 380 High: 380 Low: 366 Close: 366 Vol. 22,695,800
Prev. Avg. Price: 370.7
R-Squared: 0.7636
Period: 185
Std.Dev: 1.18
Volatility (+) : 0.0295
Volatility (-) : -0.0245
V-Ratio : 1.21
Chg.: -3.17%
366
360.911
392.985
Oct Nov Dec 2019 Feb Mar Apr
ESSA.JK - Volume = 22,695,800.00, MA(Volume,22) = 36,998,868.00
22,695,800
36,998,868

12 April, 2019
9
Embun Pagi
Mirae Asset Sekuritas Indonesia
Harga akan coba naik dan bertahan diatas rata-rata pada masing-masing periode.
Untuk mampu naik lebih lanjut, harga saham saat ini harus mampu minimal bertahan
diatas rata-rata masing-masing periode (positive area). Pada pergerakkan daily harga
saat ini di level -3.17%. Normal koreksi -0.243%. Pada pergerakkan weekly koreksi
normal di level -5.41%, saat ini di level -6.15% Sementara itu pada pergerakan monthly
saat ini di -8.50% dan normal koreksi -9.64%. Dengan demikian potensi koreksi pada
pada pergerakkan daily mulai terbatas. Pada Figure 9,10 dan 11 terlihat perkiraan
normal trading range untuk masing-masing periode.
Figure 9. Daily : 362 –382 Figure 10. Weekly : 356 – 402 Figure 11. Monthly : 350 – 448
x`x`
25
Source: Mirae Asset Sekuritas Indonesia Research
Source: Mirae Asset Sekuritas Indonesia Research
Source: Mirae Asset Sekuritas Indonesia Research
Created with AmiBroker - adv anced charting and technical analy sis sof tware. http://www.amibroker.com
_____ 381.6
_____ 361.7
370.7
ESSA.JK [ ESSA.JK ] - Daily - 4/11/2019
Prev. Avg. Price: 370.7
R-Squared: 0.7636
Period: 185
Std.Dev: 1.18
Volatility (+) : 0.0295
Volatility (-) : -0.0243
V-Ratio : 1.22
Chg.: -3.17%
366
18 25 Apr 8
ESSA.JK - Volume = 22,695,800.00
22,695,800
Created with AmiBroker - adv anced charting and technical analy sis sof tware. http://www.amibroker.com
_____ 401.7
_____ 355.7
376.0
ESSA.JK [ ESSA.JK ] - Weekly - 4/11/2019
Prev. Avg. Price: 376.0
R-Squared: 0.7874
Period: 41
Std.Dev: 1.24
Volatility (+) : 0.0683
Volatility (-) : -0.0541
V-Ratio : 1.26
Chg.: -6.15%
366
Feb Mar Apr
ESSA.JK - Volume = 136,584,704.00
136,584,704
Created with AmiBroker - adv anced charting and technical analy sis sof tware. http://www.amibroker.com
_____ 447.2
_____ 349.4
386.7
ESSA.JK [ ESSA.JK ] - Monthly - 4/11/2019
Prev. Avg. Price: 386.7
R-Squared: 0.7430
Period: 38
Std.Dev: 1.13
Volatility (+) : 0.1566
Volatility (-) : -0.0964
V-Ratio : 1.62
Chg.: -8.50%
366
Oct 2019
ESSA.JK - Volume = 400,309,184.00
400,309,184
12 April, 2019
10
Embun Pagi
Mirae Asset Sekuritas Indonesia
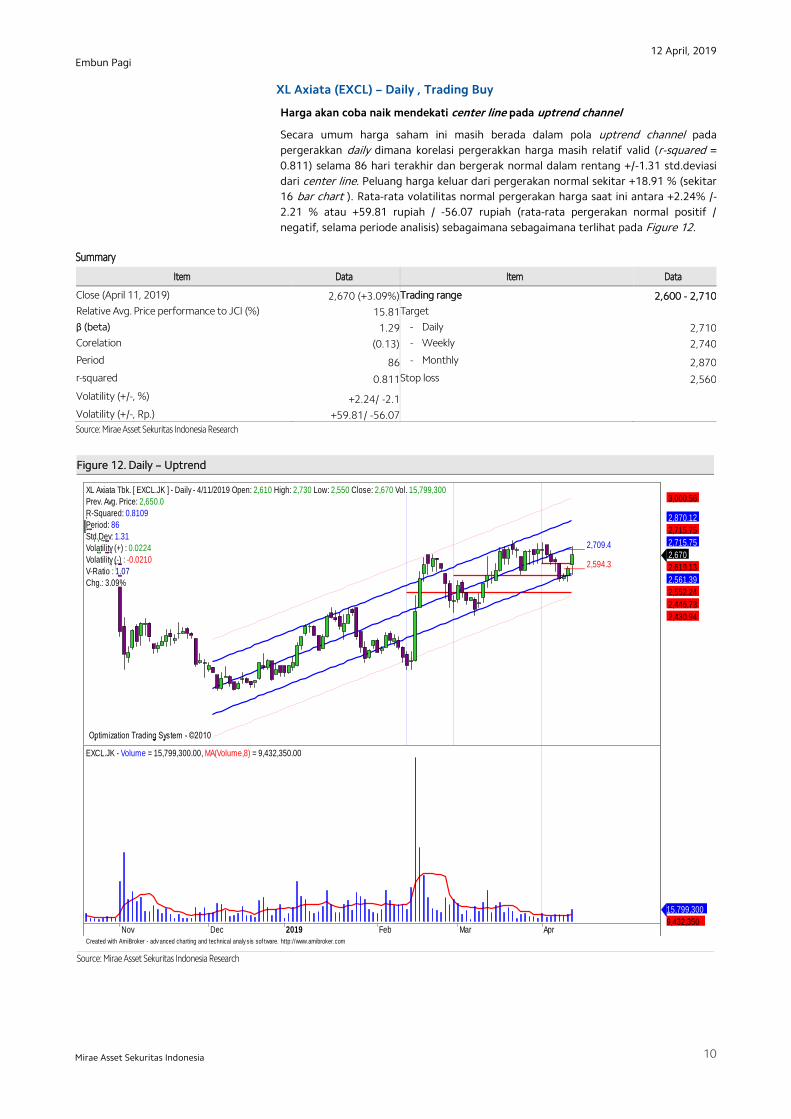
XL Axiata (EXCL) – Daily , Trading Buy
Harga akan coba naik mendekati center line pada uptrend channel
Secara umum harga saham ini masih berada dalam pola uptrend channel pada
pergerakkan daily dimana korelasi pergerakkan harga masih relatif valid (r-squared =
0.811) selama 86 hari terakhir dan bergerak normal dalam rentang +/-1.31 std.deviasi
dari center line. Peluang harga keluar dari pergerakan normal sekitar +18.91 % (sekitar
16 bar chart ). Rata-rata volatilitas normal pergerakan harga saat ini antara +2.24% /-
2.21 % atau +59.81 rupiah / -56.07 rupiah (rata-rata pergerakan normal positif /
negatif, selama periode analisis) sebagaimana sebagaimana terlihat pada Figure 12.
Summary
Item Data Item Data
Close (April 11, 2019) 2,670 (+3.09%) Trading range 2,600 - 2,710
Relative Avg. Price performance to JCI (%) 15.81 Target
β (beta) 1.29 - Daily 2,710
Corelation (0.13) - Weekly 2,740
Period 86 - Monthly 2,870
r-squared 0.811 Stop loss 2,560
Volatility (+/-, %) +2.24/ -2.1
Volatility (+/-, Rp.) +59.81/ -56.07
Source: Mirae Asset Sekuritas Indonesia Research
Figure 12. Daily – Uptrend
x`
Source: Mirae Asset Sekuritas Indonesia Research
,
Created with AmiBroker - adv anced charting and technical analy sis sof tware. http://www.amibroker.com
_____ 2,709.4
_____ 2,594.3
Optimization Trading System - ©2010 Optimization Trading System - ©2010 Optimization Trading System - ©2010 Optimization Trading System - ©2010 Optimization Trading System - ©2010
XL Axiata Tbk. [ EXCL.JK ] - Daily - 4/11/2019 Open: 2,610 High: 2,730 Low: 2,550 Close: 2,670 Vol. 15,799,300
Prev. Avg. Price: 2,650.0
R-Squared: 0.8109
Period: 86
Std.Dev: 1.31
Volatility (+) : 0.0224
Volatility (-) : -0.0210
V-Ratio : 1.07
Chg.: 3.09%
2,670
2,619.13
2,561.39
2,552.24
2,446.73
2,430.94
2,715.75
2,715.75
2,870.12
3,000.56
Nov Dec 2019 Feb Mar Apr
EXCL.JK - Volume = 15,799,300.00, MA(Volume,8) = 9,432,350.00
15,799,300
9,432,350

12 April, 2019
11
Embun Pagi
Mirae Asset Sekuritas Indonesia
Aliran dana masuk dan volatilitas harga naik masih terlihat.
Pada Figure 13, terlihat dari hasil optimalisasi, indikator MFI optimized dan RSI
optimized masih cenderung bergerak naik. Daily support 2,600 dan resistance di
2,710. Cut loss level di 2,560.
Figure 13. Daily, MFI optimized & RSI optimized
,
Source: Mirae Asset Sekuritas Indonesia Research
Created with AmiBroker - adv anced charting and technical analy sis sof tware. http://www.amibroker.com
EXCL.JK - MFI Smoothed = 39.37
39.3687
EXCL.JK - RSI Smoothed = 63.80
63.8023
_____ 2,710.1
_____ 2,594.1
Optimization Trading System - ©2010 Optimization Trading System - ©2010
XL Axiata Tbk. [ EXCL.JK ] - Daily - 4/11/2019 Open: 2,610 High: 2,730 Low: 2,550 Close: 2,670 Vol. 15,799,300
Prev. Avg. Price: 2,650.0
R-Squared: 0.8109
Period: 86
Std.Dev: 1.31
Volatility (+) : 0.0227
Volatility (-) : -0.0211
V-Ratio : 1.08
Chg.: 3.09%
2,670
2,552.24
2,446.73
Sep Oct Nov Dec 2019 Feb Mar Apr
EXCL.JK - Volume = 15,799,300.00, MA(Volume,8) = 9,432,350.00
15,799,300
9,432,350
12 April, 2019
12
Embun Pagi
Mirae Asset Sekuritas Indonesia
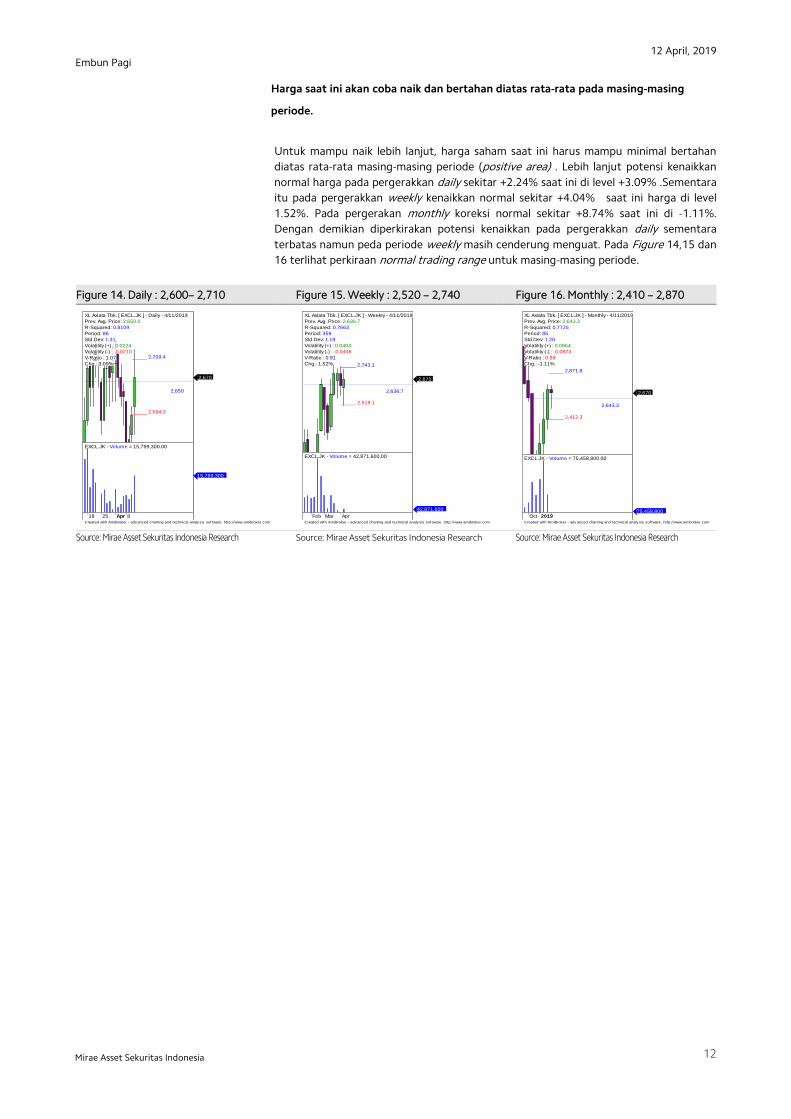
Harga saat ini akan coba naik dan bertahan diatas rata-rata pada masing-masing
periode.
Untuk mampu naik lebih lanjut, harga saham saat ini harus mampu minimal bertahan
diatas rata-rata masing-masing periode (positive area) . Lebih lanjut potensi kenaikkan
normal harga pada pergerakkan daily sekitar +2.24% saat ini di level +3.09% .Sementara
itu pada pergerakkan weekly kenaikkan normal sekitar +4.04% saat ini harga di level
1.52%. Pada pergerakan monthly koreksi normal sekitar +8.74% saat ini di -1.11%.
Dengan demikian diperkirakan potensi kenaikkan pada pergerakkan daily sementara
terbatas namun peda periode weekly masih cenderung menguat. Pada Figure 14,15 dan
16 terlihat perkiraan normal trading range untuk masing-masing periode.
Figure 14. Daily : 2,600– 2,710 Figure 15. Weekly : 2,520 – 2,740 Figure 16. Monthly : 2,410 – 2,870
, x`
x
Source: Mirae Asset Sekuritas Indonesia Research
Source: Mirae Asset Sekuritas Indonesia Research
Source: Mirae Asset Sekuritas Indonesia Research
Created with AmiBroker - adv anced charting and technical analy sis sof tware. http://www.amibroker.com
_____ 2,709.4
_____ 2,594.3
2,650
XL Axiata Tbk. [ EXCL.JK ] - Daily - 4/11/2019
Prev. Avg. Price: 2,650.0
R-Squared: 0.8109
Period: 86
Std.Dev: 1.31
Volatility (+) : 0.0224
Volatility (-) : -0.0210
V-Ratio : 1.07
Chg.: 3.09%
2,670
18 25 Apr 8
EXCL.JK - Volume = 15,799,300.00
15,799,300
Created with AmiBroker - adv anced charting and technical analy sis sof tware. http://www.amibroker.com
_____ 2,743.1
_____ 2,519.1
2,636.7
XL Axiata Tbk. [ EXCL.JK ] - Weekly - 4/11/2019
Prev. Avg. Price: 2,636.7
R-Squared: 0.7663
Period: 359
Std.Dev: 1.19
Volatility (+) : 0.0404
Volatility (-) : -0.0446
V-Ratio : 0.91
Chg.: 1.52%
2,670
Feb Mar Apr
EXCL.JK - Volume = 42,871,600.00
42,871,600
Created with AmiBroker - adv anced charting and technical analy sis sof tware. http://www.amibroker.com
_____ 2,871.8
_____ 2,412.3
2,643.3
XL Axiata Tbk. [ EXCL.JK ] - Monthly - 4/11/2019
Prev. Avg. Price: 2,643.3
R-Squared: 0.7725
Period: 85
Std.Dev: 1.20
Volatility (+) : 0.0864
Volatility (-) : -0.0874
V-Ratio : 0.99
Chg.: -1.11%
2,670
Oct 2019
EXCL.JK - Volume = 75,458,800.00
75,458,800

12 April, 2019
13
Embun Pagi
Mirae Asset Sekuritas Indonesia
Pakuwon Jati (PWON) – Daily ,Buy on Weakness
Harga akan coba bertahan diatas normal lower band pada uptrend channel.
Secara umum harga saham ini masih berada diluar pola uptrend channel dimana
korelasi pergerakkan harga masih relatif valid (r-squared = 0.823) selama30 hari
terakhir dan bergerak normal dalam rentang +/- 1.36 std.deviasi dari centerline.
Peluang harga keluar dari pergerakan normalnya sekitar +17.67% (sekitar 5 bar chart ).
Rata-rata volatilitas normal pergerakan harga saat ini antara +11.06%/ -13.37% atau
+11.06 rupiah / -13.37 rupiah (rata-rata pergerakan normal positif / negatif, selama
periode analisis) sebagaimana terlihat pada Figure 17.
Summary
Item Data Item Data
Close (April 11, 2019) 700 (-5.41%) Normal trading range 686 - 720
Relative Avg. Price performance to JCI (%) 3.78 Target
β (beta) 1.07 - Daily 720
Corelation 0.77 - Weekly 740
Period 30 - Monthly 794
r-squared 0.823 Stop loss 680
Volatility (+/-, %) +1.58/ -1.91
Volatility (+/-, Rp.) 11.06/ -13.37
Source: Mirae Asset Sekuritas Indonesia Research
Figure 17.Daily Trend – Uptrend
Source: Mirae Asset Sekuritas Indonesia Research
Aliran dana keluara dan volatilitas harga turun masih terlihat namun mulai terbatas.
,
Created with AmiBroker - adv anced charting and technical analy sis sof tware. http://www.amibroker.com
_____ 719.5
_____ 694.9
Optimization Trading System - ©2010 Optimization Trading System - ©2010 Optimization Trading System - ©2010 Optimization Trading System - ©2010
Pakuwon Jati Tbk [ PWON.JK ] - Daily - 4/11/2019 Open: 735 High: 740 Low: 685 Close: 700 Vol. 44,973,600
Prev. Avg. Price: 708.3
R-Squared: 0.8233
Period: 30
Std.Dev: 1.36
Volatility (+) : 0.0158
Volatility (-) : -0.0190
V-Ratio : 0.83
Chg.: -5.41%
700
685
682.255
717.024
734.572
742.549
742.549
768.074
800.098
2019 Feb Mar Apr
PWON.JK - Volume = 44,973,600.00, MA(Volume,7) = 34,865,784.00
44,973,600
34,865,784

12 April, 2019
14
Embun Pagi
Mirae Asset Sekuritas Indonesia
Pada Figure 18, terlihat dari hasil optimalisasi. Indikator MFI optimized dan indkator
W%R optimized akan menguji support trendline. Dengan demikian diperkirakan potensi
koreksi mulai terbatas. Perkiraan daily support di 686 dan daily resistance di 720. Cut
loss level di 680.
Figure 18. Daily,MFI optimized & W%R optimized
Source: Mirae Asset Sekuritas Indonesia Research
Created with AmiBroker - adv anced charting and technical analy sis sof tware. http://www.amibroker.com
PWON.JK - MFI Smoothed = 19.85
19.8508
PWON.JK - Will%R Smoothed = -64.38
-64.3792
_____ 719.5_____ 694.8
Optimization Trading System - ©2010 Optimization Trading System - ©2010
Pakuwon Jati Tbk [ PWON.JK ] - Daily - 4/11/2019 Open: 735 High: 740 Low: 685 Close: 700 Vol. 44,973,600
Prev. Avg. Price: 708.3
R-Squared: 0.8233
Period: 30
Std.Dev: 1.36
Volatility (+) : 0.0158
Volatility (-) : -0.0191
V-Ratio : 0.83
Chg.: -5.41%
700
682.255
734.572
Dec 2019 Feb Mar Apr
PWON.JK - Volume = 44,973,600.00, EMA(Volume,7) = 35,711,984.00
44,973,600
35,711,984
12 April, 2019
15
Embun Pagi
Mirae Asset Sekuritas Indonesia
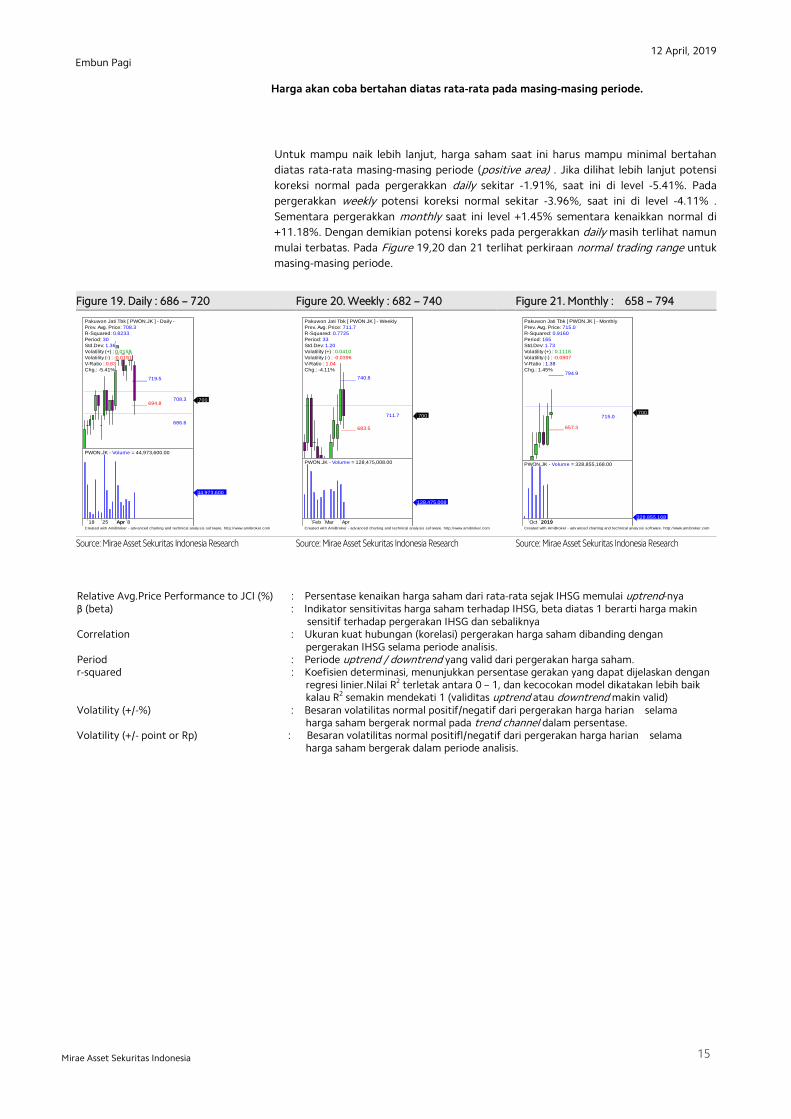
Harga akan coba bertahan diatas rata-rata pada masing-masing periode.
Untuk mampu naik lebih lanjut, harga saham saat ini harus mampu minimal bertahan
diatas rata-rata masing-masing periode (positive area) . Jika dilihat lebih lanjut potensi
koreksi normal pada pergerakkan daily sekitar -1.91%, saat ini di level -5.41%. Pada
pergerakkan weekly potensi koreksi normal sekitar -3.96%, saat ini di level -4.11% .
Sementara pergerakkan monthly saat ini level +1.45% sementara kenaikkan normal di
+11.18%. Dengan demikian potensi koreks pada pergerakkan daily masih terlihat namun
mulai terbatas. Pada Figure 19,20 dan 21 terlihat perkiraan normal trading range untuk
masing-masing periode.
Figure 19. Daily : 686 – 720 Figure 20. Weekly : 682 – 740 Figure 21. Monthly : 658 – 794
,,
x` x,
Source: Mirae Asset Sekuritas Indonesia Research
Source: Mirae Asset Sekuritas Indonesia Research
Source: Mirae Asset Sekuritas Indonesia Research
Relative Avg.Price Performance to JCI (%) : Persentase kenaikan harga saham dari rata-rata sejak IHSG memulai uptrend-nya β (beta) : Indikator sensitivitas harga saham terhadap IHSG, beta diatas 1 berarti harga makin sensitif terhadap pergerakan IHSG dan sebaliknya Correlation : Ukuran kuat hubungan (korelasi) pergerakan harga saham dibanding dengan pergerakan IHSG selama periode analisis. Period : Periode uptrend / downtrend yang valid dari pergerakan harga saham. r-squared : Koefisien determinasi, menunjukkan persentase gerakan yang dapat dijelaskan dengan regresi linier.Nilai R2 terletak antara 0 – 1, dan kecocokan model dikatakan lebih baik kalau R2 semakin mendekati 1 (validitas uptrend atau downtrend makin valid) Volatility (+/-%) : Besaran volatilitas normal positif/negatif dari pergerakan harga harian selama harga saham bergerak normal pada trend channel dalam persentase. Volatility (+/- point or Rp) : Besaran volatilitas normal positifl/negatif dari pergerakan harga harian selama harga saham bergerak dalam periode analisis.
Created with AmiBroker - adv anced charting and technical analy sis sof tware. http://www.amibroker.com
_____ 719.5
_____ 694.8708.3
686.6
Pakuwon Jati Tbk [ PWON.JK ] - Daily -
Prev. Avg. Price: 708.3
R-Squared: 0.8233
Period: 30
Std.Dev: 1.36
Volatility (+) : 0.0158
Volatility (-) : -0.0191
V-Ratio : 0.83
Chg.: -5.41%
700
18 25 Apr 8
PWON.JK - Volume = 44,973,600.00
44,973,600
Created with AmiBroker - adv anced charting and technical analy sis sof tware. http://www.amibroker.com
_____ 740.8
_____ 683.5
711.7
Pakuwon Jati Tbk [ PWON.JK ] - Weekly
Prev. Avg. Price: 711.7
R-Squared: 0.7725
Period: 33
Std.Dev: 1.20
Volatility (+) : 0.0410
Volatility (-) : -0.0396
V-Ratio : 1.04
Chg.: -4.11%
700
Feb Mar Apr
PWON.JK - Volume = 128,475,008.00
128,475,008
Created with AmiBroker - adv anced charting and technical analy sis sof tware. http://www.amibroker.com
_____ 794.9
_____ 657.3
715.0
Pakuwon Jati Tbk [ PWON.JK ] - Monthly
Prev. Avg. Price: 715.0
R-Squared: 0.9160
Period: 165
Std.Dev: 1.73
Volatility (+) : 0.1118
Volatility (-) : -0.0807
V-Ratio : 1.38
Chg.: 1.45%
700
Oct 2019
PWON.JK - Volume = 328,855,168.00
328,855,168

12 April, 2019
16
Embun Pagi
Mirae Asset Sekuritas Indonesia
Chart 22. JCI Vs. USD/IDR Chart 23. JCI performance (absolute vs. relative)
Source: Bloomberg, Mirae Asset Sekuritas Indonesia
Note: Relative to MSCI EM Index
Source: Bloomberg, Mirae Asset Sekuritas Indonesia
Chart 24. Foreigner’s net purchase (EM) Chart 25. Energy price
V
Note: The latest figure for India are April 10th, 2019
Source: Bloomberg, Mirae Asset Sekuritas Indonesia
Source: Bloomberg, Mirae Asset Sekuritas Indonesia
Chart 26. Non-ferrous metal price Chart 27. Precious metal price
Source: Bloomberg, Mirae Asset Sekuritas Indonesia Source: Bloomberg, Mirae Asset Sekuritas Indonesia
13,800
14,200
14,600
15,000
15,400
5,400
5,800
6,200
6,600
1/10 2/7 3/7 4/4
(IDR) (pt) JCI (L) USD/IDR (R)
-1.1 -1.3
0.9 1.6
-0.3
-1.5 -2.5
9.2
-4
0
4
8
12
1D 1W 1M 1Y
Absolute Relative(%, %p)
0
-190
39 2 22
185
772
136 195
131 54
447
-400
-200
0
200
400
600
800
1,000
Korea Taiwan Indonesia Thailand Philippines India
1 Day 5 Days (USDmn) (USDmn)
80
90
100
110
6/27 7/25 8/22 9/19
CPO WTI Coal(D-3M=100) (D-3M=100)
50
60
70
80
90
100
110
120
130
1/10 2/7 3/7 4/4
CPO WTI Coal(D-3M=100)
90
100
110
120
130
01/19 02/19 03/19 04/19
(D-3M=100) Copper Nickel Tin
85
95
105
115
125
01/19 02/19 03/19 04/19
(D-3M=100) Silver Gold Platinum

12 April, 2019
17
Embun Pagi
Mirae Asset Sekuritas Indonesia
Table. Key valuation metrics
Company Name Ticker Price Market Cap Price Performance (%) P/E(X)* P/B(X)* ROE(%)*
(IDR) (IDRbn) 1D 1W 1M 1Y FY18 FY19 FY18 FY19 FY18 FY19
Jakarta Composite Index JCI 6,410 7,315,490 -1.1 -1.3 0.9 1.6 15.6 13.9 2.3 2.1 17.8 2.7
FINANCIALS
Bank Central Asia BBCA 27,450 676,780 -0.8 -1.0 -0.1 18.6 24.8 26.4 4.2 4.5 18.3 18.3
Bank Mandiri Persero BMRI 7,400 345,333 -2.6 -3.6 10.4 -7.8 13.8 14.4 1.9 1.9 14.4 13.9
Bank Rakyat Indonesia Persero BBRI 4,300 530,387 -0.5 1.9 12.3 19.8 13.8 16.3 2.4 2.8 18.5 18.4
Bank Negara Indonesia Persero BBNI 9,650 179,960 -1.0 -0.5 11.2 11.6 10.9 11.8 1.5 1.7 14.5 14.6
Bank Tabungan Negara Persero BBTN 2,350 24,887 -2.5 -0.8 4.0 -35.6 21.5 23.2 1.8 2.3 9.8 10.5
CONSUMER
HM Sampoerna HMSP 3,530 410,603 -1.9 -6.4 -7.3 -13.1 32.0 31.1 12.2 11.7 39.0 38.2
Gudang Garam GGRM 77,525 149,165 -0.8 -4.5 -15.5 1.1 20.6 18.3 3.6 3.3 17.8 18.6
Indofood CBP Sukses Makmur ICBP 9,050 105,540 -3.5 0.0 -11.7 8.4 26.7 23.9 5.6 4.8 22.2 20.9
Indofood Sukses Makmur INDF 6,175 54,219 -5.4 -3.9 -13.0 -13.3 15.7 13.6 1.9 1.6 12.8 12.2
Kalbe Farma KLBF 1,515 71,016 -1.6 -1.3 0.3 -5.0 29.0 29.0 4.9 4.9 17.6 17.5
Unilever Indonesia UNVR 48,500 370,055 -1.6 -1.0 -1.0 -6.2 38.0 46.3 45.7 58.6 142.9 139.8
AGRICULTURAL
Astra Agro Lestari AALI 12,275 23,626 0.0 -1.0 0.0 -9.6 15.8 15.9 1.2 1.3 7.7 7.6
PP London Sumatera Indonesia LSIP 1,120 7,642 -1.8 -10.4 -8.6 -18.5 25.5 14.9 1.0 0.9 4.0 5.8
Sawit Sumbermas Sarana SSMS 1,050 10,001 -0.5 1.0 1.4 -26.3 138.1 17.8 2.9 2.3 2.1 12.8
INFRASTRUCTURE
XL Axiata EXCL 2,670 28,537 3.1 1.5 6.8 -0.4 N/A 743.5 1.2 1.3 -16.5 0.3
Jasa Marga JSMR 6,000 43,547 -0.8 -2.4 19.4 28.8 14.1 19.4 1.8 2.5 13.8 12.6
Perusahaan Gas Negara PGAS 2,250 54,543 -1.7 -2.6 -4.3 -4.3 11.2 14.4 1.4 1.3 9.7 8.2
Tower Bersama Infrastructure TBIG 3,850 17,446 -4.2 -5.2 2.9 -33.3 23.0 19.3 4.6 5.4 21.1 27.3
Telekomunikasi Indonesia TLKM 3,870 383,371 -2.0 -4.2 1.8 4.2 19.7 17.2 3.9 3.6 19.6 20.5
Soechi Lines SOCI 160 1,129 -1.8 -4.2 0.6 -36.5 4.7 N/A 0.2 N/A 4.2 N/A
Garuda Indonesia GIAA 436 11,287 -2.2 -7.2 -26.7 47.3 N/A N/A 0.8 1.1 -19.1 -12.0
BASIC-INDUSTRIES
Semen Indonesia SMGR 13,650 80,965 -4.5 -1.4 10.3 33.8 22.2 32.2 2.2 2.7 10.2 8.3
Charoen Pokphand Indonesia CPIN 6,200 101,668 -4.2 0.4 -10.8 63.6 26.0 22.6 6.1 5.3 26.0 25.3
Indocement Tunggal Prakarsa INTP 21,800 80,251 -3.1 -4.0 17.2 16.1 59.3 75.1 2.9 3.6 4.8 5.3
Japfa Comfeed Indonesia JPFA 1,765 20,697 -1.7 1.7 -19.8 10.3 11.5 8.8 2.6 1.9 24.5 22.1
MINING
Indo Tambangraya Megah ITMG 20,000 22,599 1.5 -4.3 -12.1 -26.4 5.8 6.0 1.6 1.6 27.1 27.0
Adaro Energy ADRO 1,300 41,582 -1.1 1.6 -6.1 -38.4 6.4 7.0 0.7 0.8 11.7 11.8
Aneka Tambang ANTM 895 21,508 0.0 -2.2 -7.7 3.5 21.0 27.2 0.9 1.2 4.6 3.9
Vale Indonesia INCO 3,370 33,485 3.1 -2.9 -6.1 8.7 36.8 33.9 1.2 1.3 3.3 4.0
Tambang Batubara Bukit Asam PTBA 4,010 46,198 -0.5 -2.2 0.0 17.3 9.0 9.1 2.8 2.8 33.9 35.3
TRADE
United Tractors UNTR 25,450 94,932 -2.3 -3.5 -2.7 -27.7 9.2 8.4 1.9 1.7 22.4 22.1
AKR Corporindo AKRA 4,890 19,632 0.4 3.2 -7.3 -13.5 24.0 22.1 2.1 2.4 20.7 13.1
Global Mediacom BMTR 352 5,398 -0.6 2.9 0.6 -43.7 4.1 N/A 0.4 N/A 8.8 N/A
Matahari Department Store LPPF 3,840 11,205 -0.3 -0.3 9.7 -64.6 14.9 6.6 8.8 3.5 53.0 65.7
Media Nusantara Citra MNCN 810 11,564 -1.2 6.6 -1.8 -44.3 5.7 8.2 0.9 1.1 16.2 14.1
Matahari Putra Prima MPPA 208 1,566 -3.7 -11.1 -16.8 -47.2 N/A N/A 2.1 N/A -69.0 N/A
Surya Citra Media SCMA 1,725 25,222 -2.3 5.2 -3.9 -36.3 18.4 16.7 6.0 5.7 35.0 34.3
Siloam International Hospital SILO 3,940 6,406 -0.3 0.5 19.4 -53.2 360.8 135.0 0.9 1.0 0.3 0.8
PROPERTY
Bumi Serpong Damai BSDE 1,420 27,330 0.7 -3.7 4.8 -20.0 18.6 14.9 0.9 1.0 5.0 6.7
Adhi Karya ADHI 1,635 5,822 -3.0 -4.1 6.9 -22.9 8.8 7.4 0.9 0.9 10.6 11.8
Alam Sutera Relaty ASRI 338 6,642 -2.9 0.6 11.9 -13.3 6.3 6.1 0.6 0.7 10.8 11.2
Ciputra Development CTRA 1,130 20,973 0.0 2.7 29.9 -8.9 15.9 20.3 1.3 1.4 8.5 7.0
Lippo Karawaci LPKR 306 7,065 0.0 3.4 20.5 -36.3 8.9 6.2 0.3 0.3 3.3 5.6
Pembangunan Perumahan PTPP 2,250 13,950 -1.7 0.9 14.8 -19.6 7.5 8.8 0.9 1.0 12.4 12.5
Pakuwon Jati PWON 700 33,712 -5.4 -6.7 11.1 12.0 11.7 14.8 2.4 2.7 22.2 19.1
Summarecon Agung SMRA 1,165 16,807 -0.4 8.4 37.1 17.1 25.9 47.4 1.7 2.6 6.7 5.4
Wijaya Karya WIKA 2,180 19,554 -1.8 -4.8 19.8 28.2 8.6 12.9 1.0 1.3 12.6 10.8
Waskita Karya WSKT 1,995 27,080 0.3 -2.2 5.3 -20.2 5.8 6.6 1.3 1.3 24.8 20.4
MISCELLANEOUS
Astra International ASII 7,550 305,651 -1.6 -0.3 5.2 -2.3 15.4 13.7 2.4 2.2 16.6 16.5
Source: Bloomberg, Mirae Asset Sekuritas Indonesia
*Note: Valuation metrics based on Bloomberg consensus estimates

12 April, 2019
18
Embun Pagi
Mirae Asset Sekuritas Indonesia
Sector performance Top 10 market cap performance
Name Index Chg (%) Ticker Price Market Cap (IDRbn) Chg (%)
Agricultural 1,488.8 -0.5 KAEF IJ 3610 20,050 11.76
Mining 1,797.5 0.3
TRIO IJ 220 5,722 4.8
Basic-Industry 849.1 -2.3 EXCL IJ 2670 28,537 3.1
Miscellaneous Industry 1,313.6 -1.4 INCO IJ 3370 33,485 3.06
Consumer Goods 2,515.0 -1.5 MLBI IJ 20450 43,088 2.25
Property & Construction 477.4 -0.6
BDMN IJ 10000 95,846 2.04
Infrastructure 1,139.6 -1.0 PSAB IJ 189 5,001 1.61
Finance 1,282.9 -0.8 ITMG IJ 20000 22,599 1.52
Trade 814.5 -0.8 BTPN IJ 3680 29,982 1.38
Composite 6,410.2 -1.1 JRPT IJ 595 8,181 0.85 Source: Bloomberg
Top 5 leading movers Top 5 lagging movers
Name Chg (%) Close Name Chg (%) Close
TCPI IJ 24.8 4,380 BMRI IJ -2.6 7,400
KAEF IJ 11.8 3,610 HMSP IJ -1.9 3,530
BDMN IJ 2.0 10,000 TLKM IJ -2.0 3,870
MDKA IJ 11.4 3,800 UNVR IJ -1.6 48,500
INCO IJ 3.1 3,370 BBCA IJ -0.8 27,450 Source: Bloomberg
Economic Calendar
Time Currency Detail Forecast Previous
12:00am CAD Gov Council Member Wilkins Speaks
12:01am USD 30-y Bond Auction 3.01|2.3
3:00am USD FOMC Member Bowman Speaks
5:30am NZD Business NZ Manufacturing Index 53.4
5:48am NZD Visitor Arrivals m/m -0.3%
8:30am AUD RBA Financial Stability Review
Tentative CNY Trade Balance 2B 34B
Tentative CNY USD-Denominated Trade Balance 7.7B 4.1B
12th-17th CNY Foreign Direct Investment ytd/y 5.5%
4:00pm EUR Industrial Production m/m -0.5% 1.4%
12th-15th CNY M2 Money Supply y/y 8.2% 8.0%
12th-15th CNY New Loans 1223B 886B
7:30pm USD Import Prices m/m 0.4% 0.6%
8:30pm GBP CB Leading Index m/m -0.4%
9:00pm USD Prelim UoM Consumer Sentiment 98.1 98.4
9:00pm USD Prelim UoM Inflation Expectations 2.5%
Note: Time is based on Indonesian local time
Source: Forex Factory
Disclaimers
This report is prepared strictly for private circulation only to clients of PT Mirae Asset Sekuritas Indonesia (MASI). It is purposed only to person having
professional experience in matters relating to investments. The information contained in this report has been taken from sources which we deem reliable. No
warranty (express or implied) is made to the accuracy or completeness of the information. All opinions and estimates included in this report constitute our
judgments as of this date, without regards to its fairness, and are subject to change without notice. However, none of MASI and/or its affiliated companies
and/or their respective employees and/or agents makes any representation or warranty (express or implied) or accepts any responsibility or liability as to, or
in relation to, the accuracy or completeness of the information and opinions contained in this report or as to any information contained in this report or any
other such information or opinions remaining unchanged after the issue thereof. We expressly disclaim any responsibility or liability (express or implied) of
MASI, its affiliated companies and their respective employees and agents whatsoever and howsoever arising (including, without limitation for any claims,
proceedings, action, suits, losses, expenses, damages or costs) which may be brought against or suffered by any person as a results of acting in reliance upon
the whole or any part of the contents of this report and neither MASI, its affiliated companies or their respective employees or agents accepts liability for any
errors, omissions or misstatements, negligent or otherwise, in the report and any liability in respect of the report or any inaccuracy therein or omission there
from which might otherwise arise is hereby expresses disclaimed.
This document is not an offer to sell or a solicitation to buy any securities. This firms and its affiliates and their officers and employees may have a position,
make markets, act as principal or engage in transaction in securities or related investments of any company mentioned herein, may perform services for or
solicit business from any company mentioned herein, and may have acted upon or used any of the recommendations herein before they have been provided
to you. © PT Mirae Asset Sekuritas Indonesia 2016.