Embed Size (px)
Citation preview

The
info
rmat
ion
inth
ispr
elim
inar
ypr
ospe
ctus
isno
tcom
plet
ean
dm
aybe
chan
ged.
We
may
nots
ellt
hese
secu
ritie
sun
tilth
ere
gist
ratio
nst
atem
entf
iled
with
the
Secu
ritie
san
dEx
chan
geCo
mm
issi
onis
effe
ctiv
e.Th
ispr
elim
inar
ypr
ospe
ctus
isno
tan
offe
rto
sell
thes
ese
curit
ies
and
we
are
nots
olic
iting
offe
rsto
buy
thes
ese
curit
ies
inan
yju
risdi
ctio
nw
here
the
offe
rors
ale
isno
tper
mitt
ed.
Subject to Completion, dated October 12, 2021
11,500,000 Shares of Common StockThis is an initial public offering of shares of common stock of The Vita Coco Company, Inc. We are offering 2,500,000
shares of our common stock. The selling stockholders identified in this prospectus are offering 9,000,000 shares of ourcommon stock. We will not receive any proceeds from the sale of the shares by the selling stockholders.
Prior to this offering, there has been no public market for our common stock. It is currently estimated that the initial publicoffering price will be between $18.00 and $21.00 per share. We have applied to list our common stock on the Nasdaq GlobalSelect Market under the symbol “COCO.”
Concurrently with, and subject to, the consummation of this offering, an entity affiliated with Keurig Dr Pepper Inc., ourlargest distributor customer, has agreed to purchase, subject to customary closing conditions, $20.0 million of shares ofcommon stock in a private placement, at a price per share equal to the initial public offering price per share at which ourcommon stock is sold to the public in this offering, from Verlinvest Beverages SA, a holder of greater than 5% of our commonstock and one of the selling stockholders in this offering. The sale of such shares will not be registered under the Securities Actof 1933, as amended. The closing of this offering is not conditioned upon the closing of the private placement.
We are an “emerging growth company” as that term is used in the Jumpstart Our Business Startups Act of 2012 and, assuch, may elect to comply with certain reduced public company reporting requirements for this registration statement and infuture reports after the completion of this offering.
We elected in April 2021 to be treated as a public benefit corporation under Delaware law. As a public benefitcorporation, we are required to balance the financial interests of our stockholders with the best interests of thosestakeholders materially affected by our conduct, including particularly those affected by the specific benefit purposesset forth in our certificate of incorporation. Accordingly, our duty to balance a variety of interests may result inactions that do not maximize stockholder value.
Investing in our common stock involves a high degree of risk. See the section titled “Risk Factors” beginningon page 39 to read about factors you should consider before buying shares of our common stock.
Per Share Total
Initial public offering price . . . . . . . . . . . . . . . . . . . . . . . . . . . . . . . . . . . . . . . . . . . . . . . . . . . . . . . . . . . . . . . . $ $Underwriting discounts and commissions(¹) . . . . . . . . . . . . . . . . . . . . . . . . . . . . . . . . . . . . . . . . . . . . . . . . . . $ $Proceeds to us, before expenses . . . . . . . . . . . . . . . . . . . . . . . . . . . . . . . . . . . . . . . . . . . . . . . . . . . . . . . . . . $ $Proceeds to the selling stockholders, before expenses . . . . . . . . . . . . . . . . . . . . . . . . . . . . . . . . . . . . . . . . $ $
¹ See the section titled “Underwriting (Conflict of Interest)” for a description of the compensation payable to the underwriters.At our request, the underwriters have reserved up to 2.0% of the shares of common stock offered by this prospectus for
sale at the initial public offering price through a directed share program to certain individuals identified by the management.Additionally, at our request, up to 5.0% of the shares of common stock offered by this prospectus have been reserved for saleto retail investors through Robinhood Financial, LLC, as a selling group member, via its online brokerage platform. See“Underwriting (Conflict of Interest).”
The selling stockholders have granted to the underwriters the option for a period of up to 30 days to purchase up to anadditional 1,725,000 shares of common stock from them at the initial public offering price, less the underwriting discounts andcommissions.
Neither the Securities and Exchange Commission nor any state securities commission has approved ordisapproved these securities, or determined if this prospectus is truthful or complete. Any representation to thecontrary is a criminal offense.
The underwriters expect to deliver the shares of common stock to purchasers on , 2021.
Goldman Sachs & Co. LLC BofA Securities Credit Suisse Evercore ISI
Wells Fargo Securities Guggenheim Securities Piper Sandler William Blair
Prospectus dated , 2021.
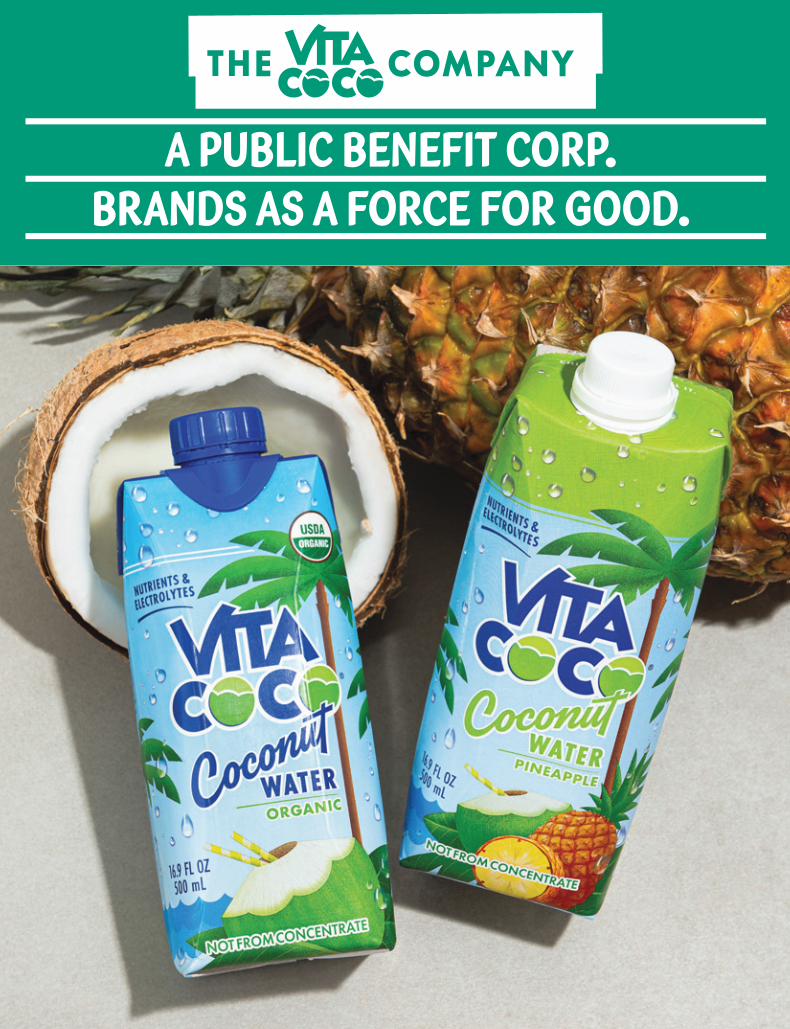


TABLE OF CONTENTS
Page
Market and Industry Data . . . . . . . . . . . . . . . . . . . . . . . . . . . . . . . . . . . . . . . . . . . . . . . . . . . . . . . . . . . iLetter From Michael Kirban, Co-Founder, Co-Chief Executive Officer and Chairman . . . . . . . . . . iiiProspectus Summary . . . . . . . . . . . . . . . . . . . . . . . . . . . . . . . . . . . . . . . . . . . . . . . . . . . . . . . . . . . . . . 1Risk Factors . . . . . . . . . . . . . . . . . . . . . . . . . . . . . . . . . . . . . . . . . . . . . . . . . . . . . . . . . . . . . . . . . . . . . . 39Special Note Regarding Forward-Looking Statements . . . . . . . . . . . . . . . . . . . . . . . . . . . . . . . . . . . 84Use of Proceeds . . . . . . . . . . . . . . . . . . . . . . . . . . . . . . . . . . . . . . . . . . . . . . . . . . . . . . . . . . . . . . . . . . 86Dividend Policy . . . . . . . . . . . . . . . . . . . . . . . . . . . . . . . . . . . . . . . . . . . . . . . . . . . . . . . . . . . . . . . . . . . 87Capitalization . . . . . . . . . . . . . . . . . . . . . . . . . . . . . . . . . . . . . . . . . . . . . . . . . . . . . . . . . . . . . . . . . . . . . 88Dilution . . . . . . . . . . . . . . . . . . . . . . . . . . . . . . . . . . . . . . . . . . . . . . . . . . . . . . . . . . . . . . . . . . . . . . . . . . 90Selected Consolidated Financial and Other Data . . . . . . . . . . . . . . . . . . . . . . . . . . . . . . . . . . . . . . . . 93Management’s Discussion and Analysis of Financial Condition and Results of Operations . . . . . . 95Business . . . . . . . . . . . . . . . . . . . . . . . . . . . . . . . . . . . . . . . . . . . . . . . . . . . . . . . . . . . . . . . . . . . . . . . . 125Management . . . . . . . . . . . . . . . . . . . . . . . . . . . . . . . . . . . . . . . . . . . . . . . . . . . . . . . . . . . . . . . . . . . . . 161Executive Compensation . . . . . . . . . . . . . . . . . . . . . . . . . . . . . . . . . . . . . . . . . . . . . . . . . . . . . . . . . . . 170Certain Relationships and Related Party Transactions . . . . . . . . . . . . . . . . . . . . . . . . . . . . . . . . . . . 188Principal and Selling Stockholders . . . . . . . . . . . . . . . . . . . . . . . . . . . . . . . . . . . . . . . . . . . . . . . . . . . 191Description of Capital Stock . . . . . . . . . . . . . . . . . . . . . . . . . . . . . . . . . . . . . . . . . . . . . . . . . . . . . . . . . 193Description of Certain Indebtedness . . . . . . . . . . . . . . . . . . . . . . . . . . . . . . . . . . . . . . . . . . . . . . . . . . 199Shares Eligible for Future Sale . . . . . . . . . . . . . . . . . . . . . . . . . . . . . . . . . . . . . . . . . . . . . . . . . . . . . . . 201Material U.S. Federal Income Tax Considerations for Non-U.S. Holders of Our Common
Stock . . . . . . . . . . . . . . . . . . . . . . . . . . . . . . . . . . . . . . . . . . . . . . . . . . . . . . . . . . . . . . . . . . . . . . . . . . 204Underwriting (Conflict of Interest) . . . . . . . . . . . . . . . . . . . . . . . . . . . . . . . . . . . . . . . . . . . . . . . . . . . . . 208Legal Matters . . . . . . . . . . . . . . . . . . . . . . . . . . . . . . . . . . . . . . . . . . . . . . . . . . . . . . . . . . . . . . . . . . . . . 218Experts . . . . . . . . . . . . . . . . . . . . . . . . . . . . . . . . . . . . . . . . . . . . . . . . . . . . . . . . . . . . . . . . . . . . . . . . . . 218Where You Can Find Additional Information . . . . . . . . . . . . . . . . . . . . . . . . . . . . . . . . . . . . . . . . . . . . 218Index to Consolidated Financial Statements . . . . . . . . . . . . . . . . . . . . . . . . . . . . . . . . . . . . . . . . . . . F-1
Through and including , 2021 (the 25th day after the date of this prospectus), all dealerseffecting transactions in these securities, whether or not participating in this offering, may be requiredto deliver a prospectus. This is in addition to a dealer’s obligation to deliver a prospectus when actingas an underwriter and with respect to an unsold allotment or subscription.
You should rely only on the information contained in this prospectus or contained in any freewriting prospectus filed with the Securities and Exchange Commission, or the SEC. Neither we, theselling stockholders, nor any of the underwriters have authorized anyone to provide any information ormake any representations other than those contained in this prospectus or in any free writingprospectus we have prepared. Neither we, the selling stockholders, nor the underwriters takeresponsibility for, and can provide assurance as to the reliability of, any other information that othersmay give you. This prospectus is an offer to sell only the shares of common stock offered by thisprospectus, but only under circumstances and in jurisdictions where it is lawful to do so. Theinformation contained in this prospectus is accurate only as of the date of this prospectus, regardlessof the time of delivery of this prospectus or of any sale of the common stock. Our business, results ofoperations, financial condition, and prospects may have changed since such date.

For investors outside of the United States: Neither we nor any of the underwriters have doneanything that would permit this offering or possession or distribution of this prospectus or any freewriting prospectus we may provide to you in connection with this offering in any jurisdiction whereaction for that purpose is required, other than in the United States. Persons outside of the UnitedStates who come into possession of this prospectus and any free writing prospectus must informthemselves about and observe any restrictions relating to this offering and the distribution of thisprospectus outside of the United States.
MARKET AND INDUSTRY DATA
This prospectus contains estimates, projections and other information concerning our industryand our business, including data regarding the estimated size of the market, projected growth ratesand perceptions and preferences of customers, that we have prepared based on industry publications,reports and other independent sources, each of which is either publicly available without charge oravailable on a subscription fee basis. None of such information was prepared specifically for us inconnection with this offering. Some data also is based on our good faith estimates, which are derivedfrom management’s knowledge of the industry and from independent sources. These third partypublications and surveys generally state that the information included therein has been obtained fromsources believed to be reliable, but that the publications and surveys can give no assurance as to theaccuracy or completeness of such information. Market and industry data is subject to variations andcannot be verified due to limits on the availability and reliability of data inputs, the voluntary nature ofthe data gathering process and other limitations and uncertainties inherent in any statistical survey.Although we are responsible for all of the disclosures contained in this prospectus and we believe theindustry and market data included in this prospectus is reliable, we have not independently verified anyof the data from third party sources nor have we ascertained the underlying economic assumptions onwhich such data is based. Similarly, we believe our internal research is reliable, even though suchresearch has not been verified by any independent sources. The industry and market data included inthis prospectus involve a number of assumptions and limitations, and you are cautioned not to giveundue weight to such information.
Unless otherwise expressly stated, we obtained industry, business, market and other data fromthe reports, publications and other materials and sources listed below. In some cases, we do notexpressly refer to the sources from which this data is derived. In that regard, when we refer to one ormore sources of this type of data in any paragraph, you should assume that other data of this typeappearing in the same paragraph is derived from the same sources, unless otherwise expressly statedor the context otherwise requires.
• SPINS MultiOutlet + Convenience Channel (powered by IRI), for the 52 weeks ended May 16,2021, or SPINS;
• Information Resources Inc. Custom Research, MULO + Convenience channels, for the periodsended September 5, 2021, or IRI;
• IRI, Total Chilled Coconut Water Category, Value Sales, 52, Weeks to 19th June 2021, TotalUK, or IRI U.K.;
• Euromonitor International Limited; Coconut and other plant waters category, CombinedOn-Trade & Off-Trade Value Sales for 2020 as per Passport Soft Drinks 2021 edition, orEuromonitor; and
• Numerator, for the 12 months ended July 25, 2021, or Numerator.
i

TRADEMARKS, SERVICE MARKS AND TRADENAMES
We have proprietary rights to trademarks, trade names and service marks appearing in thisprospectus that are important to our business. Solely for convenience, the trademarks, trade namesand service marks may appear in this prospectus without the ® and TM symbols, but any suchreferences are not intended to indicate, in any way, that we forgo or will not assert, to the fullest extentunder applicable law, our rights or the rights of the applicable licensors to these trademarks, tradenames and service marks. All trademarks, trade names and service marks appearing in thisprospectus are the property of their respective owners.
NON-GAAP FINANCIAL MEASURES
This prospectus contains “non-GAAP financial measures” that are financial measures that eitherexclude or include amounts that are not excluded or included in the most directly comparablemeasures calculated and presented in accordance with accounting principles generally accepted in theUnited States, or GAAP. Specifically, we make use of the non-GAAP financial measures “EBITDA” and“Adjusted EBITDA.”
EBITDA and Adjusted EBITDA have been presented in this prospectus as supplementalmeasures of financial performance that are not required by, or presented in accordance with, GAAP,because we believe they assist investors and analysts in comparing our operating performance acrossreporting periods on a consistent basis by excluding items that we do not believe are indicative of ourcore operating performance and because we believe it is useful for investors to see the measures thatmanagement uses to evaluate the Company. Management uses EBITDA and Adjusted EBITDA tosupplement GAAP measures of performance in the evaluation of the effectiveness of our businessstrategies, to make budgeting decisions, to establish discretionary annual incentive compensation andto compare our performance against that of other peer companies using similar measures.Management supplements GAAP results with non-GAAP financial measures to provide a morecomplete understanding of the factors and trends affecting the business than GAAP results alone.
EBITDA and Adjusted EBITDA are not recognized terms under GAAP and should not beconsidered as an alternative to net income as a measure of financial performance or cash flows fromoperations as a measure of liquidity, or any other performance measure derived in accordance withGAAP and should not be construed as an inference that the Company’s future results will beunaffected by unusual or non-recurring items. The presentations of these measures have limitations asanalytical tools and should not be considered in isolation, or as a substitute for analysis of our resultsas reported under GAAP. Because not all companies use identical calculations, the presentations ofthese measures may not be comparable to other similarly titled measures of other companies and candiffer significantly from company to company. For a discussion of the use of these measures and areconciliation of the most directly comparable GAAP measures, see “Management’s Discussion andAnalysis of Financial Condition and Results of Operations—Non-GAAP Financial Measures.”
ii

LETTER FROM MICHAEL KIRBAN, CO-FOUNDER, CO-CHIEF EXECUTIVE OFFICER ANDCHAIRMAN
I have always been non-traditional, leading with my heart, trusting my instincts and always true tomy values. Growing up dyslexic, I had a hard time connecting with books, but an easy time connectingwith people and the outdoors. I came from a family of entrepreneurs who embraced my differences andinspired me to pursue my passions. Starting even as a kindergartener selling tomatoes at mygrandmother’s card games, my entrepreneurial spirit has always propelled me to embrace thecombination of business with the fruits of nature. Experiences like that have helped to form my passionof living every day to the fullest while bringing joy to those around me, and thus starting me down thepath that would ultimately lead to the creation of Vita Coco.
The Adventure of a Lifetime
Vita Coco, like many great adventures, began in a bar. On a cold winter evening in 2003, my bestfriend, Ira, and I met two Brazilian women at a Manhattan bar and this encounter changed our livesforever, particularly for Ira who sold everything he had, married one of the women and moved to Brazil.It was on my first visit to Brazil that Ira introduced me to coconut water straight from a coconut. In themidst of a hot, active day, the drink was incredibly refreshing and hydrating. Surprisingly, packagedcoconut water filled the shelves of Brazilian grocery stores. As I traveled through Brazil, I noticed thatpackaged coconut water was as prevalent as bottled water, and I started opting for coconut waterbecause it made me feel great. Back in the United States, pure coconut water didn’t exist. This weknew was a white space we could fill.
We took the next four months and created our brand Vita Coco, found a local co-manufacturer andstarted selling our product. We found a small distributor in Brooklyn and lower Manhattan, and I rollerbladedfrom store to store sampling and selling Vita Coco. In Latino and Southeast Asian grocery stores, peoplewould literally hug me with joy and tell me that the product reminded them of their childhoods. In naturalfood stores and yoga studios people told me how excited they were to have found a natural alternative toartificial sport drinks. We knew early on we had a winner. Today, our products are sold in 24 countriesaround the world with hundreds of thousands of points of distribution. We are the number one coconutwater brand with a significant relative market share advantage. We quickly became one of the largestindependently owned and fastest growing healthy beverage brands globally.
Our success did not go unnoticed! In 2009, Coca Cola and PepsiCo entered our category throughacquisitions. Some feared that the strength of their distribution networks would lead to our demise. Infact, the opposite happened. We did what we have always done best: we out-hustled, out-innovated,and out-maneuvered the competition. We battled with everything we had. And we won what has beendubbed, “The Coconut Water Wars”! Most importantly, we won because consumers loved our brandand stayed loyal to it.
As the brand grew, we needed more and more coconuts. From Brazil, we expanded our supplychain into Southeast Asia where we partnered with the largest producers of food grade coconutproducts in the Philippines. When we asked if we could purchase their coconut water, they literallylaughed at us because to them, the water was a by-product. After laughing with them out of courtesy,we offered to invest capital and help them procure the right equipment in exchange for a long-term,exclusive supply agreement. They thought we were crazy, but agreed and soon we were up andrunning. We replicated this same model with many of the world’s other large coconut productmanufacturers in Sri Lanka, Indonesia, Malaysia and Thailand. Our supply chain has proven to beincredibly robust, globally diversified, protected, and scalable. We were upcycling even before itbecame culturally relevant.
iii

We have developed a symbiotic relationship with our global suppliers: we have becomeinvaluable to each other, and we take this responsibility very seriously. As our supply chain scaled, wecame across an entirely different and unexpected opportunity: we realized we could positively impactthe communities from which we source our coconuts, and that we could magnify our impact evenmore. Our coconuts are mostly grown and harvested by thousands of small family farmers. Many ofour farming partners and the people in their communities live in poverty. For generations, they’vesupported themselves by selling coconuts and fishing for food. While visiting these farmingcommunities in Southeast Asia, we saw things that were completely foreign to us, such as youngchildren attending school while huddled in the mud under a tarp to protect them from the rain. We alsoheard stories of farmers cutting down their coconut palms for lumber because the trees were producingonly 1/3 of the coconuts that the same trees had produced for their parents and grandparents. Wequickly understood that if we were going to be successful in the long-term, these farming communitiesneeded to grow with us. Helping them was the right thing to do, not only for the business but forhumanity. That’s when we created the Vita Coco Project based on a simple philosophy of “Give, Growand Guide,” with the goal to build thriving communities and impact the lives of over one million people.
Over the past seven years, we’ve built nearly 30 schools, offered dozens of college scholarshipsand have trained hundreds of local farmers at our model farms to be more productive and efficient. Byteaching simple farming practices like intercropping, planting new seedlings and better harvestingtechniques, we have helped these families increase their yield, income and livelihoods. This has beenone of the most rewarding parts of the journey for me. This has led us to evolve our corporate structureto a Public Benefit Corporation. The specific benefit and purpose of The Vita Coco Company isharnessing, while protecting, nature’s resources for the betterment of the world and its inhabitants, bycreating ethical, sustainable, better-for-you beverages and consumer products that not only uplift ourcommunities, but that do right by our planet.
We are committed to using our business as a force for good. During the pandemic, we saw oursales surge by over 100%, which prompted us to donate $1 million of our profits to No Kid Hungry andFeeding America and we challenged our much larger competitors on Twitter to do the same. Many ofthem did! We’re looking forward to continuing our efforts to deliver better products that are indeed,better for the world.
The Next Chapter of Our Journey
Now we are planning our next adventure, and we believe the best place for us to advance on thisjourney is in the public markets. We believe that being public will give us the currency to furtheraccelerate our growth and offer us a platform to have a greater impact. Most healthy hydrationcompanies are small, private and just don’t have the scale to achieve their true potential. We, on theother hand, have spent seventeen years building one of the largest independently owned healthyhydration companies, and I believe it has all led up to this moment; the beginning of something muchlarger and much more impactful.
Today’s global beverage market is controlled mainly by behemoths who generate most of theirprofits from products that are not necessarily healthy for people or the planet. 21st century consumersseek products and brands that are not only good for their bodies but better for society. Our values ofaligning profit with purpose really resonates with our consumers. We are humbled by their trust andloyalty, and they motivate us to do better every day.
The white space we see ahead remains enormous. Significant growth opportunities exist for ourcore brand, Vita Coco, through greater household penetration, distribution gains and innovation. We
iv

also plan to create new healthy, functional beverages and to acquire brands that fit with our values.Our goal is to be the fastest growing and most impactful healthy hydration company in the world. Andwhen we win, so will our partners—whether consumers, retailers, employees, growers or investors.
A teacher once told me “If you can’t read, you’ll never be able to get a job!”. And to this day, I’venever held a job or even been on a job interview. Instead, I have been able to spend every day with mybest friends (otherwise known as my co-workers), create amazing products that people love and havethe privilege to positively impact millions of people’s lives. If only my teachers could see me now!
I hope you will join us on this journey and help us continue to grow and redefine the meaning ofgood for you—for your body, for your communities, for your planet.
Thank you,
Mike
v
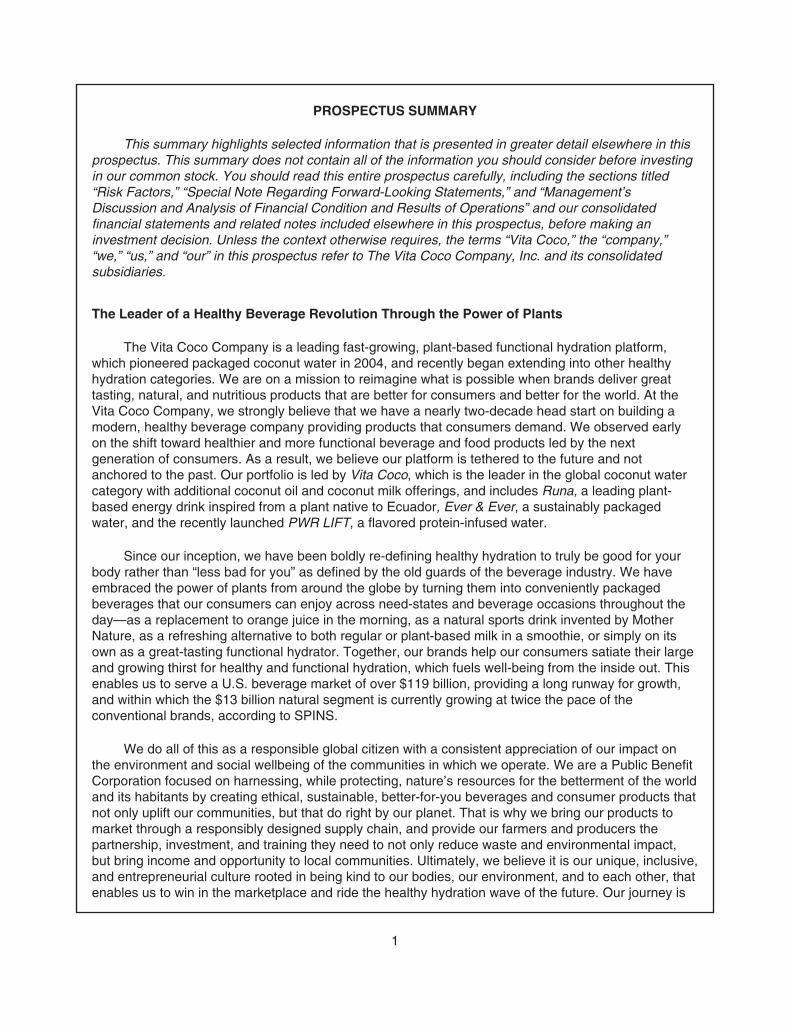
PROSPECTUS SUMMARY
This summary highlights selected information that is presented in greater detail elsewhere in thisprospectus. This summary does not contain all of the information you should consider before investingin our common stock. You should read this entire prospectus carefully, including the sections titled“Risk Factors,” “Special Note Regarding Forward-Looking Statements,” and “Management’sDiscussion and Analysis of Financial Condition and Results of Operations” and our consolidatedfinancial statements and related notes included elsewhere in this prospectus, before making aninvestment decision. Unless the context otherwise requires, the terms “Vita Coco,” the “company,”“we,” “us,” and “our” in this prospectus refer to The Vita Coco Company, Inc. and its consolidatedsubsidiaries.
The Leader of a Healthy Beverage Revolution Through the Power of Plants
The Vita Coco Company is a leading fast-growing, plant-based functional hydration platform,which pioneered packaged coconut water in 2004, and recently began extending into other healthyhydration categories. We are on a mission to reimagine what is possible when brands deliver greattasting, natural, and nutritious products that are better for consumers and better for the world. At theVita Coco Company, we strongly believe that we have a nearly two-decade head start on building amodern, healthy beverage company providing products that consumers demand. We observed earlyon the shift toward healthier and more functional beverage and food products led by the nextgeneration of consumers. As a result, we believe our platform is tethered to the future and notanchored to the past. Our portfolio is led by Vita Coco, which is the leader in the global coconut watercategory with additional coconut oil and coconut milk offerings, and includes Runa, a leading plant-based energy drink inspired from a plant native to Ecuador, Ever & Ever, a sustainably packagedwater, and the recently launched PWR LIFT, a flavored protein-infused water.
Since our inception, we have been boldly re-defining healthy hydration to truly be good for yourbody rather than “less bad for you” as defined by the old guards of the beverage industry. We haveembraced the power of plants from around the globe by turning them into conveniently packagedbeverages that our consumers can enjoy across need-states and beverage occasions throughout theday—as a replacement to orange juice in the morning, as a natural sports drink invented by MotherNature, as a refreshing alternative to both regular or plant-based milk in a smoothie, or simply on itsown as a great-tasting functional hydrator. Together, our brands help our consumers satiate their largeand growing thirst for healthy and functional hydration, which fuels well-being from the inside out. Thisenables us to serve a U.S. beverage market of over $119 billion, providing a long runway for growth,and within which the $13 billion natural segment is currently growing at twice the pace of theconventional brands, according to SPINS.
We do all of this as a responsible global citizen with a consistent appreciation of our impact onthe environment and social wellbeing of the communities in which we operate. We are a Public BenefitCorporation focused on harnessing, while protecting, nature’s resources for the betterment of the worldand its habitants by creating ethical, sustainable, better-for-you beverages and consumer products thatnot only uplift our communities, but that do right by our planet. That is why we bring our products tomarket through a responsibly designed supply chain, and provide our farmers and producers thepartnership, investment, and training they need to not only reduce waste and environmental impact,but bring income and opportunity to local communities. Ultimately, we believe it is our unique, inclusive,and entrepreneurial culture rooted in being kind to our bodies, our environment, and to each other, thatenables us to win in the marketplace and ride the healthy hydration wave of the future. Our journey is
1

still young, and we believe that we are well-positioned to continue to deliver exceptional growth andprofitability as we continue to grow our consumer reach in existing and new markets around the globe.We are laser focused on owning as many healthy hydration occasions as possible.
We have undertaken numerous initiatives to turn our ideals into action. In 2014, we created theVita Coco Project to support and empower our coconut farming communities through innovativefarming practices, improving education resources, and scaling our business to promote economicprosperity—through all of which we hope to positively impact the lives of over one million people.Additionally, we seek to partner with other third party organizations that share and advance our idealsincluding fair trade, accessible nutrition and wellness, and environmental responsibility.
Vita Coco: The Global Leader in Coconut Water
We pioneered the North American and European packaged coconut water market and madecoconut water a mainstream beverage loved by consumers who were seeking healthier alternatives.Today we are the largest brand globally in the coconut and other plant waters category, according toEuromonitor. Our visionary co-founder, co-CEO and Chairman, Mike Kirban, discovered coconut wateron an adventure in Brazil with his best friend. In many tropical countries, coconut water is viewed as agift from Mother Nature and has been consumed for centuries as a substitute for water given itshydrating and functional properties from electrolytes. Since the beginning, our goal has been to bringhigh quality yet affordably priced and sustainably sourced coconut water to the masses.
When Vita Coco launched in New York City in 2004, we established the coconut water category as apremium lifestyle drink, and we have been on the forefront of natural and functional beverages ever since.We believe the ongoing adoption of Vita Coco is largely attributable to its taste qualities and nutrients, andthe fact that it is an alternative to sugar-packed sports drinks and other less healthy hydration alternatives.Vita Coco has evolved from a single pure coconut water SKU, to a full portfolio of coconut water flavors andenhanced coconut waters, as well as other plant based offerings such as coconut oil and coconut milk, all ofwhich have been commercially successful and loved by consumers, such as Vita Coco Boosted, Vita CocoSuper Sparkling and Vita Coco Farmers Organic. With market share leadership, the Vita Coco brand issynonymous with coconut water and healthy hydration. Vita Coco is truly the brand that helps you “drink alittle better, eat a little better, and live a little better.” We have leveraged the strength of our category leadingVita Coco brand and our innovation capabilities to broaden our portfolio.
Vita Coco is the coconut water category leader with 46% market share in the United States, a36% relative market share advantage over the next leading competitor, according to IRI CustomResearch. Vita Coco is driving growth in the overall category as well as growing its share. The brandcompetes in the $2 billion global coconut and plant waters category, according to Euromonitor, and isonly being sold in 24 countries, with low household penetration in most of them. We believe that VitaCoco has had the biggest influence in making coconut water a mainstream beverage choice in theUnited States, and driving the category to its 15% year-over-year growth, which is in line withenhanced waters and outpacing sparkling waters, with 15% and 4% year-over-year growth,respectively, for the 26 weeks ended, September 5, 2021, according to IRI Custom Research. Thecategory and the brand are sought after by consumers of all ages, but according to Numerator, doesskew to younger and more multicultural shoppers, supporting the exciting growth prospects we have.
Internationally, our business is anchored by Vita Coco’s footprint in the United Kingdom, where itis the coconut water category leader with over 70% market share, according to IRI U.K. Our U.K.footprint and operational base in Asia, has allowed us to start selling into other European and Asiancountries, where our brand while still nascent, has been well received. In collaboration with our key
2

retail partners in the United Kingdom, we have innovated beyond our current portfolio by extending thebrand into natural personal care products and CBD-infused beverages that have been well received byour loyal consumer base. We have established solid foundations in key markets such as China,France, Spain, the Nordic Region and the Middle East from which to build our brand.
Available Where Our Consumer Wants Us to Be
As we build and expand our business, we strive to democratize health and wellness by makingour high-quality products accessible to mainstream consumers through broad distribution and pricepoints. Our products are distributed through club, food, drug, mass, convenience, e-commerce, andfoodservice channels across North America, Europe, and Asia. In the United States, we are availablefrom up and down the street in bodegas where we got our start to natural food and big box stores allover the country. We can also be found in a variety of on-premise locations such as yoga studios,corporate offices and even music festivals and other large events.
We go to market in North America through a versatile and tailored approach that varies depending ona given product’s lifecycle stage, and the needs of our retail partners as brands evolve and mature. Thispractice will continue as we expand our platform through innovation and acquisitions, and we utilize ourinsights and experience across various distribution channels, including direct-store-delivery, or DSD,direct-to-retailer warehousing, or DTW, and broadline distribution partners (e.g., UNFI, KeHE). We are inthe advantageous situation where without owning any of the assets needed for distribution, we can matchthe right retailer needs with the right route to market. For example, where club and e-commerce retailersprefer to receive full truckloads of our products directly delivered to the limited number of warehouses theydeploy, in most instances the convenience retailers, with over 100,000 doors in the channel, prefer to havesmaller deliveries directly to their stores through our distributor network that provides national coverage.
In addition to the strength of our brand, we believe our strong relationships across retailers isfurther aided by our highly-engaged sales and marketing teams who continually raise the bar for retailexecution in the industry. Their proven track record of creating consumer excitement at the point ofpurchase has helped ensure that our products continue to fly off the shelves, while getting continuouslyrestocked. We believe our marketing team has written the playbook on authentic grassroots brandbuilding and influencer marketing, which draws highly coveted consumers into our retail partners insearch of our products. Our in-the-field marketing efforts couple well with our superstar investors totout the quality of our products and authenticity of the brand to further support ongoing purchasing.
Vita Coco – Year-Over-Year Retail Sales Growth
13%
24%
33%29%
Last 104 Weeks Last 52 Weeks Last 26 Weeks Last 13 Weeks
Source: Retail sales growth for the Coconut Water category per IRI Custom Research (MULO + Convenience) for the104 weeks, 52 weeks, 26 weeks and 13 weeks, respectively, ended September 5, 2021.
3

2020 AMERICAS SALES BY CHANNEL 2020 AMERICAS SALES BY ROUTE TOMARKET
Food, Drug,Mass36%
Club35%
Other29% DSD
47%DTW47%
Broadline6%
Source: Management estimates based on Americas branded gross sales and IRI Custom Research.Notes: “Other” includes e-commerce, convenience and food service.
Unique Global Supply Chain Anchored in Upcycling and Supporting Growth Prospects
We have set up an asset-lite business model. We believe we have unique expertise sourcing andoverseeing the packaging of coconut water from the tropical belt, and delivering our high quality,branded packaged coconut water to consumers worldwide. Through our direct access to coconutfarmers globally and our relationships with processors in many countries, including the Philippines,Indonesia, and Brazil, we have built up a unique body of knowledge and relationships which we believecreates a competitive advantage unrivaled in the industry. We believe this is an important differentiatorfor our business and difficult to replicate.
As the pioneer of branded coconut water in the United States, we sourced our first coconut waterin the early 2000s in Brazil, and helped local producers set up the infrastructure needed to supply andgrow a high quality coconut water business. Over time, we took this capability to other parts of theworld and also started giving back to the local communities in which we operate.
We have carefully cultivated a coconut water supply chain of scale, which enables coconutprocessing facilities to monetize their coconut water. Prior to our involvement, many facilities had solelyfocused on desiccated coconut, coconut cream, and other coconut products, and were discarding thecoconut water as an un-needed byproduct of their coconut processing. Thus, we saw an opportunityfor upcycling the coconut water.
Unlike other packaged beverages that can be produced or co-packed anywhere, coconut waterneeds to be transferred from the coconut into an aseptic package within hours of the coconut being cutfrom the tree. This means that we had to set up our production process as close to the coconut farmsas possible to keep quality at the highest level. This was often in remote, less developed tropical areaswith unsophisticated infrastructure and antiquated farming practices. In the areas we source from, wehave established model farms to emulate, and we work closely with our manufacturing partners toassist the local farmers with best practices on how to grow and process coconuts in a sustainable andefficient manner. We believe the work we are doing with our manufacturing partners has set the goldstandard for coconut water processing.
4
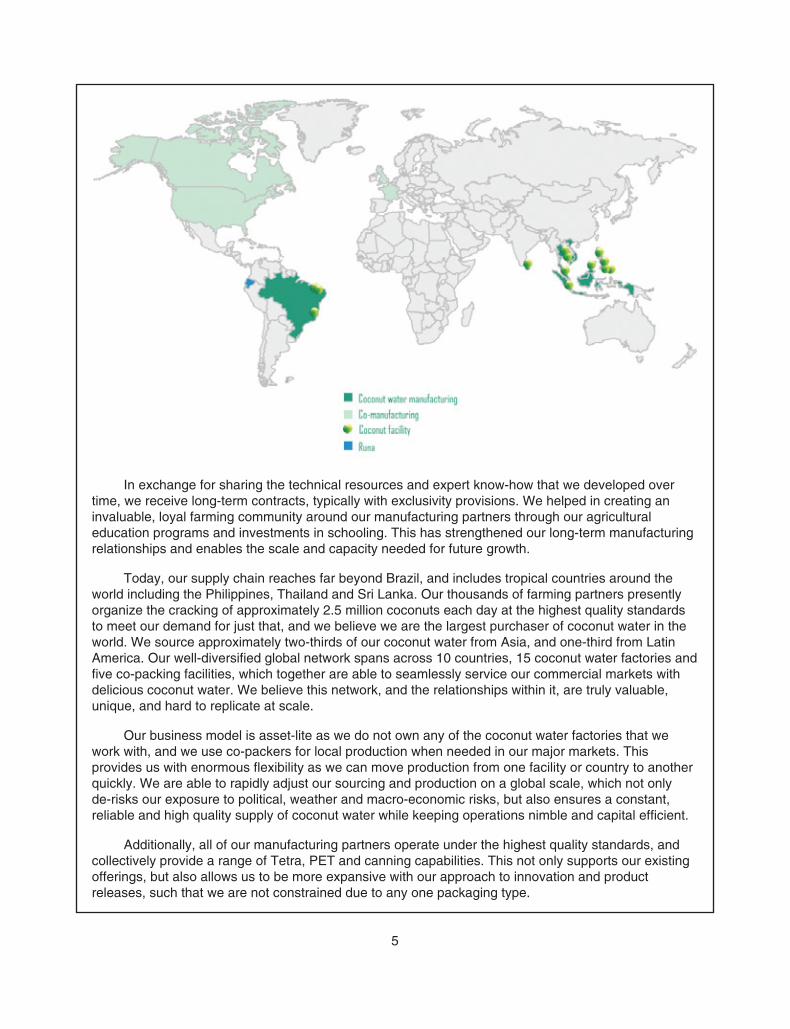
In exchange for sharing the technical resources and expert know-how that we developed overtime, we receive long-term contracts, typically with exclusivity provisions. We helped in creating aninvaluable, loyal farming community around our manufacturing partners through our agriculturaleducation programs and investments in schooling. This has strengthened our long-term manufacturingrelationships and enables the scale and capacity needed for future growth.
Today, our supply chain reaches far beyond Brazil, and includes tropical countries around theworld including the Philippines, Thailand and Sri Lanka. Our thousands of farming partners presentlyorganize the cracking of approximately 2.5 million coconuts each day at the highest quality standardsto meet our demand for just that, and we believe we are the largest purchaser of coconut water in theworld. We source approximately two-thirds of our coconut water from Asia, and one-third from LatinAmerica. Our well-diversified global network spans across 10 countries, 15 coconut water factories andfive co-packing facilities, which together are able to seamlessly service our commercial markets withdelicious coconut water. We believe this network, and the relationships within it, are truly valuable,unique, and hard to replicate at scale.
Our business model is asset-lite as we do not own any of the coconut water factories that wework with, and we use co-packers for local production when needed in our major markets. Thisprovides us with enormous flexibility as we can move production from one facility or country to anotherquickly. We are able to rapidly adjust our sourcing and production on a global scale, which not onlyde-risks our exposure to political, weather and macro-economic risks, but also ensures a constant,reliable and high quality supply of coconut water while keeping operations nimble and capital efficient.
Additionally, all of our manufacturing partners operate under the highest quality standards, andcollectively provide a range of Tetra, PET and canning capabilities. This not only supports our existingofferings, but also allows us to be more expansive with our approach to innovation and productreleases, such that we are not constrained due to any one packaging type.
5

Our supply chain scale, diversification, and flexibility also create leverage with manufacturers,warehouses, and logistics providers to reduce waste and operating and transportation costs, and helpus reduce our total costs while maintaining reliable supply. This scale also supports our position as oneof the largest and highest quality coconut water producers in the world and should allow us to continueto manage our supply and growth prospects for many years to come.
Leveraging Our Success and Scale into a Multi-Brand Platform
Over the past nearly two decades, we have built the scale to service our retailers and consumersaround the globe. While we have grown into a larger organization with a strong back office team, ourentrepreneurial spirit stays central to everything we do. Our sales team seeks to set the bar for retailexecution in the industry, and has a proven track record of creating consumer excitement at the pointof purchase. They are complemented by our marketing team who effectively employs authenticgrassroots brand building and influencer marketing campaigns to aid brand awareness. We haveleveraged our scale and entrepreneurial spirit to expand into other categories both organically andthrough acquisitions. We are constantly looking to expand our demographic reach and the beverageoccasions that our products serve. We remain very focused on growing our share of the beveragemarket that sits at the intersection of functional and natural through a wide variety of clean,responsible, good for you products.
We expanded into private label coconut water in 2016 as a way to develop stronger ties withselect, strategic retail partners and improve our operating scale. This strategic move has enabled us togrow our branded share in the category as well as improve our gross margins across the total portfolio.We leverage private label as a way to manage the overall coconut water category at retail, enabling usto be better stewards of the category and influence the look and feel at retail shelves and more of theoverall consumer experience with coconut water. Our private label offering strategically increases thescale and efficiency of our coconut water supply chain, and also proactively provides us with improvedrevenue management. Through this offering, we are able to better manage our products and capturethe value segment without diluting our own brand, while concurrently supporting more family farms inthe regions that we operate in. While our private label business has aided our growth historically, weexpect our brands to be the primary drivers of top-line growth going forward.
After building the scale and infrastructure to support our beloved Vita Coco brand, we realizedthat we were well positioned to support our platform with other innovations and brands that couldleverage our strong capabilities in sales, marketing, and distribution. Not only have we added VitaCoco Coconut Milk as a shelf stable dairy alternative in the club channel, and introduced in summer2021 the Vita Coco Hydration Drink Mix, a powdered form of flavored coconut water to test in limitedonline markets, but we have also added other complementary brands.
Since 2018, we have expanded our portfolio with three brands that align with our values andallow us to expand our reach and consumer base, and increase the number of occasions where wecan play a role in our consumers’ lives: Runa, Ever & Ever, and PWR LIFT.
Runa: As part of our ongoing evaluation of the broader beverage industry, we saw an opportunityto leverage our success and learning in building Vita Coco and apply it to a clean, plant-basedenergy drink, with an aim to disrupt the very large and fast growing energy drinks category with aplant-based and fully natural alternative for consumers. This led us to acquire Runa in 2018 given itsdistinct plant-based and natural energy positioning, and our proven ability to source products fromemerging markets. Runa’s clean energy drinks provide consumers a refreshing energy boost
6

without the jolts and jitters, and with less sugar than traditional energy beverages. Runa’s cleantaste and smooth energy lift comes from Guayusa, an Amazonian jungle super-leaf containingtheobromine and L-theanine, which has been shown to boost energy levels, alertness, and improveconsumers’ moods and concentration.
Ever & Ever: Launched in 2019, Ever & Ever is a purified water brand packaged solely inaluminum bottles with a pH balance of 7.4. We saw an opportunity to quickly create a brand thatresponded to the need for a sustainably packaged water product given the reusable nature of thebottles and its infinite recyclability, and transformed our concept into reality in under three months.Ever & Ever was launched with a focus on the foodservice and office channels, as top Fortune 500companies and large corporations continue to make a conscious effort to participate in thesustainability movement with a focus on reducing plastic waste.
PWR LIFT: In 2021, we released a functional beverage targeted at the post-workout and recoveryusage occasions in PWR LIFT. We believe the fitness market had been lacking drinks that not onlydeliver thirst-quenching refreshment but also nutritional benefits. These protein-infused flavoredwaters can do just that – they provide another option for our more fitness-minded consumers tohave a great tasting and hydrating beverage while also ensuring they consume their proteinfollowing increased levels of exertion. PWR LIFT is currently exclusively available through Amazon.
Track Record of Industry Leading Financial Performance
We exercise strong financial discipline when managing our business and executing on our growthstrategies, and our financial performance reflects that. While many companies at our stage and withour growth profile adopt a “growth-at-all-cost” mindset, we have always been focused on profitable,responsible, and sustainable growth. Still, we believe we have multiple opportunities to sustain themomentum of our branded coconut water business, and over time continue to expand our margins.We believe this strategy is the most prudent and value-maximizing for all of our stakeholders, includinginvestors, consumers, customers, employees, and global citizens, over the long-term horizon.
Our recent historical financial performance reflects the tremendous strides we have made toscale and grow our business:
• For the trailing twelve months ended June 30, 2021, we reported net sales of $334 million,representing a 17% increase from the twelve months ended June 30, 2020.
• For the year ended December 31, 2020, we reported net sales of $311 million, representing a9% increase from $284 million for the year ended December 31, 2019. For the six monthsended June 30, 2021, we reported net sales of $177 million, representing a 15% increase from$154 million for the six months ended June 30, 2020 primarily driven by a 29% increase in netsales of Vita Coco Coconut Water during the same period.
• For the year ended December 31, 2020, we generated gross profit of $105 million, representinga margin of 34% and a 13% increase from $93 million for the year ended December 31, 2019.For the six months ended June 30, 2021, we generated gross profit of $53 million, representinga margin of 30% and remaining relatively flat in absolute dollar terms compared to $53 millionfor the six months ended June 30, 2020.
• For the year ended December 31, 2020, our net income was $33 million, representing a marginof 11% and a 247% increase from our net income of $9 million and a margin of 3% for the yearended December 31, 2019. For the six months ended June 30, 2021, our net income was$9 million, representing a margin of 5% and a 43% increase from our net income of $7 millionand margin of 4% for the six months ended June 30, 2020.
7

• For the year ended December 31, 2020, our adjusted EBITDA was $35 million, representing amargin of 11% and an increase of 75% from our adjusted EBITDA of $20 million for the yearended December 31, 2019. This improved margin was a result of our gross profit marginexpansion and right-sized marketing investments. For the six months ended June 30, 2021, ouradjusted EBITDA was $16 million, representing a margin of 9% and a decrease of 16% fromour adjusted EBITDA of $19 million for the six months ended June 30, 2020, due in part to thechallenging supply chain environment we experienced during the six months ended June 30,2021.
• We have traditionally experienced minimal capital expenditures given our asset-lite model. Webelieve that our operating cash flow and access to credit facilities provide us with sufficientcapability to support our growth plans.
• As of December 31, 2020 and June 30, 2021, we had $25 million and $38 million, respectively,of outstanding indebtedness.
The Vita Coco Company Select Financial Performance
2019 2020 LTM 2019 2020 LTM
$9
$33
$23 $20
$35$32
2019 2020 LTM
$284
$311
$334
NET SALES NET INCOME ADJUSTED EBITDA
Note: LTM refers to the twelve-month period ending June 30, 2021.
Our Competitive Strengths
A Pure-Play Healthy Hydration Platform Disrupting a Massive Category
Ever since his first encounter with a coconut straight from a tree on a sunny beach in Brazil, ourco-founder, co-CEO and Chairman, Mike Kirban, has been on a mission to bring the benefits of thecoconut to the western world. Vita Coco has evolved from one pure coconut water SKU, to an award-winning portfolio of coconut water flavors, enhanced coconut water, coconut oil, and coconut milk, allthe while retaining its #1 market share of 46%, which is bigger than the next ten brands combined,according to IRI Custom Research. In fact, all of our brands are rooted in clean, natural ingredients thatdeliver tangible and functional benefits to our consumers and address different need-states across alldayparts. Whether it is the electrolytes, nutrients, and vitamins in Vita Coco, Runa’s organic, plant-based and natural caffeine with a lower calorie count and sugar content than traditional energy drinks,PWR LIFT’s flavorful and protein infused water, or Ever & Ever’s aluminum packaging that is infinitelyrecyclable, our brands embody what we stand for as a company and resonate across consumers. Webelieve our platform has served as a leader in disrupting and transforming the healthy and functionalbeverage landscape.
8

Today, Vita Coco is a top ten refreshment brand (non-alcoholic beverages, excluding milk) withinthe broader $13 billion U.S. natural beverage category, according to SPINS. Vita Coco continues to bethe main driver of the coconut water category’s growth while simultaneously increasing our share andoutpacing all other branded coconut water competitors. In the last year, the coconut water categoryhas consistently outperformed the rest of the water category in the MULO+C channels according to IRICustom Research.
Coconut Water versus Total Water Year-Over-Year 26-Weekly Retail Sales Growth
4.1%
6.7%7.8% 8.0%
8.7% 9.0%8.1%
12.9%
15.3%16.1%
15.5%14.7%
15.4%
2.6%
5.7%
7.7% 7.4% 7.8% 7.7%
3.2%
6.6%
8.2%9.1%
9.6% 9.4%
11.0%
10/4/20 11/1/20 11/29/20 12/27/20 1/24/21 2/21/21 3/21/21 4/18/21 5/16/21 6/13/21 7/11/21 8/8/21 9/5/21
Coconut Water Total Water (excluding Coconut Water)
Rolling 26Weeks
Ending:
Source: Retail sales per IRI Custom Research (MULO + Convenience).
Authentic Brands Appealing to A Loyal and Attractive Base of Consumers Who Are Coveted byRetailers
Our consistent quality and accessibility has helped establish the Vita Coco brand as synonymouswith the coconut water category. According to Numerator, 50% of consumers report Vita Coco as theonly brand they consider within the category. As the most trusted brand in the category, according toBrandSpark, Vita Coco tends to be a planned purchase by 69% of brand shoppers, while also drivingincremental consumers into the coconut water category. Additionally, of the last twelve months’ growth,66% of our growth was attributable to new coconut water category consumers according to Numerator.
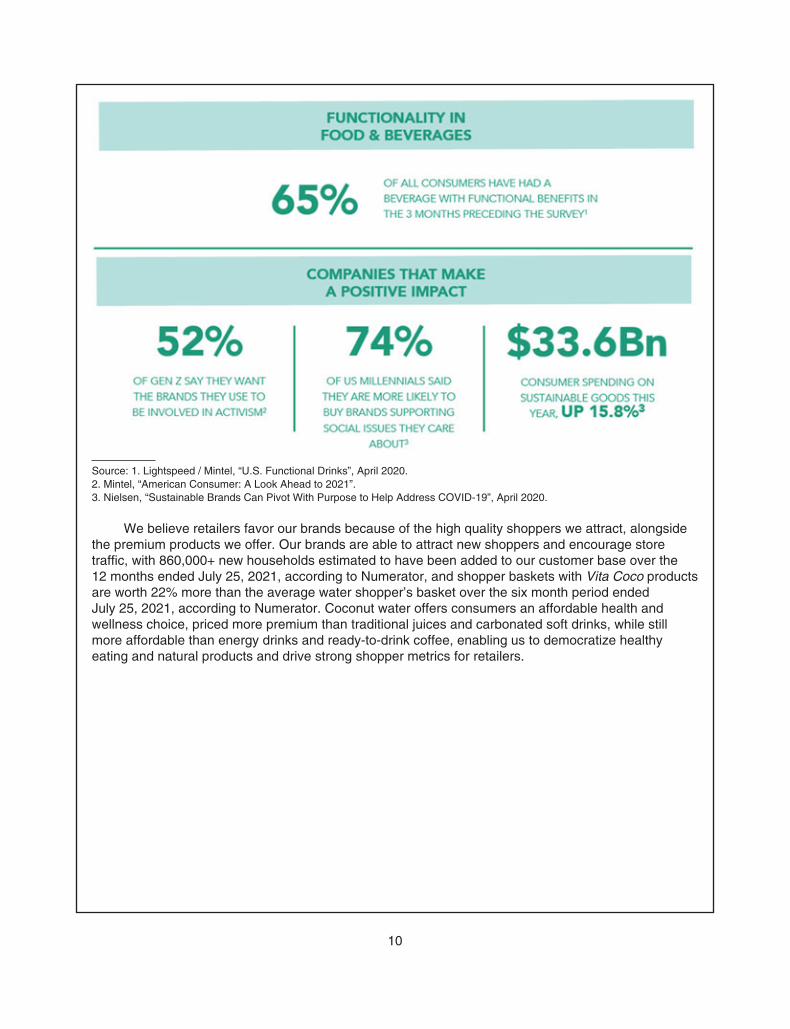
Our brand resonates with the fastest growing demographic groups in the United States. We over-index to multi-cultural and younger consumers, and families, which we believe allows us to capture abroader array of the population, and creates early adoption allowing for long-term brand loyalists. Accordingto Numerator, 55% of our consumers are non-white, with a large portion identifying as Asian or Hispanic,and 43% of our shoppers are Generation Z or Millennials, with 41% of our consumers having children athome. These are valuable shoppers who are more likely to seek natural and organic foods, prioritizehealthy eating, stay up to date on health trends, care about the environment, and engage in an activelifestyle – all of which align with The Vita Coco Company’s core purpose. According to Mintel research, over50% of Generation Z want the brands they use to be involved in activism and nearly three out of fourmillennials are more likely to buy brands supporting social issues that they care about. We always strive tosatisfy the functional hydration needs of the emerging generations that are leaving their mark on popularculture.
9
Source: 1. Lightspeed / Mintel, “U.S. Functional Drinks”, April 2020.2. Mintel, “American Consumer: A Look Ahead to 2021”.3. Nielsen, “Sustainable Brands Can Pivot With Purpose to Help Address COVID-19”, April 2020.
We believe retailers favor our brands because of the high quality shoppers we attract, alongsidethe premium products we offer. Our brands are able to attract new shoppers and encourage storetraffic, with 860,000+ new households estimated to have been added to our customer base over the12 months ended July 25, 2021, according to Numerator, and shopper baskets with Vita Coco productsare worth 22% more than the average water shopper’s basket over the six month period endedJuly 25, 2021, according to Numerator. Coconut water offers consumers an affordable health andwellness choice, priced more premium than traditional juices and carbonated soft drinks, while stillmore affordable than energy drinks and ready-to-drink coffee, enabling us to democratize healthyeating and natural products and drive strong shopper metrics for retailers.
10

Select Beverage Categories $/oz
$ 0.03 $ 0.04 $ 0.04 $ 0.04 $ 0.05 $ 0.05 $ 0.05 $ 0.05 $ 0.06 $ 0.06
$ 0.11 $ 0.13
$ 0.15
$ 0.19 $ 0.20
Milk
Carb
onat
edSo
ft Dr
inks
Enha
nced
Wat
er
RTD
Tea
Spar
klin
g W
ater
Juic
es
Spor
ts D
rinks
Dairy
Alte
rnat
ives
Refri
gera
ted
Juic
e &
Othe
r Fun
ct B
ev
Oran
ge J
uice
Coco
nut W
ater
Ener
gy D
rinks
RTD
Coffe
e
Kom
buch
a
Source: Retail and equivalent volume sales per SPINS for the 52 weeks ended May 16, 2021 (MULO + Convenience).
Vita Coco Shopper Characteristics
VITA COCO SHOPPERS ARE VALUABLESHOPPERS…
… AND ON ITEMS THROUGHOUT THESTORE!…WHO SPEND A LOT PER TRIP…
$7.01Per Trip
+12%vs. year ago
+37%higher than the Total Water
shopper’sspend per trip
$81.82Average Basket Spend
+11%vs. year ago
+22%higher than the Total Water
shopper’s average basket spend
43% of Vita Coco Shoppers areGen Z + Millennial
41% of Vita Coco Shoppers haveChildren at Home
55% of Vita Coco Shoppersare Non-White
Gen Z: 123 indexMillennials: 142 index
Asian: 227 indexHispanic/La�no: 170 index
Black/AA: 132 index
Age 0-5: 140 indexAge 6-12: 116 index
Age 13-17: 109 index
Source: Numerator for the twelve months ended July 25, 2021.Note: Index represents the relative concentration of Vita Coco shoppers as compared to average of the total U.S. population(represented by an index of 100).
Agile Innovator with a Proven Track Record
Since day one, we have been category innovators, as proven by our decision to initially launchVita Coco and pioneer packaged coconut water in the United States. As first-movers and leaders in amajor beverage category, we understand the key components to ensuring the lasting success of aproduct or brand. When we first started Vita Coco, the coconut water category barely existed in theUnited States and was mostly sold in ethnic grocery stores. We estimate that the coconut water
11

category in the United States was under $10 million when we launched Vita Coco in 2004. Today, thiscategory has grown to $658 million in the United States alone, based on Euromonitor data, whichtracks both on-premise and off-premise sales.
We are consistently innovating our existing portfolio range to drive wider adoption of our brands,increase consumption occasions, and take market share across the natural beverage category. Ourcompany culture empowers our entire team such that our field salespeople and marketers are able tointeract with our consumers and incorporate real-time consumer and retailer feedback to identify gapsin our portfolio and find new innovations. For example, inspired by coconut water consumers whosometimes mixed coconut water with other flavored beverages, we created one of the first premiumflavored coconut waters in the United States. We develop and release new products where we believewe can differentiate ourselves in a way that is consistent with long-term consumer trends and canleverage our supply chain and distribution capabilities.
More recently, we launched Vita Coco Pressed, a drink that packs more coconutty flavor intoevery sip. Today, Pressed alone makes up over 8% of the coconut water category, which would makeit the third largest standalone brand, and the second fastest growing coconut water brand in thecategory relative to competing brands, according to IRI Custom Research. Only 9% of householdspurchasing Vita Coco products reported purchasing both Vita Coco Pure and Vita Coco Pressed,according to Numerator, demonstrating that growth from Pressed has been incremental to ourbusiness. We also recently successfully launched a shelf stable coconut milk under the Vita Cocobrand to enter the large and growing plant-based dairy alternatives segment, while also increasing VitaCoco’s ability to participate in additional use occasions such as coffee and cereal.
Additionally, we are constantly evaluating our product formats to ensure we are deliveringconsumers what they want in the best possible format. We have released new package types, multi-packs, and larger formats, all of which have supported category growth, and aided in increasingshoppers’ basket sizes by 12%, according to Numerator, and, in 2022, we plan to introduce Vita Cocococonut juice in cans in the United States, where canned coconut water represents approximately 30%of the coconut water category by volume.
12

EVOLUTION OF THE VITA COCO COMPANY PLATFORM
THE FIRST MAINSTREAM
PREMIUM COCONUT
WATER BRAND
USING THE WHOLECOCONUT TO PROVIDE
CONSUMERS MORECOCONUT GOODNESS
IN THEIR LIVES
VIRGIN COCONUT OIL,REFRESHING SPARKLING
COCONUT WATER ORBOOSTED WITH MCT
AND NATURALCAFFEINE, DRINK MIX
POWDERS
THE ORIGINAL
NEW FLAVORS
PACK SIZE ANDCONFIGURATIONS
DAIRY ALTS –COCONUT MILK
ENTERING INTO NEW OCCASIONS
WE CREATED ONEOF THE FIRST
PREMIUM-FLAVORED
COCONUT WATERSIN THE UNITED
STATES
LAUNCH OF MULTI-SERVE &
MULTIPACKS TOUNLOCK NEWCHANNELS &
SHELVES, PET FORCOLD
CONSUMPTION
IDENTIFYINGATTRACTIVE AREAS TO
LEVERAGECAPABILITIES AND OUR
CORE CONSUMER
NEWBRANDS
Hybrid Go-to-Market Strategy Enabling Us to Win at Retail
Our entire route to market is designed to maximize efficiency, reliability, flexibility, and profitability:from the way we source our coconut water all the way to how our products are delivered to retailersand consumers. We have refined our distribution model over the past two decades, which has enabledus to deliberately tailor our production and go-to-market capabilities to better serve our diversecustomers.
With our unique product portfolio, sophisticated and experienced team, and differentiated supplychain, we believe we are able to outperform smaller competitors with our scale and global reach, whiledistinguishing ourselves from larger beverage players through our nimbler, hybrid platform. Ourdistribution capabilities ensure our go-to- market path is efficient and effective for each channel weparticipate in, as well as each product in its respective lifecycle. For example, when a product is in itsearly stage of development, we might select a broadline distribution partner for going to market, and asscale increases we could decide to enter it into the DSD system or go DTW if the retailers prefer to doso. Having access to the full range of distribution options, while not being restricted or forced to useonly one of them, maximizes our execution speed and impact.
13

We employ a passionate and highly energetic sales force that is either on the ground talking toconsumers and store managers, or in regular dialogue with retailers to ensure we are securing the bestpossible shelf locations and displays, and executing programs to benefit our retailers’ business – all asa means to grow our business. This insatiable appetite for expansion is key to our growth andcontinued market position as retailers look to Vita Coco not only as the brand to stock within thecoconut water category, but also as a must-have brand within the natural beverages category. As asign of our ongoing brand and execution strength, we have been able to capture 89% of the growth inthe coconut water category in the current year to date, according to IRI Custom Research.
Year-to-Date Share of Retail Sales Growth in Coconut Water Category
89 %
18 %9 %
0 %
(17)%
Key Competitor 1 Private Label Key Competitor 2 All Others
Source: Retail sales per IRI Custom Research for the year-to-date period ended September 5, 2021 (MULO + Convenience).
In addition to our strong sales force and route to market, we have further entrenched ourrelationship as a value-add supplier to select retailers through servicing their private label needs. Ourprivate label business strengthens our relationships with retailers that are committed to their ownprivate label products, allows us to ensure the integrity and quality of the category and also allows usto enhance the relationships we have forged with coconut water manufacturers globally. This offeringsupports our leadership position within the coconut water category, and while we believe our brandedoffering will drive future growth, our private label offering ensures we are continuing to support bothretailers and suppliers.
A Unique, Asset-Lite Supply Chain That Starts Close to the Coconut Tree and Is Difficult toReplicate
As pioneers of the coconut water industry, and thought leaders in upcycling coconut water, wehave spent the last 17 years developing a global, asset-lite operating model of scale that starts in thetropical belt around the world and is able to seamlessly service our markets with the highest qualitypackaged coconut water. Our growing body of knowledge on efficient manufacturing and sourcingprocesses from farm to facility for coconut water has created a competitive advantage that is unrivaledin the industry today.
We believe we are the largest branded coconut water producer in the world, and to date, nocompetitor has been able to achieve what we do at the same scale and efficiency. We also believe thatreplicating our current supply chain set-up would be challenging and time consuming.
14
Our well-diversified global network of thousands of coconut farmers and 15 factories across10 countries is able to seamlessly service our end markets with the highest quality, delicious coconutwater. As we do not own any of the coconut water factories that we work with, our supply chain isasset-lite, which combined with our scale, enables us to be flexible and move production from onefacility or country to another as needed. We are able to quickly adapt to changes in the market orconsumer preferences while also efficiently introduce new products across our platform.
Our manufacturing partners arrange the cracking of approximately 2.5 million coconuts each dayat the highest quality standard for our coconut water needs, which requires supply from thousands ofindividual coconut farmers spread across the world and manufacturing operations located as closely aspractical to the farms. This makes our supply chain truly valuable and unique, and sets us apart fromother beverage companies. Our deep, long-standing relationships with our farming community havehelped us scale to where we are today and will continue to support our high-growth business model inthe future, while positioning us for ongoing profitability.
Finally, we believe our purchasing power is supported by our leading market position through VitaCoco and our private label offering, which provide significant scale-based cost advantages versuscompetitors and any potential new entrants across sourcing, shipping, and other logistics.
Social Responsibility Commitment That Permeates Through Our Products and Organization
The Vita Coco Company’s purpose is simple: we believe in harnessing, while protecting, nature’sresources for the betterment of the world and its inhabitants by delivering ethical, responsible, andbetter-for-you hydrating products, that not only taste delicious, but also uplift our communities and do rightby our planet. We believe these ideals have had a direct effect on our growth, and cause increasedconsumer adoption and spend on our products.
Our operational decision-making goes beyond solely maximizing shareholder value. We operate as aDelaware Public Benefit Corporation. Our commitment to social responsibility has three primary areas offocus:
• promoting healthy lifestyles;
• cultivating communities and culture; and
• protecting natural resources.
In addition to our responsible consumer-facing and organizational initiatives, our business’ growth andscale have aided communities where our manufacturing relationships are located. Many of these regionshave limited modern infrastructure, and we created the Vita Coco Project to help these coconut farmersincrease their annual yield, diversify their crops, and grow sustainably. With our “Give, Grow, Guide”philosophy we remain committed and focused on the future, and seek to contribute to educational programsand facilities through efforts such as building new classrooms and funding scholarships; all to impact thelives of over 1 million people in these communities. We believe this purpose-driven approach has aided ourgrowth as it is strategically aligned with the beliefs of our global consumer base.
15
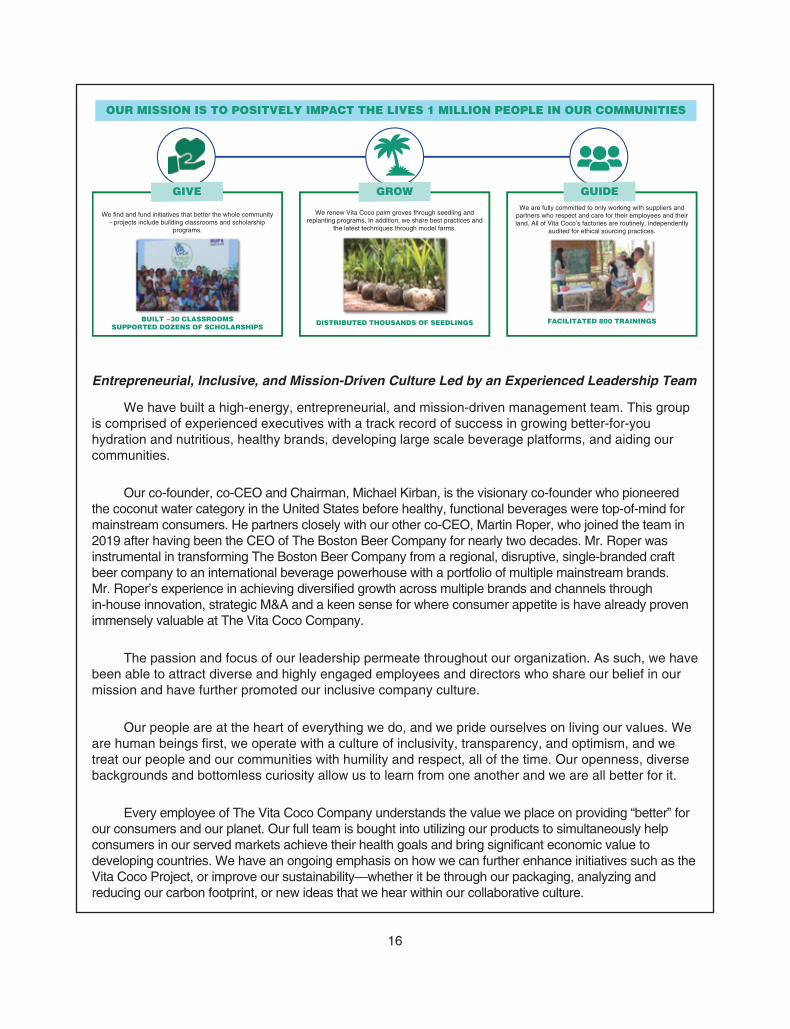
OUR MISSION IS TO POSITVELY IMPACT THE LIVES 1 MILLION PEOPLE IN OUR COMMUNITIES
We find and fund initiatives that better the whole community- projects include building classrooms and scholarship
programs.
GIVE
We renew Vita Coco palm groves through seedling andreplanting programs. In addition, we share best practices and
the latest techniques through model farms.
GROWWe are fully committed to only working with suppliers and
partners who respect and care for their employees and theirland. All of Vita Coco’s factories are routinely, independently
audited for ethical sourcing practices.
GUIDE
BUILT ~30 CLASSROOMSSUPPORTED DOZENS OF SCHOLARSHIPS
DISTRIBUTED THOUSANDS OF SEEDLINGS FACILITATED 800 TRAININGS
Entrepreneurial, Inclusive, and Mission-Driven Culture Led by an Experienced Leadership Team
We have built a high-energy, entrepreneurial, and mission-driven management team. This groupis comprised of experienced executives with a track record of success in growing better-for-youhydration and nutritious, healthy brands, developing large scale beverage platforms, and aiding ourcommunities.
Our co-founder, co-CEO and Chairman, Michael Kirban, is the visionary co-founder who pioneeredthe coconut water category in the United States before healthy, functional beverages were top-of-mind formainstream consumers. He partners closely with our other co-CEO, Martin Roper, who joined the team in2019 after having been the CEO of The Boston Beer Company for nearly two decades. Mr. Roper wasinstrumental in transforming The Boston Beer Company from a regional, disruptive, single-branded craftbeer company to an international beverage powerhouse with a portfolio of multiple mainstream brands.Mr. Roper’s experience in achieving diversified growth across multiple brands and channels throughin-house innovation, strategic M&A and a keen sense for where consumer appetite is have already provenimmensely valuable at The Vita Coco Company.
The passion and focus of our leadership permeate throughout our organization. As such, we havebeen able to attract diverse and highly engaged employees and directors who share our belief in ourmission and have further promoted our inclusive company culture.
Our people are at the heart of everything we do, and we pride ourselves on living our values. Weare human beings first, we operate with a culture of inclusivity, transparency, and optimism, and wetreat our people and our communities with humility and respect, all of the time. Our openness, diversebackgrounds and bottomless curiosity allow us to learn from one another and we are all better for it.
Every employee of The Vita Coco Company understands the value we place on providing “better” forour consumers and our planet. Our full team is bought into utilizing our products to simultaneously helpconsumers in our served markets achieve their health goals and bring significant economic value todeveloping countries. We have an ongoing emphasis on how we can further enhance initiatives such as theVita Coco Project, or improve our sustainability—whether it be through our packaging, analyzing andreducing our carbon footprint, or new ideas that we hear within our collaborative culture.
16
Our Growth Strategies
Drive Further Brand Awareness and Customer Acquisition
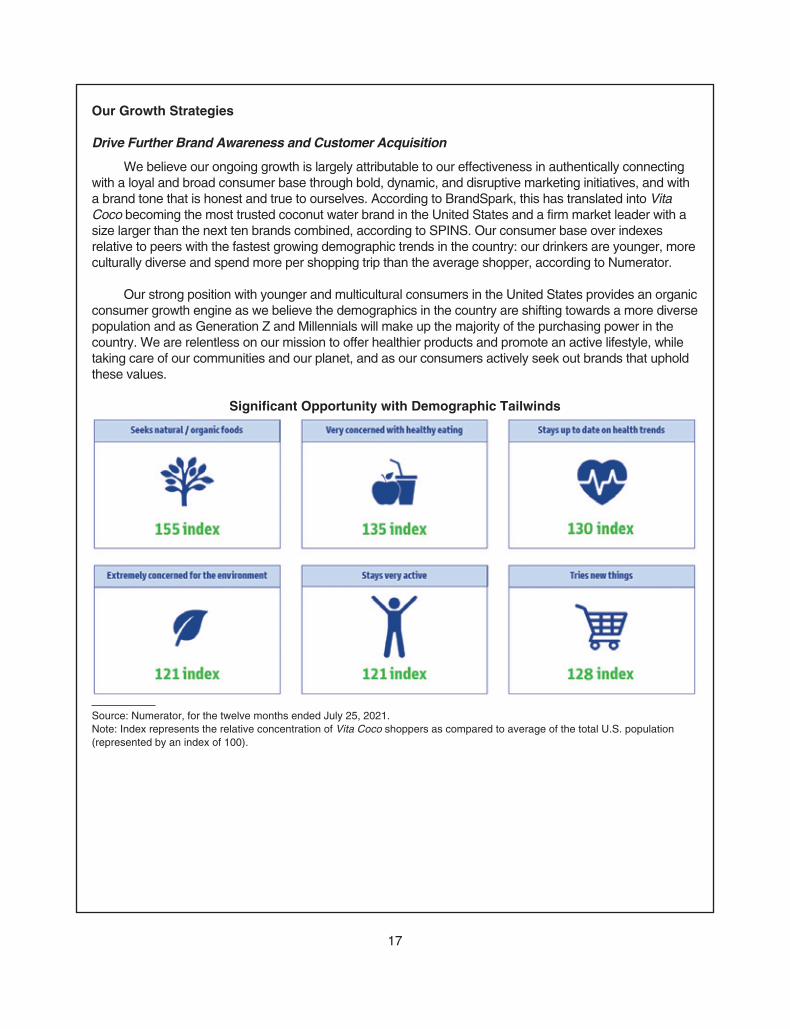
We believe our ongoing growth is largely attributable to our effectiveness in authentically connectingwith a loyal and broad consumer base through bold, dynamic, and disruptive marketing initiatives, and witha brand tone that is honest and true to ourselves. According to BrandSpark, this has translated into VitaCoco becoming the most trusted coconut water brand in the United States and a firm market leader with asize larger than the next ten brands combined, according to SPINS. Our consumer base over indexesrelative to peers with the fastest growing demographic trends in the country: our drinkers are younger, moreculturally diverse and spend more per shopping trip than the average shopper, according to Numerator.
Our strong position with younger and multicultural consumers in the United States provides an organicconsumer growth engine as we believe the demographics in the country are shifting towards a more diversepopulation and as Generation Z and Millennials will make up the majority of the purchasing power in thecountry. We are relentless on our mission to offer healthier products and promote an active lifestyle, whiletaking care of our communities and our planet, and as our consumers actively seek out brands that upholdthese values.
Significant Opportunity with Demographic Tailwinds
Source: Numerator, for the twelve months ended July 25, 2021.Note: Index represents the relative concentration of Vita Coco shoppers as compared to average of the total U.S. population(represented by an index of 100).
17

170 HISPANIC227 ASIAN132 BLACK
123 GEN Z142 MILLENIAL
9.5%
18.8%
Last 12 Months
VITA COCO HOUSEHOLD PENETRATION2
Total US Population Urban Millennial + Gen Z
VITA COCODEMOGRAPHICS CONSUMER
INDEX1:
US DEMOGRAPHIC TRENDS: AGE AND ETHNICITYPROVIDING CONSUMER GROWTH TAILWINDS
HOUSEHOLD PENETRATION IS GROWINGWITH OUR TARGET CONSUMER
VITA COCOAGE CONSUMER INDEX1:
Source: 1. Numerator, 52 weeks ending July 25, 2021. Index represents the relative concentration of Vita Coco shoppers ascompared to average of total U.S. population.2. Numerator, 52 weeks ending July 31, 2021.
Despite our 46% market share within the coconut water category in the United States accordingto IRI Custom Research, household penetration in the 12 months ended July 31, 2021 for Vita Coco isonly 9.5% according to Numerator, while household penetration for the category is approximately 21%.In addition to specific retailer distribution opportunities, we see the Midwest region of the United Statesas an under-penetrated geography for the Vita Coco brand as our household penetration in suchregion is 66% of our national average. We have a proven track record of highlighting our taste, qualityand functional attributes, whether it be through celebrity endorsements, our own social mediacampaigns, or in-the-field consumer sampling and education.
We believe we have the potential to substantially increase our household penetration in comingyears by (1) benefitting from the growth in our core consumer base as the multi-cultural and youngercohorts make up an increasingly larger share of shoppers, (2) raising awareness by leveraging ourearned media and increasing our digital media investments, (3) gaining share of coconut watershoppers through our increased pack and flavor offerings, (4) using our sales and promotional teamsto increase visibility and trial at retail, and (5) continuing to invest in e-commerce channels to drivehigher consumption rates and loyalty. Meanwhile we see additional volume growth opportunitiesthrough increasing the frequency of consumption through (1) increasing pantry loading with multi-packs, (2) winning in key occasions such as smoothies, and (3) entering new occasions throughfunctional benefit led innovations such as Vita Coco Boosted with added medium-chain triglyceride, orMCT, and natural caffeine, through additional formats such as Vita Coco coconut juice in cans andthrough our Vita Coco coconut milk products.
Increase Penetration and Distribution Across Channels
We believe there are significant opportunities across channels to gain distribution, and we plan toleverage our existing relationships to increase penetration and broaden our footprint across theAmericas. Despite achieving over $237 million in retail sales for the 52 weeks ended September 5,2021, as reported by IRI, we are continuing to experience 29% retail dollar sales growth across theUnited States for the 13 weeks ended September 5, 2021, according to IRI, and our growth is strongacross all channels, mainly driven by velocity increases.
18

Vita Coco YoY Retail Sales Growth
23% 27%18%
9%
28%
55%
19%
40%
MULO C-store Food Drug
Last 52 Weeks Last 26 Weeks
Source: Retail sales per IRI for the 52 and 26 weeks ended September 5, 2021 (MULO + Convenience).
We see opportunities to translate this consumption growth into further distribution gains acrosschannels, with a simultaneous focus on increasing shelf space and velocity in current doors. Due to ourstrong velocities across channels, we believe we have the opportunity to grow our points of distribution byapproximately two fold with the Vita Coco brand alone. Specifically, we believe we have an opportunity inlarge format accounts to increase the number of items per store by maximizing our core item distribution inregional chains as well as the introduction of multipacks and new product lines such as our premiumFarmers Organic, which highlights our sustainable sourcing, and Vita Coco Boosted. Coconut watermultipacks are particularly attractive for our business, as retail sales of multipacks are outgrowingcompeting natural and healthy beverage categories, but only take up approximately one-half the shelfspace that we believe should be allocated to multipacks in our category, according to IRI. In addition, wesee a large opportunity to increase the number of doors in the convenience channel, where Vita Cocoremains under distributed with only 55% of all-commodities-value weighted distribution, or ACV distribution,according to IRI. Furthermore, our introduction of Vita Coco coconut juice in cans is intended to support ourconvenience channel distribution with an opportunity to add more items per store.
IRI reported velocity, defined as dollars per point of distribution, is already higher than selectcranberry juice, enhanced water and sparkling water brands that are two to five times our size.However, our total distribution points are significantly below any of these brands. We believe thisrepresents a significant opportunity to meaningfully expand our distribution levels across channels andcapture additional shelf space, while simultaneously focusing on increasing the number of our productssold per store.
Vita Coco Velocity Growth
24%
32%
22%
33%
MULO C-store Food Drug
% Change in Velocity vs. Year Ago
Add Additional Multipacks
Add New Doors and Grow Space
Add Additional Multipacks
Grow Single Serve Space93 55 94 92
Distribution Opportunity ACV Weighted Distribution
Source: Velocity is % change in Retail $ sales per TDP for the 13 weeks ended September 5, 2021. ACV weighted distribution isfor the 52 weeks ended September 5, 2021 (Both from IRI Custom Research, MULO + Convenience).
19
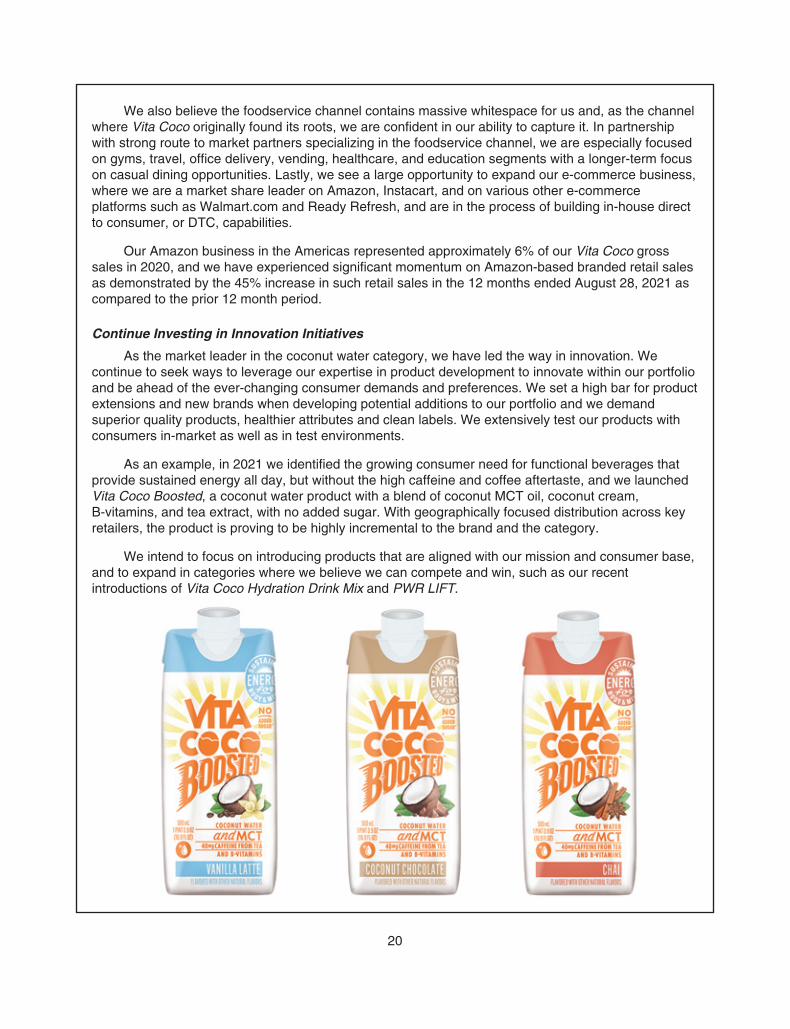
We also believe the foodservice channel contains massive whitespace for us and, as the channelwhere Vita Coco originally found its roots, we are confident in our ability to capture it. In partnershipwith strong route to market partners specializing in the foodservice channel, we are especially focusedon gyms, travel, office delivery, vending, healthcare, and education segments with a longer-term focuson casual dining opportunities. Lastly, we see a large opportunity to expand our e-commerce business,where we are a market share leader on Amazon, Instacart, and on various other e-commerceplatforms such as Walmart.com and Ready Refresh, and are in the process of building in-house directto consumer, or DTC, capabilities.
Our Amazon business in the Americas represented approximately 6% of our Vita Coco grosssales in 2020, and we have experienced significant momentum on Amazon-based branded retail salesas demonstrated by the 45% increase in such retail sales in the 12 months ended August 28, 2021 ascompared to the prior 12 month period.
Continue Investing in Innovation Initiatives
As the market leader in the coconut water category, we have led the way in innovation. Wecontinue to seek ways to leverage our expertise in product development to innovate within our portfolioand be ahead of the ever-changing consumer demands and preferences. We set a high bar for productextensions and new brands when developing potential additions to our portfolio and we demandsuperior quality products, healthier attributes and clean labels. We extensively test our products withconsumers in-market as well as in test environments.
As an example, in 2021 we identified the growing consumer need for functional beverages thatprovide sustained energy all day, but without the high caffeine and coffee aftertaste, and we launchedVita Coco Boosted, a coconut water product with a blend of coconut MCT oil, coconut cream,B-vitamins, and tea extract, with no added sugar. With geographically focused distribution across keyretailers, the product is proving to be highly incremental to the brand and the category.
We intend to focus on introducing products that are aligned with our mission and consumer base,and to expand in categories where we believe we can compete and win, such as our recentintroductions of Vita Coco Hydration Drink Mix and PWR LIFT.
20

Broaden Our Geographic Reach
For the six months ended June 30, 2021, 15% of our net sales were international and we see anopportunity to grow further within existing and new geographies over the coming years. We pioneeredthe coconut water category in Europe and were early entrants into China in 2014, and as of June 30,2021 our international business is approximately 60% in Europe, 15% in Asia Pacific, and 25% in otherregions and includes private label and commodities. The success of our coconut water productsdemonstrates both our ability to win in new markets, and the international appeal of our brands. Ourinternational business is anchored by Vita Coco’s footprint in the United Kingdom, where it is thecoconut water category leader with over 70% market share, according to IRI U.K. Our scale and nimbleroute to market which combines direct to retail, wholesalers and ecommerce in the United Kingdom,and a local sales and marketing team directing promotions and investments against marketopportunities, allows us to be impactful and reactive to changes in the beverage market. While ourprimary focus is on beverages, we have innovated in collaboration with key retail partners by extendingthe brand into natural personal care products that have been well received by our loyal consumer baseand are allowing us to test which broader consumer needs our brand can expand to meet.
We entered the United Kingdom, China, France and Spain early in our international journey, andlearned from some of the keys to success in different export markets. We adjusted our approach in2019 to focus on key markets and retailers to build a stronger base business, and now have healthyprofitable stable businesses that we can build from. Our U.K. team runs market development activitiesin Europe and the Middle East. In the China market, we have a commercial team focused on localexecution for which costs are shared with our local distribution partner. We have differing route tomarket models for each country and the varied approaches have allowed us to establish our brandsand invest in these markets for long-term growth in a prudent financial way, and to evolve ourapproach in each market as our brand develops.
We believe we are uniquely positioned to take greater share of the large and growing globalnatural beverages market based on the functional benefits that our Vita Coco brand offers consumersinterested in health and wellness and our company’s mission and responsible sourcing that shouldappeal to consumers’ interest in purpose driven brands. Leveraging our global capabilities, we believewe can continue to grow existing markets and broaden our global reach through the addition of newmarkets. For each country we customize our product offering and packaging, initially focus onmarketing and sales activation in key cities to establish the brand, and look for potential innovationopportunities unique to that culture that would boost our brand’s probability of success.
We plan to prioritize regions where we believe the most attractive opportunities are available tous based on product fit with consumer demographics and interest in health, wellness and purpose, andmarket opportunity. We are currently focused on regions such as Western Europe and China, wherewe believe the interest in health and wellness is growing and the markets are sizable and expected togrow significantly.
Leverage Growth, Continuous Improvement, and Scale for Margin Expansion
Since our founding, we have exercised healthy financial discipline when managing our businessand executing on our growth strategies. While many companies at our stage and with our growthprofile employ a “growth-at-all-cost” mindset, we have always been focused on profitable, responsible,and sustainable growth. We view this strategy to be most prudent and value-maximizing for all of ourstakeholders, including investors, consumers, customers, employees, and global citizens, over thelong-term horizon.
21
Our financial discipline was a primary motivator to build out an asset-lite model that provides usstrong gross margins and high free cash flow generation, which together provides us financialflexibility. Our investment in engineering resources to support our suppliers has identified a consistentflow of operational improvement projects that we and the suppliers have benefited from, and whileslightly paused during COVID-19, we anticipate this continuing on an ongoing basis. As we continue togrow our top-line, both organically and through opportunistic M&A, we expect to also benefit fromeconomies of scale and operating leverage, thus expanding our margins and mitigating inflationarypressures in the longer-term.
We have recently made investments in our supply chain capacity, information systems, and otherinfrastructure to better position our organization for long-term growth. To date, those actions havehelped us manage our business and cost structure in a more efficient way and ultimately yieldedmargin expansion as evidenced by our year-over-year gross margin and EBITDA marginimprovements. We anticipate the impact of the COVID-19 pandemic, which has created near-terminflationary pressures on supply chain costs, to start normalizing in the mid-term horizon. As such, weexpect further margin expansion in the future as we continue to scale our portfolio of brands and gainincreased operating leverage once these impacts dissipate.
Execute Strategic M&A to Enhance Our Portfolio
As a platform of multiple beverage brands today, we are constantly evaluating potentialbusinesses to acquire or new brands to develop to complement our portfolio. We seek brands thatalign with our company mission and are complementary to our current brand portfolio, supply chain,and route to market, and those that we believe, under our stewardship, present meaningful growthpotential. By combining our industry expertise with our proven marketing engine, our strong salesteam, and world-class operational capabilities, we believe we can empower acquired brands to achievetheir full potential as a part of our platform.
Since the Runa acquisition in 2018, we have gained experience in business and brand integrationand believe our team has the skills to identify, integrate, and support newly acquired brands within ourportfolio as we continue to scale. As pioneers and innovators, as well as disciplined allocators ofcapital, we will continue to employ a focused yet opportunistic approach to M&A, concentrating ourefforts on businesses with complementary brands, growth orientation, attractive financial profiles, andopportunities to leverage our platform’s scale to unlock synergies.
22

BEVERAGESEGMENT
SEGMENTL52W SALES
SEGMENTL52W GROWTH KEY BENEFITS HOW WE PARTICIPATE
DAIRYALTERNATIVES
$ 2.4BN +8 %TASTE,
FUNCTIONALITY
WATER ANDENHANCEDWATER
$ 21.6BN +9 % HYDRATION
EVERY-DAYNUTRITION ANDHYDRATION
$ 16.6BN +5 %HYDRATION,NUTRITION,
ELECTROLYTES
ENERGY $ 15.5BN +16 %ENERGY /CAFFEINE
PERFORMANCEBEVERAGES
$ 8.6BN +15 %ELECTROLYTES,
SUGAR
Source: IRI Custom Research as of September 5, 2021. Note: Beverage Segments based on custom IRI categorization. Waterand Enhanced Water includes Coconut Water, Flavored Enhanced Water, Mainstream Water, Plant Water, Premium Water, andSparkling Water & Seltzer. Every-day Nutrition and Hydration includes Coconut Water, Mainstream Refrigerated Juice, PlantWater, and Shelf Stable Juice. Energy includes Traditional Energy, Performance Energy, and Natural Energy. PerformanceBeverages includes Isotonics.
Our Industry
Large and Attractive Category Aligned with Key Consumer Trends
We operate in the large and growing non-alcoholic beverages industry, which consists of bottledwater, carbonated soft drinks, juice, ready-to-drink coffee and tea, energy drinks, sports drinks,drinking milk products and other non-alcoholic beverages. Global non-alcoholic beverages on-and-offcombined retail sales exceeded $952 billion in 2020 and are expected to reach $1.36 trillion by 2025,representing a CAGR of 7%, according to Euromonitor. The United States, which is our largest market,generated retail sales of over $119 billion for the 52 weeks ended May 16, 2021, according to SPINS.In line with retail, foodservice also represents a significant opportunity for us, which we believeexpands the total addressable market even further.
Our brands Vita Coco and Runa participate in the natural, plant-based category of the beveragesindustry, and offer consumers better-for-you products with functional benefits. Through the brands in ourplatform, we are able to cover many functional needs, spanning across hydration, nutrition, and energy.With our coconut milk product, we are also able to tap into the plant-based dairy substitute category, whichis rapidly increasing in popularity and size, and fits with our mission of creating responsible, natural, andbetter-for-you products. Our product attributes deliver what consumers today desire, as is evidenced byrapid growth in plant-based products. According to an April 2021 online article published by SPINS, plant-based food and beverage consumption increased 29% in 2020 alone, and in a recent consumer surveypowered by Lightspeed/Mintel, 65% of consumers reported enjoying a functional beverage in the threemonths preceding the survey.
The natural beverages category generates $13 billion in U.S. retail sales, and is growing twice asfast as conventional beverages, according to SPINS. Since our launch in the early 2000s, we haveseen spending on natural beverages far outpace that of conventional beverages due to increasedconsumer demand for health and wellness focused products, and today the average price per liquid
23

ounce for the natural beverage brands is indexed at 206 compared to the average price per liquidounce for the total beverage category. Health is the fastest growing beverage need state, withoccasions up over 30% in the past 10 years according to Kantar, thereby fueling incrementalconsumption. People are increasingly consuming better-for-you, plant-based beverages to hydrateafter and during exercise, to add nutritional benefits to their diets, and to enhance their well-being. We,and industry data aggregators, believe this trend is expected to continue as consumers keep searchingfor products that make them feel good and provide functional benefits. Based on SPINS data, webelieve our current market share is less than 2% of total U.S. natural beverages retail sales, providingour platform with significant room for future growth.
YoY Beverage Segment $ Retail Sales Growth %
6%
13% 13%
9%
Conventional Natural Speciality & Wellness Total Beverages
Source: Retail sales per SPINS for the 52 weeks ended May 16, 2021 (MULO + Convenience)
We believe per capita consumption of conventional beverages is declining, whereas per capitaconsumption of natural beverages is increasing as a result of a rapidly growing preference for health-conscious products that have fewer added sugars, artificial ingredients, and also provide nutritionalbenefits. Further, we believe consumers are also seeking out natural and plant-based alternativeswhere possible. We believe these trends were already prevalent before COVID-19, but have receivedadditional attention and momentum during the pandemic as consumers are increasingly focusing onhealthier consumption habits to sustain a well-balanced diet. In addition, consumer awareness of thenegative environmental and social impact of packaged goods has resulted in increased consumerdemand for brands that are purpose-driven, take responsibility for their impact on the planet and arefocused on sustainable packaging and transparent ethical values. Shoppers are willing to pay more forsustainable brands that act responsibly and make a positive impact. We believe our mission isperfectly aligned with this change in consumer behavior, and positions us well compared to many otherbeverages brands as consumers look for products with better-for-you and better-for-the-world traits.Our leading brand, Vita Coco, which is naturally plant-based and fat-free, as well as our Runa, Ever &Ever and PWR LIFT brands, have proven to resonate with consumers looking for healthy, naturalbeverages, and have a long runway of growth as more consumers are attracted to the category.
Leader in Coconut Water
Coconut water is a naturally fat-free and potassium-rich water harvested from young and tendercoconuts that are six to nine months old. Packaged coconut water is created by extracting coconut
24
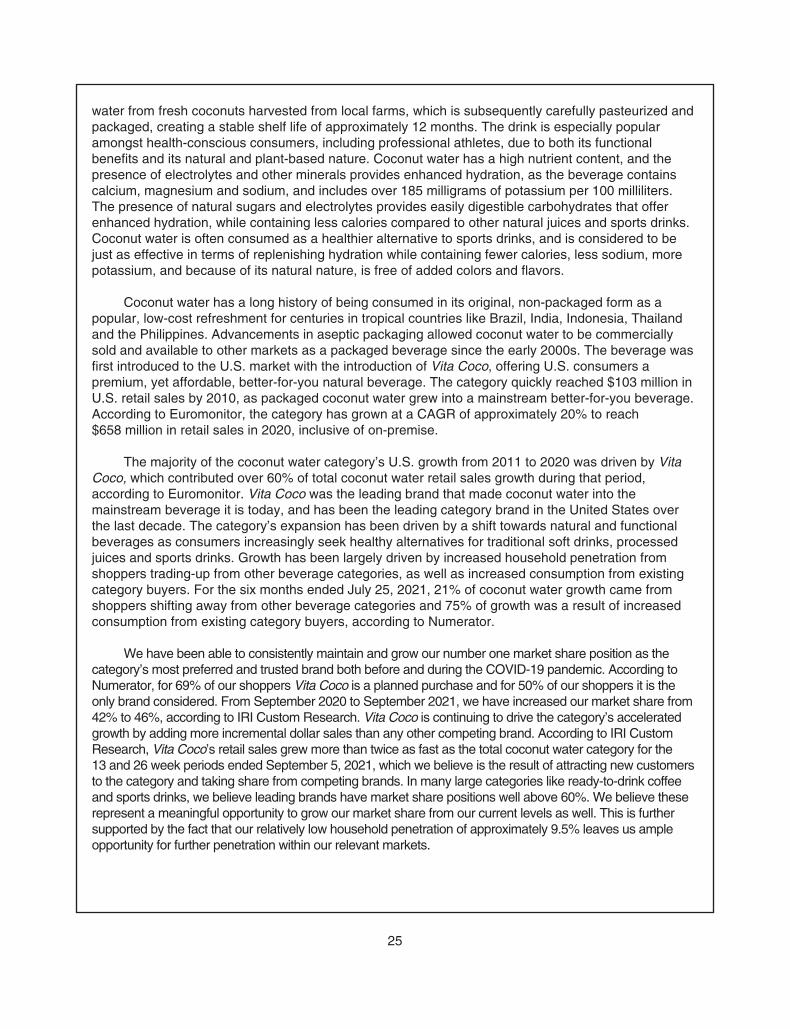
water from fresh coconuts harvested from local farms, which is subsequently carefully pasteurized andpackaged, creating a stable shelf life of approximately 12 months. The drink is especially popularamongst health-conscious consumers, including professional athletes, due to both its functionalbenefits and its natural and plant-based nature. Coconut water has a high nutrient content, and thepresence of electrolytes and other minerals provides enhanced hydration, as the beverage containscalcium, magnesium and sodium, and includes over 185 milligrams of potassium per 100 milliliters.The presence of natural sugars and electrolytes provides easily digestible carbohydrates that offerenhanced hydration, while containing less calories compared to other natural juices and sports drinks.Coconut water is often consumed as a healthier alternative to sports drinks, and is considered to bejust as effective in terms of replenishing hydration while containing fewer calories, less sodium, morepotassium, and because of its natural nature, is free of added colors and flavors.
Coconut water has a long history of being consumed in its original, non-packaged form as apopular, low-cost refreshment for centuries in tropical countries like Brazil, India, Indonesia, Thailandand the Philippines. Advancements in aseptic packaging allowed coconut water to be commerciallysold and available to other markets as a packaged beverage since the early 2000s. The beverage wasfirst introduced to the U.S. market with the introduction of Vita Coco, offering U.S. consumers apremium, yet affordable, better-for-you natural beverage. The category quickly reached $103 million inU.S. retail sales by 2010, as packaged coconut water grew into a mainstream better-for-you beverage.According to Euromonitor, the category has grown at a CAGR of approximately 20% to reach$658 million in retail sales in 2020, inclusive of on-premise.
The majority of the coconut water category’s U.S. growth from 2011 to 2020 was driven by VitaCoco, which contributed over 60% of total coconut water retail sales growth during that period,according to Euromonitor. Vita Coco was the leading brand that made coconut water into themainstream beverage it is today, and has been the leading category brand in the United States overthe last decade. The category’s expansion has been driven by a shift towards natural and functionalbeverages as consumers increasingly seek healthy alternatives for traditional soft drinks, processedjuices and sports drinks. Growth has been largely driven by increased household penetration fromshoppers trading-up from other beverage categories, as well as increased consumption from existingcategory buyers. For the six months ended July 25, 2021, 21% of coconut water growth came fromshoppers shifting away from other beverage categories and 75% of growth was a result of increasedconsumption from existing category buyers, according to Numerator.
We have been able to consistently maintain and grow our number one market share position as thecategory’s most preferred and trusted brand both before and during the COVID-19 pandemic. According toNumerator, for 69% of our shoppers Vita Coco is a planned purchase and for 50% of our shoppers it is theonly brand considered. From September 2020 to September 2021, we have increased our market share from42% to 46%, according to IRI Custom Research. Vita Coco is continuing to drive the category’s acceleratedgrowth by adding more incremental dollar sales than any other competing brand. According to IRI CustomResearch, Vita Coco’s retail sales grew more than twice as fast as the total coconut water category for the13 and 26 week periods ended September 5, 2021, which we believe is the result of attracting new customersto the category and taking share from competing brands. In many large categories like ready-to-drink coffeeand sports drinks, we believe leading brands have market share positions well above 60%. We believe theserepresent a meaningful opportunity to grow our market share from our current levels as well. This is furthersupported by the fact that our relatively low household penetration of approximately 9.5% leaves us ampleopportunity for further penetration within our relevant markets.
25

Vita Coco Coconut Water Dollar Market Share
L52W September 2020
Vita Coco:42%
L52W September 2021
Vita Coco:46%
Vita Coco Other Brands
Source: Coconut water category per IRI Custom Research for the 52 weeks ended September 5, 2021 (MULO + Convenience)
Within the broader water category, coconut water has outperformed most other competitivebeverages, as well as the overall water category, over the past year, according to IRI CustomResearch. Additionally, coconut water’s velocity is one of the fastest growing of all water categories.We believe that the strength of our Vita Coco brand, coupled with investments in new productinnovation, positions us to continue to deliver industry-leading growth within the coconut water andbroader functional beverages category.
Year-over-Year Dollar Sales Growth
9%13%
20%
11% 12%
6%
11%
15%
29%
4%
15%
9%
TotalWater
CoconutWater
PremiumWater
SparklingWater
EnhancedWater
MainstreamWater
L52W L26W
Velocity %Change -
L26W:+21% +32% +6% +18% +11%+14%
Source: Retail sales per IRI Custom Research, MULO + Convenience channels, for the 26 and 52 week periods endedSeptember 5, 2021. Velocity per IRI Custom Research, MULO + Convenience channels, for the 26 week periods endedSeptember 5, 2021. Velocity change represents L26W % change in average weekly dollars sold per store.
26

Recent Developments
Estimated Selected Preliminary Results for the Three Months Ended September 30, 2021
We have not yet completed our closing procedures for the three months ended September 30,2021. Presented below are certain estimated preliminary unaudited financial results for the three monthsended September 30, 2021 and the corresponding unaudited period of the prior fiscal year. These rangesare based on the information available to us as of the date of this prospectus. These are forward-lookingstatements and may differ from actual results. We have provided estimated ranges, rather than specificamounts, because these results are preliminary and subject to change. As such, our actual results mayvary from the estimated preliminary unaudited results presented here and will not be finalized until afterwe close this offering and complete our normal quarter-end accounting procedures. These ranges reflectmanagement’s best estimate of the impact of events during the quarter.
The information presented herein should not be considered a substitute for the financialinformation to be filed with the SEC in our Quarterly Report on Form 10-Q for the three months endedSeptember 30, 2021 once it becomes available. Accordingly, you should not place undue reliance onthese preliminary financial results and key operating metrics. These estimated preliminary unauditedresults should be read in conjunction with the “Management’s Discussion and Analysis of FinancialCondition and Results of Operations” and “Risk Factors” sections and our consolidated financialstatements, including the notes thereto, included herein.
The estimated preliminary financial results for the three months ended September 30, 2021 havebeen prepared by, and are the responsibility of, management. Our independent registered publicaccounting firm has not audited, reviewed, compiled or performed any procedures with respect to theestimated preliminary financial results. Accordingly, our independent registered public accounting firmdoes not express an opinion or any other form of assurance with respect thereto.
The following tables provide our preliminary ranges and financial results for the period presented:
Three Months Ended September 30,
2021 Estimated 2020 Actual
Low High (unaudited)
(in thousands)Net sales . . . . . . . . . . . . . . . . . . . . . . . . . . . . . . . . . . . . . . . . . . . . . . . . $112,000 $116,000 $87,321Gross profit . . . . . . . . . . . . . . . . . . . . . . . . . . . . . . . . . . . . . . . . . . . . . . $ 36,000 $ 39,000 $29,379
• For the three months ended September 30, 2021, we expect to report net sales in the range of$112.0 million to $116.0 million, representing an increase of approximately 28% and 33%,respectively, compared to $87.3 million for the three months ended September 30, 2020. Theexpected increase is primarily driven by increases in shipment volumes across both ourAmericas and International segments, with the Vita Coco Coconut Water product categoryanticipated to be the largest contributor to the increase.
• For the three months ended September 30, 2021, we expect to report gross profit in the rangeof $36.0 million to $39.0 million, representing an increase of approximately 23% and 33%,respectively, compared to $29.4 million for the three months ended September 30, 2020. Weexpect the increase to be driven primarily by increases in shipment volumes across both ourgeographic segments, with lower promotional activities in Americas partly offsetting thesignificant increase in ocean freight costs we are seeing. The cost and availability of oceancontainers remain our primary focus and we are exploring ways to secure our needs at moreacceptable and predicable costs, including through opportunistic spot purchases of containersand optimizing our supply chain sourcing for the current rate structures.
27

• In addition, we expect our selling, general & administrative expenses for the three monthsended September 30, 2021 on a dollar spend per month basis to be approximately in line withthe six months ended June 30, 2021. We anticipate the increase versus last year to be moremoderate than the increase we experienced for the six months ended June 30, 2021 ascompared to the six months ended June 30, 2020.
Concurrent Private Placement
Concurrently with, and subject to, the consummation of this offering, an entity affiliated withKeurig Dr Pepper Inc. (“KDP”), our largest distributor customer, has agreed to purchase, subject tocustomary closing conditions, $20.0 million of shares of common stock, at a price per share equal tothe initial public offering price per share at which our common stock is sold to the public in this offering,from Verlinvest Beverages SA (“Verlinvest”), one of our existing stockholders and one of the sellingstockholders in this offering (the “Concurrent Private Placement”). The sale of such shares will not beregistered under the Securities Act of 1933, as amended. The closing of this offering is not conditionedupon the closing of the Concurrent Private Placement. We will not receive any proceeds from theConcurrent Private Placement.
The entity affiliated with KDP purchasing shares in the Concurrent Private Placement has agreedto a lock-up agreement with the underwriters pursuant to which the shares of common stock purchasedin the Concurrent Private Placement will be locked up for a period of 180 days after the date of thisprospectus, subject to certain exceptions.
Risk Factors Summary
Our business is subject to a number of risks and uncertainties of which you should be awarebefore making a decision to invest in our common stock. These risks are more fully described in thesection titled “Risk Factors” immediately following this prospectus summary. These risks include,among others, the following:
• reduced or limited availability of coconuts or other raw materials that meet our qualitystandards;
• our dependence on our third-party manufacturing and co-packing partners;
• volatility in the price of materials used to package our products, and our dependence on ourexisting suppliers for such materials;
• problems with our supply chain resulting in potential cost increases and adverse impacts on ourcustomers’ ability to deliver our products to market;
• our dependence on our distributor and retail customers for a significant portion of our sales;
• our ability to successfully forecast and manage our inventory levels;
• harm to our brand and reputation as a result of real or perceived quality or food safety issueswith our products;
• a reduction in demand for and sales of our coconut water products or a decrease in consumerdemand for coconut water generally;
• our ability to develop and maintain our brands and company image;
• we may not be successful in our efforts to make acquisitions and successfully integrate newlyacquired businesses or products in the future;
• our ability to introduce new products or successfully improve existing products;
28

• our ability to respond to changes in consumer preferences;
• we must expend resources to maintain consumer awareness of our brands, build brand loyaltyand generate interest in our products, and our marketing strategies may or may not besuccessful as they evolve;
• pandemics, epidemics or disease outbreaks, such as the COVID-19 pandemic, may disrupt ourbusiness, including, among other things, consumption and trade patterns, and our supply chainand production processes;
• our ability to manage our growth effectively;
• climate change, or legal or market measures to address climate change, may negatively affectour business and operations;
• risks associated with the international nature of our business;
• disruptions in the worldwide economy;
• difficulties as we expand our operations into countries in which we have no prior operating history;
• our need for and ability to obtain additional financing to achieve our goals;
• our ability to maintain our company culture or focus on our mission as we grow;
• our dependence on and ability to retain our senior management;
• our ability and the ability of our third-party partners to meet our respective labor needs;
• the adequacy of our insurance coverage;
• compliance by our suppliers and manufacturing partners with ethical business practices orapplicable laws and regulations;
• our dependence on information technology systems, and the risk of failure or inadequacy ofsuch systems;
• lawsuits, product recalls or regulatory enforcement actions in connection with food safety andfood-borne illness incidents, other safety concerns or related to advertising inaccuracies orproduct mislabeling;
• complying with new and existing government regulation, both in the United States and abroad;
• complying with laws and regulations relating to data privacy, data protection, advertising andconsumer protection;
• our ability to protect our intellectual property;
• our ability to service our indebtedness and comply with the covenants imposed under ourexisting debt agreements;
• our largest shareholder will continue to have significant influence over us after this offering; and
• risks related to our status as a public benefit corporation.
Corporate Information
We were incorporated on January 17, 2007 as All Market Inc., a Delaware corporation, andbecome a public benefit corporation in Delaware in April 2021. On September 9, 2021, we changedour name to The Vita Coco Company, Inc. Our principal executive offices are located at 250 Park
29

Avenue South, Floor 7, New York, New York 10003, and our telephone number is (212) 206-0763.Our website address is www.thevitacococompany.com. Information contained on, or that can beaccessed through, our website does not constitute part of this prospectus, and the inclusion of ourwebsite address in this prospectus is an inactive textual reference only. Investors should not rely onany such information in deciding whether to purchase our common stock.
Implications of Being an Emerging Growth Company
As a company with less than $1.07 billion in revenue during our most recently completed fiscalyear, we qualify as an “emerging growth company” as defined in Section 2(a) of the Securities Act of1933, as amended, or the Securities Act, as modified by the Jumpstart Our Business Startups Act of2012 or the JOBS Act. As an emerging growth company, we may take advantage of specified reduceddisclosure and other requirements that are otherwise applicable, in general, to public companies thatare not emerging growth companies. These provisions include:
• not being required to comply with the auditor attestation requirements of Section 404 of theSarbanes-Oxley Act of 2002;
• reduced disclosure obligations regarding executive compensation; and
• exemptions from the requirements of holding a nonbinding advisory vote on executivecompensation and shareholder approval of any golden parachute payments not previouslyapproved.
Emerging growth companies can also delay adopting new or revised accounting standards untilsuch time as those standards apply to private companies.
We will remain an emerging growth company until the earliest to occur of: (1) the last day of thefiscal year in which we have more than $1.07 billion in annual revenue; (2) the date we qualify as a “largeaccelerated filer,” with at least $700 million of equity securities held by non-affiliates; (3) the date onwhich we have issued, in any three-year period, more than $1.0 billion in non-convertible debt securities;and (4) the last day of the fiscal year ending after the fifth anniversary of the completion of this offering.
We may take advantage of these exemptions until such time that we are no longer an emerginggrowth company. Accordingly, the information contained herein may be different than the informationyou receive from other public companies in which you hold stock.
Public Benefit Corporation Status
As a demonstration of our long-term commitment to our mission to promote healthy andsustainable beverage and consumer products, we are incorporated in Delaware as a public benefitcorporation. Public benefit corporations are a relatively new class of corporations that are intended toproduce a public benefit and to operate in a responsible and sustainable manner. Under Delaware law,public benefit corporations are required to identify in their certificate of incorporation the public benefitor benefits they will promote and their directors have a duty to manage the affairs of the corporation ina manner that balances the pecuniary interests of the stockholders, the best interests of thosematerially affected by the corporation’s conduct and the specific public benefit or public benefitsidentified in the public benefit corporation’s certificate of incorporation. See “Description of CapitalStock—Public Benefit Corporation Status.”
30

Our public benefit purpose, as provided in our certificate of incorporation, is harnessing, whileprotecting, nature’s resources for the betterment of the world and its inhabitants through creatingethical, sustainable, and better-for-you beverage and consumer good products that not only upliftcommunities but that do right by our planet. Furthermore, in order to advance the best interests ofthose materially affected by the Corporation’s conduct, it is intended that our business and operationscreate a material positive impact on society and the environment, taken as a whole.
31
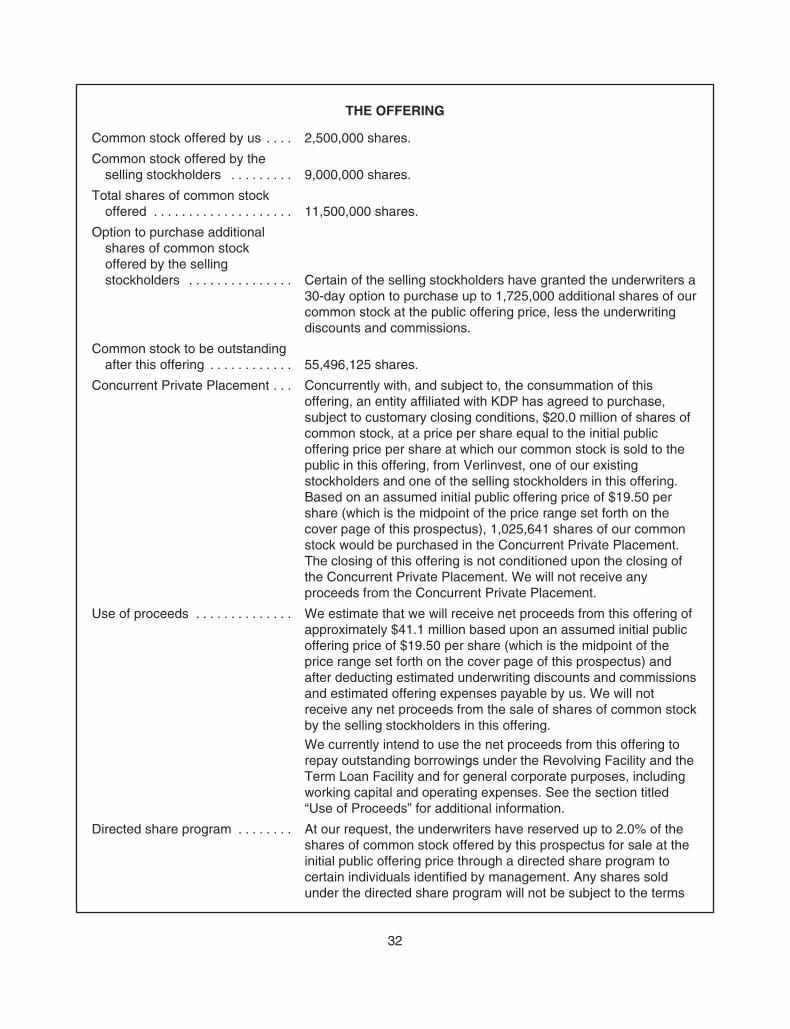
THE OFFERING
Common stock offered by us . . . . 2,500,000 shares.
Common stock offered by theselling stockholders . . . . . . . . . 9,000,000 shares.
Total shares of common stockoffered . . . . . . . . . . . . . . . . . . . . 11,500,000 shares.
Option to purchase additionalshares of common stockoffered by the sellingstockholders . . . . . . . . . . . . . . . Certain of the selling stockholders have granted the underwriters a
30-day option to purchase up to 1,725,000 additional shares of ourcommon stock at the public offering price, less the underwritingdiscounts and commissions.
Common stock to be outstandingafter this offering . . . . . . . . . . . . 55,496,125 shares.
Concurrent Private Placement . . . Concurrently with, and subject to, the consummation of thisoffering, an entity affiliated with KDP has agreed to purchase,subject to customary closing conditions, $20.0 million of shares ofcommon stock, at a price per share equal to the initial publicoffering price per share at which our common stock is sold to thepublic in this offering, from Verlinvest, one of our existingstockholders and one of the selling stockholders in this offering.Based on an assumed initial public offering price of $19.50 pershare (which is the midpoint of the price range set forth on thecover page of this prospectus), 1,025,641 shares of our commonstock would be purchased in the Concurrent Private Placement.The closing of this offering is not conditioned upon the closing ofthe Concurrent Private Placement. We will not receive anyproceeds from the Concurrent Private Placement.
Use of proceeds . . . . . . . . . . . . . . We estimate that we will receive net proceeds from this offering ofapproximately $41.1 million based upon an assumed initial publicoffering price of $19.50 per share (which is the midpoint of theprice range set forth on the cover page of this prospectus) andafter deducting estimated underwriting discounts and commissionsand estimated offering expenses payable by us. We will notreceive any net proceeds from the sale of shares of common stockby the selling stockholders in this offering.We currently intend to use the net proceeds from this offering torepay outstanding borrowings under the Revolving Facility and theTerm Loan Facility and for general corporate purposes, includingworking capital and operating expenses. See the section titled“Use of Proceeds” for additional information.
Directed share program . . . . . . . . At our request, the underwriters have reserved up to 2.0% of theshares of common stock offered by this prospectus for sale at theinitial public offering price through a directed share program tocertain individuals identified by management. Any shares soldunder the directed share program will not be subject to the terms
32

of any lock-up agreement, except in the case of shares purchasedby our directors and officers. The number of shares of commonstock available for sale to the general public will be reduced by thenumber of reserved shares sold to these individuals. Any reservedshares not purchased by these individuals will be offered by theunderwriters to the general public on the same basis as the othershares of common stock offered under this prospectus. See“Underwriting (Conflict of Interest)—Directed Share Program.”
Conflict of interest . . . . . . . . . . . . . An affiliate of Wells Fargo Securities, LLC currently holds 100% ofour Revolving Facility and Term Loan Facility and, as such, willreceive 5% or more of the net proceeds of this offering due to therepayment of outstanding borrowings and related fees andexpenses thereunder. See “Use of Proceeds.” Because of themanner in which the proceeds will be used, the offering will beconducted in accordance with Financial Industry RegulatoryAuthority, Inc. (“FINRA”) Rule 5121. In accordance with that rule,no “qualified independent underwriter” is required because theunderwriters primarily responsible for managing this offering arefree of any conflict of interest, as that term is defined in the rule.
Risk factors . . . . . . . . . . . . . . . . . . See the section titled “Risk Factors” and the other informationincluded in this prospectus for a discussion of factors you shouldcarefully consider before deciding to invest in shares of ourcommon stock.
Proposed Nasdaq tradingsymbol . . . . . . . . . . . . . . . . . . . . “COCO.”
The number of shares of our common stock to be outstanding after this offering is based on52,996,125 shares of common stock outstanding as of June 30, 2021, and excludes:
• 13,195 shares of common stock issued after June 30, 2021 upon exercise of outstandingoptions to purchase common stock;
• 4,143,230 shares of common stock issuable upon the exercise of stock options outstandingunder our 2014 Stock Option and Restricted Stock Plan, or 2014 Plan, as of June 30, 2021, ata weighted-average exercise price of $10.05 per share;
• 50,050 shares of common stock issuable upon the exercise of stock options granted afterJune 30, 2021, with a weighted-average exercise price of $10.18 per share, pursuant to our2014 Plan;
• 3,431,312 additional shares of our common stock reserved for future issuance under our 2021Incentive Award Plan, or 2021 Plan, which will become effective in connection with this offering,(and which number (x) includes the shares underlying the IPO Options (as defined below) andthe IPO RSUs (as defined below) and (y) excludes any potential evergreen increases pursuantto the 2021 Plan);
• 571,885 shares of our common stock reserved for issuance under our 2021 Employee StockPurchase Plan, or the ESPP, which will become effective in connection with this offering (andwhich excludes any potential annual evergreen increases pursuant to the ESPP);
• 629,555 shares of common stock, based on an assumed initial public offering price of $19.50per share (which is the midpoint of the price range set forth on the cover page of this
33
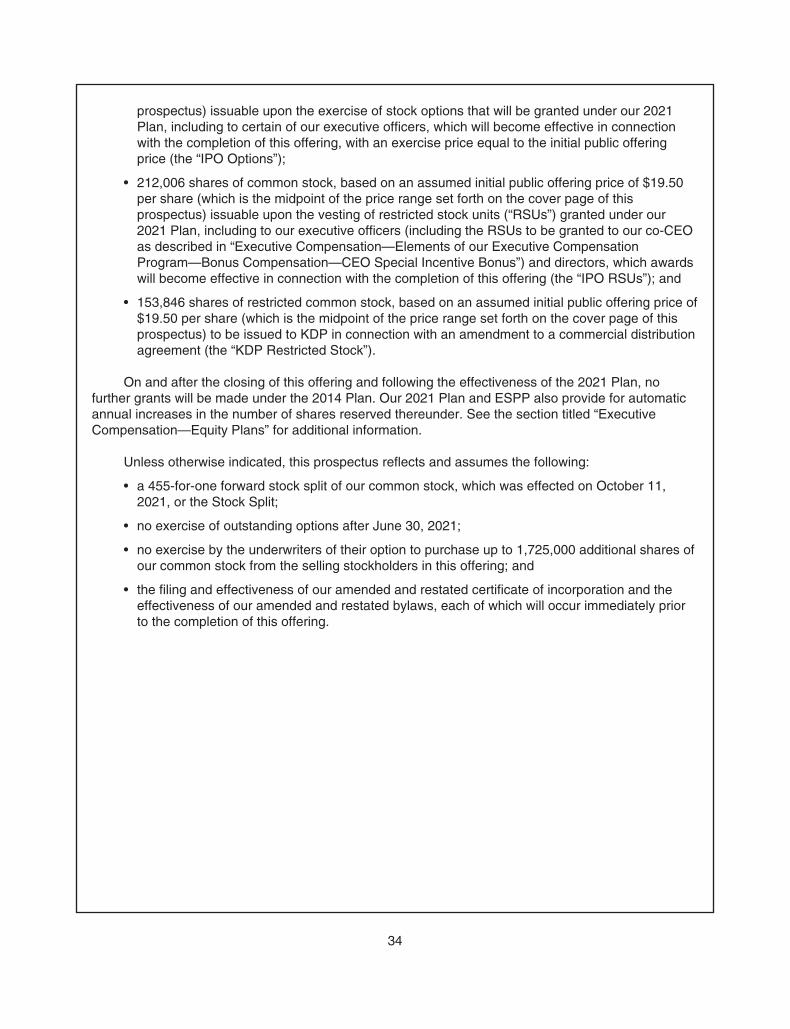
prospectus) issuable upon the exercise of stock options that will be granted under our 2021Plan, including to certain of our executive officers, which will become effective in connectionwith the completion of this offering, with an exercise price equal to the initial public offeringprice (the “IPO Options”);
• 212,006 shares of common stock, based on an assumed initial public offering price of $19.50per share (which is the midpoint of the price range set forth on the cover page of thisprospectus) issuable upon the vesting of restricted stock units (“RSUs”) granted under our2021 Plan, including to our executive officers (including the RSUs to be granted to our co-CEOas described in “Executive Compensation—Elements of our Executive CompensationProgram—Bonus Compensation—CEO Special Incentive Bonus”) and directors, which awardswill become effective in connection with the completion of this offering (the “IPO RSUs”); and
• 153,846 shares of restricted common stock, based on an assumed initial public offering price of$19.50 per share (which is the midpoint of the price range set forth on the cover page of thisprospectus) to be issued to KDP in connection with an amendment to a commercial distributionagreement (the “KDP Restricted Stock”).
On and after the closing of this offering and following the effectiveness of the 2021 Plan, nofurther grants will be made under the 2014 Plan. Our 2021 Plan and ESPP also provide for automaticannual increases in the number of shares reserved thereunder. See the section titled “ExecutiveCompensation—Equity Plans” for additional information.
Unless otherwise indicated, this prospectus reflects and assumes the following:
• a 455-for-one forward stock split of our common stock, which was effected on October 11,2021, or the Stock Split;
• no exercise of outstanding options after June 30, 2021;
• no exercise by the underwriters of their option to purchase up to 1,725,000 additional shares ofour common stock from the selling stockholders in this offering; and
• the filing and effectiveness of our amended and restated certificate of incorporation and theeffectiveness of our amended and restated bylaws, each of which will occur immediately priorto the completion of this offering.
34
SUMMARY CONSOLIDATED FINANCIAL AND OTHER DATA
The following tables summarize our consolidated financial and other data. The summaryconsolidated statements of operations data for the years ended December 31, 2020 and 2019 have beenderived from our audited consolidated financial statements included elsewhere in this prospectus. Thesummary consolidated statements of operations data for the six months ended June 30, 2021 and 2020and the summary consolidated balance sheet data as of June 30, 2021 are derived from our unauditedinterim consolidated financial statements included elsewhere in this prospectus. The unaudited interimconsolidated financial statements have been prepared on the same basis as the audited consolidatedfinancial statements, and in the opinion of management, reflect all adjustments, which include onlynormal recurring adjustments, necessary to present fairly our financial position and results of operations.Our historical results are not necessarily indicative of the results that may be expected in the future. Youshould read the following summary consolidated financial and other data below in conjunction with thesection titled “Management’s Discussion and Analysis of Financial Condition and Results of Operations”and our consolidated financial statements and related notes included elsewhere in this prospectus.
35
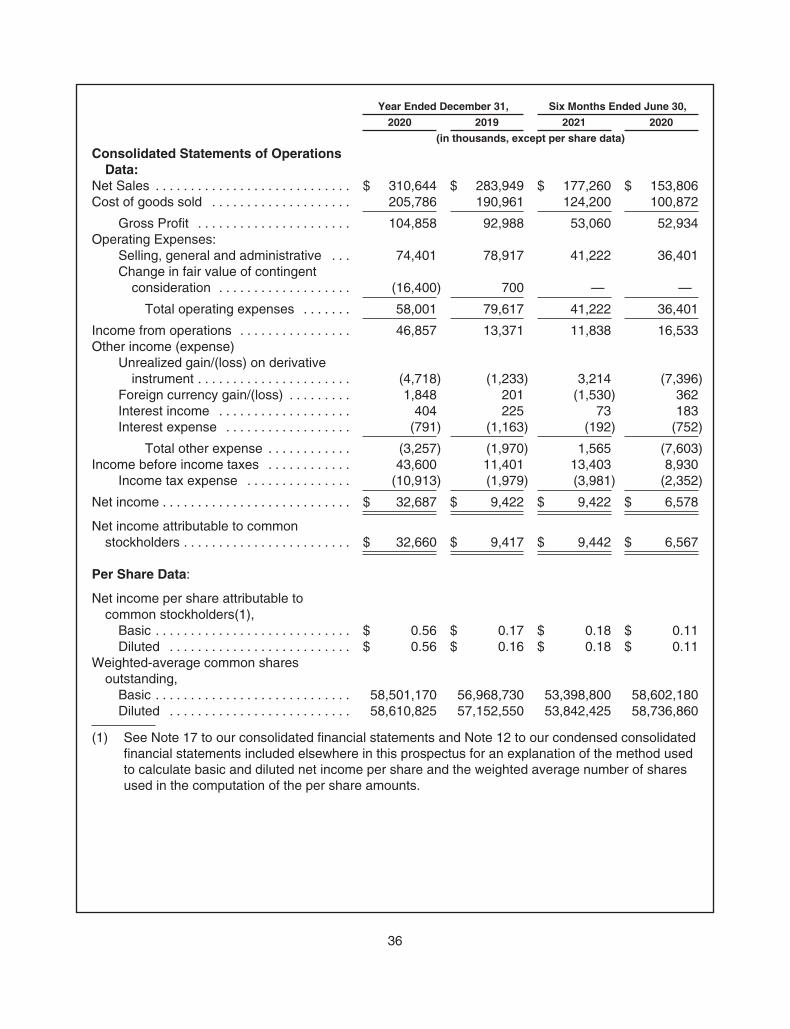
Year Ended December 31, Six Months Ended June 30,
2020 2019 2021 2020
(in thousands, except per share data)
Consolidated Statements of OperationsData:
Net Sales . . . . . . . . . . . . . . . . . . . . . . . . . . . . $ 310,644 $ 283,949 $ 177,260 $ 153,806Cost of goods sold . . . . . . . . . . . . . . . . . . . . 205,786 190,961 124,200 100,872
Gross Profit . . . . . . . . . . . . . . . . . . . . . . 104,858 92,988 53,060 52,934Operating Expenses:
Selling, general and administrative . . . 74,401 78,917 41,222 36,401Change in fair value of contingent
consideration . . . . . . . . . . . . . . . . . . . (16,400) 700 — —
Total operating expenses . . . . . . . 58,001 79,617 41,222 36,401
Income from operations . . . . . . . . . . . . . . . . 46,857 13,371 11,838 16,533Other income (expense)
Unrealized gain/(loss) on derivativeinstrument . . . . . . . . . . . . . . . . . . . . . . (4,718) (1,233) 3,214 (7,396)
Foreign currency gain/(loss) . . . . . . . . . 1,848 201 (1,530) 362Interest income . . . . . . . . . . . . . . . . . . . 404 225 73 183Interest expense . . . . . . . . . . . . . . . . . . (791) (1,163) (192) (752)
Total other expense . . . . . . . . . . . . (3,257) (1,970) 1,565 (7,603)Income before income taxes . . . . . . . . . . . . 43,600 11,401 13,403 8,930
Income tax expense . . . . . . . . . . . . . . . (10,913) (1,979) (3,981) (2,352)
Net income . . . . . . . . . . . . . . . . . . . . . . . . . . . $ 32,687 $ 9,422 $ 9,422 $ 6,578
Net income attributable to commonstockholders . . . . . . . . . . . . . . . . . . . . . . . . $ 32,660 $ 9,417 $ 9,442 $ 6,567
Per Share Data:
Net income per share attributable tocommon stockholders(1),
Basic . . . . . . . . . . . . . . . . . . . . . . . . . . . . $ 0.56 $ 0.17 $ 0.18 $ 0.11Diluted . . . . . . . . . . . . . . . . . . . . . . . . . . $ 0.56 $ 0.16 $ 0.18 $ 0.11
Weighted-average common sharesoutstanding,
Basic . . . . . . . . . . . . . . . . . . . . . . . . . . . . 58,501,170 56,968,730 53,398,800 58,602,180Diluted . . . . . . . . . . . . . . . . . . . . . . . . . . 58,610,825 57,152,550 53,842,425 58,736,860
(1) See Note 17 to our consolidated financial statements and Note 12 to our condensed consolidatedfinancial statements included elsewhere in this prospectus for an explanation of the method usedto calculate basic and diluted net income per share and the weighted average number of sharesused in the computation of the per share amounts.
36
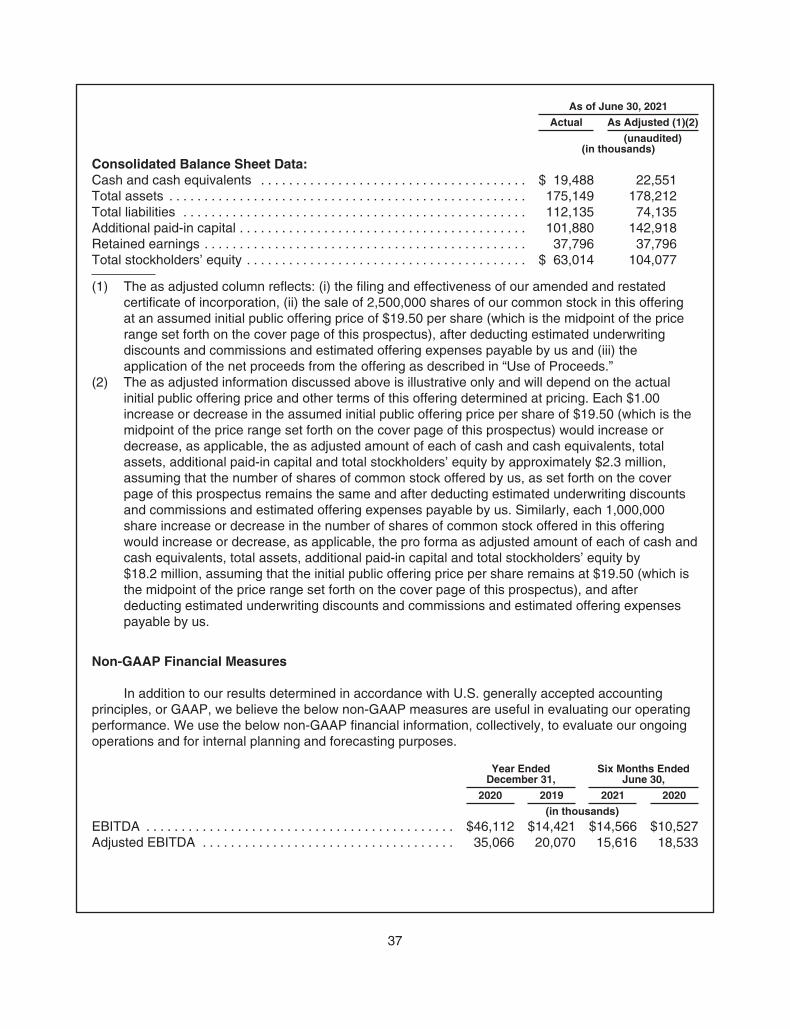
As of June 30, 2021
Actual As Adjusted (1)(2)
(unaudited)(in thousands)
Consolidated Balance Sheet Data:Cash and cash equivalents . . . . . . . . . . . . . . . . . . . . . . . . . . . . . . . . . . . . . . $ 19,488 22,551Total assets . . . . . . . . . . . . . . . . . . . . . . . . . . . . . . . . . . . . . . . . . . . . . . . . . . . 175,149 178,212Total liabilities . . . . . . . . . . . . . . . . . . . . . . . . . . . . . . . . . . . . . . . . . . . . . . . . . 112,135 74,135Additional paid-in capital . . . . . . . . . . . . . . . . . . . . . . . . . . . . . . . . . . . . . . . . . 101,880 142,918Retained earnings . . . . . . . . . . . . . . . . . . . . . . . . . . . . . . . . . . . . . . . . . . . . . . 37,796 37,796Total stockholders’ equity . . . . . . . . . . . . . . . . . . . . . . . . . . . . . . . . . . . . . . . . $ 63,014 104,077
(1) The as adjusted column reflects: (i) the filing and effectiveness of our amended and restatedcertificate of incorporation, (ii) the sale of 2,500,000 shares of our common stock in this offeringat an assumed initial public offering price of $19.50 per share (which is the midpoint of the pricerange set forth on the cover page of this prospectus), after deducting estimated underwritingdiscounts and commissions and estimated offering expenses payable by us and (iii) theapplication of the net proceeds from the offering as described in “Use of Proceeds.”
(2) The as adjusted information discussed above is illustrative only and will depend on the actualinitial public offering price and other terms of this offering determined at pricing. Each $1.00increase or decrease in the assumed initial public offering price per share of $19.50 (which is themidpoint of the price range set forth on the cover page of this prospectus) would increase ordecrease, as applicable, the as adjusted amount of each of cash and cash equivalents, totalassets, additional paid-in capital and total stockholders’ equity by approximately $2.3 million,assuming that the number of shares of common stock offered by us, as set forth on the coverpage of this prospectus remains the same and after deducting estimated underwriting discountsand commissions and estimated offering expenses payable by us. Similarly, each 1,000,000share increase or decrease in the number of shares of common stock offered in this offeringwould increase or decrease, as applicable, the pro forma as adjusted amount of each of cash andcash equivalents, total assets, additional paid-in capital and total stockholders’ equity by$18.2 million, assuming that the initial public offering price per share remains at $19.50 (which isthe midpoint of the price range set forth on the cover page of this prospectus), and afterdeducting estimated underwriting discounts and commissions and estimated offering expensespayable by us.
Non-GAAP Financial Measures
In addition to our results determined in accordance with U.S. generally accepted accountingprinciples, or GAAP, we believe the below non-GAAP measures are useful in evaluating our operatingperformance. We use the below non-GAAP financial information, collectively, to evaluate our ongoingoperations and for internal planning and forecasting purposes.
Year EndedDecember 31,
Six Months EndedJune 30,
2020 2019 2021 2020
(in thousands)
EBITDA . . . . . . . . . . . . . . . . . . . . . . . . . . . . . . . . . . . . . . . . . . . . $46,112 $14,421 $14,566 $10,527Adjusted EBITDA . . . . . . . . . . . . . . . . . . . . . . . . . . . . . . . . . . . . 35,066 20,070 15,616 18,533
37
For additional information and reconciliations of the non-GAAP financial measures to the mostdirectly comparable financial measures stated in accordance with GAAP, see the sections titled“Non-GAAP Financial Measures” and “Management’s Discussion and Analysis of Financial Conditionand Results of Operations—Non-GAAP Financial Measures.”
38

RISK FACTORS
Investing in our common stock involves a high degree of risk. You should carefully consider therisks and uncertainties described below, together with all of the other information in this prospectus,before making a decision to invest in our common stock. If any of the risks actually occur, ourbusiness, results of operations, financial condition, and prospects could be harmed. In that event, thetrading price of our common stock could decline, and you could lose part or all of your investment.Additional risks and uncertainties not presently known to us or that we currently deem immaterial alsomay impair our business operations.
Risks Related to Our Business and Industry
Our future business, financial condition, results of operations and cash flows may be adverselyaffected by reduced or limited availability of coconuts and other raw materials for our products.
Our ability to ensure a continuing supply of high-quality coconuts and other raw materials for ourproducts at competitive prices depends on many factors beyond our control. We rely on a limitednumber of regional manufacturing partners to source and acquire certain of our raw materials andprovide us with finished coconut-based products. Our financial performance depends in large part ontheir ability to arrange for the purchase of raw materials, including coconuts or coconut water, insufficient quantities.
The coconuts from which our products are sourced, and the harvesting and transportation ofthem to our manufacturing partners, are vulnerable to adverse weather conditions and naturaldisasters, such as floods, droughts, earthquakes, hurricanes, typhoons, pestilence and other shortagesand disease, as well as political events and other conditions which can adversely impact quantity andquality, leading to reduced coconut yields and quality, which in turn could reduce the available supplyof, or increase the price of, our raw materials. Our manufacturing partners may have general difficultiesin obtaining raw materials, particularly coconut derived products, due to our high quality standards. Ourcurrent manufacturing partners operate in the Philippines, Sri Lanka, Malaysia, Thailand, Brazil,Indonesia and Vietnam and source coconuts from owned trees and networks of many independentsmall farmers. Thus, the supply of coconuts may be particularly affected by any adverse events inthese countries or regions. Any disruption in the ability of our manufacturing partners to sourcecoconuts from their local suppliers to produce our finished goods would result in lower sales volumesand increased costs, and may have a material adverse effect on our business, financial condition,results of operations and cash flows if the necessary supply cannot be replaced in a timely manner orat all.
In addition, we also compete with other food and beverage companies in the procurement ofcoconut materials and other raw materials, and this competition may increase in the future if consumerdemand increases for these materials or products containing such materials, and if new or existingcompetitors increasingly offer products in these market sectors. If supplies of coconut materials andother raw materials that meet our quality standards are reduced or are in greater demand, this couldcause our expenses to increase and we or our manufacturing partners may not be able to obtainsufficient supply to meet our needs on favorable terms, or at all.
Our manufacturing partners and their ability to source coconut materials and other raw materialsmay also be affected by any changes among farmers in our sourcing countries as to what they chooseto grow and harvest, changes in global economic conditions or climate, and our or their ability toforecast or to commit to our raw materials requirements. Many of these farmers also have alternativeincome opportunities and the relative financial performance of growing coconuts or other raw materialsas compared to other potentially more profitable opportunities could affect their interest in working with
39

us or our manufacturing partners. Any of these factors could impact our ability to supply our products tocustomers and consumers and may adversely affect our business, financial condition, results ofoperations and cash flows.
We are dependent on our third party manufacturing and co-packing partners, and if we fail tomaintain our relationship with such third party partners, or such third parties are unable tofulfill their obligations, our business could be harmed.
We do not manufacture our products directly but instead outsource the manufacturing andproduction to our manufacturing and co-packing partners whom we rely on to provide us with qualityproducts in substantial quantities and on a timely basis. Our success is dependent upon our ability tomaintain our relationships with existing manufacturers and co-packers, and enter into newmanufacturing arrangements in the future. We have agreements with our existing manufacturers, manyof which are terminable under certain conditions, including in some cases without cause. If ourmanufacturers and co-packers become unable to provide, deprioritize production of, or experiencedelays in providing, our products, or if the agreements we have in place are terminated, our ability toobtain a sufficient selection or volume of merchandise at acceptable prices and on a timely basis couldsuffer. Additionally, if we do not use capacity that we are contracted for or that is otherwise available tous, our suppliers may choose to supply competitors or to compete more aggressively in private labelsupply, either of which could have an adverse effect on our business. Our ability to maintain effectiverelationships with our manufacturing partners for the sourcing of raw materials from local suppliers, andthe manufacture and production of our products by such manufacturing partners and as well as ourco-packing partners is important to the success of our operations within each market and globally.
If we need to replace an existing manufacturing partner due to bankruptcy or insolvency, lack ofadequate supply, failure to comply with our product specifications, performance against our contractsand our demands, disagreements or any other reason, there can be no assurance that we will findalternative manufacturing partners with access to adequate supplies of raw materials when required onacceptable terms or at all, or that a new manufacturing partner would allocate sufficient capacity to usin order to meet our requirements or fill our orders in a timely manner. Finding a new manufacturingpartner may take a significant amount of time and resources, and once we have identified such newmanufacturing partner, we would have to ensure that they meet our standards for quality control andhave the necessary capabilities, responsiveness, high-quality service and financial stability, amongother things, as well as have satisfactory labor, sustainability and ethical practices that align with ourvalues and mission. We may need to assist that manufacturing partner in purchasing and installingpackaging and processing capability which may further delay and increase the financial costs ofincluding them in our supply network and increase the financial risk of that relationship. Although we donot rely on our co-packing partners for the sourcing of raw materials, we face similar risks related to theoperations and quality of services provided by such partners. If we are unable to manage our supplychain effectively and ensure that our products are available to meet consumer demand, our salesmight decrease, and our business, financial condition, results of operations and cash flows may bematerially adversely affected.
We have in the past sought, and from time to time in the future may seek to amend the terms ofour agreements to secure additional capacity or address urgent supply needs, and we cannotguarantee that we will be able to maintain or achieve satisfactory economic terms with our existingpartners. In addition, our manufacturing and co-packing partners may not have the capacity to supplyus with sufficient merchandise to keep pace with our growth plans, especially if we need significantlygreater amounts of production capacity on short notice. In such cases, our ability to pursue our growthstrategy will depend in part upon our ability to develop new supplier and manufacturing relationshipsand onboard them in a timely manner to meet our expected demand.
40

Additionally, a natural disaster, fire, power interruption, work stoppage, labor matters (includingillness or absenteeism in workforce) or other calamity at the facilities of our manufacturing andco-packing partners and any combination thereof would significantly disrupt our ability to deliver ourproducts and operate our business. In the future, we expect that these partners may experience plantshutdowns or periods of reduced production because of regulatory issues, equipment failure, loss ofcertifications, employee-related incidents that result in harm or death, delays in raw material deliveriesor as a result of the COVID-19 pandemic or related response measures or other similar naturalemergencies. Any such disruption or unanticipated event may cause significant interruptions or delaysin our business and the reduction or loss of inventory may render us unable to fulfill customer orders ina timely manner, or at all, which could materially adversely affect our business, financial condition,results of operations and cash flows. Within the last 15 months, two of our manufacturing partnershave experienced government mandated COVID-related temporary closures of their facilities. The firstfacility shutdown occurred in April 2020 in Sri Lanka and lasted for one week before the operatorreceived permission to again commence production. The second facility shutdown began in June 2021in Thailand and lasted for one month before the operator received permission to recommenceproduction in July 2021. There can be no assurance that there will not be additional closures or delaysin the future as a result of the COVID-19 pandemic.
We are dependent on our existing suppliers for materials used to package our products, thecosts of which may be volatile and may rise significantly.
In addition to purchasing coconut materials and other ingredients, we negotiate the terms andspecifications for the purchase of significant quantities of packaging materials and pallets by ourmanufacturers and co-packing partners from third parties. The majority of our products are producedand packaged with materials sourced from a single supplier, Tetra Pak. While we believe that we maybe able to establish alternative supply relationships for some of these materials, we may be unable todo so in the short term, or at all, at prices or quality levels that are acceptable to us. Further, any suchalternative supplier arrangements may lead to increased costs or delays.
Volatility in the prices of our packaging materials and other supplies that we or our manufacturingpartners purchase, could increase our cost of sales and reduce our profitability. Moreover, we may notbe able to implement price increases for our products to cover any increased costs, and any priceincreases we do implement may result in lower sales volumes or lost relationships. If we are notsuccessful in managing our packaging costs, or if we are unable to increase our prices to coverincreased costs or if such price increases reduce our sales volumes, then such increases in costs willadversely affect our business, financial condition, results of operations and cash flows.
Further, changes in business conditions, pandemics, governmental regulations and other factorsbeyond our control or that we do not presently anticipate could affect our manufacturing andco-packing partners’ ability to receive components from our existing or future suppliers of suchmaterials or the availability of such components generally. The unavailability of any components for oursuppliers could result in production delays and idle manufacturing facilities which may increase ourcost of operations and render us unable to fulfill customer orders in a timely manner.
If we encounter problems with our supply chain, our costs may increase and our or ourcustomers’ ability to deliver our products to market could be adversely affected.
We do not own warehouses or fulfillment centers, but rather outsource to independentwarehousing and fulfillment service providers in the United States, United Kingdom, France and fromtime to time other countries, to receive, store, stage, repack, fulfill and load our products for shipment.We also source shipping containers and capacity from major shipping lines and brokers, and sourcethird-party transportation providers for land-based transportation based on market conditions.
41

Our shipping partners transport our products from the country of origin or from our domesticco-packing partners, which are then received by, and subsequently distributed from the third partywarehousing and fulfillment service providers to our distributors and retail-direct customers. Wedepend in large part on the orderly operation of this receiving and distribution process, which depends,in turn, on timely arrival of product from ports or co-packers, availability of outbound and inboundshipping, and effective operations at the warehouses/distribution centers and the ports through whichour product flows. Any increase in transportation costs (including increases in fuel costs), increasedshipping costs, issues with overseas shipments or port or supplier-side delays, reductions in thetransportation capacity of carriers, labor strikes or shortages in the transportation industry, disruptionsto the national and international transportation infrastructure and unexpected delivery interruptions ordelays may increase the cost of, and adversely impact, our logistics, and our ability to provide qualityand timely service to our distributor or retail-direct customers.
In addition, if we change the warehouse, fulfillment, shipping or transportation companies we use,we could face logistical difficulties that could adversely affect deliveries and we could incur costs andexpend resources in connection with such change. We also may not be able to obtain terms asfavorable as those received from the third-party warehouse, fulfilment, shipping and transportationproviders we currently use, which could increase our costs. We also may not adequately anticipatechanging demands on our distribution system, including the effect of any expansion we may need toimplement in the capacity, the number or the location of our warehouses/fulfillment centers to meetincreased complexity or demand. Any of these factors could cause interruptions and delays in deliveryand result in increased costs.
In addition, events beyond our control, such as disruptions in operations due to natural orman-made disasters, inclement weather conditions, accidents, system failures, power outages, politicalinstability, physical or cyber break-ins, server failure, work stoppages, slowdowns or strikes byemployees, acts of terrorism, the outbreak of viruses, widespread illness, infectious diseases,contagions and the occurrence of unforeseen epidemics (including the outbreak of the COVID-19pandemic and its potential impact on supply chain and our financial results) and other unforeseen orcatastrophic events, could damage the facilities of our warehousing and fulfillment service providers orrender them inoperable, or effect the flow of product to and from these centers, or impact our ability tomanage our partners, making it difficult or impossible for us to process customer or consumer ordersfor an extended period of time. We could also incur significantly higher costs and longer lead timesassociated with distributing inventory during the time it takes for our third party providers to reopen,replace or bring the capacity back to normal levels for their warehouses/fulfilment centers and logisticscapabilities after a disruption.
The inability to fulfill, or any delays in processing, customer or consumer orders from thewarehousing/fulfillment centers of our providers or any quality issues could result in the loss ofconsumers, retail partners or distributors, or the issuances of penalties, refunds or credits, and mayalso adversely affect our reputation. The success of our retail or distribution partners depends on theirtimely receipt of products for sale and any repeated, intermittent or long-term disruption in, or failuresof, the operations of the warehouses/fulfilment centers of our partners could result in lower sales andprofitability, a loss of loyalty to our products and excess inventory. The insurance we maintain forbusiness interruption may not cover all risk, or be sufficient to cover all of our potential losses, and maynot continue to be available to us on acceptable terms, if at all, and any insurance proceeds may notbe paid to us in a timely manner. Additionally, we will need to continue to update and expand oursystems to manage these warehouse/fulfilment centers and related systems to support our businessgrowth and increasing complexity, which may require significant amounts of capital and maintenanceand creates others risks, including those related to cyber security and system availability, as discussedin “Risks Related to Our Information Technology and Intellectual Property.”
42
In addition, in recent years volatility in the global oil markets has resulted in higher fuel prices,which many shipping companies have passed on to their customers by way of higher base pricing andincreased fuel surcharges. Shortages of capacity in shipping have occurred due to economic, weatherand pandemic effects, that have affected the smooth flow of our supply chain and increasedtransportation costs and decreased reliability. In particular, the increase in demand for shippingservices during the COVID-19 pandemic has significantly increased shipping costs and limitedcontainer availability delayed shipment of product. If fuel prices or transportation costs increase, we willexperience higher shipping rates and fuel surcharges, as well as surcharges on our raw materials andpackaging. It is hard to predict if current rates and capacity will continue in the future and what long-term rates could be. A significant part of our business relies on shipping prepackaged coconut waterfrom sourcing countries to our countries of sale so we are very dependent on shipping container pricesand service levels. Due to the price sensitivity of our products, we may not be able to pass suchincreases on to our customers.
We are dependent on distributor and retail customers for most of our sales, and our failure tomaintain or further develop our sales channels could harm our business, financial condition,results of operations and cash flows.
We derive a significant portion of our revenue from our network of domestic and internationaldistributors and retail customers (whether serviced directly or through distributors), including clubstores, major mass merchandisers, online marketplaces such as Amazon, drug store chains,supermarkets, independent pharmacies, health food stores, and other retailers. In addition, our largestdistributor customer, KDP, and the largest retail-direct customer, Costco, of our products accounted forapproximately 19% and 35%, respectively, of our total net sales for the year ended December 31, 2020and approximately 22% and 32%, respectively, of our total net sales for the six months ended June 30,2021. No other retailer direct or distributor represented more than 10% of our total net sales in 2020 orthe first half of 2021.
A decision by either of our largest retail customer or distributor, or any other major distributor orretail customer, whether motivated by marketing strategy, competitive conditions, financial difficulties orotherwise, to decrease significantly the quantity or breadth of product purchased from us, or to changetheir manner of doing business with us and their support of our products, could substantially reduce ourrevenue and have a material adverse effect on our business, financial condition, results of operationsand cash flows. In addition, any store closings or changes in retail strategy by our retail customers,particularly our largest retail customer, could shrink the number of stores carrying our products, whilethe remaining stores may purchase a smaller amount of our products and/or may reduce the retail floorspace designated for our products. If any negative change in our relationship with our largestdistributor and retail customer occurs, any other disputes with key customers arose, if we were to loseplacement and support of any of our key customers or if any of our key customers consolidate and/orgain greater market power, our business, financial condition, results of operations and cash flowswould be materially adversely affected. In addition, we may be similarly adversely impacted if any ofour key customers, particularly our largest distributor and retail customer, experience any operationaldifficulties or generate less traffic.
Although we aim to enter into long-term agreements with distributors, and historically haverenewed, amended or extended them as needed, we cannot guarantee that we will be able to maintainor extend these contractual relationships in the future or that we will be able to do so on attractiveterms. If any agreement with a key distributor, including KDP, is terminated or if the performance ofsuch distributor deteriorated, we cannot guarantee that we will be able to find suitable replacementpartners on favorable terms, or at all. We enter into pricing support and promotional arrangements withour distributors to encourage execution and pricing activity on our brands, and in some cases offerinvasion fees when product is shipped directly to a specific retailer in their geographic market.
43

There is no guarantee that these arrangements will be effective, or that disputes will not arise as to thesharing of the costs of such activity, which could impact our relationship with the distributors or imposeadditional costs on us.
We generally do not have long-term contracts or minimum purchase volumes with our retail-directcustomers beyond promotional price arrangements, except in cases related to private label supply, andthe duration of these relationships and terms are subject to change and adjustment based on theperformance of the products and our performance as a supplier of these products. For example,pursuant to the terms of the agreement with our largest retail-direct customer, following the initial termeither party is permitted to terminate the agreement without cause with prior notice, and the agreementis non-exclusive and does not impose any minimum purchase or supply requirements. We seek tomaintain the relationships with these customers’ private label brands and be their supplier of choice,but we cannot guarantee that we will maintain our share of this business, nor that the economic termswe will negotiate with such customers in the future will be favorable to us. The loss of any part of a keycustomer’s private label business may negatively impact that customer’s support of our brandedproducts, and could have a material adverse effect on our business, financial condition, results ofoperations and cash flows.
We rely on our retailer partners’ continuing demand for our products whether supplied directly orsupported through distributors. In addition, certain of our retail partners, particularly those located in theUnited States, may from time to time change their promotional approaches. Such changes couldnegatively impact our business. If our retail partners change their pricing and margin expectations,change their business strategies as a result of industry consolidation or otherwise, maintain and seekto grow their own private-label competitive offerings whether supplied by us or other suppliers, reducethe number of brands they carry or amount of shelf space they allocate to our products, or allocategreater shelf space to, or increase their advertising or promotional efforts for, our competitors’products, our sales could decrease and our business, financial conditions, results of operations andcash flows may be materially adversely affected.
Certain of our distributors or retail-direct customers may from time to time experience financialdifficulties, including bankruptcy or insolvency. If our customers suffer significant financial oroperational difficulty, they may reduce their orders from us or stop purchasing from us and/or beunable to pay the amounts due to us timely or at all, which could have a material adverse effect on ourability to collect on receivables, our revenues and our results of operations. It is possible thatcustomers may contest their contractual obligations to us, whether under bankruptcy laws or otherwise.Further, we may have to negotiate significant discounts and/or extended financing terms with thesecustomers in such a situation. If we are unable to collect upon our accounts receivable as they comedue in an efficient and timely manner, our business, financial condition, results of operations and cashflows may be materially adversely affected. In addition, product sales are dependent in part on high-quality merchandising and an appealing retail environment to attract consumers, which requirescontinuing investments by retailers and ongoing support by distributors. Retailers or distributors thatexperience financial difficulties may fail to make such investments or delay them, resulting in lowersales and orders for our products. Consolidations among our customers would concentrate our creditrisk and, if any of these retailers or distributors were to experience a shortage of liquidity or consumerbehavior shifts away from their retail model or their service area, it would increase the risk that theiroutstanding payables to us may not be paid. In addition, increasing market share concentration amongone or a few retailers in a particular region increases the risk that if any one of them substantiallyreduces their purchases of or support for our products, we may be unable to find a sufficient number ofother retail outlets for our products to sustain the same level of sales and revenue whether sold directlyto retailers or through distributors.
44
Our cash flows and results of operations may be negatively affected if we are not successful inforecasting and managing our inventory at appropriate levels for our demand.
Efficient inventory management is a key component of our success and profitability. To besuccessful, we must maintain sufficient inventory levels to meet our customers’ demands withoutallowing those levels to increase to such an extent that the costs of holding the products unduly impactour financial results or create obsolete inventory.
Our independent distributors and retail-direct customers are generally not required to placeminimum monthly orders for our products beyond meeting a minimum delivery quantity for shipping.While we expect distributors to maintain on average two to four weeks of inventory to support theirbusinesses and to cover any supply or service issues, there is no guarantee that they will do so andthe appropriate inventory level for our customers varies seasonally. Distributors and retail-directcustomers typically order products from us on a monthly basis, or with approximately one or two weekslead time, in quantities and at such times based on their expected demand for the products in aparticular distribution area. Accordingly, we cannot predict the timing or quantity of purchases by ourdistributors and direct retail customers or whether any of these customers will continue to purchaseproducts from us with the same frequency and at volumes consistent with their past practice or tomaintain historic inventory levels. Additionally, our larger distributors and retail-direct customers maymake orders that are larger than we can fill in the requested timeframe, and such orders may roll intoanother period or be cancelled. For example, certain of our retailers may offer promotions includingrebates and temporary price discounts on our products and we do not have control over the timing orfrequency of these promotional activities. If we underestimate future demand for a particular product ordo not respond quickly enough to replenish our best-performing products or do not forecast mixchanges, or otherwise fail to adjust to fill customer orders, we may have a shortfall in inventory of suchproducts, likely leading to unfulfilled orders and inventory shortages at our customers. Shortages indistributor inventory levels may result in poor service to retailers and lost retail sales, in turn negativelyimpacting our sales to distributor customers and harming our relationship. Shortages in inventory levelsat our retail-direct customers may result in our products being out of stock on their retail shelvesresulting in customer dissatisfaction and reduced revenue and damaging our relationship with ourretail-direct customers.
Our products have a limited shelf life, as it is normal for certain nutrition products and otheringredients to degrade over time, and our inventory may reach its expiration date and not be sold. Wemay decide to discontinue a product, and/or any new products we introduce may not gain marketacceptance, which may result in returns by customers and excess inventory. In such cases, we mayhave to record write-downs, which may be significant. In addition, if we do not accurately predictcustomer trends or spending levels or if we inappropriately price products, we may have to takeunanticipated markdowns and discounts to dispose of obsolete, aged or excess inventory or recordwrite-downs relating to the value of obsolete, aged or excess inventory.
Maintaining adequate inventory requires significant attention to and monitoring of market trends,local market demands, performance of our raw material suppliers and manufacturers and performanceof our logistics suppliers and distributors, and it is not certain that we will be effective in collection ofdata and monitoring to enable efficient inventory management. Although we seek to forecast and planour product needs sufficiently in advance of anticipated requirements to facilitate reserving productiontime at our manufacturing and co-packing partners, and arranging for the availability and supply ofpackaging and ingredient materials, our product takes many weeks to arrive at our warehouses fromour manufacturing partners, which reduces our flexibility to react to short term or unexpected consumerdemand changes and can require planning as much as six months in advance to coordinate allmaterials for production. In addition, our inventory could be damaged or destroyed, particularly in theevent of any casualty or disruption to our warehouses/fulfilment centers or losses during ocean freight
45

transit or outbound shipping. As we expand our operations, it may be more difficult to effectivelymanage our inventory as the complexity increases. In any cases where consumers might not haveaccess to our products, our reputation and brands could be harmed, and consumers may be less likelyto recommend our products in the future. In any cases where retailers or distributors might not haveaccess to our products, our relationship with these customers could be harmed. If we are notsuccessful in managing our inventory balances, it could have a material adverse effect on ourbusiness, financial conditions, results of operations and cash flows.
Our brands and reputation may be diminished due to real or perceived quality or food safetyissues with our products, which could have an adverse effect on our business, reputation,financial condition and results of operations.
We believe our consumers, retailers and distributors rely on us to provide them with high-qualityproducts. Therefore, any real or perceived quality or food safety concerns or failures to comply withapplicable food regulations and requirements, whether or not ultimately based on fact and whether ornot involving us (such as incidents involving our competitors), could cause negative publicity andreduced confidence in our company, brands or products, which could in turn harm our reputation andsales, and could materially adversely affect our business, financial condition, results of operations andcash flows. Although we believe we and our manufacturing and co-packing partners on which we relyhave rigorous quality control processes in place, there can be no assurance that our products willalways comply with the standards set for our products or that our manufacturing and co-packingpartners will comply with our product specifications. For example, although we strive to keep ourproducts free of pathogenic organisms, they may not be easily detected and cross-contamination canoccur. There is no assurance that this health risk will always be preempted by such quality controlprocesses, or that the root cause may occur after the product leaves our control. In addition, coconutwater is naturally occurring and varies in taste by growing area and season. While we attempt toachieve a reasonably consistent taste across all our supply network with each product, there is noguarantee that we will be able to do so, which may result in customer dissatisfaction or complaintsabout lack of consistency across our product batches.
Additionally, damage, contamination or quality impairments may occur after our products leaveour control. Damage to packaging materials may occur during product transport and storage resultingin product spoilage or contamination, which may be impossible to detect until opened and tasted by theconsumer. Further, we have no control over our products once purchased by consumers. Accordingly,consumers may store our products improperly or for long periods of time or open and reseal them,which may adversely affect the quality and safety of our products. While we have procedures in placeto handle consumer questions and complaints, that our responses may not be satisfactory toconsumers, retailers or distributors, which could harm our reputation and could result in retailers ordistributors holding our product from sale. If consumers, retailers or distributors do not perceive ourproducts to be safe or of high quality as a result of such actions or events outside our control or if theybelieve that we did not respond to a complaint in a satisfactory manner, then the value of our brandswould be diminished, and our reputation, business, financial condition, results of operations and cashflows would be adversely affected.
Any loss of confidence on the part of consumers, retailers or distributors in the ingredients used inour products or in the safety and quality of our products would be difficult and costly to overcome. Anysuch adverse effect could be exacerbated by our position in the market as a purveyor of high-qualityproducts and may significantly reduce our brand value and damage relationships with retail anddistributor customers. Issues regarding the safety of any of our products, regardless of the cause, mayadversely affect our business, financial condition, results of operations and cash flows.
46

If we cannot maintain our company culture or focus on our mission as we grow, our successand our business and competitive position may be harmed.
We believe our culture and our mission have been key contributors to our success to date. Anyfailure to preserve our culture or focus on our mission could negatively affect our ability to retain andrecruit personnel, which is critical to our growth, and to effectively focus on and pursue our corporateobjectives. As we grow, and particularly as we develop the infrastructure of a public company, we mayfind it difficult to maintain these important values.
Our culture and values are reinforced by the leadership and behaviors of our co-founder,Michael Kirban, and executive team, and any failure of these individuals to meet these expectationscould cause reputational risk and damage to the company culture and values in the eyes ofemployees, customers and suppliers. If we fail to maintain our company culture or focus on ourpurpose, our business and competitive position when attracting employees may be harmed, and wemay face reputational risk both at the company level and at the brand level, which might impact ourdistributors’, retailers’ and suppliers’ willingness to work with us and support our business.
Failure to retain our senior management and key personnel may adversely affect our operationsor our ability to grow successfully.
Our success is substantially dependent on the continued service of certain members of our seniormanagement and other key employees. These employees have been primarily responsible fordetermining the strategic direction of our business and for executing our growth strategy and areintegral to our brands, culture and the reputation we enjoy with suppliers, manufacturers, distributors,customers and consumers. In particular, we are dependent on our co-founder, Michael Kirban, forleadership, culture, strategy, key customer and supplier relationships and other skills and capabilities.The loss of the services of the co-founder, any of these executives and key personnel could have amaterial adverse effect on our business and prospects, as we may not be able to find suitableindividuals to replace them on a timely basis, if at all. In addition, any such departure could be viewedin a negative light by investors and analysts, which may cause the price of our common stock todecline. We do not currently carry key-person life insurance for our co-founder or senior executives.
Competition in the food and beverage retail industry is strong and presents an ongoing threatto the success of our business.
We operate in a highly competitive market, which includes large multinational companies as wellas many smaller entrepreneurial companies seeking to innovate and disrupt the categories in which wecompete. As a category, coconut water competes for space with a wide range of beverage offerings. Inparticular, coconut water competes with functional refreshment, energy drinks, ready to drink teas andcoffees and other non-100% coconut water based beverages, and many of these products aremarketed by companies with substantially greater financial resources than ours. We also compete witha number of natural, organic, and functional food and beverage producers. We and these competingbrands and products compete for limited retail, and foodservice customers and consumers. In ourmarket, competition is based on, among other things, brand equity and consumer relationships,consumer needs, product experience (including taste, functionality and texture), nutritional profile anddietary attributes, sustainability of our supply chain (including raw materials), quality and type ofingredients, distribution and product availability, retail and foodservice and e-commerce customerrelationships, marketing investment and effectiveness, pricing pressure and competitiveness andproduct packaging.
We continuously compete for retail customers (including grocery stores, supermarkets, club,convenience and health stores, gyms and others), foodservice customers (including coffee shops,
47

cafes, restaurants and fast food) and e-commerce (both direct-to-consumer and through third-partyplatforms) customers. Consumers tend to focus on price as one of the key drivers behind theirpurchase of food and beverages, and consumers will only pay a premium price for a product that theybelieve is of premium quality and value. In order for us to not only maintain our market position as apremium quality brand, but also to continue to grow and acquire more consumers we must continue toprovide delicious and high-quality products at acceptable price premiums.
Conventional food or beverage companies, which are generally multinational corporations withsubstantially greater resources and operations than us, may acquire our competitors or launch theirown coconut water products or other products that compete with our own. Such competitors may beable to use their resources and scale to respond to competitive pressures and changes in consumerpreferences by introducing new products, reducing prices or increasing promotional activities, amongother things. These large competitors may decide not to compete in coconut water but rather to usetheir retail relationships and category insights to reduce retailer excitement for the category, impactingour visibility and shelf space. We invest in category insights to offset these potential viewpoints andexcite retailers and distributors for the future of our categories, but there is no guarantee that ourefforts will be successful.
Retailers also market competitive products under their own private labels, which are generallysold at lower prices and compete with some of our products, and source these products from a rangeof suppliers under competitive bidding relationships. While we seek to enter into strategic partnershipswith retailers to capitalize on private label supply opportunities, we cannot guarantee that we will beawarded this private label business in future years or that the business will be profitable. If the qualityof competing private label or branded products were to be compromised, that could affect theconsumer perceptions of coconut water more generally which could impact our business. Additionally,some of our distributor partners carry competing products or in some cases also are brand owners ofbeverage products that might compete with us, and while we believe our products are worthy of theirsupport, there is no guarantee that their support will continue for all of our brands or at the same levelsas today.
Competitive pressures or other factors could cause us to lose market share and lead to reducedspace allocated to our products, which may require us to lower prices, increase marketing andadvertising expenditures, or increase the use of discounting or promotional campaigns, each of whichcould adversely affect our margins and could adversely affect our business, financial condition, resultsof operations and cash flows. Many of our current and potential competitors in beverages have longeroperating histories, greater brand recognition, better access to distribution capabilities, larger fulfillmentinfrastructures, greater technical capabilities, significantly greater financial, marketing and otherresources and maintain deeper customer relationships with key retailers due to their extensive brandportfolios than we do. These factors may allow our competitors to derive greater net sales and profitsfrom their existing customer base, acquire customers at lower costs or respond more quickly than wecan to new or emerging technologies and changes in consumer preferences or habits. Thesecompetitors may engage in more extensive research and development efforts, undertake morefar-reaching marketing campaigns and adopt more aggressive pricing policies (including predatorypricing policies and the provision of substantial discounts), which may allow them to build largercustomer bases or generate net sales from those customer bases more effectively than we can.
We expect competition in the natural, organic, and functional food and beverage industry tocontinue to increase. We believe that our ability to compete successfully in this market depends uponmany factors both within and beyond our control. If we fail to compete successfully in this market, ourbusiness, financial condition, results of operations and cash flows would be materially and adverselyaffected.
48

Sales of our coconut water products constitute a significant portion of our revenue, and areduction in demand for and sales of our coconut water products or a decrease in consumerdemand for coconut water generally would have an adverse effect on our financial condition.
Our coconut water accounted for approximately 85% and 84% of our revenue in the years endedDecember 31, 2019 and 2020, respectively, and approximately 82% and 88% of our revenue in the sixmonths ended June 30, 2020 and 2021, respectively. We believe that sales of our coconut water willcontinue to constitute a significant portion of our revenue, income and cash flow for the foreseeablefuture. Any material negative change to consumer demand for our products or coconut water generallycould materially and adversely affect our business, financial condition, results of operations and cashflows. We are also subject to the risk of overly relying upon a few large customers (whether serviceddirectly or through distributors) in a particular market due to the concentration that exists in retailownership in our key markets. We cannot be certain that consumer and retail customer demand for ourother existing and future products will expand to reduce this reliance on coconut water and allow suchproducts to represent a larger percentage of our revenue than they do currently. Accordingly, anyfactor adversely affecting demand or sales of our coconut water or coconut water generally could havea material adverse effect on our business, financial condition, results of operations and cash flows.
If we fail to develop and maintain our brands and company image, our business could suffer.
We have developed strong and trusted brands, including our leading Vita Coco brand, that webelieve have contributed significantly to the success of our business, and we believe our continuedsuccess depends on our ability to maintain and grow the value of the Vita Coco and other brandsMaintaining, promoting and positioning our brands and reputation will depend on, among other factors,the success of our product offerings, food safety, quality assurance, marketing and merchandisingefforts, the reliability and reputation of our supply chain, our ability to grow and capture share of thecoconut water category, and our ability to provide a consistent, high-quality consumer experience. Anynegative publicity, regardless of its accuracy, could materially adversely affect our business. Forexample, as part of the licensing strategy of our brands, we enter into licensing agreements under whichwe grant our licensing partners certain rights to use our trademarks and other designs. Although ouragreements require that the use of our trademarks and designs is subject to our control and approval,any breach of these provisions, or any other action by any of our licensing partners that is harmful to ourbrands, goodwill and overall image, could have a material adverse impact on our business.
The growing use of social and digital media by us, our consumers and third parties increases thespeed and extent that information or misinformation and opinions can be shared. Negative publicityabout us, our brands or our products on social or digital media could seriously damage our brands andreputation. For example, consumer perception could be influenced by negative media attentionregarding any consumer complaints about our products, our management team, ownership structure,sourcing practices and supply chain partners, employment practices, ability to execute against ourmission and values, and our products or brands, such as any advertising campaigns or mediaallegations that challenge the nutritional content or sustainability of our products and our supply chain,or that challenge our marketing efforts regarding the quality of our products, and any negative publicityregarding the plant-based food industry or coconuts as a whole could have an adverse effect on ourbusiness, brands and reputation. Similar factors or events could impact the success of any brands orproducts we introduce in the future.
Our company image and brands are very important to our vision and growth strategies,particularly our focus on being a “good company” and operating consistent with our mission andvalues. We will need to continue to invest in actions that support our mission and values and adjust ourofferings to appeal to a broader audience in the future in order to sustain our business and to achievegrowth, and there can be no assurance that we will be able to do so. If we do not maintain the
49
favorable perception of our company and our brands, our sales and results of operations could benegatively impacted. Our brands and company image is based on perceptions of subjective qualities,and any incident that erodes the loyalty of our consumers, customers, suppliers or manufacturers,including adverse publicity or a governmental investigation or litigation, could significantly reduce thevalue of our brands and significantly damage our business, which would have a material adverse effecton our business, financial condition, results of operations and cash flows.
We must expend resources to maintain consumer awareness of our brands, build brand loyaltyand generate interest in our products from existing and new consumers. Our marketingstrategies and channels will evolve and our programs may or may not be successful.
To remain competitive, acquire and keep consumers and customers, and expand and keep shelfplacement for our products, we may need to increase our marketing and advertising spending and oursales team capabilities, to maintain and increase consumer awareness, protect and grow our existingmarket share or promote new products. Substantial sales force investments and advertising andpromotional expenditures may be required to maintain or improve our brands’ market position or tointroduce new products to the market. Participants in our industry are increasingly engaging inconsumer outreach through social media and web-based channels, and direct to consumer deliveryand subscription models, which may prove successful in competing with incumbent brands and requireus to increase investment and add capability to respond. There is no guarantee that our efforts will besuccessful, and any increase in our sales, marketing and advertising efforts, including through socialmedia or otherwise, may not maintain our current reputation, or lead to increased brand awarenessand sales, and may have unanticipated negative impacts on our brand. In addition, we consistentlyevaluate our product lines to determine whether to discontinue certain products. Discontinuing productlines may increase our profitability long-term, but could reduce our sales short term and hurt ourcompany image and brand, and a reduction in sales of certain products could cause a reduction insales of other products. The discontinuation of product lines may have an adverse effect on ourbusiness, financial condition, results of operations and cash flows.
Failure to introduce new products or successfully improve existing products may adverselyaffect our ability to continue to grow and may cause us to lose market share and sales.
A key element of our growth strategy depends on our ability to develop and market new products,product extensions and improvements to our existing products that meet our standards for quality andappeal to consumer preferences. The success of our innovation and product development efforts isaffected by our ability to anticipate changes in consumer preferences, the technical capability of ourinnovation staff in developing and testing product prototypes to meet these consumer needs whilecomplying with applicable governmental regulations, the ability to obtain patents and other intellectualproperty rights and protections for commercializing such innovations and developments, the ability ofour supply chain and production systems to provide adequate solutions and capacity for new products,and the success of our management and sales and marketing teams in designing, branding andpackaging and introducing and marketing new products. Failure to develop and market new productsthat appeal to consumers may lead to a decrease in our growth, sales and profitability. There is noguarantee that each innovation we launch will reach our goals and be successful, and many willrequire iteration and development to have a chance of success.
Additionally, the development and introduction of new products requires research, developmentand marketing expenditures, which we may be unable to recoup if the new products do not gainwidespread market acceptance. Our competitors also may create or obtain similar formulations firstthat may hinder our ability to develop new products or enter new categories, which could have amaterial adverse effect on our growth. If we experience difficulty in partnering with co-packers ormanufacturers to produce our new products, it may affect our ability to develop and launch new
50

products and enter new product categories, and scale up supply if successful. Further, if we fail toensure the efficiency and quality of new production processes and products before they launch, wemay experience uneven product quality and supply, which could negatively impact consumeracceptance of new products and negatively impact our sales and brand reputation. If we areunsuccessful in meeting our objectives with respect to new or improved products, our business,financial condition, results of operations and cash flow may be adversely affected.
Consumer preferences for our products are difficult to predict and may change, and, if we areunable to respond quickly to new trends, our business may be adversely affected.
Our business is primarily focused on the development, manufacturing, marketing and distributionof coconut water branded and private label products and other “better-for-you” beverages. Consumerdemand for our products and interest in our offerings could change based on a number of possiblefactors, including changes in dietary habits, refreshment and nutritional habits, concerns regarding thehealth effects of ingredients, the usage of single use packaging, the impact of our supply chain on oursourcing communities, shifts in preference for various product attributes or consumer confidence andperceived value for our products relative to alternatives. Consumer trends that we believe favor salesof our products could change based on a number of possible factors. While we continually strive toimprove our products through thoughtful, innovative research and development approaches to meetconsumer needs, there can be no assurance that our efforts will be successful. If consumer demandfor our products decreased, our business, financial condition, results of operations and cash flows maybe adversely affected.
In addition, sales of consumer products are subject to evolving consumer preferences that wemay not be able to accurately predict or respond to, and we may not be successful in identifying trendsin consumer preferences and developing products that respond to such trends in a timely manner. Asignificant shift in consumer demand away from our products could reduce our sales or our marketshare and the prestige of our brands, which would harm our business, financial condition, results ofoperations and cash flows.
Pandemics, epidemics or disease outbreaks, such as the COVID-19 pandemic, may disrupt ourbusiness, including, among other things, consumption and trade patterns, our supply chainand production processes, each of which could materially affect our operations, liquidity,financial condition and results of operations.
The actual or perceived effects of a disease outbreak, epidemic, pandemic or similar widespreadpublic health concern, such as the COVID-19 pandemic, could negatively affect our business, liquidity,financial condition and results of operations. The global spread and unprecedented impact of theongoing COVID-19 pandemic continues to create significant volatility, uncertainty and economicdisruption. The pandemic has led governments and other authorities around the world to implementsignificant measures intended to control the spread of the virus, including shelter-in-place orders,social distancing measures, business closures or restrictions on operations, quarantines, travel bansand restrictions and multi-step policies with the goal of re-opening these markets. While some of theserestrictions have been lifted or eased in many jurisdictions as the rates of COVID-19 infections havedecreased or stabilized, a resurgence of the pandemic in some markets could slow, halt or reverse thereopening process altogether. If COVID-19 infection rates resurge and the pandemic intensifies andexpands geographically, its negative impacts on our business, our supply chain, our operatingexpenses, and gross margin, and our sales could be more prolonged and may become more severe.Even if not required by governments and other authorities, companies are also taking precautions,such as requiring employees to work remotely, imposing travel restrictions, reducing operating hours,imposing operating restrictions and temporarily closing businesses. These continuing restrictions andfuture prevention, mitigation measures and reopening policies imposed by governments and
51

companies are likely to continue to have an adverse impact on global economic conditions and impactconsumer confidence and spending which might have a material adverse impact on some of ourcustomers and could impact the demand for our products and ultimately our financial condition.Furthermore, sustained market-wide turmoil and business disruption due to the COVID-19 pandemichave negatively impacted, and are expected to continue to negatively impact, our supply chain and ourbusiness operations, and may impact our business, financial condition, results of operations and cashflows in ways that are difficult to predict.
Additionally, such restrictions have been and may continue to be re-implemented as transmissionrates of the COVID-19 virus have increased in numerous jurisdictions. The environment remains highlyuncertain, and it is unclear how long it will take for consumer behavior to return to pre-pandemic levelsin each of our markets, if at all. It is also unclear how the COVID-19 pandemic may affect our industryin the long term, to the extent any consumer behavioral changes represent a fundamental change tothe lifestyle of our consumers and their shopping patterns, and whether the increase in consumerdemand we have experienced will continue. We believe we may have benefited from changes inshopping behavior due to our presence in club, mass merchandise, grocery retailer businesses ande-commerce marketplaces, but experienced negative impacts due to reductions in traffic for drug,convenience and gas and small independent retailers. It is difficult to predict consumer behavior andretail traffic levels going forward and how that might impact our business.
We could suffer product inventory losses or markdowns and lost revenue in the event of the lossor shutdown of a major manufacturing partner, a local raw materials supplier of a manufacturingpartner, or a co-packing partner, due to COVID-19 conditions in their respective locales. Anyinterruptions to logistics could impact their ability to operate and ship us product. The potential impactof COVID-19 on any of our production or logistics providers could include, but is not limited to,problems with their respective businesses, finances, labor matters (including illness or absenteeism inworkforce or closure due to positive COVID-19 testing), ability to import and secure ingredients andpackaging, product quality issues, costs, production, insurance and reputation. Any of the foregoingcould negatively affect the price and availability of our products and impact our supply chain. If thedisruptions caused by COVID-19 continue for an extended period of time or there are one or moreresurgences of COVID-19 or the emergence of another pandemic, our ability to meet the demand forour products may be materially impacted.
Additionally, part of our long-term growth strategy may include exploring expanding into additionalgeographies. The timing and success of our international expansion with respect to customers,manufacturers and/or production facilities has been and may continue to be negatively impacted byCOVID-19, which could impede our entry and growth in these geographies.
We temporarily transitioned a significant subset of our office-based employee population inLondon, New York and Singapore to a remote work environment in an effort to mitigate the risks ofCOVID-19 to our employees and their families, which may exacerbate certain risks to our business,including cybersecurity and phishing attacks due to an increase in the number of points of potentialattack, such as laptops and mobile devices (both of which are now being used in increased numbers).In the event that an employee who has been in contact with other employees either in our offices or insales or social activities, tests positive for COVID-19, we may have to temporarily close such office andlimit the activities of close contacts, which could cause business disruptions and negatively impact ourbusiness, financial condition, results of operations and cash flows. While we anticipate the attendancein our offices increasing as the year progresses, and we believe in-person meetings and socialexperiences are an important part of our culture and creativity, it is still unclear what form this return tothe office will take, how quickly it will occur and how effective we will be recreating our ways of workingto benefit from the new remote-tools, while preserving positive aspects of our office culture.
52
Additionally, the COVID-19 pandemic may create significant disruptions in the credit and financialmarkets, which could adversely affect our ability to access capital on favorable terms or at all. Theextent of COVID-19’s effect on our operational and financial performance will depend on futuredevelopments, including the duration, spread and intensity of the pandemic (including anyresurgences), the duration and extent of inflationary cost increases driven by shipping and logisticscosts among other factors, and any long-term changes to consumer behavior, all of which areuncertain and difficult to predict considering the rapidly evolving situation across the globe.Furthermore, the uncertainty created by COVID-19 significantly increases the difficulty in forecastingoperating results and of strategic planning. As a result, it is not currently possible to ascertain theoverall impact of COVID-19 on our business. However, the pandemic has had, and may continue tohave, a material impact on our business, financial condition, results of operations and cash flows.
The impact of COVID-19 may also heighten other risks discussed in this “Risk Factors” section.
If we fail to manage our future growth effectively, our business could be materially adverselyaffected.
We have grown as a company since inception and we anticipate further growth, although thereare no guarantees of growth in any year. Any growth places significant demands on our management,financial, operational, technological and other resources and on our manufacturing and co-packingpartners. The anticipated growth and expansion of our business and our product offerings will placesignificant demands on our management and operations teams and may require significant additionalresources and expertise, which may not be available in a cost-effective or timely manner, or at all.Further, we may be subject to reputational risks should our rapid growth jeopardize our relationshipswith our retail customers, distributors, consumers or suppliers.
Our revenue growth rates may slow over time due to a number of reasons, including increasingcompetition, market saturation, slowing demand for our offerings, increasing regulatory costs andchallenges, and failure to capitalize on growth opportunities. If we fail to meet increased consumerdemand as a result of our growth, our competitors may be able to meet such demand with their ownproducts, which would diminish our growth opportunities and strengthen our competitors. If we plan fordemand that does not happen, we may have to credit customers for unsaleable product and destroysurplus inventory and associated ingredients and packaging materials, all of which will damagerelationships with manufacturing and co-packers partners. Further, if we expand capacity at ourmanufacturing partners in anticipation of growth which ultimately does not occur, it may create excesscapacity and supply in the industry, leading to downward pricing pressure, increased competition forprivate label business, and negative impacts on our business, financial conditions, results of operationsand cash flows. If we do not effectively predict and manage our growth, we may not be able to executeon our business plan, respond to competitive pressures, take advantage of market opportunities,satisfy customer requirements or maintain high-quality product offerings, any of which could harm ourbusiness, financial condition, results of operations and cash flows.
We rely on independent certification for a number of our products.
We rely on various independent third-party certifications, such as certifications of our products as“organic”, to differentiate our products and company from others. We must comply with therequirements of independent organizations or certification authorities in order to label our products ascertified organic. For example, we can lose our “organic” certification if our manufacturing partners failto source certified organic raw materials from local raw material suppliers. In addition, all raw materialsmust be certified organic. The loss of any independent certifications could adversely affect our marketposition as an organic and natural products company, which could harm our business.
53

We may not be successful in our efforts to make acquisitions and successfully integrate newlyacquired products or businesses.
We have in the past pursued and may in the future consider opportunities to acquire otherproducts or businesses that may strategically complement our portfolio of brands and expand thebreadth of our markets or customer base. We may be unable to identify suitable targets, opportunisticor otherwise, for acquisition in the future at acceptable terms or at all. In addition, exploring acquisitionopportunities may divert management attention from the core business and organic innovation andgrowth, which could negatively impact our business, financial condition, results of operations and cashflows. If we identify a suitable acquisition candidate, our ability to successfully implement theacquisition will depend on a variety of factors, including our ability to obtain financing on acceptableterms consistent with any debt agreements existing at that time and our ability to negotiate acceptableprice and terms. Historical instability in the financial markets indicates that obtaining future financing tofund acquisitions may present significant challenges and will also create dilution to shareholdersamong other potential impacts.
The success of future acquisitions will be dependent upon our ability to effectively integrate theacquired products and operations into our business. Integration can be complex, expensive and time-consuming. The failure to successfully integrate acquired products or businesses in a timely and cost-effective manner could materially adversely affect our business, prospects, results of operations andfinancial condition. The diversion of our management’s attention and any difficulties encountered in anyintegration process could also have a material adverse effect on our ability to manage our business. Inaddition, the integration process could result in the loss of key employees, the disruption of ongoingbusinesses, litigation, tax costs or inefficiencies, or inconsistencies in standards, any of which couldadversely affect our ability to maintain the appeal of our brands and our relationships with customers,employees or other third parties or our ability to achieve the anticipated benefits or synergies of suchacquisitions and could harm our financial performance. Further, the future acquisition of a product orbusiness may cause us to deviate from our historically asset light business model if we were to acquireproduction capabilities and facilities in connection therewith, and as a result could increase our costs ofoperation.
We do not know if we will be able to identify acquisitions we deem suitable, whether we will beable to successfully complete any such acquisitions on favorable terms or at all, or whether we will beable to successfully integrate or realize the anticipated benefits of any acquired products orbusinesses. Additionally, an additional risk inherent in any acquisition is that we fail to realize a positivereturn on our investment.
We may face difficulties as we expand our operations into countries in which we have no prioroperating history.
We may explore expanding our global footprint in order to enter into new markets throughpartnerships with importers and distributors, or direct sales to retailers among other potentialstrategies. This will involve expanding into countries for which we do not have current knowledge andexpertise and may involve expanding into less developed countries, which may have less political,social or economic stability and less developed infrastructure and legal systems. In addition, it may bedifficult for us to understand and accurately predict taste preferences and purchasing habits ofconsumers in these new geographic markets. Further, our planned go-to-market strategies may not bethe optimal approach in certain markets and our choice of partners may not be optimal, which mayrequire us to consider, develop and implement alternative entry and marketing strategies or to pull outof those markets. This could be more costly to implement or use more resources than we anticipated,which could have an adverse effect on our results of operations. It is costly to establish, develop andmaintain international operations and develop and promote our brands in international markets.
54

Additionally, as we expand into new countries, we may rely on local partners and distributors who maynot fully understand our business or our vision. As we expand our business into new countries, we mayencounter regulatory, legal, personnel, technological, consumer preference variations, competitive andother difficulties, including exposure to new foreign exchange risks, that increase our expenses and/ordelay our ability to become profitable in such countries, which may have a material adverse effect onour business, financial condition, results of operations and cash flows.
Disruptions in the worldwide economy may adversely affect our business, financial condition,results of operations and cash flows.
Adverse and uncertain economic conditions, including the impact of the ongoing COVID-19pandemic, may affect distributor, retailer, foodservice and consumer demand for our products orimpact our costs due to changes in the foreign exchange rate. In addition, our ability to manage normalcommercial relationships with our manufacturing and co-packing partners and third party logisticsproviders and creditors may suffer. Consumers may shift purchases to lower-priced or other perceivedvalue offerings during economic downturns. In addition, consumers may choose to purchase privatelabel products rather than branded products because they are generally less expensive. Distributorsand retailers may become more conservative in response to these conditions and seek to reduce theirinventories. Our results of operations depend upon, among other things, our ability to maintain andincrease sales volume with our existing distributors, direct retailers and foodservice customers, ourability to attract new customers and consumers, the financial condition of our customers andconsumers and our ability to provide products that appeal to consumers at the right price. Costpressures or inflation could challenge our ability to do so. Prolonged unfavorable economic conditionsmay have an adverse effect on our business, financial condition, results of operations and cash flows.
Climate change, or legal or market measures to address climate change, may negatively affectour business and operations.
There is growing concern that carbon dioxide and other greenhouse gases in the atmospheremay have an adverse impact on global temperatures, weather patterns and the frequency and severityof extreme weather and natural disasters. If such climate change has a negative effect on agriculturalproductivity, we may be subject to decreased availability or less favorable pricing for coconut water, oiland cream and other raw materials that are necessary for our current or any future products. Suchclimate changes may also require us to find manufacturing partners in new geographic areas if thelocation for best production of coconuts changes, which will require changes to our supply network andinvesting time and resources with new manufacturing partners, thereby potentially increasing our costsof production. In addition, there is no guarantee that we will be able to maintain the quality and taste ofour products as we transition to sourcing coconuts in new geographic areas.
Additionally, the increasing concern over climate change may also result in more federal, state,local and foreign legal requirements to reduce or mitigate the effects of greenhouse gases. If such lawsare enacted, we may experience significant increases in our costs of operations and delivery which inturn may negatively affect our business, financial condition, results of operations and cash flows.
Fluctuations in business conditions may unexpectedly impact our reported results ofoperations and financial condition.
We experience fluctuations in our financial performance, as a result of a variety of factors,including the timing of our or our competitors’ promotional activities, the timing of product introductionsand merchandise mix, as well as seasonal fluctuations in demand for beverage products that typicallyresult in higher revenues for such products during summer months. We periodically offer sales andpromotional incentives through various programs to customers and consumers, including rebates,temporary on-shelf price reductions, retailer advertisements, product coupons and other trade
55

activities. Our net sales and profitability are impacted by the timing and size of such sales andpromotion incentives. The promotional activity and cadence in club stores in particular may causematerial spikes or declines in expected demand. New product introductions and shelf resets at ourcustomers may also cause our results of operations to fluctuate. Due to these fluctuations, historicalperiod-to-period comparisons of our results of operations are not necessarily indicative of futureperiod-to-period results, impacting comparability of our quarterly results year-over-year.
We may require additional financing to achieve our goals, which may not be available whenneeded or may be costly and dilutive.
We may require additional financing to support the growth of our business, for working capitalneeds or to cover unforeseen costs and expenses. The amount of additional capital we may require,the timing of our capital needs and the availability of financing to fund those needs will depend on anumber of factors, including our strategic initiatives and operating plans, the performance of ourbusiness, the number, complexity and characteristics of additional products or future manufacturingprocesses we require to serve new or existing markets, any proposed acquisitions and cost increasesrelated to the integration of acquired products or businesses, any material or significant product recalls,any failure or disruption with our manufacturing and co-packing partners as well as our third partylogistics providers, the expansion into new markets, any changes in our regulatory or legislativelandscape, particularly with respect to product safety, advertising, product labeling and data privacy,the costs associated with being a public company and the market conditions for debt or equityfinancing. Additionally, the amount of capital required will depend on our ability to meet our sales goalsand otherwise successfully execute our operating plan. We intend to continually monitor and adjust ouroperating plan as necessary to respond to developments in our business, our markets and the broadereconomy and it is possible that our business could become more capital intensive. Although we believevarious debt and equity financing alternatives will be available to us to support our capital needs,financing arrangements on acceptable terms may not be available to us when needed. Additionally,these alternatives may require significant cash payments for interest and other costs or could be highlydilutive to our existing shareholders. Any such financing alternatives may not provide us with sufficientfunds to meet our long-term capital requirements.
Our business is significantly dependent on our ability and the ability of our third party partnersto meet our respective labor needs, and we or they may be subject to work stoppages atfacilities, which could negatively impact the profitability of our business.
The success of our business depends significantly on our ability and the ability of our third partypartners, including manufacturers and co-packers, to attract, hire and retain quality employees,including employees at manufacturing and distribution facilities, many of whom are skilled. We and/orour third party partners may be unable to meet our respective labor needs and control costs due toexternal factors such as the availability of a sufficient number of qualified persons in the work force ofthe markets in which we and/or our third party partners operate, unemployment levels, demand forcertain labor expertise, prevailing wage rates, wage inflation, changing demographics, health and otherinsurance costs, adoption of new or revised employment and labor laws and regulations, and theimpacts of man-made or natural disasters, such as tornadoes, hurricanes, and the COVID-19pandemic. Recently, various legislative movements have sought to increase the federal minimum wagein the United States, as well as the minimum wage in a number of individual states. Should we or ourthird party partners fail to increase wages competitively in response to increasing wage rates, thequality of the workforce could decline. Any increase in the cost of labor among our employeepopulation or that of our third party partners could have an adverse effect on our operating costs,financial condition and results of operations. If we are unable to hire and retain skilled employees, ourbusiness could be materially adversely affected.
56
If our employees or the employees of our manufacturing and co-packing partners, warehousingand fulfillment service providers or shipping partners were to engage in a strike, work stoppage orother slowdown in the future, we could experience a significant disruption of our operations, whichcould interfere with our ability to deliver products on a timely basis and could have other negativeeffects, such as decreased productivity and increased labor costs. Any interruption in the delivery ofour products could reduce demand for our products and could have a material adverse effect on us.
Additionally, our success depends on our ability to attract, train and retain a sufficient number ofemployees who understand and appreciate our culture and can represent our brand effectively andestablish credibility with our business partners and consumers. If we are unable to hire and retainemployees capable of meeting our business needs and expectations, our business and brand imagemay be impaired.
If our independent suppliers and manufacturing partners, or the local farmers or othersuppliers from which our manufacturing partners source the raw materials, do not comply withethical business practices or with applicable laws and regulations, our reputation, business,and results of operations may be harmed.
Our reputation and our consumers’ willingness to purchase our products depend in part on thecompliance of our suppliers, manufacturers, distributors, and retailer partners, as well as the localfarmers or other suppliers from which our manufacturing partners source raw materials, with ethicalemployment practices, such as with respect to child and animal labor, wages and benefits, forcedlabor, discrimination, safe and healthy working conditions, and with all legal and regulatoryrequirements relating to the conduct of their businesses. We do not exercise control over ourindependent suppliers, manufacturers, distributors and retailer partners, nor over the suppliers of ourraw materials, and cannot guarantee their compliance with ethical and lawful business practices. If oursuppliers, manufacturers, distributors, retailer partners or raw material suppliers fail to comply withapplicable laws, regulations, safety codes, employment practices, human rights standards, qualitystandards, environmental standards, production practices, or other obligations, norms or ethicalstandards, our reputation and brand image could be harmed, our customers may choose to terminatetheir relationships with us, and we could be exposed to litigation and additional costs that would harmour business, reputation, and results of operations.
The international nature of our business subjects us to additional risks.
We are subject to a number of risks related to doing business internationally, any of which couldsignificantly harm our business. These risks include:
• restrictions on the transfer of funds to and from foreign countries, including potentially negativetax consequences;
• unfavorable changes in tariffs, quotas, trade barriers or other export or import restrictions,including navigating the changing relationships between countries such as the United Statesand China and between the United Kingdom and the European Union;
• unfavorable foreign exchange controls and variation in currency exchange rates;
• increased exposure to general international market and economic conditions;
• political, economic, environmental, health-related or social uncertainty and volatility;
• the potential for substantial penalties, litigation and reputational risk related to violations of awide variety of laws, treaties and regulations, including food and beverage regulations, anti-corruption regulations (including, but not limited to, the U.S. Foreign Corrupt Practices Act, orFCPA, and the U.K. Bribery Act) and data privacy laws and regulations (including the EU’sGeneral Data Protection Regulation);
57

• the imposition of differing labor and employment laws and standards;
• significant differences in regulations across international markets and the regulatory impacts ona globally integrated supply chain;
• the bankruptcy or default in payment by our international customers and/or import partners andthe potential inability to recoup damages from such defaults, as well as subsequent terminationof existing importation agreements;
• the difficulty and costs of designing and implementing an effective control environment acrossdiverse regions and employee bases;
• the complexities of monitoring and managing compliance with a broad array of internationallaws related to data privacy and data protection, as well as cross-border transfers of personaldata;
• the difficulty and costs of maintaining effective data security;
• global cost and pricing pressures;
• complex supply chain and shipping logistical challenges; and
• unfavorable and/or changing foreign tax treaties and policies.
Federal, state and foreign anti-corruption, sanctions and trade laws create the potential forsignificant liabilities and penalties and reputational harm.
For each of the year ended December 31, 2020 and the six months ended June 30, 2021, wederived 15.4% of our net sales from our International segment. In addition, we source all of our coconutwater internationally. As such, we are also subject to a number of laws and regulations governingpayments and contributions to political persons or other third parties, including restrictions imposed bythe FCPA, as well as economic sanctions, customs and export control laws administered by the Officeof Foreign Assets Control (“OFAC”), U.S. Customs and Border Protection (“CBP”), the U.S.Department of Commerce and the U.S. Department of State. The FCPA is intended to prohibit briberyof foreign officials—including officials of any government or supranational organization, foreign politicalparties and officials thereof, and any candidate for foreign political office—to obtain or retain business.It also requires public companies in the United States to keep books and records that accurately andfairly reflect those companies’ transactions and maintain internal accounting controls to assuremanagement’s control, authority, and responsibility over a company’s assets. OFAC, CBP, the U.S.Department of Commerce and the U.S. Department of State administer and enforce various customsand export control laws and regulations, as well as economic and trade sanctions based on U.S.foreign policy and national security goals against targeted foreign states, organizations and individuals.These laws and regulations relate to a number of aspects of our business, including but not limited tothe activities of our suppliers, distributors and other partners.
Similar laws in non-U.S. jurisdictions, such as EU sanctions or the U.K. Bribery Act, as well asother applicable anti-bribery, anti-corruption, anti-money laundering, sanctions, customs or exportcontrol laws, may also impose stricter or more onerous requirements than the FCPA, OFAC, CBP, theU.S. Department of Commerce and the U.S. Department of State, and implementing them may disruptour business or cause us to incur significantly more costs to comply with those laws. Different lawsmay also contain conflicting provisions, making compliance with all laws more difficult. If we fail tocomply with these laws and regulations, we could be exposed to claims for damages, civil or criminalfinancial penalties, reputational harm, incarceration of our employees, restrictions on our operationsand other liabilities, which could negatively affect our business, operating results and financialcondition. In addition, we may be subject to successor liability for FCPA violations or other acts ofbribery, or violations of applicable sanctions or other export control laws committed by companies we
58

acquire. Any determination that we have violated the FCPA or other applicable anti-corruption,sanctions, customs or export control laws could subject us to, among other things, civil and criminalpenalties, material fines, profit disgorgement, injunctions on future conduct, securities litigation and ageneral loss of investor confidence, any one of which could adversely affect our business prospects,financial condition, results of operations or the market value of our common stock.
We may face exposure to foreign currency exchange rate fluctuations.
While most of our transactions are in U.S. dollars and we anticipate reporting our financialperformance in U.S. dollars, we currently have revenues denominated in other foreign currencies, andalso procure some of our coconut water in local currencies. In the future, we may have a higher volumeof transactions denominated in these or additional foreign currencies. Accordingly, changes in thevalue of foreign currencies relative to the U.S. dollar can affect our revenue and operating results, andas our international operations expand, our exposure to the effects of fluctuations in currencyexchange rates will grow. As a result of such foreign currency exchange rate fluctuations, it could bemore difficult to detect underlying trends in our business and operating results. In addition, to the extentthat fluctuations in currency exchange rates cause our operating results to differ from our expectationsor the expectations of our investors, the trading price of our common stock could be lowered.
From time to time, we engage in exchange rate hedging activities, including the use of derivativeinstruments such as foreign currency forward and option contracts, in an effort to mitigate the impact ofexchange rate fluctuations. However, we cannot assure you that any hedging technique we implementwill be effective, as any such technique may not offset, or may only offset a portion of, the adversefinancial effects of unfavorable movements in foreign exchange rates over the limited time the hedgesare in place. If our hedging activities are not effective, changes in currency exchange rate may have amore significant impact on our results of operations. See “Management’s Discussion and Analysis ofFinancial Condition and Results of Operations—Foreign Currency Exchange Risk.”
We are subject to risks related to sustainability and corporate social responsibility.
Our business faces increasing scrutiny related to environmental, social and governance issues,including sustainable development, product packaging, renewable resources, environmentalstewardship, supply chain management, climate change, diversity and inclusion, workplace conduct,human rights, philanthropy and support for local communities. We are a Delaware Public BenefitCorporation which has placed additional requirements on our strategies and decision-making to meetour mission. See “—Risks Related to our Existence as a Public Benefit Corporation.” Our efforts toensure we meet these standards rely on contracts, internal and third-party audits and on continuedmonitoring of potential risks and solutions. If we fail to meet applicable standards or expectations withrespect to these issues across all of our products and in all of our operations and activities, includingthe expectations we set for ourselves, our reputation and brand image could be damaged, and ourbusiness, financial condition, results of operations and cash flows could be adversely impacted.
Further, we have developed a strong corporate reputation over the years for our focus onresponsible sourcing and support of our supplier communities. We seek to conduct our business in anethical and socially responsible way, which we regard as essential to maximizing stakeholder value,while enhancing community quality, environmental stewardship and furthering the plant-basedmovement around the world. We are developing environmental and sustainability initiatives thatsupport our societal programs and are consistent with our purpose, but these initiatives requirefinancial expenditures and employee resources and are not yet fully vetted. If we are unable to meetour sustainability, environmental and social and governance goals, this could have a material adverseeffect on our reputation and brand and negatively impact our relationship with our employees,customers and consumers. There is no guarantee that our pace of progress on our environmental,
59

social and governance initiatives will meet all parties’ expectations, which in turn could result in harm toour reputation and negatively impact our business, financial condition, results of operations and cashflow.
Our insurance may not provide adequate levels of coverage against claims or otherwise protectus from all risks to which we are exposed, or we may be unable to find insurance with sufficientcoverage at a reasonable cost.
We believe that we maintain insurance customary for businesses of our size and type. However,there are types of losses we may incur that cannot be insured against or that we believe are noteconomically reasonable to insure, or that we may not have identified as risks. Moreover, if we do notmake policy payments on a timely basis, we could lose our insurance coverage, or if a loss is incurredthat exceeds policy limits, our insurance provider could refuse to cover our claims, which could result inincreased costs. If we are unable to make successful claims on our insurance for any potential losses,then we may be liable for any resulting costs, which could cause us to incur significant liabilities.Although we believe that we have adequate coverage, if we lose our insurance coverage and areunable to find similar coverage elsewhere or if rates continue to increase, or if claims are made that arenot covered by insurance or exceed coverage levels, it may have an adverse impact on our business,financial condition, results of operations and cash flows.
If our goodwill or amortizable intangible assets become impaired, we may be required to recorda significant charge to earnings.
We review our goodwill and amortizable intangible assets for impairment annually or when eventsor changes in circumstances indicate the carrying value may not be recoverable. Changes in economicor operating conditions impacting our estimates and assumptions could result in the impairment of ourgoodwill or other assets. In the event that we determine our goodwill or other assets are impaired, wemay be required to record a significant charge to earnings in our financial statements that could have amaterial adverse effect on our business, financial condition and results of operations.
Risks Related to Our Legal and Regulatory Environment
Food safety and food-borne illness incidents or other safety concerns may materially adverselyaffect our business by exposing us to lawsuits, product recalls or regulatory enforcementactions, increasing our operating costs and reducing demand for our product offerings.
Selling food and beverages for human consumption involves inherent legal and other risks, andthere is increasing governmental scrutiny of and public awareness regarding food safety. Unexpectedside effects, illness, injury or death related to allergens, food-borne illnesses or other food safetyincidents caused by products we sell or involving our suppliers or manufacturers, could result in thediscontinuance of sales of these products or cessation of our relationships with such suppliers andmanufacturers, or otherwise result in increased operating costs, lost sales, regulatory enforcementactions or harm to our reputation. Shipment of adulterated or misbranded products, even if inadvertent,can result in criminal or civil liability. Such incidents could also expose us to product liability, negligenceor other lawsuits, including consumer class action lawsuits. Any claims brought against us may exceedor be outside the scope of our existing or future insurance policy coverage or limits. Any judgmentagainst us that is more than our policy limits or not covered by our policies would have to be paid fromour cash reserves, which would reduce our capital resources.
The occurrence of food-borne illnesses or other food safety incidents could also adversely affectthe price and availability of affected ingredients and raw materials, resulting in higher costs, disruptionsin supply and a reduction in our sales. Furthermore, any instances of food contamination or regulatory
60

noncompliance, whether or not caused by our actions, could compel us, our manufacturing andco-packing partners, our distributors or our retail customers, depending on the circumstances, toconduct a recall in accordance with United States Food and Drug Administration, or the FDA,regulations and comparable foreign laws and regulations, as well as other regulations and laws in theother jurisdictions in which we operate. Product recalls could result in significant losses due to theirassociated costs, the destruction of product inventory, lost sales due to the unavailability of the productfor a period of time and potential loss of existing distributors, retail customers and shelf space ore-commerce prominence, and a potential negative impact on our ability to attract new customers andconsumers, and maintain our current customer and consumer base due to negative consumerexperiences or because of an adverse impact on our brands and reputation. The costs of a recall couldexceed or be outside the scope of our existing or future insurance policy coverage or limits. While wemaintain batch and lot tracking capability to identify potential causes for any discovered problems,there is no guarantee that in the case of a potential recall, we will effectively be able to isolate allproduct that might be associated with any alleged problem, or that we will be able to quickly andconclusively determine the root cause or narrow the scope of the recall. Our potential inability to affecta recall quickly and effectively, or manage the consumer and retailer communication in a way thatmitigates concerns, might create adverse effects on our business and reputation, including large recalland disposal costs and significant loss of revenue.
In addition, food and beverage companies have been subject to targeted, large-scale tamperingas well as to opportunistic, individual product tampering, and we, like any food company, could be atarget for product tampering. Forms of tampering could include the introduction of foreign material,chemical contaminants and pathological organisms into consumer products as well as productsubstitution. The FDA enforces laws and regulations, such as the Food Safety Modernization Act, thatrequire companies like us to analyze, prepare and implement mitigation strategies specifically toaddress tampering designed to inflict widespread public health harm. If we do not adequately addressthe possibility, or any actual instance, of product tampering, we could face possible seizure or recall ofour products and the imposition of civil or criminal sanctions, which could materially adversely affectour business, financial condition, results of operations and cash flows. Most countries in which weoperate have comparable regulations that we endeavor to comply with, but any failure to meetregulators’ or customers’ expectations could impact our business in these markets and have a materialadverse effect on our reputation as well as our business, financial condition, results of operations andcash flows.
Our products and operations are subject to government regulation and oversight both in theUnited States and abroad, and our failure to comply with applicable requirements, or torespond to changes in regulations applicable to our business could adversely affect ourbusiness, financial condition, results of operations and cash flows.
The manufacture, marketing and distribution of food products is highly regulated. We, along withour manufacturing and co-packing partners and our suppliers, are subject to a variety of laws andregulations internationally, which apply to many aspects of our and their businesses, including thesourcing of raw materials, manufacturing, packaging, labeling, distribution, advertising, sale, qualityand safety of our products, as well as the health and safety of employees and the protection of theenvironment.
Our products and operations and those of our manufacturing and co-packing partners are subjectto oversight by multiple U.S. and international regulatory agencies including the United StatesDepartment of Agriculture, or the USDA, the FDA, the Federal Trade Commission, or the FTC, theEnvironmental Protection Agency, or the EPA, the European Commission and the U.K.’s FoodStandards Agency, Health and Safety Executive, Environment Agency, Environmental Health Officers
61

and Trading Standards Officers and the Singapore Food Agency, among others. These agenciesregulate, among other things, with respect to our products and operations:
• design, development and manufacturing;
• testing, labeling, content and language of instructions for use and storage;
• product safety;
• marketing, sales and distribution;
• record keeping procedures;
• advertising and promotion;
• recalls and corrective actions; and
• product import and export.
In the United States, for example, we are subject to the requirements of the Federal Food, Drugand Cosmetic Act and regulations promulgated thereunder by the FDA. This comprehensive regulatoryprogram governs, among other things, the manufacturing, composition and ingredients, packaging,testing, labeling, marketing, promotion, advertising, storage, distribution and safety of food. The FDArequires that facilities that manufacture food products comply with a range of requirements, includinghazard analysis and preventative controls regulations, current good manufacturing practices, or cGMP,and supplier verification requirements. Certain of our facilities, as well as those of our manufacturingand co-packing partners, are subject to periodic inspection by federal, state and local authorities. Wedo not control the manufacturing processes of, but rely upon, our third-party manufacturing partners forcompliance with cGMPs for the manufacturing of our products that is conducted by our partners. If weor our manufacturing partners cannot successfully manufacture products that conform to ourspecifications and the strict regulatory requirements of the FDA or other regulatory agencies, we orthey may be subject to adverse inspectional findings or enforcement actions, which could materiallyimpact our ability to market our products, could result in our manufacturing or co-packing partners’inability to continue manufacturing for us or could result in a recall of our product that has already beendistributed. In addition, we rely upon these parties to maintain adequate quality control, qualityassurance and qualified personnel.
Failure by us, our suppliers or our manufacturing and co-packing partners to comply withapplicable laws and regulations or maintain permits, licenses or registrations relating to our or oursuppliers or manufacturing and co-packing partners’ operations could subject us to civil remedies orpenalties, including fines, injunctions, recalls or seizures, warning letters, untitled letters, restrictions onthe marketing or manufacturing of products, or refusals to permit the import or export of products, aswell as potential criminal sanctions, which could result in increased operating costs or loss of revenue,resulting in a material effect on our business, financial condition, results of operations and cash flows.
The regulations to which we are subject are complex and have tended to become more stringentover time. New labeling and food safety laws could restrict our ability to carry on or expand ouroperations, result in higher than anticipated costs or lower than anticipated sales, and otherwise makeit more difficult for us to realize our goals of achieving a more integrated global supply chain due to thedifferences in regulations around the world.
Advertising inaccuracies and product mislabeling may have an adverse effect on our businessby exposing us to lawsuits, product recalls or regulatory enforcement actions, increasing ouroperating costs and reducing demand for our product offerings.
Certain of our products are advertised with claims as to their origin, ingredients or health,wellness, environmental or other potential benefits, including, by way of example, the use of the terms
62

“natural”, “organic”, “clean”, “non-toxic”, “sustainable”, “no added sugars,” or similar synonyms orimplied statements relating to such benefits. Although the FDA and the USDA each have issuedstatements and adopted policies regarding the appropriate use of the word “natural,” there is no single,universal definition of the term “natural” for various categories we sell, which is true for many otheradjectives common in the healthy or sustainable products industry. The resulting uncertainty has led toconsumer confusion, distrust, and legal challenges.
In addition, the FDA has consistently enforced its regulations with respect to nutrient contentclaims, unauthorized health claims (claims that characterize the relationship between a food or foodingredient and a disease or health condition) and other claims that impermissibly suggest therapeuticbenefits of certain foods or food components, or that misrepresent or improperly characterize thenutrient content in conventional food products. Moreover, the FTC has articulated a robustsubstantiation standard for health claims on foods and dietary supplements and has pursuedinvestigations and litigation against companies where the FTC has concern that the claims being madeare not properly substantiated. Examples of causes of action that may be asserted in a consumer classaction lawsuit include fraud, unfair trade practices and breach of state consumer protection statutes.The FTC and/or state attorneys general may bring legal action that seeks removal of a product fromthe marketplace and impose fines and penalties. Further, consumer class action false advertisinglitigation relating to terms such as “natural,” “non-toxic,” “non-GMO” and other claims remain apersistent threat in our industry. Even when unmerited, class action claims, action by the FTC or stateattorneys general enforcement actions can be expensive to defend and adversely affect our reputationwith existing and potential customers and consumers and our corporate and brand image, which couldhave a material and adverse effect on our business, financial condition, results of operations or cashflows.
The USDA enforces federal standards for organic production and use of the term “organic” onproduct labeling. These laws prohibit a company from selling or labeling products as organic unlessthey are produced and handled in accordance with the applicable federal law. By definition, organicproducts are not genetically modified or do not include genetically modified (bioengineered)ingredients. We use suppliers and manufacturing partners who can certify that they meet the standardsneeded for each applicable product or ingredient specification. Our failure, or failure on the part of oursuppliers or manufacturing partners to comply with these ingredient and product specifications, tomaintain appropriate certifications, or to label organic products in compliance with federal or state laws,may subject us to liability or regulatory enforcement. Consumers may also pursue state law claims,particularly pursuant to California’s organic laws, challenging use of the organic label as beingintentionally mislabeled or misleading or deceptive to consumers.
The regulatory environment in which we operate could also change significantly and adversely inthe future. New or changing regulations could impact the way consumers view our products, such aspotential new labeling regulations or enforcement of a standard of identity for terms used to market ourproducts that would require us to list certain ingredients by specific names that could confuse ourconsumers into thinking we may use different types of ingredients than they originally thought or thatthe quality of our ingredients is different to what they anticipated.
Any loss of confidence on the part of consumers in the truthfulness of our labeling, advertising oringredient claims would be difficult and costly to overcome and may significantly reduce our brandvalue. Any of these events could adversely affect our brands and decrease our sales, which couldhave an adverse effect on our business, financial condition, results of operations and cash flows.
63

Failure to comply with federal, state and international laws and regulations relating to dataprivacy, data protection, advertising and consumer protection, or the expansion of current orthe enactment of new laws or regulations relating to data privacy, data protection, advertisingand consumer protection, could adversely affect our business, financial condition, results ofoperations and cash flows.
We collect, maintain, and otherwise process significant amounts of personally identifiableinformation and other data relating to our customers and employees. Additionally, we rely on a varietyof marketing techniques, including email and social media marketing, and we are subject to variouslaws and regulations that govern such marketing and advertising practices. We are subject tonumerous state, federal and international laws, rules and regulations govern the collection, use andprotection of personally identifiable information.
In the United States, federal and state laws impose limits on, or requirements regarding thecollection, distribution, use, security and storage of personally identifiable information of individuals andthere has also been increased regulation of data privacy and security particularly at the state level. Forexample, in 2018, California enacted the California Consumer Privacy Act, or the CCPA, which cameinto effect in January 2020, and gives California residents expanded rights to their personalinformation, provides for civil penalties for violations and provides a private right of action for databreaches that is expected to increase data breach litigation, and in November 2020, California voterspassed the California Privacy Rights Act which takes effect in 2023 and significantly expands theCCPA. We expect that there will continue to be new proposed laws, regulations, and industrystandards concerning data privacy, data protection, and information security in the United States andother jurisdictions at all levels of legislature, governance, and applicability. We cannot yet fullydetermine the impact that these or future laws, rules, and regulations may have on our business oroperations.
Foreign data privacy laws are also rapidly changing and have become more stringent in recentyears. In European Economic Area and the United Kingdom, the European Union’s General DataProtection Regulation, the United Kingdom’s General Data Protection Regulation, and the UK DataProtection Act 2018, collectively referred to as the GDPR, impose strict obligations on the ability tocollect, analyze, transfer and otherwise process personal data. This includes requirements with respectto accountability, transparency, obtaining individual consent, international data transfers, security andconfidentiality and personal data breach notifications, which may restrict our processing activities.Separate, restrictive obligations relating to electronic marketing and the use of cookies which may limitour ability to advertise. The interpretation and application of many existing or recently enacted dataprivacy and data protection laws and regulations in the European Union, the United Kingdom, theUnited States and elsewhere are increasingly complex, uncertain and fluid, and it is possible that suchlaws, regulations and standards may be interpreted or applied in a manner that is inconsistent with ourexisting practices. For example, recent developments in Europe have created complexity anduncertainty regarding transfers of personal data from the EEA and the UK to the United States.
Further, we rely on a variety of marketing techniques and practices to sell our products and toattract new customers and consumers, and we are subject to various current and future data protectionlaws and obligations that govern marketing and advertising practices. For example, the Controlling theAssault of Non-Solicited Pornography and Marketing Act of 2003, or the CAN-SPAM Act, establishesspecific requirements for commercial email messages in the United States. Governmental authorities,including in the European Union and the United Kingdom, continue to evaluate the privacy implicationsinherent in the use of third-party “cookies” and other methods of online tracking for behavioraladvertising and other purposes, such as by regulating the level of consumer notice and consentrequired before a company can employ cookies or other electronic tracking tools or the use of datagathered with such tools. Laws and regulations regarding the use of these cookies and other current
64
online tracking and advertising practices could increase our costs of operations and limit our ability toacquire new consumers on cost-effective terms, which, in turn, could have an adverse effect on ourbusiness, financial condition, results of operations and cash flows.
Consumer resistance to the collection and sharing of the data used to deliver targetedadvertising, increased visibility of consent or “do not track” mechanisms as a result of industryregulatory or legal developments, the adoption by consumers of browser settings or “ad-blocking”software, and the development and deployment of new technologies could materially impact our abilityor our media buyers’ ability to collect data or to efficiently and effectively deliver relevant promotions ormedia, which could materially impair the results of our operations.
Additionally, some providers of consumer devices, web browsers and application stores haveimplemented, or announced plans to implement, means to make it easier for Internet users to preventthe placement of cookies or to block other tracking technologies, require additional consents, or limitthe ability to track user activity, which could if widely adopted result in the use of third-party cookiesand other methods of online tracking becoming significantly less effective. Loss in our ability to makeeffective use of services that employ such technologies could increase our costs of operations and limitour ability to acquire new consumers on cost-effective terms, which, in turn, could have an adverseeffect on our business, financial condition, results of operations and cash flows.
We may also be bound by contractual requirements applicable to our collection, use, processing,and disclosure of various types of data, including personally identifiable information, and may be boundby self-regulatory or other industry standards relating to these matters. Our collection and use ofconsumer data is also subject to our privacy policies, including online privacy policies. The proliferationof data privacy laws in variation creates increased risk of non-compliance and increased costs ofmaintaining compliance. Additionally, while we strive to comply with our posted policies and allapplicable laws, regulations, other legal obligations and certain industry standards, laws, rules, andregulations concerning data privacy, data protection, and data security evolve frequently and may beinconsistent from one jurisdiction to another or may be interpreted to conflict with our practices or in amanner that is inconsistent from one jurisdiction to another.
The adoption of further data privacy and security laws may increase the cost and complexity ofimplementing any new offerings in other jurisdictions. Any failure, or perceived failure, by us to complywith our posted privacy policies or with any international, federal or state data privacy or consumerprotection-related laws, regulations, industry self-regulatory principles, industry standards or codes ofconduct, regulatory guidance, orders to which we may be subject or other legal or contractualobligations relating to data privacy or consumer protection could adversely affect our reputation,brands and business, and may result in regulatory investigations, claims, proceedings or actionsagainst us by governmental entities, customers, suppliers or others, class actions, or other liabilities ormay require us to change our operations and/or cease using certain data sets. Any such claims,proceedings or actions could hurt our reputation, brands and business, force us to incur significantexpenses in defense of such proceedings or actions, distract our management, increase our costs ofdoing business, result in a loss of customers and third-party partners and result in the imposition ofsignificant damages liabilities or monetary penalties.
Litigation or legal proceedings could expose us to significant liabilities and have a negativeimpact on our reputation or business.
From time to time, we may be party to various claims and litigation proceedings. We evaluatethese claims and litigation proceedings to assess the likelihood of unfavorable outcomes and toestimate, if possible, the amount of potential losses. Based on these assessments and estimates, wemay establish reserves, as appropriate. These assessments and estimates are based on the
65

information available to management at the time and involve a significant amount of managementjudgment. Actual outcomes or losses may differ materially from our assessments and estimates. Forexample, we are and have been subject to various labelling, trademark infringement and productquality claims in the ordinary course of our business, and may, in the future, face a range of litigation,including employment issues, distributor disputes, shareholder litigation and other contractual matters.
Even when not merited, the defense of these claims or lawsuits may divert our management’sattention, and we may incur significant expenses in defending these lawsuits. The results of litigationand other legal proceedings are inherently uncertain, and adverse judgments or settlements in some ofthese legal disputes may result in adverse monetary damages, penalties or injunctive relief against us,which could have a material adverse effect on our financial position, cash flows or results ofoperations. Any claims or litigation, even if fully indemnified or insured, could damage our reputationand potentially prevent us from selling or manufacturing our products, which would make it moredifficult to compete effectively or to obtain adequate insurance in the future.
Furthermore, while we maintain insurance for certain potential liabilities, such insurance does notcover all types and amounts of potential liabilities and is subject to various exclusions as well as capson amounts recoverable. Even if we believe a claim is covered by insurance, insurers may dispute ourentitlement to recovery for a variety of potential reasons, which may affect the timing and, if theinsurers prevail, the amount of our recovery.
Legislative or regulatory changes that affect our products, including new taxes, could reducedemand for products or increase our costs.
Taxes imposed on the sale of certain of our products by federal, state and local governments inthe United States, or other countries in which we operate could cause consumers to shift away frompurchasing our beverages. Several municipalities in the United States have implemented or areconsidering implementing taxes on the sale of certain “sugared” beverages, including non-diet softdrinks, fruit drinks, teas and flavored waters to help fund various initiatives. There has also been atrend among some public health advocates to recommend additional governmental regulationsconcerning the marketing and labeling/packaging of the beverage industry. Additional or revisedregulatory requirements, whether labeling, packaging, tax or otherwise, could have a material adverseeffect on our financial condition, consumer demand and results of operations.
Risks Related to Our Information Technology and Intellectual Property
We rely heavily on our information technology systems, as well as those of our third-partyvendors and business partners, for our business to effectively operate and to safeguardconfidential information; any significant failure, inadequacy, interruption or data securityincident could adversely affect our business, financial condition, results of operations and cashflows.
We use information technology systems, infrastructure and data in substantially all aspects of ourbusiness operations. Our ability to effectively manage our business and coordinate the manufacturing,sourcing, distribution and sale of our products depends significantly on the reliability and capacity ofthese systems. We are critically dependent on the integrity, security and consistent operations of thesesystems. We also collect, process and store numerous classes of sensitive, personally identifiable and/or confidential information and intellectual property, including customers’ and suppliers’ information,private information about employees and financial and strategic information about us and our businesspartners. The secure processing, maintenance and transmission of this information is critical to ouroperations.
66

As discussed above under, “If we encounter problems with our supply chain, our costs mayincrease and our or our customers’ ability to deliver our products to market could be adverselyaffected,” Our systems and those of our third party vendors and business partners may be subject todamage or interruption from power outages or damages, telecommunications problems, datacorruption, software errors, network failures, acts of war or terrorist attacks, fire, flood, globalpandemics and natural disasters; our existing safety systems, data backup, access protection, usermanagement and information technology emergency planning may not be sufficient to prevent dataloss or long-term network outages. In addition, we and our third party vendors and business partnersmay have to upgrade our existing information technology systems or choose to incorporate newtechnology systems from time to time in order for such systems to support the increasing needs of ourexpanding business. Costs and potential problems and interruptions associated with theimplementation of new or upgraded systems and technology or with maintenance or adequate supportof existing systems could disrupt our business and result in transaction errors, processing inefficienciesand loss of production or sales, causing our business and reputation to suffer.
Further, our systems and those of our third-party vendors and business partners may bevulnerable to, and have experienced attempted, security incidents, attacks by hackers (includingransomware attacks, phishing attacks and other third-party intrusions), acts of vandalism, computerviruses, misplaced or lost data, human errors or other similar events. If unauthorized parties gainaccess to our networks or databases, or those of our third-party vendors or business partners, theymay be able to steal, publish, delete, use inappropriately or modify our private and sensitive third-partyinformation, including credit card information and other personally identifiable information. In addition,employees may intentionally or inadvertently cause data or security incidents that result inunauthorized release of personally identifiable or confidential information. Because the techniquesused to circumvent security systems can be highly sophisticated, change frequently, are often notrecognized until launched against a target (and even, in many cases, until after having beensuccessfully launched for some time) and may originate from less regulated and remote areas aroundthe world, we may be unable to proactively address all possible techniques or implement adequatepreventive measures for all situations.
Security incidents compromising the confidentiality, integrity, and availability of our sensitiveinformation and our systems and those of our third party vendors and business partners couldresult from cyber-attacks, computer malware, viruses, social engineering (including spear phishingand ransomware attacks), supply chain attacks, efforts by individuals or groups of hackers andsophisticated organizations, including state-sponsored organizations, errors or malfeasance of ourpersonnel, and security vulnerabilities in the software or systems on which we, or our third partyvendors or business partners, rely. Cybercrime and hacking techniques are constantly evolving.We and/or our third-party vendors and/or business partners may be unable to anticipate attemptedsecurity breaches, react in a timely manner, or implement adequate preventative measures,particularly given the increasing use of hacking techniques designed to circumvent controls, avoiddetection, and remove or obfuscate forensic artifacts. We anticipate that these threats will continueto grow in scope and complexity over time and such incidents may occur in the future, and couldresult in unauthorized, unlawful, or inappropriate access to, inability to access, disclosure of, orloss of the sensitive, proprietary and confidential information (including personally identifiableinformation) that we handle. As we rely on a number of our third party vendors and businesspartners, we are exposed to security risks outside of our direct control, and our ability to monitorthese third-party vendors’ and business partners’ data security is limited. While we employ anumber of security measures designed to prevent, detect, and mitigate potential for harm to ourusers and our systems from the theft of or misuse of user credentials on our network, thesemeasures may not be effective in every instance. Moreover, we or our third-party vendors orbusiness partners may be more vulnerable to such attacks in remote work environments, whichhave increased in response to the COVID-19 pandemic. Additionally, while we maintain cyber
67
insurance that may help provide coverage for these types of incidents, we cannot assure you thatour insurance will be adequate to cover costs and liabilities related to these incidents.
Any such breach, attack, virus or other event could result in additional costly investigations andlitigation exceeding applicable insurance coverage or contractual rights available to us, civil or criminalpenalties, operational changes or other response measures, loss of consumer confidence in oursecurity measures, and negative publicity that could adversely affect our business, reputation, financialcondition, results of operations and cash flows.
In addition, if any such event resulted in access, disclosure or other loss or unauthorized use ofinformation or data, such as customers’ and suppliers’ information, private information aboutemployees and financial and strategic information about us and our business partners, whether actualor perceived, could result in legal claims or proceedings, regulatory investigations or actions, and othertypes of liability under laws that protect the privacy and security of personally identifiable information,including federal, state and foreign data protection and privacy regulations, violations of which couldresult in significant penalties and fines. The cost of investigating, mitigating and responding to potentialsecurity breaches and complying with applicable breach notification obligations to individuals,regulators, partners and others can be significant and the risk of legal claims in the event of a securitybreach is increasing. For example, the CCPA creates a private right of action for certain data breaches.Further, defending a suit, regardless of its merit, could be costly, divert management attention andharm our reputation. The successful assertion of one or more large claims against us that exceedavailable insurance coverage, or the occurrence of changes in our insurance policies, includingpremium increases or the imposition of large deductibles or co-insurance requirements, couldadversely affect our reputation, business, financial condition, results of operations and cash flows. Anymaterial disruption or slowdown of our systems or those of our third-party vendors or businesspartners, could have a material adverse effect on our business, financial condition, results ofoperations and cash flows. Our risks are likely to increase as we continue to expand, grow ourcustomer base, and process, store, and transmit increasing amounts of proprietary and sensitive data.In addition, although we seek to detect and investigate all data security incidents, security breachesand other incidents of unauthorized access to our information technology systems, and data can bedifficult to detect. Any delay in identifying such breaches or incidents may lead to increased harm andlegal exposure of the type described above.
We may not be able to protect our intellectual property adequately, which may harm the valueof our brands.
We believe that our intellectual property has substantial value and has contributed significantly tothe success of our business. Our trademarks are valuable assets that reinforce our brands anddifferentiate our products. We cannot assure you that we will be able to register and/or enforce ourtrademarks in all jurisdictions in which we do business, as the registrability of trademarks and thescope of trademark protection varies from jurisdiction to jurisdiction. In addition, third parties may adopttrade names or trademarks that are the same as or similar to ours, especially in jurisdictions in whichwe have not yet obtained trademark protection, thereby impeding our ability to build brand identity andpossibly leading to market confusion. In addition, our trademark applications may be opposed by thirdparties, our trademarks may otherwise be challenged, and/or the scope of any of our trademarkregistrations could be narrowed as a result of a challenge, or even canceled entirely. Failure to protectour trademark rights could prevent us in the future from challenging third parties who use names andlogos similar to our trademarks, which may in turn cause consumer confusion, negatively affect ourbrand recognition, or negatively affect consumers’ perception of our brands and products. Over thelong term, if we are unable to successfully register our trademarks and trade names and establishname recognition based on our trademarks and trade names, we may not be able to competeeffectively and our business may be adversely affected.
68

In order to resolve certain trademark disputes, we have entered into coexistence or settlementagreements that permit other parties certain uses of marks similar to ours for certain categories andcountries, and restrict the use of our marks in certain categories and countries. There is no guaranteethat these coexistence settlement agreements will foreclose future trademark disputes.
We also rely on proprietary expertise, recipes and formulations and other trade secrets andcopyright protection to develop and maintain our competitive position. Obtaining patent protection, ifavailable for any of such proprietary intellectual property, can be time consuming and expensive, andwe cannot guarantee that our patent applications would be granted, or if granted, that they would be ofsufficient scope to provide meaningful protection. Accordingly, we have in the past decided, and may infuture decide, to protect our intellectual property rights in our technologies by maintaining them astrade secrets.
Our confidentiality agreements with our employees and certain of our consultants, contractemployees, suppliers and independent contractors, including some of our manufacturers who use ourformulations to manufacture our products, generally require that all information made known to thembe kept strictly confidential. Nevertheless, trade secrets are difficult to protect. Although we attempt toprotect our trade secrets, our confidentiality agreements may not effectively prevent disclosure of ourproprietary information and may not provide an adequate remedy in the event of unauthorizeddisclosure of such information. In addition, others may independently develop similar recipes orformulations to those that we have maintained as trade secrets, in which case we would not be able toassert trade secret rights against such parties. Further, some of our formulations have been developedby or with our suppliers (manufacturing, co-packing, ingredient and packaging partners). As a result,we may not be able to prevent others from developing or using similar formulations.
We cannot assure you that the steps we have taken to protect our intellectual property rights areadequate, that our intellectual property rights can be successfully defended and asserted in the futureor that third parties will not infringe upon or misappropriate any such rights. We may be required tospend significant resources in order to monitor and protect our intellectual property rights. Litigationmay be necessary in the future to enforce our intellectual property rights and to protect our trademarksand trade secrets. We cannot assure you that we will have adequate resources to enforce ourintellectual property rights, as such litigation can be costly, time-consuming, and distracting tomanagement. Any such litigation could result in the impairment or loss of portions of our intellectualproperty, as our efforts to enforce our intellectual property rights may be met with defenses,counterclaims, and countersuits attacking the ownership, scope, validity and enforceability of ourintellectual property rights.
We also face the risk of claims that we have infringed third parties’ intellectual property rights. If athird party asserts a claim that our offerings infringe, misappropriate or violate their rights, the litigationcould be expensive and could divert management attention and resources away from our corebusiness operations. Any claims of trademark or intellectual property infringement, even those withoutmerit, could:
• be expensive and time consuming to defend;
• cause us to cease making, licensing or using products that incorporate the challengedintellectual property, which in turn could harm relationships with customers and distributors andmight result in damages;
• require us to redesign, reengineer, or rebrand our products or packaging, if feasible and mightresult in large inventory write-offs of unsaleable or unusable materials;
• divert management’s attention and resources; or
69
• require us to enter into royalty or licensing agreements in order to obtain the right to use a thirdparty’s intellectual property which might affect our margins and ability to compete.
Any royalty or licensing agreements, if required, may not be available to us on acceptable termsor at all. A successful claim of infringement against us could result in our being required to paysignificant damages, enter into costly license or royalty agreements, or stop the sale of certainproducts, any of which could have a negative impact on our operating profits, our customer relationsand harm our future prospects.
Risks Related to Our Indebtedness
We may be unable to generate sufficient cash flow to satisfy our debt service obligations,which would adversely affect our financial condition and results of operations.
Our ability to make principal and interest payments on and to refinance our indebtedness willdepend on our ability to generate cash in the future. This, to a certain extent, is subject to generaleconomic, financial, competitive, legislative, regulatory, and other factors that are beyond our control. Ifour business does not generate sufficient cash flow from operations, in the amounts projected or at all,or if future borrowings are not available to us in amounts sufficient to fund our other liquidity needsincluding working capital needs or acquisition needs, our financial condition and results of operationsmay be adversely affected. If we cannot generate sufficient cash flow from operations to makescheduled principal amortization and interest payments on our debt obligations in the future, we mayneed to refinance all or a portion of our indebtedness on or before maturity, sell assets, delay vendorpayments and capital expenditures, or seek additional equity investments. If we are unable to refinanceany of our indebtedness on commercially reasonable terms or at all or to effect any other actionrelating to our indebtedness on satisfactory terms or at all, our business may be harmed.
Our Credit Agreement has, and agreements governing any future indebtedness may contain,restrictive covenants and our failure to comply with any of these covenants could put us indefault, which would have an adverse effect on our business and prospects.
Unless and until we repay all outstanding borrowings under our Credit Agreement we will remainsubject to the terms and restrictive covenants of these borrowings. The terms of any futureindebtedness will likely impose similar restrictions as those imposed by our Credit Agreement. TheCredit Agreement contains, and agreements governing any future indebtedness may contain, anumber of covenants which put some limits on our ability to, among other things:
• sell assets;
• engage in mergers, acquisitions, and other business combinations;
• declare dividends or redeem or repurchase capital stock;
• incur, assume, or permit to exist additional indebtedness or guarantees;
• make loans and investments;
• incur liens or give guarantees; and
• enter into transactions with affiliates.
The Credit Agreement also requires us to maintain a specified total leverage ratio, fixed chargecoverage ratio and asset coverage ratio and our ability to meet these financial ratios may be affectedby events beyond our control, and we may not satisfy such a test. A breach of the covenants includedin our Credit Agreement or of any agreements governing future debt obligations could result in a
70

default under such agreements. By reason of cross-acceleration or cross-default provisions, otherindebtedness may then become immediately due and payable. Our assets or cash flows may not besufficient to fully repay borrowings under our outstanding debt instruments if accelerated upon an eventof default. If amounts owed under the Credit Agreement are accelerated because of a default and weare unable to pay such amounts, our lenders may have the right to assume control of substantially allof the assets securing the Credit Agreement.
No assurance can be given that any refinancing or additional financing will be possible whenneeded or that we will be able to negotiate acceptable terms. In addition, our access to capital isaffected by prevailing conditions in the financial and capital markets and other factors beyond ourcontrol. There can be no assurance that market conditions will be favorable at the times that we requirenew or additional financing. In addition, the Credit Agreement contains, and agreements governing anyfuture indebtedness are likely to contain, restrictive covenants that limit our subsidiaries from makingcertain dividend payments, loans or advances to the Company, unless certain conditions are met. Ourfailure to comply with such covenants may result in default, which could result in the acceleration of allour debt.
Our existing indebtedness is, and any indebtedness we incur in the future may be, variable rate,subjecting us to interest rate risk, which could cause our indebtedness service obligations toincrease significantly.
Borrowings under the Credit Agreement accrue interest at variable rates and expose us tointerest rate risk. Interest rates may fluctuate in the future. Although we have explored in the pastvarious hedging strategies, we do not currently hedge our interest rate exposure under the CreditAgreement. As a result, interest rates on the Credit Agreement or other variable rate debt obligationscould be higher or lower than current levels. If interest rates increase, our debt service obligations onour existing or any future variable rate indebtedness would increase even though the amount borrowedwould remain the same, and our net income and cash flows, including cash available for servicing ourindebtedness, would correspondingly decrease.
London Interbank Offered Rate, or LIBOR, and other interest rates that are indices deemed to be“benchmarks” are the subject of recent and ongoing national, international and other regulatoryguidance and proposals for reform. Some of these reforms are already effective, while others are stillto be implemented. These reforms may cause such benchmarks to perform differently than in the past,or to disappear entirely, or have other consequences that cannot be predicted. Any such consequencecould have a material adverse effect on our existing facilities, our interest rate swap agreement or ourfuture debt linked to such a “benchmark” and our ability to service debt that bears interest at floatingrates of interest.
Risks Related to the Ownership of Our Common Stock and this Offering
There has been no prior public market for our common stock. An active market may notdevelop or be sustainable, and you may not be able to resell your shares at or above the initialpublic offering price.
There has been no public market for our common stock prior to this offering. The initial publicoffering price for our common stock was determined through negotiations between us and theunderwriters and may vary from the market price of our common stock following the completion of thisoffering. An active or liquid market in our common stock may not develop upon completion of thisoffering or, if it does develop, it may not be sustainable. In the absence of an active trading market forour common stock, you may not be able to resell any shares you hold at or above the initial publicoffering price or at all. We cannot predict the prices at which our common stock will trade.
71
In addition, we currently anticipate that up to 5.0% of the shares of common stock offered herebywill, at our request, be offered to retail investors through Robinhood Financial, LLC, as a selling groupmember, via its online brokerage platform. There may be risks associated with the use of theRobinhood platform that we cannot foresee, including risks related to the technology and operation ofthe platform, and the publicity and the use of social media by users of the platform that we cannotcontrol.
Our stock price may be volatile or may decline regardless of our operating performance,resulting in substantial losses for investors purchasing shares in this offering.
The market price of our common stock may fluctuate significantly in response to numerousfactors, many of which are beyond our control, including:
• actual or anticipated fluctuations in our financial condition and results of operations;
• the projections we may provide to the public, any changes in these projections or our failure tomeet these projections;
• failure of securities analysts to initiate or maintain coverage of our company, changes infinancial estimates or ratings by any securities analysts who follow our company or our failureto meet these estimates or the expectations of investors;
• announcements by us or our competitors of significant technical innovations, acquisitions,strategic partnerships, joint ventures, results of operations or capital commitments, whether ornot they are successfully consummated;
• changes in stock market valuations and operating performance of other consumer goodscompanies generally, or those in the consumer beverage industry in particular;
• price and volume fluctuations in the overall stock market, including as a result of trends in theeconomy as a whole;
• changes in our board of directors or management, or any actions by our directors ormanagement that damages the reputation of the company or the image of our brands;
• sales of large blocks of our common stock, including sales by our founders or our executiveofficers and directors;
• lawsuits threatened or filed against us;
• anticipated or actual changes in laws, regulations or government policies applicable to ourbusiness;
• changes in our capital structure, such as future issuances of debt or equity securities;
• short sales, hedging and other derivative transactions involving our capital stock;
• general economic conditions in the United States;
• other events or factors, including those resulting from war, pandemics (including COVID-19),incidents of terrorism or responses to these events; and
• the other factors described in the sections of this prospectus titled “Risk Factors” and “SpecialNote Regarding Forward-Looking Statements.”
The stock market has recently experienced extreme price and volume fluctuations. The marketprices of securities of companies have experienced fluctuations that often have been unrelated ordisproportionate to their results of operations. Market fluctuations could result in extreme volatility inthe price of shares of our common stock, which could cause a decline in the value of your investment.
72

Price volatility may be greater if the public float and trading volume of shares of our common stock islow. Furthermore, in the past, stockholders have sometimes instituted securities class action litigationagainst companies following periods of volatility in the market price of their securities. Any similarlitigation against us could result in substantial costs, divert management’s attention and resources, andharm our business, financial condition, results of operations and cash flows.
Concentration of ownership of our ordinary shares among our existing executive officers,directors and principal shareholders may prevent new investors from influencing significantcorporate decisions.
Based upon our shares of common stock outstanding as of September 30, 2021, upon the closingof this offering, our executive officers, directors and shareholders who owned more than 5% of ouroutstanding share capital before this offering will, in the aggregate, beneficially own approximately 58.5%of our outstanding shares of common stock, after giving effect to the issuance of shares in this offeringand the Concurrent Private Placement, but without giving effect to any purchases by such persons orentities in this offering. These shareholders, acting together, will be able to significantly influence allmatters requiring shareholder approval, including the election and removal of directors and approval ofany merger, consolidation or sale of all or substantially all of our assets.
In addition, certain of our shareholders have entered into the Shareholders’ Agreement to supporteach other’s director nominees. For so long as such agreement remains, the remaining shareholdersmay be prevented from having an influence on the board.
Some of these persons or entities may have interests different than yours. For example, becausemany of these shareholders purchased their shares at prices substantially below the price at whichshares are being sold in this offering and have held their shares for a longer period, they may be moreinterested in selling our company to an acquirer than other investors, or they may want us to pursuestrategies that deviate from the interests of other shareholders.
Sales, directly or indirectly, of a substantial amount of our common stock in the public marketsby our existing security holders may cause the price of our common stock to decline.
Sales of a substantial number of shares of our common stock into the public market, particularlysales by our directors, executive officers and principal stockholders, or the perception that these salesmight occur, could cause the market price of our common stock to decline. Many of our existingsecurity holders have substantial unrecognized gains on the value of the equity they hold, and maytake steps to sell their shares or otherwise secure or limit their risk exposure to the value of theirunrecognized gains on those shares. We are unable to predict the timing or effect of such sales on themarket price of our common stock.
All of the shares of common stock sold in this offering will be freely tradable without restrictions orfurther registration under the Securities Act, except that any shares held by our affiliates, as defined inRule 144 under the Securities Act, would only be able to be sold in compliance with Rule 144 and anyapplicable lock up agreements described below.
In connection with this offering, we, all of our directors and executive officers and holders ofsubstantially all of our outstanding securities have entered into lock up agreements with theunderwriters that restrict our and their ability to sell or transfer shares of our capital stock for a period of180 days from the date of this prospectus, subject to certain exceptions. The entity affiliated with KDPpurchasing shares in the Concurrent Private Placement has also agreed to a lock-up agreement withthe underwriters pursuant to which the shares purchased in the Concurrent Private Placement will belocked up for a period of 180 days, subject to certain exceptions. See “Prospectus Summary—
73

Concurrent Private Placement” for additional information. In addition, we and Goldman Sachs & Co.LLC, BofA Securities, Inc., Credit Suisse Securities (USA) LLC and Evercore Group L.L.C. mayrelease certain stockholders from the market standoff agreements or lock up agreements prior to theend of the lock up period. If not otherwise released early, when the applicable market standoff and lockup periods expire, we and our security holders subject to a lock up agreement or market standoffagreement will be able to sell our shares freely in the public market, except that any shares held by ouraffiliates, as defined in Rule 144 under the Securities Act, would only be able to be sold in compliancewith Rule 144. Sales of a substantial number of such shares upon expiration of the lock up and marketstandoff agreements, or the perception that such sales may occur, or early release of theseagreements, could cause our market price to fall or make it more difficult for you to sell your commonstock at a time and price that you deem appropriate.
Notwithstanding the foregoing,
(1) if the lock-up party is (i) a current employee (that is an individual) of the company (other thanan “officer” of the company (as defined in Rule 16a-1(f) under the Exchange Act) or a member of theboard of directors of the company) that holds less than 1% of our common stock or (ii) an immediatefamily member of an employee (an “employee transferee”), the lock-up Period will expire (the “EarlyRelease”) with respect to a number of shares equal to 15% of the aggregate number of shares ofcommon stock owned by the employee or employee transferee or issuable upon exercise of vestedequity awards owned by such employee or employee transferee (measured as of the date of the InitialMeasurement Date (as defined below)) immediately prior to the commencement of trading on the thirdtrading day following the date that the following conditions are met (the “Initial Measurement Date”): (A)the later of (1) the date the company publishes its first quarterly or annual financial results following thisoffering and (2) the 30th day following the date of this prospectus (the “Initial Threshold Date”) and (B)the closing price of our common stock on the Nasdaq is at least 33% greater than the initial publicoffering price of the shares to the public as set forth on the cover of this prospectus (the “IPO Price”)for any 10 out of the 15 consecutive trading days ending on or after the Initial Threshold Date, includingthe last day of such 15-day trading period (the “Initial Measurement Period”); and
(2) the lock-up period shall expire (the “Subsequent Early Release”) with respect to a number ofshares equal to 20% of the aggregate number of shares of our common stock owned by the lock-upparties or issuable upon exercise of vested equity awards owned by the lock-up parties (measured asof the date of the Subsequent Measurement Date (as defined below)) immediately prior to thecommencement of trading on the third trading day following the date that the following conditions aremet (the “Subsequent Measurement Date”): (A) the later of (1) the date the company publishes its firstquarterly or annual financial results following this offering and (2) the 90th day following the PublicOffering Date (the “Subsequent Threshold Date”) and (B) the closing price of our common stock on theNasdaq is at least 33% greater than the IPO Price for any 10 out of the 15 consecutive trading daysending on or after the Subsequent Threshold Date, including the last day of such 15-day trading period(the “Subsequent Measurement Period”).
We may, in our discretion, extend the date of the Initial Early Release and Subsequent EarlyRelease, as the case may be, as reasonably needed for administrative processing or to the extentsuch release date would occur during a company blackout period, in which case, we will publiclyannounce the date of the Initial Early Release or Subsequent Early Release, as the case may be,following the close of trading on the date that is at least two trading days prior to the Initial EarlyRelease or Subsequent Early Release, as applicable. See “Underwriting (Conflict of Interest)” for afurther description of these lock-up agreements.
In addition, as of June 30, 2021, we had stock options outstanding that, if fully exercised, wouldresult in the issuance of 4,143,230 shares of common stock. All of the shares of common stock
74

issuable upon the exercise of stock options, and the shares reserved for future issuance under ourequity incentive plans, will be registered for public resale under the Securities Act. Accordingly, theseshares will be able to be freely sold in the public market upon issuance subject to existing lock up ormarket standoff agreements and applicable vesting requirements.
Further, based on shares outstanding as of June 30, 2021, holders of 26,798,310 shares of our commonstock will have rights after the completion of this offering, subject to certain conditions, to require us tofile registration statements for the public resale of such shares or to include such shares in registrationstatements that we may file for us or other stockholders.
We are an “emerging growth company” and our compliance with the reduced reporting anddisclosure requirements applicable to “emerging growth companies” may make our commonstock less attractive to investors.
We are an “emerging growth company,” as defined in the Jumpstart Our Business Startups Act of2012, or JOBS Act, and we have elected to take advantage of certain exemptions and relief fromvarious reporting requirements that are applicable to other public companies that are not “emerginggrowth companies.” These provisions include, but are not limited to: requiring only two years of auditedfinancial statements and only two years of related selected financial data and management’sdiscussion and analysis of financial condition and results of operations disclosures; being exempt fromcompliance with the auditor attestation requirements of Section 404(b) of the Sarbanes-Oxley Act;being exempt from any rules that could be adopted by the Public Company Accounting OversightBoard requiring mandatory audit firm rotations or a supplement to the auditor’s report on financialstatements; being subject to reduced disclosure obligations regarding executive compensation in ourperiodic reports and proxy statements; and not being required to hold nonbinding advisory votes onexecutive compensation or on any golden parachute payments not previously approved.
In addition, while we are an “emerging growth company,” we will not be required to comply withany new financial accounting standard until such standard is generally applicable to private companies.As a result, our financial statements may not be comparable to companies that are not “emerginggrowth companies” or elect not to avail themselves of this provision.
We may remain an “emerging growth company” until as late as December 31, 2026, the fiscalyear-end following the fifth anniversary of the completion of this initial public offering, though we maycease to be an “emerging growth company” earlier under certain circumstances, including if (1) wehave more than $1.07 billion in annual net revenues in any fiscal year, (2) we become a “largeaccelerated filer,” with at least $700 million of equity securities held by non-affiliates as of the end ofthe second quarter of that fiscal year or (3) we issue more than $1.0 billion of non-convertible debt overa three-year period.
The exact implications of the JOBS Act are still subject to interpretations and guidance by theSEC and other regulatory agencies, and we cannot assure you that we will be able to take advantageof all of the benefits of the JOBS Act. In addition, investors may find our common stock less attractiveto the extent we rely on the exemptions and relief granted by the JOBS Act. If some investors find ourcommon stock less attractive as a result, there may be a less active trading market for our commonstock and our stock price may decline or become more volatile.
If securities or industry analysts do not publish research, or publish inaccurate or unfavorableresearch, about our business, the price of our common stock and trading volume could decline.
The trading market for our common stock will depend in part on the research and reports thatsecurities or industry analysts publish about us or our business, our market and our competitors. We
75
do not have any control over these analysts. If few securities analysts commence coverage of us, or ifindustry analysts cease coverage of us, the trading price for our common stock would be negativelyaffected. If one or more of the analysts who cover us downgrade our common stock or publishinaccurate or unfavorable research about our business, our common stock price would likely decline. Ifone or more of these analysts cease coverage of us or fail to publish reports on us regularly, demandfor our common stock could decrease, which might cause our common stock price and trading volumeto decline.
Purchasers in this offering will experience immediate and substantial dilution in the book valueof their investment.
The initial public offering price of our common stock of $19.50 per share (which is the midpoint ofthe price range set forth on the cover page of this prospectus) is substantially higher than the asadjusted net tangible book value per share of our outstanding common stock immediately after thisoffering. Therefore, if you purchase our common stock in this offering, you will incur immediate dilutionof $17.92 in the as adjusted net tangible book value per share from the price you paid assuming thatstock price. In addition, following this offering, purchasers who bought shares from us in the offeringwill have contributed 37.8% of the total consideration paid to us by our stockholders to purchase2,500,000 shares of common stock to be sold by us in this offering, in exchange for acquiringapproximately 4.5% of our total outstanding shares as of June 30, 2021, after giving effect to thisoffering. If we issue any additional stock options or warrants or any outstanding stock options areexercised, if RSUs are settled, or if we issue any other securities or convertible debt in the future,investors will experience further dilution.
We will have broad discretion in the use of the net proceeds we receive in this offering and maynot use them in ways that prove to be effective.
We will have broad discretion in the application of the net proceeds we receive in this offering,including for any of the purposes described in the section titled “Use of Proceeds,” and you will nothave the opportunity as part of your investment decision to assess whether the net proceeds are beingused appropriately. Because of the number and variability of factors that will determine our use of thenet proceeds from this offering, their ultimate use may vary substantially from their currently intendeduse and it is possible that a substantial portion of the net proceeds will be invested in a way that doesnot yield a favorable, or any, return for us. If we do not use the net proceeds that we receive in thisoffering effectively, our business, financial condition, results of operations and cash flows could beharmed, and the market price for our common stock could decline.
We do not intend to pay dividends for the foreseeable future. Consequently, any gains from aninvestment in our common stock will likely depend on whether the price of our common stockincreases.
We currently intend to retain any future earnings to finance the operation and expansion of ourbusiness and we do not expect to declare or pay any dividends in the foreseeable future. Moreover,the terms of our existing credit agreement restrict our ability to pay dividends, and any additional debtwe may incur in the future may include similar restrictions. In addition, Delaware law may imposerequirements that may restrict our ability to pay dividends to holders of our common stock. As a result,stockholders must rely on sales of their common stock after price appreciation, which may never occur,as the only way to realize any future gains on their investment.
76

Delaware law and provisions in our amended and restated certificate of incorporation andamended and restated bylaws could make a merger, tender offer or proxy contest moredifficult, limit attempts by our stockholders to replace or remove our current management anddepress the market price of our common stock.
Provisions in our amended and restated certificate of incorporation and our amended andrestated bylaws that will become effective upon the closing of this offering may discourage, delay orprevent a merger, acquisition or other change in control of us or tender offer that stockholders mayconsider favorable, including transactions in which stockholders might otherwise receive a premium fortheir shares. These provisions could also limit the price that investors might be willing to pay in thefuture for shares of our common stock, thereby depressing the market price of our common stock. Inaddition, these provisions may frustrate or prevent any attempts by our stockholders to replace orremove our current management by making it more difficult for stockholders to replace members of ourboard of directors. Because our board of directors is responsible for appointing the members of ourmanagement team, these provisions could in turn affect any attempt by our stockholders to replacecurrent members of our management team. Among others, these provisions include that:
• restrict the forum for certain litigation against us to Delaware or the federal courts, as applicable;
• our board of directors has the exclusive right to expand the size of our board of directors and toelect directors to fill a vacancy created by the expansion of the board of directors or theresignation, death or removal of a director, which prevents stockholders from being able to fillvacancies on our board of directors;
• our board of directors is divided into three classes, Class I, Class II and Class III, with eachclass serving staggered three-year terms, which may delay the ability of stockholders tochange the membership of a majority of our board of directors;
• our stockholders may not act by written consent, which forces stockholder action to be taken atan annual or special meeting of our stockholders;
• a special meeting of stockholders may be called only by the chair of the board of directors, thechief executive officer, or the board of directors, which may delay the ability of our stockholdersto force consideration of a proposal or to take action, including the removal of directors;
• our amended and restated certificate of incorporation prohibits cumulative voting in the electionof directors, which limits the ability of minority stockholders to elect director candidates;
• our board of directors may alter our bylaws without obtaining stockholder approval;
• the required approval of the holders of at least two-thirds of the shares entitled to vote at anelection of directors to adopt, amend or repeal our amended and restated bylaws or repeal theprovisions of our amended and restated certificate of incorporation regarding the election andremoval of directors;
• stockholders must provide advance notice and additional disclosures in order to nominateindividuals for election to the board of directors or to propose matters that can be acted upon ata stockholders’ meeting, which may discourage or deter a potential acquiror from conducting asolicitation of proxies to elect the acquiror’s own slate of directors or otherwise attempting toobtain control of our company; and
• our board of directors is authorized to issue shares of preferred stock and to determine theterms of those shares, including preferences and voting rights, without stockholder approval,which could be used to significantly dilute the ownership of a hostile acquirer.
Moreover, we have opted out of Section 203 of the General Corporation Law of the State ofDelaware, which we refer to as the DGCL, but our amended and restated certificate of incorporation
77

will provide that engaging in any of a broad range of business combinations with any “interested”stockholder (generally defined as any stockholder with 15% or more of our voting stock) for a period ofthree years following the date on which the stockholder became an “interested” stockholder is prohibitedunless certain requirements are met, provided, however, that, under our amended and restated certificateof incorporation, Verlinvest Beverages SA and any of its affiliates will not be deemed to be interestedstockholders regardless of the percentage of our outstanding voting stock owned by them, andaccordingly will not be subject to such restrictions. See “Description of Capital Stock”.
Our amended and restated certificate of incorporation that will be in effect on the completion ofthis offering will provide that the Court of Chancery of the State of Delaware will be the sole andexclusive forum for certain stockholder litigation matters and the federal district courts of theUnited States shall be the exclusive forum for the resolution of any complaint asserting a causeof action arising under the Securities Act, which could limit our stockholders’ ability to obtain afavorable judicial forum for disputes with us or our directors, officers, employees orstockholders.
Our amended and restated certificate of incorporation to be effective on the closing of thisoffering will provide that, subject to limited exceptions, (1) any derivative action or proceeding broughton behalf of the Company, (2) any action asserting a claim of breach of a fiduciary duty owed by anycurrent or former director, officer, other employee or stockholder of the Company to the Company orthe Company’s stockholders, (3) any action asserting a claim arising pursuant to any provision of theDelaware General Corporation Law, our amended and restated certificate of incorporation or ouramended and restated bylaws (as either may be amended or restated) or as to which the DelawareGeneral Corporation Law confers exclusive jurisdiction on the Court of Chancery of the State ofDelaware or (4) any action asserting a claim governed by the internal affairs doctrine of the law of theState of Delaware shall, to the fullest extent permitted by law, be exclusively brought in the Court ofChancery of the State of Delaware or, if such court does not have subject matter jurisdiction thereof,the federal district court for the State of Delaware. Additionally, our amended and restated certificate ofincorporation to be effective on the closing of this offering will further provide that the federal districtcourts of the United States will be the exclusive forum for the resolution of any complaint asserting acause or causes of action arising under the Securities Act, including all causes of action assertedagainst a defendant to such complaint. The choice of forum provisions would not apply to claims orcauses of action brought to enforce a duty or liability created by the Exchange Act or any other claimfor which the federal courts have exclusive jurisdiction, as Section 27 of the Exchange Act createsexclusive federal jurisdiction over all claims brought to enforce any duty or liability created by theExchange Act or the rules and regulations thereunder. Accordingly, actions by our stockholders toenforce any duty or liability created by the Exchange Act or the rules and regulations thereunder mustbe brought in federal court. We note that there is uncertainty as to whether a court would enforce thechoice of forum provision with respect to claims under the federal securities laws, and that investorscannot waive compliance with the federal securities laws and the rules and regulations thereunder.
The choice of forum provisions may limit a stockholder’s ability to bring a claim in a judicial forumthat it finds favorable for disputes with us or our directors, officers or other employees, which maydiscourage such lawsuits against us and our directors, officers, and other employees, although ourstockholders will not be deemed to have waived our compliance with federal securities laws and therules and regulations thereunder. Alternatively, if a court were to find the choice of forum provisioncontained in our amended and restated certificate of incorporation to be inapplicable or unenforceablein an action, we may incur additional costs associated with resolving such action in other jurisdictions,which could harm our business, financial condition and results of operations. Any person or entitypurchasing or otherwise acquiring or holding any interest in shares of our capital stock shall bedeemed to have notice of and consented to the forum provisions in our amended and restatedcertificate of incorporation.
78

General Risk Factors
Members of our management team have limited experience in operating a public company, andregulatory compliance may divert their attention from the day-to-day management of ourbusiness.
With the exception of our Co-CEO, Martin Roper, our management team has very limitedexperience managing a publicly-traded company, and limited experience complying with theincreasingly complex laws and regulations pertaining to public companies. Our management team,even with Mr. Roper’s leadership, may not successfully or efficiently manage our transition to being apublic company that will be subject to significant regulatory oversight and reporting obligations underthe federal securities laws. In particular, these new obligations will require substantial attention fromour senior management and could divert their attention away from the day-to-day management of ourbusiness, which would adversely impact our business operations. We may not have adequatepersonnel with the appropriate level of knowledge, experience, and training in the accounting policies,practices or internal controls over financial reporting required of public companies in the United States.The development and implementation of the standards and controls necessary for us to achieve thelevel of accounting standards required of a public company in the United States and to meet the otherregulatory compliance needs of a public company may require costs greater than expected. It ispossible that we will be required to expand our employee base and hire additional employees tosupport our operations as a public company, which will increase our operating costs in future periods.
We will incur increased costs as a result of operating as a public company, and ourmanagement will be required to devote substantial time to new compliance initiatives andcorporate governance practices.
As a public company, and particularly once we are no longer an emerging growth company, wewill incur significant legal, regulatory, insurance, finance, accounting, investor relations, and otherexpenses that we have not incurred as a private company, including costs associated with publiccompany reporting requirements and costs of recruiting and retaining non-executive directors. We alsohave incurred and will incur costs associated with the Sarbanes-Oxley Act, and the Dodd-Frank WallStreet Reform and Consumer Protection Act, or the Dodd-Frank Act, and related rules implemented bythe SEC, and the applicable stock exchange. The expenses incurred by public companies generally forreporting and corporate governance purposes have been increasing. We expect these rules andregulations to increase our legal and financial compliance costs and to make some activities moretime-consuming and costly, although we are currently unable to estimate these costs with any degreeof certainty. Our management will need to devote a substantial amount of time to ensure that wecomply with all of these requirements, diverting the attention of management away from revenue-producing activities and the smooth running of the business. These laws and regulations also couldmake it more difficult or costly for us to obtain certain types of insurance, including director and officerliability insurance, and we may be forced to accept reduced policy limits and coverage or incursubstantially higher costs to obtain the same or similar coverage. These laws and regulations couldalso make it more difficult for us to attract and retain qualified persons to serve on our board ofdirectors, our board committees or as our executive officers. Furthermore, if we are unable to satisfyour obligations as a public company, we could be subject to delisting of our common stock, fines,sanctions and other regulatory action, and potentially civil litigation.
Changes in tax laws or in their implementation may adversely affect our business and financialcondition.
Changes in tax law may adversely affect our business or financial condition. On December 22,2017, the U.S. government enacted legislation commonly referred to as the Tax Cuts and Jobs Act, or
79

the TCJA, which significantly reformed the Internal Revenue Code of 1986, as amended, or the Code.The TCJA, among other things, contained significant changes to corporate taxation, including areduction of the corporate tax rate from a top marginal rate of 35% to a flat rate of 21%, the limitation ofthe tax deduction for net interest expense to 30% of adjusted earnings (except for certain smallbusinesses), the limitation of the deduction for net operating losses, or NOLs, arising in taxable yearsbeginning after December 31, 2017 to 80% of current year taxable income and elimination of NOLcarrybacks for losses arising in taxable years ending after December 31, 2017 (though any such NOLsmay be carried forward indefinitely), the imposition of a one-time taxation of offshore earnings atreduced rates regardless of whether they are repatriated, the elimination of U.S. tax on foreignearnings (subject to certain important exceptions), the allowance of immediate deductions for certainnew investments instead of deductions for depreciation expense over time and the modification orrepeal of many business deductions and credits.
As part of Congress’s response to the COVID-19 pandemic, the Families First CoronavirusResponse Act, or the FFCR Act, was enacted on March 18, 2020, and the Coronavirus Aid, Relief, andEconomic Security Act, or the CARES Act, was enacted on March 27, 2020. Both contain numeroustax provisions. The CARES Act also temporarily (for taxable years beginning in 2019 or 2020) relaxedthe limitation of the tax deductibility for net interest expense by increasing the limitation from 30% to50% of adjusted taxable income.
Regulatory guidance under the TCJA, the FFCR Act and the CARES Act is and continues to beforthcoming, and such guidance could ultimately increase or lessen impact of these laws on ourbusiness and financial condition. It is uncertain if and to what extent various states will conform theirlaws to the TCJA, the FFCR Act or the CARES Act.
In addition, as a result of the latest presidential and congressional elections in the United States,there could be significant changes in tax law and regulations that could result in additional federalincome taxes being imposed on us. No specific tax legislation or regulations have yet been proposedand the likelihood and nature of any such legislation or regulations is uncertain. Any adversedevelopments in these laws or regulations, including legislative changes, judicial holdings oradministrative interpretations, could have a material and adverse effect on our business, financialcondition, results of operations and cash flows. Changes in tax rates or exposure to additional taxliabilities or assessments could affect our profitability, and audits by tax authorities could result inadditional tax payments.
If our estimates or judgments relating to our critical accounting policies are based onassumptions that change or prove to be incorrect, our results of operations could fall below theexpectations of our investors and securities analysts, resulting in a decline in the trading priceof our common stock.
The preparation of financial statements in conformity with U.S. generally accepted accountingprinciples, or “GAAP”, requires management to make estimates and assumptions that affect theamounts reported in our consolidated financial statements and accompanying notes. We base ourestimates on many factors, including historical experience and various other assumptions that webelieve to be reasonable under the circumstances, as discussed in the section titled “Management’sDiscussion and Analysis of Financial Condition and Results of Operations” included elsewhere in thisprospectus, the results of which form the basis for making judgments about the carrying values ofassets, liabilities, equity and expenses that are not readily apparent from other sources. Our results ofoperations may be adversely affected if our assumptions change or if actual circumstances differ fromthose in our assumptions, which could cause our results of operations to fall below our publiclyannounced guidance or the expectations of securities analysts and investors, resulting in a decline inthe market price of our common stock.
80
Our reported financial results may be negatively impacted by changes in GAAP and financialreporting requirements.
U.S. GAAP and related financial reporting requirements are complex, continually evolving andmay be subject to varied interpretation by the relevant authoritative bodies, including the FinancialAccounting Standards Board, or FASB, the SEC and various bodies formed to promulgate andinterpret appropriate accounting principles. FASB has in the past issued new or revised accountingstandards that superseded existing guidance and significantly impacted the reporting of financialresults. Any future change in GAAP principles and financial reporting requirements or interpretationscould also have a significant effect on our reported financial results, and may even affect the reportingof past transactions completed before the announcement or effectiveness of a change if retrospectiveadoption is required. It is difficult to predict the impact of future changes to accounting principles or ouraccounting policies, any of which could negatively affect our reported results of operations.
Failure to comply with requirements to design, implement and maintain effective internalcontrols could have a material adverse effect on our business and stock price.
As a privately-held company, we were not required to evaluate our internal control over financialreporting in a manner that meets the standards of publicly traded companies required bySection 404(a) of the Sarbanes-Oxley Act, or Section 404. As a public company, we will be subject tosignificant requirements for enhanced financial reporting and internal controls. The process ofdesigning and implementing effective internal controls is a continuous effort that requires us toanticipate and react to changes in our business and the economic and regulatory environments and toexpend significant resources to maintain a system of internal controls that is adequate to satisfy ourreporting obligations as a public company. In addition, we will be required, pursuant to Section 404, tofurnish a report by management on, among other things, the effectiveness of our internal control overfinancial reporting in the second annual report following the completion of this offering. Thisassessment will need to include disclosure of any material weaknesses identified by our managementin our internal control over financial reporting. The rules governing the standards that must be met forour management to assess our internal control over financial reporting are complex and requiresignificant documentation, testing and possible remediation. Testing and maintaining internal controlsmay divert our management’s attention from other matters that are important to our business. Once weare no longer an “emerging growth company,” our auditors will be required to issue an attestationreport on the effectiveness of our internal controls on an annual basis.
In connection with the implementation of the necessary procedures and practices related tointernal control over financial reporting, we may identify deficiencies that we may not be able toremediate in time to meet the deadline imposed by the Sarbanes-Oxley Act for compliance with therequirements of Section 404. In addition, we may encounter problems or delays in completing theremediation of any deficiencies identified by our independent registered public accounting firm inconnection with the issuance of their attestation report. Our testing, or the subsequent testing (ifrequired) by our independent registered public accounting firm, may reveal deficiencies in our internalcontrols over financial reporting that are deemed to be material weaknesses. Any material weaknessescould result in a material misstatement of our annual or quarterly consolidated financial statements ordisclosures that may not be prevented or detected.
We may not be able to conclude on an ongoing basis that we have effective internal control overfinancial reporting in accordance with Section 404 or our independent registered public accounting firmmay not issue an unqualified opinion. If either we are unable to conclude that we have effective internalcontrol over financial reporting or our independent registered public accounting firm is unable toprovide us with an unqualified report (to the extent it is required to issue a report), investors could loseconfidence in our reported financial information, which could have a material adverse effect on thetrading price of our common stock.
81

Risks Relating to our Existence as a Public Benefit Corporation
We operate as a Delaware public benefit corporation, and we cannot provide any assurancethat we will achieve our public benefit purpose.
As a public benefit corporation, we are required to produce a public benefit or benefits and tooperate in a responsible and sustainable manner, balancing our stockholders’ pecuniary interests, thebest interests of those materially affected by our conduct, and the public benefit or benefits identifiedby our amended and restated certificate of incorporation. There is no assurance that we will achieveour public benefit purpose or that the expected positive impact from being a public benefit corporationwill be realized, which could have a material adverse effect on our reputation, which in turn may have amaterial adverse effect on our business, financial condition, results of operations and cash flows. See“Description of Capital Stock—Public Benefit Corporation Status.”
As a public benefit corporation, we are required to publicly disclose a report at least biennially onour overall public benefit performance and on our assessment of our success in achieving our specificpublic benefit purpose. If we are unable to provide the report, if we are unable to provide the report in atimely manner, or if the report is not viewed favorably by parties doing business with us or regulators orothers reviewing our credentials, our reputation and status as a public benefit corporation may beharmed and we could be subject to derivative litigation.
As a Delaware public benefit corporation, our focus on a specific public benefit purpose andproducing positive effect for society may negatively impact our financial performance.
Unlike traditional corporations, which have a fiduciary duty to focus exclusively on maximizingstockholder value, our directors have a fiduciary duty to consider not only the stockholders’ interests,but also the company’s specific public benefit and the interests of other stakeholders affected by ouractions. See “Description of Capital Stock—Public Benefit Corporation Status.” Therefore, we may takeactions that we believe will be in the best interests of those stakeholders materially affected by ourspecific benefit purpose, even if those actions do not maximize our financial results. While we intendfor this public benefit designation and obligation to provide an overall net benefit to us and ourcustomers, it could instead cause us to make decisions and take actions without seeking to maximizethe income generated from our business, and hence available for distribution to our stockholders. Ourpursuit of longer-term or non-pecuniary benefits related to this public benefit designation may notmaterialize within the timeframe we expect or at all, yet may have an immediate negative effect on anyamounts available for distribution to our stockholders. Accordingly, being a public benefit corporationmay have a material adverse effect on our business, results of operations, financial condition and cashflows, which in turn could cause our stock price to decline.
As a public benefit corporation, we may be less attractive as a takeover target than a traditionalcompany would be, and, therefore, your ability to realize your investment through a sale may belimited. Under Delaware law, a public benefit corporation cannot merge or consolidate with anotherentity if, as a result of such merger or consolidation, the surviving entity’s charter “does not contain theidentical provisions identifying the public benefit or public benefits,” unless the transaction receivesapproval from two-thirds of the target public benefit corporation’s outstanding voting shares.Additionally, public benefit corporations may also not be attractive targets for activists or hedge fundinvestors because new directors would still have to consider and give appropriate weight to the publicbenefit along with shareholder value, and shareholders committed to the public benefit can enforce thisthrough derivative suits. Further, by requiring that boards of directors of public benefit corporationsconsider additional constituencies other than maximizing shareholder value, Delaware public benefitcorporation law could potentially make it easier for a board to reject a hostile bid, even where thetakeover would provide the greatest short-term financial yield to investors. Additionally, being a publicbenefit corporation may result in a different assessment of potential acquisitions than a traditionalcorporation and may limit the suitable pool of such targets.
82

Our directors have a fiduciary duty to consider not only our stockholders’ interests, but alsoour specific public benefit and the interests of other stakeholders affected by our actions. If aconflict between such interests arises, there is no guarantee that such a conflict would beresolved in favor of our stockholders.
While directors of a traditional corporation are required to make decisions that they believe to bein the best interests of their stockholders, directors of a public benefit corporation have a fiduciary dutyto consider not only the stockholders’ interests, but also how its stakeholders are affected by thecompany’s actions. Under Delaware law, directors are shielded from liability for breach of theseobligations if they make informed and disinterested decisions that serve a rational purpose. Thus,unlike traditional corporations which must focus exclusively on stockholder value, our directors are notmerely permitted, but obligated, to consider our specific public benefit and the interests of otherstakeholders. See “Description of Capital Stock—Public Benefit Corporation Status.” In the event of aconflict between the interests of our stockholders and the interests of our specific public benefit or ourother stakeholders, our directors must only make informed and disinterested decisions that serve arational purpose; thus, there is no guarantee such a conflict would be resolved in favor of ourstockholders. While we believe our public benefit designation and obligation will benefit ourstockholders, in balancing these interests our board of directors may take actions that do not maximizestockholder value. Any benefits to stockholders resulting from our public benefit purposes may notmaterialize within the timeframe we expect or at all and may have negative effects. For example:
• we may choose to revise our policies in ways that we believe will be beneficial to ourstakeholders, including suppliers, employees and local communities, even though the changesmay be costly;
• we may take actions that exceed regulatory requirements, even though these actions may bemore costly than other alternatives;
• we may be influenced to pursue programs and services to further our commitment to thecommunities to which we serve even though there is no immediate return to our stockholders;or
• in responding to a possible proposal to acquire the company, our board of directors has afiduciary duty to consider the interests of our other stakeholders, including suppliers,employees and local communities, whose interests may be different from the interests of ourstockholders.
We may be unable or slow to realize the benefits we expect from actions taken to benefit ourstakeholders, which could have a material adverse effect on our business, financial condition, results ofoperations, and cash flows, which in turn could cause our stock price to decline.
As a Delaware public benefit corporation, we may be subject to increased derivative litigationconcerning our duty to balance stockholder and public benefit interest, the occurrence ofwhich may have an adverse impact on our business, financial condition, results of operationand cash flows.
Stockholders of a Delaware public benefit corporation (if they, individually or collectively, own atleast 2% of the company’s outstanding shares or, upon our listing, the lesser of such percentage orshares of at least $2 million in market value) are entitled to file a derivative lawsuit claiming thedirectors failed to balance stockholder and public benefit interests. This potential liability does not existfor traditional corporations. Therefore, we may be subject to the possibility of increased derivativelitigation, which would require the attention of our management, and, as a result, may adversely impactour management’s ability to effectively execute our strategy. Additionally, any such derivative litigationmay be costly, which may have an adverse impact on our financial condition and results of operations.
83

SPECIAL NOTE REGARDING FORWARD-LOOKING STATEMENTS
This prospectus contains forward-looking statements about us and our industry that involvesubstantial risks and uncertainties. All statements other than statements of historical facts contained inthis prospectus, including statements regarding our strategy, future financial condition, futureoperations, projected costs, prospects, plans, objectives of management, and expected market growth,are forward-looking statements. In some cases, you can identify forward-looking statements becausethey contain words such as “may,” “will,” “shall,” “should,” “expects,” “plans,” “anticipates,” “could,”“intends,” “target,” “projects,” “contemplates,” “believes,” “estimates,” “predicts,” “potential,” “goal,”“objective,” “seeks,” or “continue” or the negative of these words or other similar terms or expressionsthat concern our expectations, strategy, plans, or intentions.
These forward-looking statements are subject to risks, uncertainties and assumptions, some ofwhich are beyond our control. In addition, these forward-looking statements reflect our current viewswith respect to future events and are not a guarantee of future performance. Actual outcomes maydiffer materially from the information contained in the forward-looking statements as a result of anumber of factors, including, without limitation, the risk factors set forth in “Risk Factors” and thefollowing:
• reduced or limited availability of coconuts or other raw materials that meet our qualitystandards;
• our dependence on certain third-party suppliers, contract manufacturers and co-packingpartners to produce and manufacture our products;
• disruptions to our supply chain that increase our costs or our or our customers’ ability to deliverour products to market in a timely fashion;
• our dependence on distributor and retail customers for a significant portion of our sales;
• our profitability and cash flows may be negatively affected if we are not successful in managingour inventory;
• harm to our brand and reputation as the result of real or perceived quality or food safety issueswith our products;
• our dependence on our executive officers and other key personnel, and our ability to pursueour current business strategy effectively if we lose them;
• our ability to successfully compete in our highly competitive markets;
• unfavorable publicity or consumer perception of our products and any similar productsdistributed by other companies;
• our ability to introduce new products or successfully improve existing products;
• pandemics, epidemics or disease outbreaks, such as the COVID-19 pandemic, may disrupt ourbusiness, including, among other things, consumption and trade patterns, our supply chain andproduction processes;
• failure to expand our manufacturing and production capacity as we grow our business;
• our ability to expand our operations into countries in which we have no prior operating history;
• our ability to make successful acquisitions and divestitures in the future; and
• our international business operations expose us to certain risks.
Moreover, we operate in a very competitive and rapidly changing environment. New risks anduncertainties emerge from time to time, and it is not possible for us to predict all risks and uncertaintiesthat could have an impact on the forward-looking statements contained in this prospectus.
84
The forward-looking statements made in this prospectus relate only to events as of the date onwhich the statements are made. We undertake no obligation to update any forward-looking statementsmade in this prospectus to reflect events or circumstances after the date of this prospectus or to reflectnew information or the occurrence of unanticipated events, except as required by law. We may notactually achieve the plans, intentions, or expectations disclosed in our forward-looking statements, andyou should not place undue reliance on our forward-looking statements.
You should read this prospectus and the documents that we reference in this prospectus andhave filed as exhibits to the registration statement, of which this prospectus is a part, completely andwith the understanding that our actual future results may be materially different from what we expect.We qualify all of the forward-looking statements in this prospectus by these cautionary statements.
85

USE OF PROCEEDS
We estimate that we will receive net proceeds from this offering of approximately $41.1 million,based upon an assumed initial public offering price of $19.50 per share (which is the midpoint of theprice range set forth on the cover page of this prospectus) and after deducting estimated underwritingdiscounts and commissions and estimated offering expenses payable by us. We will not receive anyproceeds from the sale of shares of common stock sold by the selling stockholders.
Each $1.00 increase or decrease in the assumed initial public offering price per share of $19.50(which is the midpoint of the price range set forth on the cover page of this prospectus) would increaseor decrease the net proceeds to us from this offering by approximately $2.3 million, assuming thenumber of shares of common stock offered by us, as set forth on the cover page of this prospectus,remains the same and after deducting estimated underwriting discounts and commissions andestimated offering expenses payable by us. Similarly, each 1,000,000 share increase or decrease inthe number of shares of common stock offered in this offering would increase or decrease the netproceeds to us from this offering by approximately $18.2 million, assuming that the initial public offeringprice per share remains at $19.50 (which is the midpoint of the price range set forth on the cover pageof this prospectus), and after deducting the estimated underwriting discounts and commissions andestimated offering expenses payable by us.
The principal purposes of this offering are to increase our capitalization and financial flexibility,create a public market for our common stock, and enable access to the public equity markets for usand our stockholders. We currently intend to use the net proceeds from this offering to repayoutstanding borrowings under the Revolving Facility and the Term Loan Facility and for generalcorporate purposes, including working capital and operating expenses. We may also use a portion ofthe net proceeds to acquire or make investments in businesses, products and offerings, although wedo not have agreements or commitments for any material acquisitions or investments at this time.
The Revolving Facility matures on May 21, 2026. Borrowings under the Revolving Facility bearinterest at a rate per annum equal to, at our option, either (a) adjusted LIBOR (which shall not be lessthan 0.0%) plus the applicable rate or (b) base rate (determined by reference to the greatest of theprime rate published by Wells Fargo, the federal funds effective rate plus 1.5% and one-month LIBORplus 1.5%). The applicable rate for LIBOR borrowings under the Revolving Facility is subject to step-downs based on our total net leverage for the immediately preceding fiscal quarter. See “Description ofCertain Indebtedness.”
The Term Loan amortizes in quarterly installments of $1,071,428.57 and matures on May 21,2026. The Term Loan bears interest at a rate per annum equal to, at our option, either (a) adjustedLIBOR plus the applicable rate or (b) base rate (determined by reference to the greatest of the primerate published by Wells Fargo Bank, National Association the federal funds effective rate plus 1.5%and one-month LIBOR plus 1.5%). The applicable rate for LIBOR borrowings under the Term LoanFacility is subject to step-downs based on our total net leverage for the immediately preceding fiscalquarter. See “Description of Certain Indebtedness”.
The expected use of net proceeds from this offering represents our intentions based upon ourpresent plans and business conditions. We cannot predict with certainty all of the particular uses forthe proceeds of this offering or the amounts that we will actually spend on the uses set forth above.Accordingly, our management will have broad discretion in applying the net proceeds of this offering.The timing and amount of our actual expenditures will be based on many factors, including cash flowsfrom operations and the anticipated growth of our business. Pending their use, we intend to invest thenet proceeds of this offering in a variety of capital-preservation investments, including short- andintermediate-term investments, interest-bearing investments, investment-grade securities, governmentsecurities, and money market funds.
86

DIVIDEND POLICY
We currently intend to retain all available funds and future earnings, if any, for the operation andexpansion of our business and do not anticipate declaring or paying any dividends in the foreseeablefuture. Any future determination related to our dividend policy will be made at the discretion of ourboard of directors after considering our financial condition, results of operations, capital requirements,contractual requirements, business prospects and other factors the board of directors deems relevant.In addition, the terms of our current credit facilities contain restrictions on our ability to declare and paydividends.
87

CAPITALIZATION
The following table sets forth cash and cash equivalents and capitalization as of June 30, 2021,as follows:
• on an actual basis; and
• on an as adjusted basis, giving effect to (i) the filing and effectiveness of our amended andrestated certificate of incorporation, (ii) the sale and issuance of 2,500,000 shares of ourcommon stock in this offering at an assumed initial public offering price of $19.50 per share(which is the midpoint of the price range set forth on the cover page of this prospectus), afterdeducting the estimated underwriting discounts and commissions and estimated offeringexpenses payable by us and (iii) the application of the net proceeds from the offering asdescribed in “Use of Proceeds.”
The information below is illustrative only. Our capitalization following the closing of this offeringwill be adjusted based on the actual initial public offering price and other terms of this offeringdetermined at pricing. You should read this table together with our consolidated financial statementsand related notes, and the sections titled “Selected Consolidated Financial and Other Data” and“Management’s Discussion and Analysis of Financial Condition and Results of Operations” that areincluded elsewhere in this prospectus.
As of June 30, 2021
ActualAs
Adjusted(2)
(in thousands, exceptshare amountsand par value)
Cash and cash equivalents(1) $ 19,488 $ 22,551
Debt:Revolving Credit Facility . . . . . . . . . . . . . . . . . . . . . . . . . . . . . . . . . . . . . . . . . 8,000 —Term Loan Facility . . . . . . . . . . . . . . . . . . . . . . . . . . . . . . . . . . . . . . . . . . . . . . 30,000 —Other . . . . . . . . . . . . . . . . . . . . . . . . . . . . . . . . . . . . . . . . . . . . . . . . . . . . . . . . . 84 84
Stockholders’ equity:Preferred Stock, par value $0.01 per share: zero shares authorized,
issued and outstanding, actual; 10,000,000 shares authorized, zeroshares issued and outstanding, pro forma and as adjusted . . . . . . . . . . . — —
Common stock, par value $0.01 per share; 100,000,000 sharesauthorized; 59,202,325 shares issued and 52,996,125 sharesoutstanding, actual; 500,000,000 shares authorized, 61,702,325 sharesissued and 55,496,125 shares outstanding, as adjusted . . . . . . . . . . . . . 592 617
Additional paid-in capital . . . . . . . . . . . . . . . . . . . . . . . . . . . . . . . . . . . . . . . . . 101,880 142,918Loan to stockholder . . . . . . . . . . . . . . . . . . . . . . . . . . . . . . . . . . . . . . . . . . . . . (17,751) (17,751)Accumulated other comprehensive loss . . . . . . . . . . . . . . . . . . . . . . . . . . . . . (637) (637)Treasury stock, 6,206,200 shares at cost. . . . . . . . . . . . . . . . . . . . . . . . . . . . (58,928) (58,928)Noncontrolling interests . . . . . . . . . . . . . . . . . . . . . . . . . . . . . . . . . . . . . . . . . . 62 62Retained earnings . . . . . . . . . . . . . . . . . . . . . . . . . . . . . . . . . . . . . . . . . . . . . . 37,796 37,796
Total stockholders’ equity . . . . . . . . . . . . . . . . . . . . . . . . . . . . . . . . . . . . . . . . 63,014 104,077
Total capitalization . . . . . . . . . . . . . . . . . . . . . . . . . . . . . . . . . . . . . . . . . . . . . . . . . . $101,098 $104,161
(1) As adjusted balance does not give effect to the repayment of a secured promissory note previously outstanding with theco-CEO. See “Certain Relationships and Related Party Transactions—Loan to Officer.”
(2) Each $1.00 increase or decrease in the assumed initial public offering price per share of $19.50 (which is the midpoint ofthe price range set forth on the cover page of this prospectus) would increase or decrease, as applicable, the as adjusted
88
amount of each of cash and cash equivalents, additional paid-in capital and total stockholders’ equity by approximately$2.3 million, assuming that the number of shares of common stock offered by us, as set forth on the cover page of thisprospectus remains the same and after deducting estimated underwriting discounts and commissions and estimatedoffering expenses payable by us. Similarly, each 1,000,000 share increase or decrease in the number of shares ofcommon stock offered in this offering would increase or decrease, as applicable, the as adjusted amount of each of cashand cash equivalents, additional paid-in capital and total stockholders’ equity by $18.2 million, assuming that the initialpublic offering price per share remains at $19.50 (which is the midpoint of the price range set forth on the cover page ofthis prospectus), and after deducting estimated underwriting discounts and commissions and estimated offering expensespayable by us.
The as adjusted column in the table above is based on 55,496,125 shares of common stockoutstanding as of June 30, 2021, and excludes:
• 13,195 shares of common stock issued after June 30, 2021 upon exercise of outstandingoptions to purchase common stock;
• 4,143,230 shares of common stock issuable upon the exercise of stock options outstandingunder our 2014 Plan, as of June 30, 2021, at a weighted-average exercise price of $10.05 pershare;
• 50,050 shares of common stock issuable upon the exercise of stock options granted afterJune 30, 2021, with a weighted-average exercise price of $10.18 per share, pursuant to our2014 Plan;
• 3,431,312 additional shares of our common stock reserved for future issuance under our 2021Plan, which will become effective in connection with this offering, as well as any automaticincreases in the number of shares of our common stock reserved for future issuance under our2021 Plan;
• 571,885 shares of our common stock reserved for issuance under our ESPP, which willbecome effective in connection with this offering;
• 629,555 shares of common stock issuable upon the exercise of the IPO options;
• 212,006 shares of common stock issuable upon the vesting of the IPO RSUs; and
• the KDP Restricted Stock.
On and after the closing of this offering and following the effectiveness of the 2021 Plan, nofurther grants will be made under the 2014 Plan. Our 2021 Plan and ESPP also provide for automaticannual increases in the number of shares reserved thereunder. See the section titled “ExecutiveCompensation—Equity Plans” for additional information.
89

DILUTION
If you invest in our common stock in this offering, your interest will be diluted to the extent of thedifference between the initial public offering price per share of common stock and the as adjusted nettangible book value per share of our common stock immediately after this offering.
Our historical net tangible book value as of June 30, 2021 was $46.7 million, or $0.88 per share.Our historical net tangible book value per share represents total tangible assets less total liabilities,divided by the number of shares of our common stock outstanding as of June 30, 2021.
After giving effect to receipt of the net proceeds from our issuance and sale of 2,500,000 sharesof common stock in this offering at an assumed initial public offering price per share of $19.50 (which isthe midpoint of the price range set forth on the cover page of this prospectus) and after deductingestimated underwriting discounts and commissions and estimated offering expenses, our as adjustednet tangible book value as of June 30, 2021 would have been approximately $87.7 million, or $1.58 pershare. This amount represents an immediate increase in net tangible book value of $0.70 per share toour existing stockholders and an immediate dilution of approximately $17.92 per share to newinvestors purchasing common stock in this offering.
We determine dilution by subtracting the as adjusted net tangible book value per share after thisoffering from the initial public offering price per share paid by new investors for a share of commonstock. The following table illustrates this dilution on a per share basis:
Assumed initial public offering price per share of common stock . . . . . . . . . . . . . . . . $19.50Historical net tangible book value per share as of June 30, 2021 . . . . . . . . . . . . $ 0.88Increase in net tangible book value per share attributable to new investors
purchasing common stock in this offering . . . . . . . . . . . . . . . . . . . . . . . . . . . . . 0.70
As adjusted net tangible book value per share immediately after this offering . . . . . . 1.58
Dilution in as adjusted net tangible book value per share to new investors in thisoffering . . . . . . . . . . . . . . . . . . . . . . . . . . . . . . . . . . . . . . . . . . . . . . . . . . . . . . . . . . . . . $17.92
The dilution information discussed above is illustrative only and may change based on the actualinitial public offering price and other terms of this offering.
Each $1.00 increase or decrease in the assumed initial public offering price per share of $19.50(which is the midpoint of the price range set forth on the cover page of this prospectus) would increaseor decrease, as applicable, our as adjusted net tangible book value per share after this offering by$0.04 per share and the dilution per share to new investors participating in this offering by $0.96 pershare, assuming that the number of shares of common stock offered by us, as set forth on the coverpage of this prospectus, remains the same and after deducting estimated underwriting discounts andcommissions and estimated offering expenses payable by us. Similarly, a 1,000,000 share increase inthe number of shares of common stock offered by us would increase the as adjusted net tangible bookvalue after this offering by $0.29 per share and decrease the dilution per share to new investorsparticipating in this offering by $0.29 per share, and a 1,000,000 share decrease in the number ofshares of common stock offered by us would decrease the as adjusted net tangible book value by$0.36 per share, and increase the dilution per share to new investors in this offering by $0.36 pershare, assuming that the assumed initial public offering price per share of $19.50 (which is themidpoint of the price range set forth on the cover page of this prospectus) remains the same and afterdeducting estimated underwriting discounts and commissions and estimated offering expensespayable by us.
90

The following table summarizes on the as adjusted basis described above, the differencesbetween the number of shares purchased from us, the total consideration paid and the average priceper share paid to us by existing stockholders and by investors purchasing shares in this offering at theassumed initial public offering price per share of $19.50 (which is the midpoint of the price range setforth on the cover page on this prospectus), before deducting estimated underwriting discounts andcommissions and estimated offering expenses payable by us:
Shares Purchased Total Consideration Average Price
Number(in thousands) Percent
Amount(in thousands) Percent Per Share
Existing stockholders . . . . . . . . . . . . . . . 52,996,125 95.5% $ 80,244,248 62.2% $ 1.51New investors . . . . . . . . . . . . . . . . . . . . . 2,500,000 4.5% 48,750,000 37.8% 19.50
Total . . . . . . . . . . . . . . . . . . . . . . . . . . . . 55,496,125 100% $128,994,248 100%
A $1.00 increase or decrease in the assumed initial public offering price per share of $19.50(which is the midpoint of the price range set forth on the cover page of this prospectus) would increaseor decrease, as applicable, the total consideration paid by new investors by $2.5 million and, in thecase of an increase, would increase the percentage of total consideration paid by new investors to39.0% and, in the case of a decrease, would decrease the percentage of total consideration paid bynew investors to 36.6%, assuming that the number of shares offered by us, as set forth on the coverpage of this prospectus, remains the same. Similarly, a 1,000,000 share increase or decrease in thenumber of shares offered by us would increase or decrease, as applicable, the total consideration paidby new investors by $19.5 million and, in the case of an increase, would increase the percentage oftotal consideration paid by new investors to 46% and, in the case of a decrease, would decrease thepercentage of total consideration paid by new investors to 26.7%, assuming that the assumed initialpublic offering price per share of $19.50 share (which is the midpoint of the price range set forth on thecover page of this prospectus) remains the same.
Sales by the selling stockholders in this offering and the Concurrent Private Placement will causethe number of shares held by existing stockholders to be reduced to 42,970,484 shares, or 77.4% ofthe total number of shares of our common stock outstanding following the completion of this offering,and will increase the number of shares held by new investors to 12,525,641 shares, or 22.6% of thetotal number of shares outstanding following the completion of this offering.
The as adjusted columns in the table above are based on 55,496,125 shares of common stockoutstanding as of June 30, 2021, and exclude:
• 13,195 shares of common stock issued after June 30, 2021 upon exercise of outstandingoptions to purchase common stock;
• 4,143,230 shares of common stock issuable upon exercise of stock options outstanding underour 2014 Plan as of June 30, 2021, at a weighted-average exercise price of $10.05 per share;
• 50,050 shares of common stock issuable upon the exercise of stock options granted afterJune 30, 2021, with a weighted-average exercise price of $10.18 per share, pursuant to our2014 Plan;
• 3,431,312 additional shares of our common stock reserved for future issuance under our 2021Plan, which will become effective in connection with this offering, as well as any automaticincreases in the number of shares of our common stock reserved for future issuance under our2021 Plan;
• 571,885 shares of our common stock reserved for issuance under our ESPP, which willbecome effective in connection with this offering;
91

• 629,555 shares of common stock issuable upon the exercise of the IPO options;
• 212,006 shares of common stock issuable upon the vesting of the IPO RSUs; and
• the KDP Restricted Stock.
On and after the closing of this offering and following the effectiveness of the 2021 Plan, nofurther grants will be made under the 2014 Plan. Our 2021 Plan and ESPP also provide for automaticannual increases in the number of shares reserved thereunder. See the section titled “ExecutiveCompensation—Equity Plans” for additional information.
92

SELECTED CONSOLIDATED FINANCIAL AND OTHER DATA
You should read the following selected consolidated financial data together with our consolidatedfinancial statements and the related notes appearing at the end of this prospectus and the “Management’sDiscussion and Analysis of Financial Condition and Results of Operations” section of this prospectus. Wehave derived the consolidated statement of operations data for the years ended statement of operationsdata for the years ended December 31, 2020 and 2019 and the consolidated balance sheet data as ofDecember 31, 2019 and 2020 from our audited consolidated financial statements included elsewhere in thisprospectus. For interim periods, we have derived our selected statements of operations data for the sixmonths ended June 30, 2021 and 2020 and the selected balance sheet data as of June 30, 2021 from ourunaudited condensed financial statements and related notes included elsewhere in this prospectus. Theunaudited condensed financial statements were prepared on a basis consistent with our audited financialstatements and include, in management’s opinion, all adjustments, consisting only of normal recurringadjustments that we consider necessary for a fair presentation of the financial information set forth in thosestatements. Our historical results are not necessarily indicative of results that may be expected in any futureperiod, and our results for any interim period are not necessarily indicative of results that may be expectedfor any future period.
Year Ended December 31, Six Months Ended June 30,
2020 2019 2021 2020
(in thousands, except per share data)Consolidated Statements of Operations Data:Net Sales . . . . . . . . . . . . . . . . . . . . . . . . . . . . . . . . . . . . . . . . . $ 310,644 $ 283,949 $ 177,260 $ 153,806Cost of goods sold . . . . . . . . . . . . . . . . . . . . . . . . . . . . . . . . . . 205,786 190,961 124,200 100,872
Gross Profit . . . . . . . . . . . . . . . . . . . . . . . . . . . . . . . . . . . 104,858 92,988 53,060 52,934Operating Expenses:
Selling, general and administrative . . . . . . . . . . . . . . . . 74,401 78,917 41,222 36,401Change in fair value of contingent consideration . . . . . (16,400) 700 - -
Total operating expenses . . . . . . . . . . . . . . . . . . . . 58,001 79,617 41,222 36,401
Income from operations . . . . . . . . . . . . . . . . . . . . . . . . . . . . . 46,857 13,371 11,838 16,533Other income (expense)
Unrealized gain/(loss) on derivative instrument . . . . . . (4,718) (1,233) 3,214 (7,396)Foreign currency gain/(loss) . . . . . . . . . . . . . . . . . . . . . . 1,848 201 (1,530) 362Interest income . . . . . . . . . . . . . . . . . . . . . . . . . . . . . . . . 404 225 73 183Interest expense . . . . . . . . . . . . . . . . . . . . . . . . . . . . . . . (791) (1,163) (192) (752)
Total other expense . . . . . . . . . . . . . . . . . . . . . . . . . (3,257) (1,970) 1,565 (7,603)Income before income taxes . . . . . . . . . . . . . . . . . . . . . . . . . 43,600 11,401 13,403 8,930Income tax expense . . . . . . . . . . . . . . . . . . . . . . . . . . . . . . . . (10,913) (1,979) (3,981) (2,352)
Net income . . . . . . . . . . . . . . . . . . . . . . . . . . . . . . . . . . . . . . . . $ 32,687 $ 9,422 $ 9,422 $ 6,578
Net income attributable to common stockholders . . . . . . . . . $ 32,660 $ 9,417 $ 9,442 $ 6,567
Per Share Data:Net income per share attributable to common
stockholders(1),Basic . . . . . . . . . . . . . . . . . . . . . . . . . . . . . . . . . . . . . . . . . $ 0.56 $ 0.17 $ 0.18 $ 0.11Diluted . . . . . . . . . . . . . . . . . . . . . . . . . . . . . . . . . . . . . . . . $ 0.56 $ 0.16 $ 0.18 $ 0.11
Weighted-average common shares outstanding,Basic . . . . . . . . . . . . . . . . . . . . . . . . . . . . . . . . . . . . . . . . . 58,501,170 56,968,730 53,398,800 58,602,180Diluted . . . . . . . . . . . . . . . . . . . . . . . . . . . . . . . . . . . . . . . . 58,610,825 57,152,550 53,842,425 58,736,860
(1) See Note 17 to our consolidated financial statements and Note 12 to our condensed consolidatedfinancial statements included elsewhere in this prospectus for an explanation of the method used tocalculate basic and diluted net income per share and the weighted average number of shares used inthe computation of the per share amounts.
93
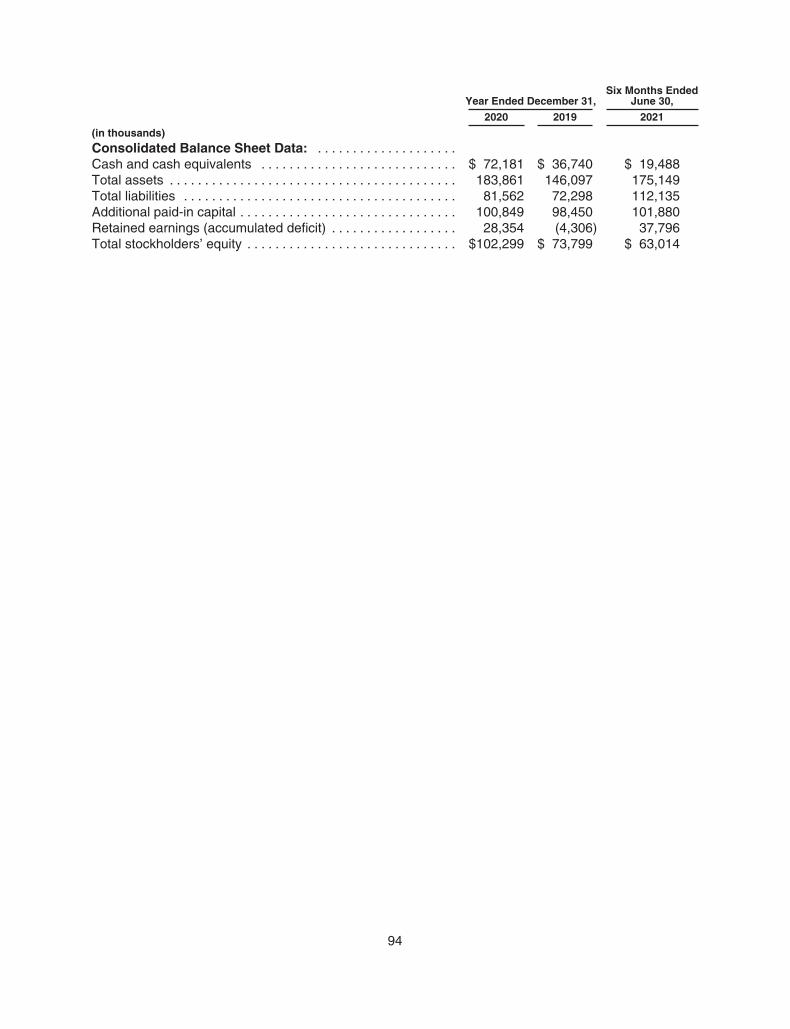
Year Ended December 31,Six Months Ended
June 30,
2020 2019 2021
(in thousands)
Consolidated Balance Sheet Data: . . . . . . . . . . . . . . . . . . . .Cash and cash equivalents . . . . . . . . . . . . . . . . . . . . . . . . . . . . $ 72,181 $ 36,740 $ 19,488Total assets . . . . . . . . . . . . . . . . . . . . . . . . . . . . . . . . . . . . . . . . . 183,861 146,097 175,149Total liabilities . . . . . . . . . . . . . . . . . . . . . . . . . . . . . . . . . . . . . . . 81,562 72,298 112,135Additional paid-in capital . . . . . . . . . . . . . . . . . . . . . . . . . . . . . . . 100,849 98,450 101,880Retained earnings (accumulated deficit) . . . . . . . . . . . . . . . . . . 28,354 (4,306) 37,796Total stockholders’ equity . . . . . . . . . . . . . . . . . . . . . . . . . . . . . . $102,299 $ 73,799 $ 63,014
94

MANAGEMENT’S DISCUSSION AND ANALYSIS OF FINANCIAL CONDITION AND RESULTS OFOPERATIONS
You should read the following discussion and analysis of our financial condition and results ofoperations together with the “Selected Consolidated Financial and Other Data” and our consolidatedfinancial statements and related notes included elsewhere in this prospectus. This discussion containsforward-looking statements based upon current expectations that involve risks and uncertainties. Ouractual results may differ materially from those anticipated in these forward-looking statements as aresult of various factors, including those set forth under the section titled “Risk Factors” or in other partsof this prospectus. Our historical results are not necessarily indicative of the results that may beexpected for any period in the future. Except as otherwise noted, all references to 2020 refer to theyear ended December 31, 2020 and all references to 2019 refer to the year ended December 31,2019.
Overview
The Vita Coco Company is a leading fast-growing, plant-based functional hydration platform,which pioneered packaged coconut water in 2004, and recently began extending into other healthyhydration categories. We are on a mission to reimagine what is possible when brands deliver greattasting, natural, and nutritious products that are better for consumers and better for the world. At theVita Coco Company, we strongly believe that we have a nearly two-decade head start on building amodern, healthy beverage company providing products that consumers demand. We observed earlyon the shift toward healthier and more functional beverage and food products led by the nextgeneration of consumers. As a result, we believe our platform is tethered to the future and notanchored to the past. Our portfolio is led by Vita Coco, which is the leader in the global coconut watercategory with additional coconut oil and coconut milk offerings, and includes Runa, a leading plant-based energy drink inspired from a plant native to Ecuador, Ever & Ever, a sustainably packagedwater, and the recently launched PWR LIFT, a flavored protein-infused water.
Since our inception, we have been boldly re-defining healthy hydration to truly be good for yourbody rather than “less bad for you” as defined by the old guards of the beverage industry. We haveembraced the power of plants from around the globe by turning them into conveniently packagedbeverages that our consumers can enjoy across need-states and beverage occasions throughout theday—as a replacement to orange juice in the morning, as a natural sports drink invented by MotherNature, as a refreshing alternative to both regular or plant-based milk in a smoothie, or simply on itsown as a great-tasting functional hydrator. Together, our brands help our consumers satiate their largeand growing thirst for healthy and functional hydration, which fuels well-being from the inside out. Thisenables us to serve a U.S. beverage market of over $119 billion, providing a long runway for growth,and within which the $13 billion natural segment is currently growing at twice the pace of theconventional brands, according to SPINS.
Through the years, with consistent execution and deliberate planning, we have innovated andexpanded to become a larger good-for-you beverage platform that has sold close to three billionequivalent beverages over the last 10 years. We started as pioneers of the natural beverage category,and through our expansion, have helped launch the category into its ever-growing market positiontoday. We are poised for continued growth and excitedly appointed beverage industry veteran, MartinRoper, as our Co-CEO in 2019. Martin joins us from The Boston Beer Company, where he transformedthe company from a regional craft brewer to a diversified portfolio of well recognized brands, withexpanding international presence.
While we are maniacally focused on the benefits we deliver to our consumers through ourproducts, we also believe that we have a deep responsibility to grow our business with our
95

environmental and social impact in mind. That is why we bring our products to market through aresponsibly designed, asset-lite supply chain which has a positive impact on consumers and ourcommunities, and mitigates the impact on the planet. Our innovative and robust supply chain startswith our family farmers, who provide us with approximately 2.5 million coconuts daily. As part of ourcoconut water production process, we provide producers the partnership, investment and training theyneed to not only reduce waste and environmental impact, but also turn coconut water into a shelf-stable product with commercial viability, broad consumer appeal, and benefits for the global society.
We have broad appeal and offer a unique value proposition to both our retail partners andend-consumers alike. Our products are premium yet accessible, which attracts a broad and diverseaudience that increases our desirability to retailers, and ultimately supports our profitability. Ourconsumers are young and valuable shoppers who have significant long-term buying potential andinfluence over future trends. We operate at the intersection of functional and natural, and offer a widevariety of clean, responsible, better-for-you products that our customers know and love. Beyond thebenefits our products offer, we appeal to consumers across dayparts, usage occasions, ages,geographies, and demographics. From coconut milk in the morning, to a Vita Coco or PWR LIFT aftera workout, then a Runa for afternoon energy, or an Ever & Ever anytime – the need-states andopportunities to enjoy our beverages are endless, yet we are still determined to find more!
We exercise strong financial discipline when managing our business and executing on our growthstrategies, and our financial performance reflects that. While many companies at our stage and withour growth profile adopt a “growth-at-all-cost” mindset, we have always been focused on profitable,responsible, and sustainable growth. Still, we believe we have multiple opportunities to sustain themomentum of our branded coconut water business, and over time continue to expand our margins.We believe this strategy is the most prudent and value-maximizing for all of our stakeholders, includinginvestors, consumers, customers, employees, and global citizens, over the long-term horizon.
Our recent historical financial performance reflects the tremendous strides we have made toscale and grow our business:
• For the trailing twelve months ended June 30, 2021, we reported net sales of $334 million,representing a 17% increase from the twelve months ended June 30, 2020.
• For the year ended December 31, 2020, we reported net sales of $311 million, representing a9% increase from $284 million for the year ended December 31, 2019. For the six monthsended June 30, 2021, we reported net sales of $177 million, representing a 15% increase from$154 million for the six months ended June 30, 2020 primarily driven by a 29% increase in netsales of Vita Coco Coconut Water during the same period.
• For the year ended December 31, 2020, we generated gross profit of $105 million, representinga margin of 34% and a 13% increase from $93 million for the year ended December 31, 2019.For the six months ended June 30, 2021, we generated gross profit of $53 million, representinga margin of 30% and remaining relatively flat in absolute dollar terms compared to $53 millionfor the six months ended June 30, 2020.
• For the year ended December 31, 2020, our net income was $33 million, representing a marginof 11% and a 247% increase from our net income of $9 million and a margin of 3% for the yearended December 31, 2019. For the six months ended June 30, 2021, our net income was $9million, representing a margin of 5% and a 43% increase from our net income of $7 million andmargin of 4% for the six months ended June 30, 2020.
• For the year ended December 31, 2020, our adjusted EBITDA was $35 million, representing amargin of 11% and an increase of 75% from our adjusted EBITDA of $20 million for the yearended December 31, 2019. This improved margin was a result of our gross profit margin
96

expansion and right-sized marketing investments. For the six months ended June 30, 2021, ouradjusted EBITDA was $16 million, representing a margin of 9% and a decrease of 16% fromour adjusted EBITDA of $19 million for the six months ended June 30, 2020, due in part to thechallenging supply chain environment we experienced during the six months ended June 30,2021.
• We have traditionally experienced minimal capital expenditures given our asset-lite model. Webelieve that our operating cash flow and access to credit facilities provide us with sufficientcapability to support our growth plans.
• As of December 31, 2020 and June 30, 2021, we had $25 million and $38 million, respectively,of outstanding indebtedness.
Key Factors Affecting Our Performance
We believe that the growth of our business and our future success are dependent upon manyfactors, the most important of which are as follows:
Ability to Grow and Maintain the Health of Our Brands
We have developed a strong and trusted brand in Vita Coco that we believe has been integral tothe growth and health of our business, and are in the early stages of developing additional brands tobroaden our portfolio. In addition, we are continuously developing and sharpening our communicationtactics to ensure that our story and purpose are understood and resonate with consumers. Thesuccess and reputation of our current brands and any brands we develop in the future are critical to thegrowth of our business and our future success. We aim to grow our brands by expanding distribution,adding new formats, promoting trials with new consumers and investing in marketing to attract newconsumers and demonstrating to existing consumers the quality value of their purchases. To grow andmaintain the health of our bands we must invest in sales and marketing and execute on our salesstrategy to develop and deepen consumers’ connection to our brands. We believe that the strength ofour core brand, Vita Coco, should enable us to continue to invest in expanding our brands acrossbeverage categories and channels, and to deepen relationships with consumers across alldemographics.
Ability to Generate Incremental Volume Through Product Innovation
The beverage industry is subject to shifting consumer preferences which presents opportunitiesfor new beverage occasions, new tastes and new functional benefits. Our future success is thereforepartially dependent on our ability to identify these trends and develop products and brands thateffectively meet those needs. Our innovation efforts focus on developing and marketing productextensions, improving upon the quality and taste profiles of existing products, and introducing newproducts or brands to meet evolving consumer needs. We aim to develop and test new products, andscale the most promising among them to ensure a strong pipeline of product innovation.
We maintain in-house research and development capabilities as well as strong third-partyrelationships with flavor development houses, and we monitor the latest advancements in cleaningredients to support continued innovation and learning. Our ability to successfully improve existingproducts, or develop, market and sell new products or brands depends on our commitment andcontinued investment in innovation, and our willingness to try and fail and learn from our experiences.
Relationship with Suppliers and Asset-Lite Supply Chain Model
We believe our global asset lite supply chain model has been an integral part in our ability toefficiently scale our business and compete in the marketplace. This asset-lite model creates leverage
97

with our partners across our supply chain, allowing us to effectively manage total delivery costs andaffording greater ability to shift volume between our suppliers, and thus better manage our supplylevels. In addition, our scale of sourcing has allowed us to add volume and service retailers morereliably, and our global position as the largest and highest quality coconut water procurer in the worldprotects our customer and supplier relationships. We aim to drive continuous operationalimprovements with our supplier partners to enhance quality of our products, better control costs andultimately maintain our competitive advantage. Our dedicated engineering support team supports oursupply partners’ expansion, efficiency and environmental initiatives and shares best practices acrossour supplier network.
Ability to Successfully Execute Both In-Store and Online
To aid the growth of our business, we intend to continue improving our operational efficiency andleverage our brand position across channels, and therefore have a balanced approach to investmentand development of capabilities in retail and e-commerce execution. Our DSD network is an importantasset in executing physical retail programs and ensuring product availability and visibility in the UnitedStates. Managing our DSD network requires relationship building and communication as to plans, andalignment of goals and interests. We look to adapt our approaches as consumer and retail behaviorchanges to ensure we remain competitive and visible regardless of channel.
Quarterly Performance of Our Business
The beverage market is subject to seasonal variations, and we have typically experiencedmoderately higher levels of our sales in the second and third quarters of the year when demand for ourfunctional beverage products are highest during the warmer months. Our fourth quarter shipments canalso be influenced by our retailer and distributor customers rightsizing their inventory levels after thepeak selling levels of the second and third quarters.
Our sales can also be influenced by the timing of holidays and weather fluctuations. In addition,our financial results may fluctuate from quarter to quarter due to the timing of significant promotionalactivity or programs of our retail customers, on-boarding new retail or distribution partnerships, whichtypically launch with inventory buy-ins, and the timing of new product launches, which may also impactcomparability to prior periods. These factors can also impact our working capital and inventorybalances in each period in ways that may be difficult to forecast. Our goal is to make the right businessdecisions for our long-term success despite fluctuations in quarterly operating results.
Economic Environment & Industry Trends
Our business is healthier where consumers have higher discretionary incomes and are motivatedby health and wellness diets and hydration. Most of our products are at premium prices reflecting theirfunctionality and uniqueness so we do better in more developed economies and major urban areas. Aseconomies continue to develop and education on health and wellness becomes more mainstream, weanticipate our offerings becoming more appealing and endeavor to position our products to benefitfrom such changes.
Impact of COVID-19
The COVID-19 pandemic has caused general business disruption worldwide beginning inJanuary 2020. The full extent to which the COVID-19 pandemic will directly or indirectly impact ourcash flow, business, financial condition, results of operations and prospects will depend on futuredevelopments that are uncertain. From the beginning of this pandemic, our top priority has been thehealth, safety and well-being of our employees. Early in March 2020, we implemented global travel
98

restrictions and work-from-home policies for employees who are able to work remotely. For thoseemployees who are unable to work remotely, safety precautions have been instituted, which weredeveloped and adopted in line with guidance from public health authorities and professionalconsultants. Currently, certain of our offices have been partially reopened, our quality lab continues tooperate under strict protocols, and generally, our field sales teams are working with our distributors andretailers subject to local safety protocols. During the COVID-19 pandemic, we have taken a number ofsteps to support our employees, including increasing employee communications, including topics suchas mental health and family welfare; creating wellness hotlines and enhancing employee assistanceprograms; and conducting employee surveys to evaluate employee morale. We are incredibly proud ofthe teamwork exhibited by our employees, co-packers and distributors around the world who areensuring the integrity of our supply chain. We have experienced some impacts on our inventoryavailability and delivery capacity since the outbreak which have impacted, at times, our ability to fullyservice our customers, including temporary facility shutdowns, local transportation interruptions, andgeneral pressure on global shipping lines. We have taken measures to bolster key aspects of oursupply chain and we continue to work with our supply chain partners to try to ensure our ability toservice our customers. Although not a material impact in the years ended December 31, 2020 and2019, we have also seen significant cost inflation to global shipping costs and some inflationarypressures on other cost elements, only some of which has been covered by pricing actions to date. Forthe six months ended June 30, 2021, we estimate that our EBITDA absorbed incremental costs ofgoods on a rate basis compared to prior year of approximately $8 million, relating to cost increasesacross ocean freight, fulfillment, and shipping expenses as a result of global supply chain disruptionscaused by the COVID-19 pandemic. We expect to see ongoing cost pressures and will evaluateappropriate mitigation measures to protect our business. We do not believe these costs are fullyrepresentative of our costs of goods sold in a normalized environment.
Components of Our Results of Operations
Net Sales
We generate revenue through the sale of our Vita Coco branded coconut water, Private Labeland Other products in the Americas and International segments. Our sales are predominantly made todistributors or to retailers for final sale to consumers through retail channels, which includes sales totraditional brick and mortar retailers, who may also resell our products through their own onlineplatforms. Our revenue is recognized net of allowances for returns, discounts, credits and any taxescollected from consumers.
Cost of Goods Sold
Cost of goods sold includes the costs of the products sold to customers, inbound and outboundshipping and handling costs, freight and duties, shipping and packaging supplies, and warehousefulfillment costs incurred in operating and staffing warehouses.
Gross Profit and Gross Margin
Gross profit is net sales less cost of goods sold, and gross margin is gross profit as a percentageof net sales. Gross profit has been, and will continue to be, affected by various factors, including themix of products we sell, the channel through which we sell our products, the promotional environmentin the marketplace, manufacturing costs, commodity prices and transportation rates. We expect thatour gross margin will fluctuate from period to period depending on the interplay of these variables.
Gross margin is a ratio calculated by dividing gross profit by net sales. Management believesgross margin provides investors with useful information related to the profitability of our business prior
99

to considering all of the operating costs incurred. Management uses gross profit and gross margin askey measures in making financial, operating and planning decisions and in evaluating ourperformance.
Operating Expenses
Selling, General and Administrative Expenses
Selling, general and administrative expenses include marketing expenses, sales promotionexpenses, and general and administrative expenses. Marketing and sales promotion expenses consistprimarily of costs incurred promoting and marketing our products and are primarily driven byinvestments to grow our business and retain customers. We expect selling and marketing expenses toincrease in absolute dollars and to vary from period to period as a percentage of net sales for theforeseeable future. General and administrative expense include payroll, employee benefits, stock-based compensation, broker commissions and other headcount-related expenses associated withsupply chain & operations, finance, information technology, human resources and other administrative-related personnel, as well as general overhead costs of the business, including research anddevelopment for new innovations, rent and related facilities and maintenance costs, depreciation andamortization, and legal, accounting, and professional fees. We expense all selling, general andadministrative expense as incurred. We expect selling, general and administrative expenses toincrease in absolute dollars to support business growth and, in the near term, our transition to a publiccompany.
Change in Fair Value of Contingent Consideration
In connection with our acquisition of Runa, we agreed to pay contingent payments to Runa’sformer shareholders only if a certain revenue growth rate is achieved. Assuming the revenue growth isachieved, the former shareholders could elect for payment to be calculated based on quarterly dataavailable between December 2021 and December 2022, as follows: 49% of the product of (a) the netrevenue for the trailing 12 calendar months and (b) a specified multiple, which is contingent on therevenue growth achieved since December 31, 2017. The contingent consideration payout cannotexceed $51.5 million. If a certain revenue growth rate is not achieved, the Company is not required topay any contingent payment. The contingent consideration payable to Runa’s former shareholders wasre-measured at fair value, which reflects estimates, assumptions, and expectations on Runa’s revenueand revenue growth as of the valuation date. A key factor in the contingent consideration calculation iswhether the growth levels specified in the contract can be met within the four year time periodimmediately following the acquisition. The design of the payout is to reward for high growth in the initialyears following the acquisition. Therefore, the contingent payment reduction, by itself, was notconsidered a triggering event as it measures against growth targets that must be achieved during alimited period, whereas projections used for intangible and goodwill impairment testing consider alonger period of time. Additionally, the Runa brand has been integrated into the Americas operations,and therefore the goodwill was assigned and tested at the Americas reporting unit level. As such, sincethe goodwill is tested at this higher reporting unit level, changes in the individual Runa brandprojections are not indicative of a triggering event for goodwill since Runa sales are an insignificantportion of the overall financial results of the Americas reporting unit. In 2020, we did elect to performthe quantitative assessment. At the Americas reporting unit level, there was significant cushionbetween the fair value of the reporting unit and the carrying value, and therefore, no goodwillimpairment was recorded. As of June 30, 2021 and December 31, 2020, we expect the contingentconsideration to be zero. The contingent consideration will continue to be remeasured until payout inDecember 2022. However, we do not believe that the Runa business will achieve the growth targetsrequired and thus we expect that the contingent consideration will be zero at December 2022.
100

Other Income (Expense), Net
Unrealized Gain/(Loss) on Derivative Instruments
We are subject to foreign currency risks as a result of its inventory purchases and intercompanytransactions. In order to mitigate the foreign currency risks, we and our subsidiaries enter into foreigncurrency exchange contracts which are recorded at fair value. Unrealized gain on derivativeinstruments consists of gains or losses on such foreign currency exchange contracts which areunsettled as of period end. See “—Qualitative and Quantitative Disclosures about Market Risk—Foreign Currency Exchange Risk” for further information.
Foreign Currency Gain/(Loss)
Our reporting currency is the U.S. dollar. We maintain the financial statements of each entity within thegroup in its local currency, which is also the entity’s functional currency. Foreign currency gain/(loss)represents the transaction gains and losses that arise from exchange rate fluctuations on transactionsdenominated in a currency other than the functional currency. See “—Qualitative and QuantitativeDisclosures about Market Risk—Foreign Currency Exchange Risk” for further information.
Interest Income
Interest income consists of interest income earned on our cash and cash equivalents, and moneymarket funds, as well as interest received as part of an interest rate swap which was terminated in May2020.
Interest Expense
Interest expense consists of interests on our credit facilities and term loans.
Income Tax Expense
We are subject to federal and state income taxes in the United States and taxes in foreignjurisdictions in which we operate. We recognize deferred tax assets and liabilities based on temporarydifferences between the financial reporting and income tax bases of assets and liabilities usingstatutory rates. We regularly assess the need to record a valuation allowance against net deferred taxassets if, based upon the available evidence, it is more likely than not that some or all of the deferredtax assets will not be realized.
Operating Segments
We operate in two reporting segments:
• Americas—The Americas segment is comprised of our operations in the Americas region,primarily in the United States and Canada.
• International—The International segment is comprised of our operations primarily in Europe,the Middle East and the Asia Pacific regions.
Each segment derives its revenues from the following product categories:
• Vita Coco Coconut Water—This product category consists of all branded coconut waterproduct offerings under the Vita Coco labels, where the majority ingredient is coconut water.For these products, control is transferred upon customer receipt, at which point the Companyrecognizes the transaction price for the product as revenue.
101
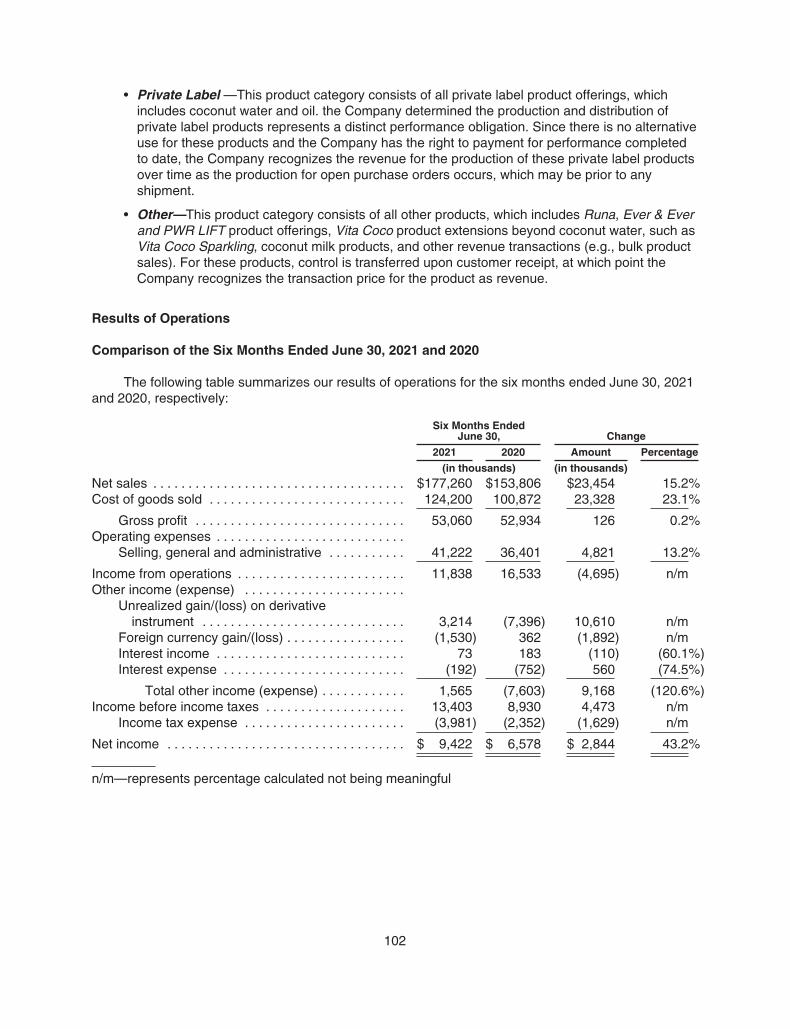
• Private Label —This product category consists of all private label product offerings, whichincludes coconut water and oil. the Company determined the production and distribution ofprivate label products represents a distinct performance obligation. Since there is no alternativeuse for these products and the Company has the right to payment for performance completedto date, the Company recognizes the revenue for the production of these private label productsover time as the production for open purchase orders occurs, which may be prior to anyshipment.
• Other—This product category consists of all other products, which includes Runa, Ever & Everand PWR LIFT product offerings, Vita Coco product extensions beyond coconut water, such asVita Coco Sparkling, coconut milk products, and other revenue transactions (e.g., bulk productsales). For these products, control is transferred upon customer receipt, at which point theCompany recognizes the transaction price for the product as revenue.
Results of Operations
Comparison of the Six Months Ended June 30, 2021 and 2020
The following table summarizes our results of operations for the six months ended June 30, 2021and 2020, respectively:
Six Months EndedJune 30, Change
2021 2020 Amount Percentage
(in thousands) (in thousands)
Net sales . . . . . . . . . . . . . . . . . . . . . . . . . . . . . . . . . . . . $177,260 $153,806 $23,454 15.2%Cost of goods sold . . . . . . . . . . . . . . . . . . . . . . . . . . . . 124,200 100,872 23,328 23.1%
Gross profit . . . . . . . . . . . . . . . . . . . . . . . . . . . . . . 53,060 52,934 126 0.2%Operating expenses . . . . . . . . . . . . . . . . . . . . . . . . . . .
Selling, general and administrative . . . . . . . . . . . 41,222 36,401 4,821 13.2%
Income from operations . . . . . . . . . . . . . . . . . . . . . . . . 11,838 16,533 (4,695) n/mOther income (expense) . . . . . . . . . . . . . . . . . . . . . . .
Unrealized gain/(loss) on derivativeinstrument . . . . . . . . . . . . . . . . . . . . . . . . . . . . . 3,214 (7,396) 10,610 n/m
Foreign currency gain/(loss) . . . . . . . . . . . . . . . . . (1,530) 362 (1,892) n/mInterest income . . . . . . . . . . . . . . . . . . . . . . . . . . . 73 183 (110) (60.1%)Interest expense . . . . . . . . . . . . . . . . . . . . . . . . . . (192) (752) 560 (74.5%)
Total other income (expense) . . . . . . . . . . . . 1,565 (7,603) 9,168 (120.6%)Income before income taxes . . . . . . . . . . . . . . . . . . . . 13,403 8,930 4,473 n/m
Income tax expense . . . . . . . . . . . . . . . . . . . . . . . (3,981) (2,352) (1,629) n/m
Net income . . . . . . . . . . . . . . . . . . . . . . . . . . . . . . . . . . $ 9,422 $ 6,578 $ 2,844 43.2%
n/m—represents percentage calculated not being meaningful
102

Net Sales
The following table provides a comparative summary of net sales by operating segment andproduct category:
Six Months EndedJune 30, Change
2021 2020 Amount Percentage
(in thousands) (in thousands)
Americas segmentVita Coco Coconut Water . . . . . . . . . . . . . . . . . . . $104,405 $ 80,062 $24,343 30.4%Private Label . . . . . . . . . . . . . . . . . . . . . . . . . . . . . 40,485 42,164 (1,679) (4.0%)Other . . . . . . . . . . . . . . . . . . . . . . . . . . . . . . . . . . . 5,110 7,874 (2,764) (35.1%)
Subtotal . . . . . . . . . . . . . . . . . . . . . . . . . . . . . 150,000 130,100 19,900 15.3%
International segmentVita Coco Coconut Water . . . . . . . . . . . . . . . . . . . $ 16,352 $ 13,363 $ 2,989 22.4%Private Label . . . . . . . . . . . . . . . . . . . . . . . . . . . . . 5,531 6,379 (848) (13.3%)Other . . . . . . . . . . . . . . . . . . . . . . . . . . . . . . . . . . . 5,377 3,964 1,413 35.6%
Subtotal . . . . . . . . . . . . . . . . . . . . . . . . . . . . . 27,260 23,706 3,554 15.0%
Total net sales . . . . . . . . . . . . . . . . . . . . $177,260 $153,806 $23,454 15.2%
Volume in Case Equivalent
The primary driver of the consolidated net sales increase of 15.2% was increased shipments. Thefollowing table provides a comparative summary of our shipments in Case Equivalents, or CE, byoperating segment and product category:
Six Months EndedJune 30, Change
2021 2020 Amount Percentage
(in thousands) (in thousands)
Americas segmentVita Coco Coconut Water . . . . . . . . . . . . . . . . . . . . . . . 11,877 9,029 2,848 31.5%Private Label . . . . . . . . . . . . . . . . . . . . . . . . . . . . . . . . . 4,710 4,609 101 2.2%Other . . . . . . . . . . . . . . . . . . . . . . . . . . . . . . . . . . . . . . . 504 943 (439) (46.6%)
Subtotal . . . . . . . . . . . . . . . . . . . . . . . . . . . . . . . . . 17,091 14,581 2,510 17.2%
International segment*Vita Coco Coconut Water . . . . . . . . . . . . . . . . . . . . . . . 2,427 2,036 391 19.2%Private Label . . . . . . . . . . . . . . . . . . . . . . . . . . . . . . . . . 787 854 (67) (7.8%)Other . . . . . . . . . . . . . . . . . . . . . . . . . . . . . . . . . . . . . . . 206 363 (157) (43.2%)
Subtotal . . . . . . . . . . . . . . . . . . . . . . . . . . . . . . . . . 3,420 3,253 167 5.1%
Total volume (CE) . . . . . . . . . . . . . . . . . . . . 20,511 17,834 2,677 15.0%
Note: A CE is a standard volume measure used by management which is defined as a case of 12bottles of 330ml liquid beverages or the same liter volume of oil.
*International Other excludes minor volume of Runa leaves that are treated as zero CE.
103

Americas Segment
Americas net sales increased by $19.9 million, or 15.3%, to $150.0 million for the six monthsended June 30, 2021, from $130.1 million for the six months ended June 30, 2020, primarily driven bya CE volume shipment increase of 17.2%, partially offset by timing of promotional activities. AmericasCE volume shipment growth of Vita Coco Coconut Water was strongest within our DSD channel.
Vita Coco Coconut Water net sales increased by $24.3 million, or 30.4%, to $104.4 million for thesix months ended June 30, 2021, from $80.1 million for the six months ended June 30, 2020. Theincrease was primarily driven by a combination of increased consumer demand, retail execution, andoverall brand strength.
Private Label net sales decreased by $1.7 million, or 4.0%, to $40.5 million for the six monthsended June 30, 2021, from $42.2 million for the six months ended June 30, 2020. Although the overallCE volume shipments increased period over period, there was a mix shift from coconut oil towardscoconut water, which has lower net sales per CE.
Net sales for Other products decreased by $2.8 million, or 35.1%, to $5.1 million for the sixmonths ended June 30, 2021 from $7.9 million for the six months ended June 30, 2020. The decreasewas primarily driven by a decrease in bulk sales and Vita Coco oil.
International Segment
International net sales increased by $3.6 million, or 15.0%, to $27.3 million for the six monthsended June 30, 2021 from $23.7 million for the six months ended June 30, 2020, primarily driven byincreased sales in our European region, which includes a favorable impact related to foreign currencytranslation.
Vita Coco Coconut Water net sales increased by $3.0 million, or 22.4%, to $16.4 million for thesix months ended June 30, 2021, from $13.4 million for the six months ended June 30, 2020.Meanwhile, Private Label net sales decreased by $0.8 million, or 13.3%, to $5.5 million for the sixmonths ended June 30, 2021, as compared to $6.4 million for the six months ended June 30, 2020.The changes in each product category were driven by the movement in CE volume shipments,primarily in the European region.
Net sales for Other products increased by $1.4 million, or 35.6%, to $5.4 million for the sixmonths ended June 30, 2021, from $4.0 million for the six months ended June 30, 2020. The increasewas primarily driven by increases in bulk product sales from our Asia Pacific region.
104

Gross Profit
Six Months EndedJune 30, Change
2021 2020 Amount Percentage
(in thousands) (in thousands)
Cost of goods soldAmericas segment . . . . . . . . . . . . . . . . . . . . . . . . $103,176 $ 84,115 $19,061 22.7%International segment . . . . . . . . . . . . . . . . . . . . . . 21,024 16,757 4,267 25.5%
Total cost of goods sold . . . . . . . . . . . . . . . . $124,200 $100,872 $23,328 23.1%
Gross profitAmericas segment . . . . . . . . . . . . . . . . . . . . . . . . $ 46,824 $ 45,985 $ 839 1.8%International segment . . . . . . . . . . . . . . . . . . . . . . 6,236 6,949 (713) (10.3%)
Total gross profit . . . . . . . . . . . . . . . . . . . . . . $ 53,060 $ 52,934 $ 126 0.2%
Gross marginAmericas segment . . . . . . . . . . . . . . . . . . . . . . . . 31.2% 35.3% (4.1%)International segment . . . . . . . . . . . . . . . . . . . . . . 22.9% 29.3% (6.4%)
Consolidated . . . . . . . . . . . . . . . . . . . . . . . . . 29.9% 34.4% (4.5%)
On a consolidated basis, cost of goods sold increased $23.3 million, or 23.1%, to $124.2 millionfor six months ended June 30, 2021, from $100.9 million for the six months ended June 30, 2020. On aconsolidated and segment basis, the increase was primarily driven by CE volume shipments andsignificant transportation costs inflation over the last six months of 2021, specifically related to oceanfreight costs due to shipping and port constraints related to the COVID-19 pandemic.
On a consolidated basis, gross profit dollars were flat for the six months ended June 30, 2021compared to June 30, 2020. Although we delivered strong top line growth of 15.0% driven by continuedunderlying strength of our Vita Coco brand, this was offset by significant ocean freight costs. Grossmargin was 29.9% for the six months ended June 30, 2021, as compared to 34.4% for the six monthsended June 30, 2020. The approximate 450 basis points decline was driven by the cost increasesacross ocean freight, fulfillment, and shipping expenses as a result of the COVID-19 pandemic, whichwas partly offset by the positive impact of higher volume in the Americas and International.
Operating Expenses
Six Months EndedJune 30, Change
2021 2020 Amount Percentage
(in thousands) (in thousands)
Selling, general and administrative . . . . . . . . . . . . . . . . . . . 41,222 36,401 4,821 13.2%
n/m—represents percentage calculated not being meaningful
Selling, General and Administrative Expenses
Selling, general and administrative, or SG&A, expense increased by $4.8 million, or 13.2%, to$41.2 million for the six months ended June 30, 2021, from $36.4 million for the six months endedJune 30, 2020. The increase was primarily driven by a $1.4 million increase in marketing for the sixmonths ended June 30, 2021 compared to the six months ended June 30, 2020, a $1.8 millionincrease in personnel related expenses, and a $2.0 million increase related to various professionalfees including our public company readiness preparation.
105

Other Income (Expense), NetSix Months Ended
June 30, Change
2021 2020 Amount Percentage
(in thousands) (in thousands)
Unrealized gain/(loss) on derivative instruments . . . . . . . $ 3,214 $(7,396) $10,610 n/mForeign currency gain/(loss) . . . . . . . . . . . . . . . . . . . . . . . (1,530) 362 (1,892) n/mInterest income . . . . . . . . . . . . . . . . . . . . . . . . . . . . . . . . . . 73 183 (110) (60.1%)Interest expense . . . . . . . . . . . . . . . . . . . . . . . . . . . . . . . . . (192) (752) 560 (74.5%)
$ 1,565 $(7,603) $ 9,168 (120.6%)
n/m—represents percentage calculated not being meaningful
Unrealized Gain/(Loss) on Derivative Instruments
During the six months ended June 30, 2021, we recorded gains of $3.2 million relating tounrealized gains on outstanding derivative instruments for forward foreign currency exchangecontracts. During the six months ended June 30, 2020, we recorded losses of $7.4 million relating tounrealized loss on our outstanding derivative instruments for forward foreign currency exchangecontracts. All forward foreign currency exchange contracts were entered to hedge some of ourexposures to the British pound, Canadian dollar, Brazilian real and Thai baht.
Foreign Currency Gain/(Loss)
Foreign currency loss was $1.5 million for the six months ended June 30, 2021, as compared to$0.4 million gain for the six months ended June 30, 2020. The change in both years was a result ofmovements in various foreign currency exchange rates related to transactions denominated incurrencies other than the functional currency.
Interest Income
Interest income decreased by $0.1 million, or 60.1%, to $0.1 million for the six months endedJune 30, 2021, from $0.2 million for the six months ended June 30, 2020. The decrease was primarilydriven by an amended interest rate from 1.78% to 0.58% on the loan to the co-CEO described in thenotes of the consolidated financial statements and in “Certain Relationships and Related PartyTransactions—Loan to Officer.”
Interest Expense
Interest expense decreased by $0.6 million, or 74.5%, to $0.2 million for the six months endedJune 30, 2021, from $0.8 million for the six months ended June 30, 2020. The decrease was primarilydriven by non-recurring interest expense upon the settlement of an interest rate swap in May 2020which impacted our interest expense by $0.5 million in the six months ended June 30, 2020, which didnot repeat in the six months ended June 30, 2021.
Income Tax ExpenseSix Months Ended
June 30, Change
2021 2020 Amount Percentage
(in thousands) (in thousands)
Income tax expense . . . . . . . . . . . . . . . . . . . . . . . . . . . . . . $(3,981) $(2,352) $(1,629) n/m
n/m—represents percentage calculated not being meaningful
106
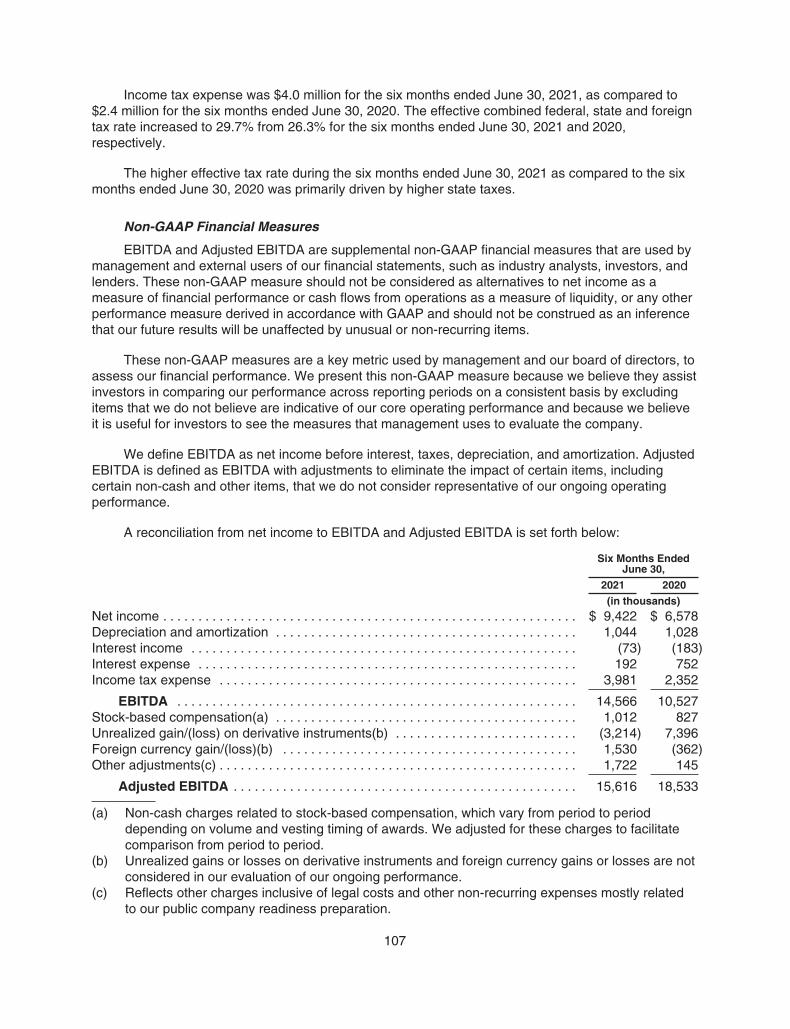
Income tax expense was $4.0 million for the six months ended June 30, 2021, as compared to$2.4 million for the six months ended June 30, 2020. The effective combined federal, state and foreigntax rate increased to 29.7% from 26.3% for the six months ended June 30, 2021 and 2020,respectively.
The higher effective tax rate during the six months ended June 30, 2021 as compared to the sixmonths ended June 30, 2020 was primarily driven by higher state taxes.
Non-GAAP Financial Measures
EBITDA and Adjusted EBITDA are supplemental non-GAAP financial measures that are used bymanagement and external users of our financial statements, such as industry analysts, investors, andlenders. These non-GAAP measure should not be considered as alternatives to net income as ameasure of financial performance or cash flows from operations as a measure of liquidity, or any otherperformance measure derived in accordance with GAAP and should not be construed as an inferencethat our future results will be unaffected by unusual or non-recurring items.
These non-GAAP measures are a key metric used by management and our board of directors, toassess our financial performance. We present this non-GAAP measure because we believe they assistinvestors in comparing our performance across reporting periods on a consistent basis by excludingitems that we do not believe are indicative of our core operating performance and because we believeit is useful for investors to see the measures that management uses to evaluate the company.
We define EBITDA as net income before interest, taxes, depreciation, and amortization. AdjustedEBITDA is defined as EBITDA with adjustments to eliminate the impact of certain items, includingcertain non-cash and other items, that we do not consider representative of our ongoing operatingperformance.
A reconciliation from net income to EBITDA and Adjusted EBITDA is set forth below:
Six Months EndedJune 30,
2021 2020
(in thousands)
Net income . . . . . . . . . . . . . . . . . . . . . . . . . . . . . . . . . . . . . . . . . . . . . . . . . . . . . . . . . . . $ 9,422 $ 6,578Depreciation and amortization . . . . . . . . . . . . . . . . . . . . . . . . . . . . . . . . . . . . . . . . . . . 1,044 1,028Interest income . . . . . . . . . . . . . . . . . . . . . . . . . . . . . . . . . . . . . . . . . . . . . . . . . . . . . . . (73) (183)Interest expense . . . . . . . . . . . . . . . . . . . . . . . . . . . . . . . . . . . . . . . . . . . . . . . . . . . . . . 192 752Income tax expense . . . . . . . . . . . . . . . . . . . . . . . . . . . . . . . . . . . . . . . . . . . . . . . . . . . 3,981 2,352
EBITDA . . . . . . . . . . . . . . . . . . . . . . . . . . . . . . . . . . . . . . . . . . . . . . . . . . . . . . . . . 14,566 10,527Stock-based compensation(a) . . . . . . . . . . . . . . . . . . . . . . . . . . . . . . . . . . . . . . . . . . . 1,012 827Unrealized gain/(loss) on derivative instruments(b) . . . . . . . . . . . . . . . . . . . . . . . . . . (3,214) 7,396Foreign currency gain/(loss)(b) . . . . . . . . . . . . . . . . . . . . . . . . . . . . . . . . . . . . . . . . . . 1,530 (362)Other adjustments(c) . . . . . . . . . . . . . . . . . . . . . . . . . . . . . . . . . . . . . . . . . . . . . . . . . . . 1,722 145
Adjusted EBITDA . . . . . . . . . . . . . . . . . . . . . . . . . . . . . . . . . . . . . . . . . . . . . . . . . 15,616 18,533
(a) Non-cash charges related to stock-based compensation, which vary from period to perioddepending on volume and vesting timing of awards. We adjusted for these charges to facilitatecomparison from period to period.
(b) Unrealized gains or losses on derivative instruments and foreign currency gains or losses are notconsidered in our evaluation of our ongoing performance.
(c) Reflects other charges inclusive of legal costs and other non-recurring expenses mostly relatedto our public company readiness preparation.
107

Comparison of the Years Ended December 31, 2020 and 2019
The following table summarizes our results of operations for the years ended December 31, 2020and 2019, respectively:
Year EndedDecember 31, Change
2020 2019 Amount Percentage
(in thousands) (in thousands)
Net Sales . . . . . . . . . . . . . . . . . . . . . . . . . . . . . . . . . . . . $310,644 $283,949 $ 26,695 9.4%Cost of goods sold . . . . . . . . . . . . . . . . . . . . . . . . . . . . 205,786 190,961 14,825 7.8%
Gross Profit . . . . . . . . . . . . . . . . . . . . . . . . . . . . . . 104,858 92,988 11,870 12.8%Operating Expenses:
Selling, general and administrative . . . . . . . . . . . 74,401 78,917 (4,516) (5.7%)Change in contingent consideration liability . . . . (16,400) 700 (17,100) n/m
Total operating expenses . . . . . . . . . . . . . . . 58,001 79,617 (21,616) (27.1%)Income from operations . . . . . . . . . . . . . . . . . . . . . . . . 46,857 13,371 33,486 n/mOther income (expense)
Unrealized loss on derivative instrument . . . . . . . (4,718) (1,233) (3,485) n/mForeign currency gain . . . . . . . . . . . . . . . . . . . . . . 1,848 201 1,647 n/mInterest income . . . . . . . . . . . . . . . . . . . . . . . . . . . 404 225 179 79.5%Interest expense . . . . . . . . . . . . . . . . . . . . . . . . . . (791) (1,163) 372 (32.0%)
Total other income (expense) . . . . . . . . . . . . (3,257) (1,970) (1,287) 65.3%Income before income taxes . . . . . . . . . . . . . . . . . . . . 43,600 11,401 32,199 n/m
Provision for income taxes . . . . . . . . . . . . . . . . . . (10,913) (1,979) (8,934) n/m
Net income . . . . . . . . . . . . . . . . . . . . . . . . . . . . . . . . . . $ 32,687 $ 9,422 $ 23,265 246.9%
n/m—represents percentage calculated not being meaningful
Net Sales
The following table provides a comparative summary of the Company’s net sales by operatingsegment and product category (in thousands):
Year EndedDecember 31, Change
2020 2019 Amount Percentage
(in thousands) (in thousands)
Americas segmentVita Coco Coconut Water . . . . . . . . . . . . . . . . . . . $164,786 $151,045 $13,741 9.1%Private Label . . . . . . . . . . . . . . . . . . . . . . . . . . . . . $ 83,449 $ 71,774 $11,675 16.3%Other . . . . . . . . . . . . . . . . . . . . . . . . . . . . . . . . . . . $ 14,664 $ 14,596 $ 68 0.5%
Subtotal . . . . . . . . . . . . . . . . . . . . . . . . . . . . . 262,899 237,415 25,484 10.7%
International segmentVita Coco Coconut Water . . . . . . . . . . . . . . . . . . . $ 27,167 $ 31,742 $ (4,575) (14.4%)Private Label . . . . . . . . . . . . . . . . . . . . . . . . . . . . . $ 12,596 $ 10,903 $ 1,693 15.5%Other . . . . . . . . . . . . . . . . . . . . . . . . . . . . . . . . . . . $ 7,982 $ 3,889 $ 4,093 105.2%
Subtotal . . . . . . . . . . . . . . . . . . . . . . . . . . . . . 47,745 46,534 1,211 2.6%
Total net sales . . . . . . . . . . . . . . . . . . . . $310,644 $283,949 $26,695 9.4%
108

Volume in Case Equivalent
The primary driver of the consolidated net sales increase of 9.4% was driven by increasedshipments. The following table provides a comparative summary of our shipments in Case Equivalents,or CE, by operating segment and product category (in thousands):
Year EndedDecember 31, Change
2020 2019 Amount Percentage
(in thousands) (in thousands)
Americas segmentVita Coco Coconut Water . . . . . . . . . . . . . . . . . . . . . . . 18,690 17,082 1,609 9.4%Private Label . . . . . . . . . . . . . . . . . . . . . . . . . . . . . . . . . 9,431 8,000 1,431 17.9%Other . . . . . . . . . . . . . . . . . . . . . . . . . . . . . . . . . . . . . . . 1,650 1,479 171 11.5%
Subtotal . . . . . . . . . . . . . . . . . . . . . . . . . . . . . . . . . 29,771 26,561 3,211 12.1%
International segment*Vita Coco Coconut Water . . . . . . . . . . . . . . . . . . . . . . . 4,146 5,024 (878) (17.5%)Private Label . . . . . . . . . . . . . . . . . . . . . . . . . . . . . . . . . 1,707 1,509 198 13.1%Other . . . . . . . . . . . . . . . . . . . . . . . . . . . . . . . . . . . . . . . 634 418 216 51.5%
Subtotal . . . . . . . . . . . . . . . . . . . . . . . . . . . . . . . . . 6,486 6,951 (465) (6.7%)
Total volume (CE) . . . . . . . . . . . . . . . . . . . . . 36,258 33,512 2,746 8.2%
Note: A CE is a standard volume measure used by management which is defined as a case of 12bottles of 330ml liquid beverages or the same liter volume of oil.
*International Other excludes minor volume of Runa leaves that are treated as zero CE.
Americas Segment
Americas CE volume shipments of Vita Coco Coconut Water were strongest in DTW and otherchannels outside of DSD due to consumer purchasing behavior shifting to club and overall strength ine-commerce. Sales in DSD channel grew more modestly as they were impacted by temporaryweaknesses in convenience, drug and local independent retailers, which we believe was primarilydriven by COVID-19 pandemic related lower foot traffic.
Americas net sales increased by $25.5 million, or 10.7%, to $262.9 million for the year endedDecember 31, 2020, from $237.4 million for the year ended December 31, 2019, primarily driven by CEvolume shipment increase of 12.1%, slightly offset by lower price realization per CE due to increasedprice promotions and changes in package mix.
Vita Coco Coconut Water net sales increased by $13.7 million, or 9.1%, to $164.8 million for theyear ended December 31, 2020, from $151.0 million for the year ended December 31, 2019. Theincrease was primarily driven by a combination of increased consumer demand, retail execution, andoverall brand strength.
Private Label net sales increased by $11.7 million, or 16.3%, to $83.4 million for the year endedDecember 31, 2020, from $71.8 million for the year ended December 31, 2019. The increase wasprimarily driven by increased consumer demand across both our Private Label water and Private Labeloil categories.
Net Sales for Other products increased by $0.1 million, or 0.5%, to $14.7 million for the yearended December 31, 2020, from $14.6 million for the year ended December 31, 2019. The increase
109

was primarily driven by increased sales volume of our coconut milk product category, which was partlyoffset by decreases in sales of both Runa and Vita Coco sparkling waters as we reformulated andrelaunched both products.
International Segment
International net sales increased by $1.2 million, or 2.6%, to $47.7 million for the year endedDecember 31, 2020 from $46.5 million for the year ended December 31, 2019, primarily driven byincreased sales in our Asia Pacific region and partially offset by decreased sales in our Europeanregion.
Vita Coco Coconut Water net sales decreased by $4.6 million, or 14.4%, to $27.2 million for theyear ended December 31, 2020, from $31.7 million for the year ended December 31, 2019. Thedecrease was driven by a decline in sales in both Europe and Asia Pacific as we saw impact from theextended COVID-19 shutdown in relation to consumer purchasing behavior as well as within oursupply chain and inventory. We also shifted our strategic priorities and, as a result, restructured someof our key markets in these regions.
Private Label net sales increased by $1.7 million, or 15.5%, to $12.6 million for the year endedDecember 31, 2020, as compared to $10.9 million for the year ended December 31, 2019. Theincrease was primarily driven by our coconut oil product category.
Net Sales for Other products increased by $4.1 million, or 105.2%, to $8 million for the yearended December 31, 2020, from $3.9 million for the year ended December 31, 2019. The increase wasprimarily driven by increases in bulk product sales from our Asia Pacific region.
Gross Profit
Year EndedDecember 31, Change
2020 2019 Amount Percentage
(in thousands) (in thousands)
Cost of goods soldAmericas segment . . . . . . . . . . . . . . . . . . . . . . . . $172,644 $156,697 $15,947 10.2%International segment . . . . . . . . . . . . . . . . . . . . . . 33,142 34,264 (1,122) (3.3%)
Total cost of goods sold . . . . . . . . . . . . . . . . $205,786 $190,961 $14,825 7.8%
Gross profitAmericas segment . . . . . . . . . . . . . . . . . . . . . . . . $ 90,256 $ 80,718 $ 9,538 11.8%International segment . . . . . . . . . . . . . . . . . . . . . . 14,602 12,270 2,332 19.0%
Total gross profit . . . . . . . . . . . . . . . . . . . . . . $104,858 $ 92,988 $11,870 12.8%
Gross marginAmericas segment . . . . . . . . . . . . . . . . . . . . . . . . 34.3% 34.0% 0.3%International segment . . . . . . . . . . . . . . . . . . . . . . 30.6% 26.4% 4.2%
Consolidated . . . . . . . . . . . . . . . . . . . . . . . . . 33.8% 32.7% 1.0%
On a consolidated basis, cost of goods sold increased $14.8 million, or 7.8%, to $205.8 million forthe year ended December 31, 2020, from $191 million for the year ended December 31, 2019. On aconsolidated and segment basis, the changes year over year were primarily driven by CE volumeshipments.
110

On a consolidated basis, gross profit increased by $11.9 million, or 12.8%, to $104.9 million forthe year ended December 31, 2020, from $93 million for the year ended December 31, 2019. Theincrease was primarily driven by increased sales volume. Gross margin was 33.8% for the year endedDecember 31, 2020, as compared to 32.7% for the year ended December 31, 2019. The approximate100 basis points improvement was driven by the positive impact of higher volume in the Americas,positive mix shift towards higher gross profit markets within our International segment, partially offsetby cost increase across ocean freight, fulfillment, and shipping expenses as a result of the COVID-19pandemic.
Operating Expenses
Year EndedDecember 31, Change
2020 2019 Amount Percentage
(in thousands) (in thousands)
Selling, general and administrative . . . . . . . . . . . . . . . . 74,401 78,917 (4,516) (5.7%)Change in fair value of contingent consideration . . . . . (16,400) 700 (17,100) n/m
$ 58,001 $79,617 $(21,616) (27.1%)
n/m—represents percentage calculated not being meaningful
Selling, General and Administrative Expenses
SG&A expense decreased by $4.5 million, or 5.7%, to $74.4 million for the year endedDecember 31, 2020, from $78.9 million for the year ended December 31, 2019. The decrease of wasprimarily driven by a $6.1 million decrease in marketing in connection with our media spend strategyshift during the COVID-19 pandemic as well as right sizing of our marketing investments on the Runabrand, a $2.5 million decrease in travel and entertainment expenses due to travel restrictionsassociated with the COVID-19 pandemic, offset by a $2.4 million increase in personnel relatedexpenses and a $0.9 million increase in broker commissions.
Change in Fair Value of Contingent Consideration
Change in fair value of contingent consideration was a gain of $16.4 million for the year endedDecember 31, 2020, as compared to a loss of $0.7 million for the year ended December 31, 2019. Thegain recorded during the year ended December 31, 2020 was the result of lower performanceexpectations during the earn-out period for Runa resulting in revaluation of the contingentconsideration liability to $0 as of December 31, 2020.
Other Income (Expense), Net
Year EndedDecember 31, Change
2020 2019 Amount Percentage
(in thousands) (in thousands)
Unrealized (loss) on derivative instruments . . . . . . . . . . . $(4,718) $(1,233) $(3,485) n/mForeign currency gain . . . . . . . . . . . . . . . . . . . . . . . . . . . . 1,848 201 1,647 n/mInterest income . . . . . . . . . . . . . . . . . . . . . . . . . . . . . . . . . . 404 225 179 79.5%Interest expense . . . . . . . . . . . . . . . . . . . . . . . . . . . . . . . . . (791) (1,163) 372 (32.0%)
$(3,257) $(1,970) $(1,287) 65.3%
n/m—represents percentage calculated not being meaningful
111

Unrealized Loss on Derivative Instruments
During the year ended December 31, 2020, we recorded losses of $4.7 million relating tounrealized loss on its outstanding derivative instruments for forward foreign currency exchangecontracts. During the year ended December 31, 2019, we recorded losses of $1.2 million relating tounrealized loss on its outstanding derivative instruments for forward foreign currency exchangecontracts. All forward foreign currency exchange contracts were entered to hedge some of ourexposures to the British pound, Canadian dollar, Brazilian Real and Tai Baht.
Foreign Currency Gain
Foreign currency gain was $1.8 million for the year ended December 31, 2020, as compared to$0.2 million for the year ended December 31, 2019. The gain in both years was a result of favorablemovements in various foreign currency exchange rates related to transactions denominated incurrencies other than the functional currency.
Interest Income
Interest income increased by $0.2 million, or 79.5%, to $0.4 million for the year endedDecember 31, 2020, from $0.2 million for the year ended December 31, 2019. The increase wasprimarily driven by increased amount of cash invested in overnight money market treasury depositsduring the year ended December 31, 2020.
Interest Expense
Interest expense decreased by $0.4 million, or 32%, to $0.8 million for the year endedDecember 31, 2020, from $1.2 million for the year ended December 31, 2019. The decrease wasdriven by lower weighted average borrowings outstanding during the year, partially offset byincremental interest expense upon the settlement of an interest rate swap in May 2020 which impactedour interest expense by $0.5 million.
Income Tax Expense
Year EndedDecember 31, Change
2020 2019 Amount Percentage
(in thousands) (in thousands)
Income tax expense . . . . . . . . . . . . . . . . . . . . . . . . . . . . . $(10,913) $(1,979) $(8,934) n/m
n/m—represents percentage calculated not being meaningful
Income tax expense was $10.9 million for the year ended December 31, 2020, as compared to$2.0 million for the year ended December 31, 2019. The effective combined federal, state and foreigntax rate increased to 25% from 17.4% for the years ended December 31, 2020, and 2019, respectively.
The higher effective tax rate during the year ended December 31, 2020 as compared to the yearended December 31, 2019 was primarily driven by increase in state tax expense and the expiration oftax attribute carryforwards during the year ended December 31, 2020, as well as a non-recurring netbenefit from return to provision true-ups recorded during the year ended December 31, 2019.
Non-GAAP Financial Measures
EBITDA and Adjusted EBITDA are supplemental non-GAAP financial measures that are used bymanagement and external users of our financial statements, such as industry analysts, investors, and
112

lenders. These non-GAAP measure should not be considered as alternatives to net income as ameasure of financial performance or cash flows from operations as a measure of liquidity, or any otherperformance measure derived in accordance with GAAP and should not be construed as an inferencethat our future results will be unaffected by unusual or non-recurring items.
These non-GAAP measures are a key metric used by management and our board of directors, toassess our financial performance. We present this non-GAAP measure because we believe they assistinvestors in comparing our performance across reporting periods on a consistent basis by excludingitems that we do not believe are indicative of our core operating performance and because we believeit is useful for investors to see the measures that management uses to evaluate the company.
We define EBITDA as net income before interest, taxes, depreciation, and amortization. AdjustedEBITDA is defined as EBITDA with adjustments to eliminate the impact of certain items, includingcertain non-cash and other items, that we do not consider representative of our ongoing operatingperformance.
A reconciliation from net income to EBITDA and Adjusted EBITDA is set forth below:
Year EndedDecember 31,
2020 2019
(in thousands)Net income . . . . . . . . . . . . . . . . . . . . . . . . . . . . . . . . . . . . . . . . . . . . . . . . . . . . . . . . . . $ 32,687 $ 9,422Depreciation and amortization . . . . . . . . . . . . . . . . . . . . . . . . . . . . . . . . . . . . . . . . . . 2,125 2,082Interest income . . . . . . . . . . . . . . . . . . . . . . . . . . . . . . . . . . . . . . . . . . . . . . . . . . . . . . . (404) (225)Interest expense . . . . . . . . . . . . . . . . . . . . . . . . . . . . . . . . . . . . . . . . . . . . . . . . . . . . . . 791 1,163Income tax expense . . . . . . . . . . . . . . . . . . . . . . . . . . . . . . . . . . . . . . . . . . . . . . . . . . . 10,913 1,979
EBITDA . . . . . . . . . . . . . . . . . . . . . . . . . . . . . . . . . . . . . . . . . . . . . . . . . . . . . . . . . 46,112 14,421Stock-based compensation(a) . . . . . . . . . . . . . . . . . . . . . . . . . . . . . . . . . . . . . . . . . . 1,517 2,227Unrealized loss on derivative instruments(b) . . . . . . . . . . . . . . . . . . . . . . . . . . . . . . . 4,718 1,233Foreign currency gain/(loss)(b) . . . . . . . . . . . . . . . . . . . . . . . . . . . . . . . . . . . . . . . . . . (1,848) (201)Change in fair value of contingent consideration(c) . . . . . . . . . . . . . . . . . . . . . . . . . (16,400) 700Other adjustments(d) . . . . . . . . . . . . . . . . . . . . . . . . . . . . . . . . . . . . . . . . . . . . . . . . . . 967 1,690
Adjusted EBITDA . . . . . . . . . . . . . . . . . . . . . . . . . . . . . . . . . . . . . . . . . . . . . . . . $ 35,066 $20,070
(a) Non-cash charges related to stock-based compensation, which vary from period to perioddepending on volume and vesting timing of awards. We adjusted for these charges to facilitatecomparison from period to period.
(b) Unrealized gains or losses on derivative instruments and foreign currency gains or losses are notconsidered in our evaluation of our ongoing performance.
(c) Non-cash income/charge related to the changes in fair value of the contingent considerationliability related to Runa, which we do not consider in our evaluation of ongoing performance.
(d) Reflects other charges inclusive of legal costs, restructuring, and other non-recurring charges.
Liquidity and Capital Resources
Since our inception, we have financed our operations primarily through cash generated from ourbusiness operations and proceeds on borrowings through our credit facilities and term loans. We had$19.4 million and $26.7 million of cash and cash equivalents as of June 30, 2021 and 2020,respectively. We had $72.2 million and $36.7 million of cash and cash equivalents as of December 31,2020 and 2019, respectively. We believe that our existing cash and cash equivalent balances will besufficient to support operating and capital requirements for at least the next 12 months. Wesupplemented our liquidity needs with incremental borrowing capacity under the Term Facility and theRevolving Facility, which we amended in May 2021.
113
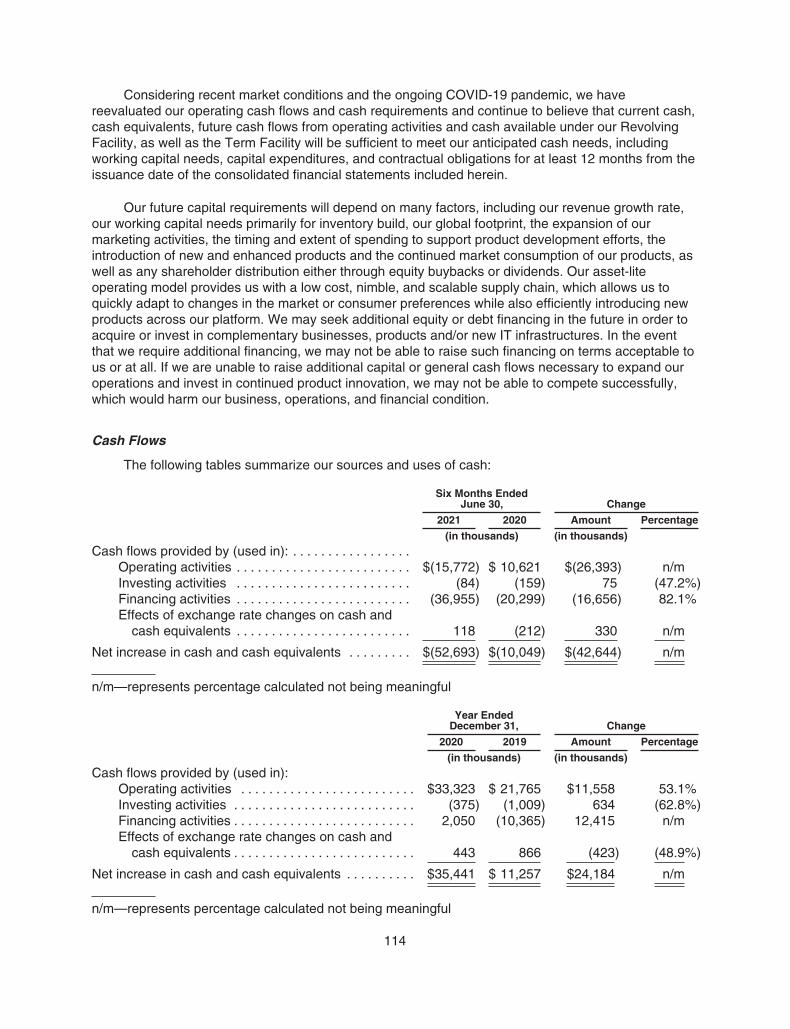
Considering recent market conditions and the ongoing COVID-19 pandemic, we havereevaluated our operating cash flows and cash requirements and continue to believe that current cash,cash equivalents, future cash flows from operating activities and cash available under our RevolvingFacility, as well as the Term Facility will be sufficient to meet our anticipated cash needs, includingworking capital needs, capital expenditures, and contractual obligations for at least 12 months from theissuance date of the consolidated financial statements included herein.
Our future capital requirements will depend on many factors, including our revenue growth rate,our working capital needs primarily for inventory build, our global footprint, the expansion of ourmarketing activities, the timing and extent of spending to support product development efforts, theintroduction of new and enhanced products and the continued market consumption of our products, aswell as any shareholder distribution either through equity buybacks or dividends. Our asset-liteoperating model provides us with a low cost, nimble, and scalable supply chain, which allows us toquickly adapt to changes in the market or consumer preferences while also efficiently introducing newproducts across our platform. We may seek additional equity or debt financing in the future in order toacquire or invest in complementary businesses, products and/or new IT infrastructures. In the eventthat we require additional financing, we may not be able to raise such financing on terms acceptable tous or at all. If we are unable to raise additional capital or general cash flows necessary to expand ouroperations and invest in continued product innovation, we may not be able to compete successfully,which would harm our business, operations, and financial condition.
Cash Flows
The following tables summarize our sources and uses of cash:
Six Months EndedJune 30, Change
2021 2020 Amount Percentage
(in thousands) (in thousands)
Cash flows provided by (used in): . . . . . . . . . . . . . . . . .Operating activities . . . . . . . . . . . . . . . . . . . . . . . . . $(15,772) $ 10,621 $(26,393) n/mInvesting activities . . . . . . . . . . . . . . . . . . . . . . . . . (84) (159) 75 (47.2%)Financing activities . . . . . . . . . . . . . . . . . . . . . . . . . (36,955) (20,299) (16,656) 82.1%Effects of exchange rate changes on cash and
cash equivalents . . . . . . . . . . . . . . . . . . . . . . . . . 118 (212) 330 n/m
Net increase in cash and cash equivalents . . . . . . . . . $(52,693) $(10,049) $(42,644) n/m
n/m—represents percentage calculated not being meaningful
Year EndedDecember 31, Change
2020 2019 Amount Percentage
(in thousands) (in thousands)
Cash flows provided by (used in):Operating activities . . . . . . . . . . . . . . . . . . . . . . . . . $33,323 $ 21,765 $11,558 53.1%Investing activities . . . . . . . . . . . . . . . . . . . . . . . . . . (375) (1,009) 634 (62.8%)Financing activities . . . . . . . . . . . . . . . . . . . . . . . . . . 2,050 (10,365) 12,415 n/mEffects of exchange rate changes on cash and
cash equivalents . . . . . . . . . . . . . . . . . . . . . . . . . . 443 866 (423) (48.9%)
Net increase in cash and cash equivalents . . . . . . . . . . $35,441 $ 11,257 $24,184 n/m
n/m—represents percentage calculated not being meaningful
114

Operating Activities
Our main source of operating cash is payments received from our customers. Our primary use ofcash in operating activities are for cost of goods sold and SG&A expenses.
During the six months ended June 30, 2021, net cash used in operating activities was$15.8 million, consisting of net income of $9.4 million, net unfavorable changes in our operating assetsand liabilities of $24.1 million and non-cash adjustments of $1.1 million. Non-cash adjustmentsprimarily consisted of unrealized gain on derivative instruments of $3.2 million, partially offset bydepreciation and amortization of $1.0 million, and stock-based compensation of $1.0 million.
During the six months ended June 30, 2020, net cash provided by operating activities was$10.6 million, consisting of net income of $6.6 million and net unfavorable changes in our operatingassets and liabilities of $5.4 million, offset by non-cash adjustments of $9.4 million. Non-cashadjustments primarily consisted of unrealized loss on derivative instruments of $7.4 million,depreciation and amortization of $1.0 million, and stock-based compensation of $0.8 million.
The unfavorable changes in our operating assets and liabilities during the six months endedJune 30, 2021 as compared to the six months ended June 30, 2020 were primarily a result of changesin working capital. Reflected in working capital changes for the six months ended June 30, 2021 wereincreased inventories in the first half of 2021 which we rebuilt after finishing December 2020 with verylow inventory levels, increased accounts receivable due to increased sales volume, increased accruedtrade promotions due to increased sales volumes and related promotions, and increases inprepayments to suppliers to secure inventory due to increased demand. Reflected in working capitalchanges for the six months ended June 30, 2020 were decreased inventories due to constrainedsupply during the COVID-19 pandemic, increased accrued trade promotions due to increased salesvolumes and related promotions, increased accounts receivable driven by increased sales volume,increased other current assets due to the increase in contract assets for the recognition of private labelrevenue, and increased net advances to suppliers to secure inventory due to increased demand.
During the year ended December 31, 2020, net cash provided by operating activities was$33.3 million, consisting of net income of $32.7 million and changes in our operating assets andliabilities of $1.5 million, partially offset by non-cash adjustments of $0.8 million. Non-cash adjustmentsprimarily consisted of a change in fair value of contingent consideration of $16.4 million, partially offsetby deferred tax expense of $6.3 million, unrealized loss on derivative instruments of $4.7 million,depreciation and amortization of $2.1 million, and stock-based compensation of $1.5 million.
During the year ended December 31, 2019, net cash provided by operating activities was$21.8 million, consisting of net income of $9.4 million, non-cash adjustments of $6.8 million, andchanges in our operating assets and liabilities of $5.6 million. Non-cash adjustments primarilyconsisted of depreciation and amortization of $2.1 million, stock-based compensation of $2.2 million,bad debt expense of $1.3 million, and unrealized loss on derivative instruments of $1.2 million.
The unfavorable changes in our operating assets and liabilities during the year endedDecember 31, 2020, as compared to the year ended December 31, 2019 were primarily a result ofchanges in working capital. Reflected in working capital changes for the year ended December 31,2020 were decreased inventories due to growing demand and inventory constraints driven by theCOVID-19 pandemic, increased accrued trade promotions due to increased sales volumes and relatedpromotions and increased accrued compensation due to higher bonus achievement compared to prioryear, increases in prepayments to suppliers to secure inventory due to increased demand, andincreased tax receivables due to overpayment. Reflected in working capital changes for the year endedDecember 31, 2019 were decreased inventories resulting from our sales performance and
115
management efforts to manage inventories more efficiently compared to prior years and an increase inaccounts receivable driven by management efforts to improve working capital by recovering oldoutstanding receivables in both our Americas and International segments.
Investing Activities
During the six months ended June 30, 2021 and 2020, cash used in investing activities was$0.1 million and $0.2 million, respectively, primarily driven by cash paid for property and equipment.
During the year ended December 31, 2020, cash used in investing activities was $0.4 million,primarily driven by cash paid for property and equipment of $0.4 million.
During the year ended December 31, 2019, cash used in investing activities was $1.0 million,driven by cash paid for property and equipment.
Financing Activities
During the six months ended June 30, 2021, net cash used in financing activities was$37.0 million, resulting from $50.0 million paid to acquire 11,411 shares of treasury stock from RW VCS.a.r.l, a principal stockholder of ours, net $17.0 million cash paid from borrowings and repayments onthe Revolving Facility, partially offset by cash proceeds of $30.0 million received under the 2021 TermLoan. For further discussion of the stock repurchase, see “Certain Relationships and Related PartyTransactions—Share Repurchase”.
During the six months ended June 30, 2020, net cash used in financing activities was$20.1 million, resulting from $16.9 million relating to the repayment of outstanding indebtedness underour previous term loan facilities, or the Prior Term Facilities and $4.2 million paid to acquire treasurystock, partially offset by $0.8 million from the exercise of stock options and warrants.
During the year ended December 31, 2020, net cash from financing activities was $2.1 million,resulting from $25.0 million proceeds from the Revolving Facility and $0.9 million from the exercise ofstock options and warrants, partially offset by $16.9 million relating to the repayment of outstandingindebtedness under our Prior Term Facilities, and $6.9 million paid to acquire treasury stock.
During the year ended December 31, 2019, net cash used in financing activities was $10.4 millionresulting from repayment of $7.0 million of indebtedness outstanding under our prior revolving creditfacility and $3.4 million related to payments of principal under the Prior Term Facilities.
Debt
We had debt outstanding of $38.1 million as of June 30, 2021, compared to $0.1 as of June 30,2020. The outstanding balance as of June 30, 2021 related to borrowing under the Revolving Facility,the Term Loan Facility, and vehicle loans.
We had debt outstanding of $25.1 million as of December 31, 2020, compared to $17.0 million asof December 31, 2019. The outstanding balance as of December 31, 2020 related to borrowings underthe Revolving Facility and vehicle loans. The outstanding balance as of December 31, 2019, related toborrowings under the Prior Term Facilities, and vehicle loans. The Prior Term Facilities were repaidand terminated upon our entering into the Revolving Facility in May 2020.
Revolving Facility
In May 2020, we entered into a five-year credit facility, or the Revolving Facility with Wells Fargoconsisting of a revolving line of credit, which provided for committed borrowings of $50.0 million and a
116

$10.0 million non-committed accordion feature. On May 21, 2021, we, and certain of our subsidiaries,as guarantors, entered into an amendment, which provided for an additional $10.0 million of revolvingcommitments. We may repay outstanding balances under the Revolving Facility at any time withoutpremium or penalty. Borrowings under the Revolving Facility bear interest at a rate per annum equalto, at our option, either (a) adjusted LIBOR (which shall not be less than 0.0%) plus the applicable rateor (b) base rate (determined by reference to the greatest of the prime rate published by Wells Fargo,the federal funds effective rate plus 1.5% and one-month LIBOR plus 1.5%). The applicable rate forLIBOR borrowings under the Revolving Facility is subject to step-downs based on our total netleverage for the immediately preceding fiscal quarter. The effective interest rate as of December 31,2020 was 1.15%. The outstanding balance on the Revolving Facility was $8.0 million and $25.0 millionas of June 30, 2021 and December 31, 2020, respectively. As of June 30, 2021, we were compliantwith all financial covenants. See “Description of Certain Indebtedness—Revolving Facility.”
Term Loan Facility
In May 2021, we entered into a Term Commitment Note, or the Term Facility with Wells Fargopursuant to the terms of the Credit Agreement entered into in connection with the Credit Facility. TheTerm Facility provides us with term loans of up to $30.0 million, or the Term Loans. Borrowings underthe Term Facility bear interest at the same rate as the Revolving Facility. We are required to repay theprincipal on the Term Loans in quarterly installments, commencing on October 1, 2021, throughmaturity date of May 21, 2026. See “Description of Certain Indebtedness—Term Loan Facility.”
Vehicle Loans
We periodically enter into vehicle loans. Interest rate on these vehicle loans range from 4.56% to5.68%. The outstanding balance on the vehicle loans as of June 30, 2021 was less than $0.1 million.
For additional information, see Note 10 to our consolidated financial statements includedelsewhere in this prospectus.
Off-Balance Sheet Arrangement
We did not have during the periods presented, and we do not currently have, any off-balancesheet financing arrangements or any relationships with unconsolidated entities or financialpartnerships, including entities sometimes referred to as structured finance or special purpose entities,that were established for the purpose of facilitating off-balance sheet arrangements or othercontractually narrow or limited purposes.
Contractual Obligations and Commitments
We lease certain assets under noncancelable operating leases, which expire through 2025. Theleases relate primarily to office space in addition to machinery and equipment. Future minimumcommitments under these leases are $2.1 million and $2.6 million as of June 30, 2021 and December30, 2020, respectively.
In connection with our business acquisitions of Runa, we entered into contingent considerationarrangements, which will require future cash outflows related to milestone payments based on revenueperformance. Under the terms of the arrangement, we are obligated to pay the former shareholders upto $51.5 million if certain revenue thresholds are met during the period from December 31, 2021through December 31, 2022. As of June 30, 2021 and December 31, 2020, we have recognized aliability of $0 related to the revenue performance contingent consideration.
117

We have contractual obligations to repay indebtedness and required interest payments under ourRevolving Facility as described previously. As of June 30, 2021 and December 31, 2020, we hadoutstanding balance on the Revolving Facility of $8.0 million and $25.0 million, respectively, which wewill be required to repay by May 2026.
Critical Accounting Policies and Significant Judgments and Estimates
Our consolidated financial statements are prepared in accordance with U.S. GAAP. Thepreparation of our consolidated financial statements and related disclosures requires us to makeestimates and judgments that affect the reported amounts of assets, liabilities, costs and expenses,and the disclosure of contingent assets and liabilities in our consolidated financial statements. We baseour estimates on historical experience, known trends and events and various other factors that webelieve are reasonable under the circumstances, the results of which form the basis for makingjudgments about the carrying values of assets and liabilities that are not readily apparent from othersources. We evaluate our estimates and assumptions on an ongoing basis. Our actual results maydiffer from these estimates under different assumptions or conditions.
While our significant accounting policies are described in more detail in Note 2 to ourconsolidated financial statements appearing at the end of this prospectus, we believe that the followingaccounting policies are those most critical to the judgments and estimates used in the preparation ofour consolidated financial statements.
Revenue Recognition
The Company recognizes revenue in accordance with ASC Topic 606, Revenue from Contractswith Customers (ASC 606). ASC 606 defines a five-step model that requires entities exercise judgmentwhen considering the terms of contract(s), which include (1) identifying the contract or agreement witha customer, (2) identifying the performance obligations in the contract or agreement, (3) determiningthe transaction price, (4) allocating the transaction price to the separate performance obligations, and(5) recognizing revenue as each performance obligation is satisfied. Revenue is recognized whencontrol of the promised good is transferred to the customer in an amount that reflects the considerationto which the Company is expected to be entitled to receive in exchange for those products. Eachcontract includes a single performance obligation to transfer control of the product to the customer.
For our various products in the Vita Coco Coconut Water and Other product categories, control istransferred upon customer receipt, at which point the Company recognizes the transaction price for theproduct as revenue. The transaction price recognized reflects the consideration the Company expectsto receive in exchange for the sale of the product. The Company’s performance obligations aresatisfied at that time. The Company does not have any significant contracts with customers requiringperformance beyond delivery, and contracts with customers contain no incentives or discounts thatwould meet the criteria for a distinct good or service that could cause revenue to be allocated oradjusted over time. Shipping and handling activities are performed before the customer obtains controlof the goods and therefore represent fulfillment costs, which are included in cost of goods sold, ratherthan revenue.
Additionally, the Company determined the production and distribution of private label productsrepresents a distinct performance obligation. Since there is no alternative use for these products andthe Company has the right to payment for performance completed to date, the Company recognizesthe revenue for the production of these private label products over time as the production for openpurchase orders is completed, which may be prior to any shipment. The resulting contract assets arerecorded in Prepaid expenses and other current assets.
118
The Company provides trade promotions to its customers. These discounts do not meet thecriteria for a distinct good or service and therefore, the Company reduces revenue for the discountsassociated with meeting this obligation based on the expected value method. These consolidatedfinancial statements include trade promotion accruals. Trade promotion accruals are made for invoicesthat have not yet been received as of year-end and are recorded as a reduction of sales. Thispromotion accrual is a management estimate based upon the known price of retail promotions andestimates of the sales volume during the promotion period.
Stock-Based Compensation
The Company accounts for stock-based compensation in accordance with ASC Topic 718,Compensation—Stock Compensation (ASC 718) for stock options issued under the 2014 Stock Optionand Restricted Stock Plan.
The Company measures all stock option awards based on their fair value on the date of the grantand recognizes compensation expense for those awards over the requisite service period of eachstock-option grant, which is generally the vesting period of the respective award by using theaccelerated attribution method. The Company applies an estimated forfeiture rate derived fromhistorical employee termination behavior. If the actual forfeitures differ from those estimated bymanagement, adjustment to compensation expense may be required in future periods. The Companyissues stock-based awards with service-based and performance-based and market-based vestingconditions. The Company recognizes expense for performance-based awards when it becomesprobable that such awards will be earned over a requisite service period. The Company defers therecognition of compensation expense for the stock-option awards that vest upon a qualifying liquidityevents until the qualifying events are probable of occurrence. Stock option awards are equity-classified, as they do not contain a cash settlement option or other features requiring them to beliability-classified.
The Company uses the Black-Scholes-Merton, or Black-Scholes, option-pricing model todetermine the fair value of stock awards with service-based vesting conditions and performance-basedvesting conditions. For stock awards with performance-based and market-based vesting conditions,the Company uses the Barrier option valuation model to determine the fair value.
The Company has classified stock-based compensation expense in its consolidated statementsof operations in SG&A expenses. See Note 15, Stockholders’ Equity, to our consolidated financialstatements appearing elsewhere in this prospectus.
The fair value of each stock option is estimated on the grant date using the Black-Scholes option-pricing model or the Barrier option valuation model, which uses multiple assumptions and judgments.The subjective assumptions and the application of judgment in determining the fair value of the awardsrepresent management’s best estimates. If factors change and different assumptions are used, ourequity compensation expense could be materially different in the future. The most significantassumptions and judgments are as follows:
• Fair value of common stock.
• Option exercise price—Approximated fair value of common stock.
• Expected volatility—We determine the expected price volatility based on the historicalvolatilities of our peer group, as we do not have a trading history for our shares. Industry peersconsist of several public companies in the soft drinks industries similar to us in size, stage oflife cycle and financial leverage. We intend to continue to consistently apply this process usingthe same or similar public companies until a sufficient amount of historical information
119

regarding the volatility of our own stock price becomes available, or unless circumstanceschange such that the identified companies are no longer similar to us, in which case, moresuitable companies whose share prices are publicly available would be utilize in the calculation.
• Expected term—The expected term represents the period that the stock-based awards areexpected to be outstanding based on the service or performance conditions specified for theawards. We account for the expected life of the options with service conditions in accordancewith the “simplified” method as defined in ASC 718, which enables the use of a practicalexpedient for “plain vanilla” share options. The expected term using the simplified method iscalculated using the midpoint between the vesting date and the contractual term.
• Risk-free interest rate—We based the risk-free rate on U.S. Treasury yield curve in effect at thetime of the grant of the award for a term corresponding to the duration of the options.
• Dividend yield—We used a dividend rate of zero as we do not anticipate paying dividends inthe foreseeable future.
Determination of fair value of common stock – The calculation of the fair value of awards alsorequires an estimate of our equity value. As there has been no public market for our common stock todate, the estimated fair value of our common stock has been determined by our board of directors asof the date of each option grant, with input from management and valuations by a third-party specialist.The board considers our most recently available third-party valuations of common stock and anassessment of additional objective and subjective factors that it believed were relevant and which mayhave changed from the date of the most recent valuation through the date of the grant. These third-party valuations are performed in accordance with guidance outlined in the Americas Institute ofCertified Public Accountants’ Accounting and Valuation Guide, Valuation of Privately-Held-CompanyEquity Securities Issued as Compensation.
Our third-party common stock valuations are prepared using a probability weighted-expectedreturn method, or PWERM. Under this method, discrete future outcomes, such as an IPO, andnon-IPO scenario are weighted based on our estimate of the probability of each scenario. Indetermining the equity value under each scenario, the IPO scenario utilized the market approach whilethe non-IPO scenario utilized a combination of the income approach and market approach. Inleveraging the income approach, we estimated the equity value based on the expectation of futurecash flows that the Company will generate. These future cash flows, and an assumed terminal value,are discounted to their present values using a discount rate that reflects the risks inherent in the cashflows. In leveraging the market approach, the third-party common stock valuations reviewed the tradingmultiples of guideline publicly traded companies, the transactions multiples of guideline comparablecompany transactions, and also gave consideration to our precedent transactions. Given our simplecapital structure, after subtracting net debt, the residual equity value as of the various date wasallocated to the common stock.
In addition to considering the results of these third-party valuations, our board of directorsconsidered various objective and subjective factors to determine the fair value of our common stock asof each grant date, including:
• the nature and history of our business;
• our stage of development and commercialization and our business strategy;
• external market conditions affecting our industry and the global soft drinks and consumerproducts industry;
• the market value of companies that are engaged in a similar business to ours;
• our financial positions, including cash on hand, and our historical and forecasted performanceand operating results;
120

• the lack of an active public market for our common stock;
• the likelihood of achieving a liquidity event, such as an initial public offering, or IPO, or sale ofour company in light of prevailing market conditions;
• the analysis of IPOs and the market performance of similar companies in our industry;
• the overall inherent risks associated with our business at the time awards were approved; and
• the overall equity market conditions and general economic trends.
The assumptions underlying these valuations represent management’s best estimates, whichinvolve inherent uncertainties and the application of management’s judgment. As a result, if we hadused significantly different assumptions or estimates, the fair value of our common stock and our stock-based compensation could have been materially different.
Once a public trading market for our common stock has been established in connection with thecompletion of this offering, it will no longer be necessary for our board of directors to estimate the fairvalue of our common stock in connection with our accounting for granted stock options and other suchawards we may grant, as the fair value of our common stock will be determined based on the quotedmarket price of our common stock.
Vesting of certain stock options subject to performance conditions and market conditions mayaccelerate upon the occurrence of this offering. If a predetermined equity value of the Company isachieved upon the occurrence of this offering, we expect to recognize $1.2 million in additionalcompensation expense.
Stock Options Granted Subsequent to Our Initial Public Offering
For stock options granted subsequent to our initial public offering, our board of directors (or itscompensation committee) will determine the fair value of each share based on the closing price of ourcommon stock as reported on the day of grant.
Income Taxes
The Company accounts for income taxes under Accounting Standards Codification (ASC) 740,Income Taxes, which requires an asset and liability approach to financial accounting and reporting forincome taxes. Deferred income tax assets and liabilities are computed annually for differencesbetween the consolidated financial statements and tax bases of assets and liabilities that will result intaxable or deductible amounts in the future. Such deferred income tax assets and liabilitiescomputations are based on enacted tax laws and rates applicable to periods in which the differencesare expected to affect taxable income. Valuation allowances are established when necessary to reducedeferred income tax assets to the amount expected to be realized. Interest and penalties related tounrecognized tax positions are included in income tax expense in the consolidated statement ofoperations and comprehensive income and accrued expenses in the consolidated balance sheets. TheCompany recognizes the effect of income tax positions only if those positions are more likely than notof being sustained. Recognized income tax positions are measured at the largest amount that isgreater than 50% likely of being realized. Changes in recognition or measurement are reflected in theperiod in which the change in judgment occurs.
We must make assumptions and judgments to estimate the amount of valuation allowances to berecorded against our deferred tax assets, which take into account current tax laws and estimates of theamount of future taxable income, if any. Changes to any of the assumptions or judgments could causeour actual income tax obligations to differ from our estimates.
121

Intangible assets
Intangible assets consist primarily of acquired trade names and distributor relationships. TheCompany determines the appropriate useful life of our intangible assets by performing an analysis ofexpected cash flows of the acquired assets. Intangible assets are amortized over their estimated usefullives of ten years, using the straight-line method, which approximates the pattern in which theeconomic benefits are consumed. The Company’s intangible assets are reviewed for impairmentwhenever events or changes in circumstances indicate that the carrying amount may not berecoverable, or a triggering event. When a triggering event is identified, a test of recoverability isperformed by estimating the undiscounted future cash flows associated with such assets andcomparing them to the carrying value of the asset. When the recoverability test fails, the Companymeasures the impairment loss based on the fair value of the assets compared to the carrying amountof the asset. The fair value of the trade names is determined through an income approach using therelief from royalty method. The fair value of the distributor relationships is determined through anincome approach using the excess earnings method.
Goodwill
Goodwill represents the excess of the purchase price over the fair value of net assets acquired ina business combination and is measured in accordance with the provisions of ASC 350, Intangibles—Goodwill and Other. Goodwill is not amortized; instead goodwill is tested for impairment on an annualbasis on December 31, or more frequently if the Company believes indicators of impairment exist.
The Company has determined that there are three reporting units for purposes of testing goodwillfor impairment: (i) the Americas reporting unit, (ii) the Europe reporting unit, and (iii) the Asia reportingunit. The Company first assesses qualitative factors to determine whether it is more-likely-than-not thatthe fair value of a reporting unit is less than its carrying value. In performing the qualitativeassessment, the Company reviews factors both specific to the reporting units and to the Company as awhole, such as financial performance, macroeconomic conditions, industry and market considerations,and the fair value of each reporting unit at the last valuation date. If the Company elects this option andbelieves, as a result of the qualitative assessment, that it is more likely than not that the carrying valueof each of the reporting units exceeds their fair value, the quantitative impairment test is required;otherwise, no further testing is required.
Alternatively, the Company may elect to bypass the qualitative assessment and perform thequantitative impairment test instead, or if the Company reasonably determines that it is more-likely-than-not that the fair value is less than the carrying value, the Company performs its annual, or interim,goodwill impairment test by comparing the fair value of each of the reporting units with their carryingamount. The fair value of each of the reporting units is estimated by blending the results from theincome approach and the market multiples approach. These valuation approaches consider a numberof factors that include, but are not limited to, expected future cash flows, growth rates, discount rates,and comparable multiples from publicly-traded companies in our industry, and require us to makecertain assumptions and estimates regarding industry economic factors and future profitability of ourbusiness. It is our policy to conduct impairment testing based on our most current business plans,projected future revenues and cash flows, which reflect changes we anticipate in the economy and theindustry. The cash flows are based on five-year financial forecasts developed internally bymanagement and are discounted to a present value using discount rates that properly account for therisk and nature of the respective reporting unit’s cash flows and the rates of return market participantswould require to invest their capital in our reporting unit. The Company will recognize an impairment forthe amount by which the carrying amount exceeds a reporting unit’s fair value. For the years endedDecember 31, 2020 and 2019, there were no impairments recorded.
122

Emerging Growth Company Status
The Jumpstart Our Business Startups Act of 2012, or the JOBS Act, permits an “emerging growthcompany” such as us to take advantage of an extended transition period to comply with new or revisedaccounting standards applicable to public companies until those standards would otherwise apply toprivate companies. We have elected to use this extended transition period for complying with new orrevised accounting standards that have different effective dates for public and private companies untilthe earlier of the date we (i) are no longer an emerging growth company or (ii) affirmatively andirrevocably opt out of the extended transition period provided in the JOBS Act. As a result, we will notbe subject to the same new or revised accounting standards as other public companies that are notemerging growth companies, and our consolidated financial statements may not be comparable toother public companies that comply with new or revised accounting pronouncements as of publiccompany effective dates. We may choose to early adopt any new or revised accounting standardswhenever such early adoption is permitted for private companies.
We will cease to be an emerging growth company on the date that is the earliest of (i) the last dayof the fiscal year in which we have total annual gross revenues of $1.07 billion or more, (ii) the last dayof our fiscal year following the fifth anniversary of the date of the closing of this offering, (iii) the date onwhich we have issued more than $1.0 billion in nonconvertible debt during the previous three years or(iv) the date on which we are deemed to be a large accelerated filer under the rules of the Securitiesand Exchange Commission.
Recently Issued Accounting Pronouncements
A description of recently issued accounting pronouncements that may potentially impact ourfinancial position and results of operations is disclosed in Note 2 to our consolidated financialstatements appearing at the end of this prospectus.
Qualitative and Quantitative Disclosures About Market Risk
Interest Rate Risk
We are exposed to market risks in the ordinary course of our business. These risks primarilyincluded interest rate sensitivities.
As of June 30, 2021, the outstanding amounts of $8.0 million related to our Revolving Facility and$30.0 million related to our Term Loan incur interest fees at variable interest rates and are affected bychanges in the general level of market interest rates. To quantify our exposure to interest rate risk, a100 basis point increase or decrease to the applicable variable rates of interest would change ourannual interest expense by approximately $0.4 million per year based on the borrowings as of June 30,2021 under the Revolving Facility and Term Loan.
As of December 31, 2020, the outstanding amount of $25.0 million related to our RevolvingFacility incurs interest fees at variable interest rates and is affected by changes in the general level ofmarket interest rates. To quantify our exposure to interest rate risk, a 100 basis point increase ordecrease to the applicable variable rates of interest would change our annual interest expense byapproximately $0.3 million per year based on the borrowings as of December 31, 2020 under theRevolving Facility.
Foreign Currency Exchange Risk
We transact business globally in multiple currencies and hence have foreign currency risksrelated to our net sales, cost of goods sold, and operating expenses. We use derivative financial
123

instruments to reduce our net exposure to foreign currency fluctuations. Our objective in managingexposure to foreign currency fluctuations is to reduce the volatility caused by foreign exchange ratechanges on the earnings, cash flows and financial position of our international operations. Wegenerally target to hedge a majority of our forecasted yearly foreign currency exchange exposurethrough a 24-month rolling layered approach and leave a portion of our currency forecast floating atspot rate. Our currency forecast and hedge positions are reviewed quarterly. The gains and losses onthe forward contracts associated with our balance sheet positions are recorded in ‘‘Other income(expense), net” in the consolidated statements of operations.
The total notional values of our forward exchange contracts were $72.4 million and $55.1 millionas of June 30, 2021 and 2020, respectively. The derivatives on the forward exchange contractsresulted in an unrealized gain of $3.2 million for the six months ended June 30, 2021, and we estimatethat a 10 percent strengthening or weakening of the U.S. dollar would have resulted in a $0.8 milliongain or loss.
The total notional values of our forward exchange contracts were $62.4 million and $58.8 millionas of December 31, 2020 and 2019, respectively. The derivatives on the forward exchange contractsresulted in an unrealized loss of $4.7 million for the year ended December 31, 2020, and we estimatethat a 10 percent strengthening or weakening of the U.S. dollar would have resulted in a $0.9 milliongain or loss.
Part of our cash and cash equivalents are denominated in foreign currencies. As of June 30,2021, a 1% change in the value of the U.S. dollar compared to foreign currencies would have causedour cash and cash equivalents to decrease or increase by $0.1 million. As of December 31, 2020, a1% change in the value of the U.S. dollar compared to foreign currencies would have caused our cashand cash equivalents to decrease or increase by $0.1 million.
Inflation Risk
Inflation generally affects us by increasing our cost of labor and manufacturing costs. We do notbelieve that inflation has had a material effect on our results of operations during the years endedDecember 31, 2020 and 2019. In the six months ended June 30, 2021, we have seen significantinflation caused by COVID-19 related global supply chain disruptions which put pressure on our costsand margins. More specifically, ocean freight costs went up drastically due to shipping and portsconstraints.
Credit Risk
We are exposed to concentration of credit risk from our major customers. In the six monthsended June 30, 2021 and the year ended December 31, 2020, sales to two customers representedapproximately 54% of our consolidated net sales. We have not experienced credit issues with thesecustomers. We maintain provisions for potential credit losses and evaluate the solvency of ourcustomers on an ongoing basis to determine if additional allowances for doubtful accounts andcustomer credits need to be recorded. Significant economic disruptions or a slowdown in the economycould result in significant additional charges.
124

BUSINESS
The Leader of a Healthy Beverage Revolution Through the Power of Plants
The Vita Coco Company is a leading fast-growing, plant-based functional hydration platform,which pioneered packaged coconut water in 2004, and recently began extending into other healthyhydration categories. We are on a mission to reimagine what is possible when brands deliver greattasting, natural, and nutritious products that are better for consumers and better for the world. At theVita Coco Company, we strongly believe that we have a nearly two-decade head start on building amodern, healthy beverage company providing products that consumers demand. We observed earlyon the shift toward healthier and more functional beverage and food products led by the nextgeneration of consumers. As a result, we believe our platform is tethered to the future and notanchored to the past. Our portfolio is led by Vita Coco, which is the leader in the global coconut watercategory with additional coconut oil and coconut milk offerings, and includes Runa, a leading plant-based energy drink inspired from a plant native to Ecuador, Ever & Ever, a sustainably packagedwater, and the recently launched PWR LIFT, a flavored protein-infused water.
Since our inception, we have been boldly re-defining healthy hydration to truly be good for yourbody rather than “less bad for you” as defined by the old guards of the beverage industry. We haveembraced the power of plants from around the globe by turning them into conveniently packagedbeverages that our consumers can enjoy across need-states and beverage occasions throughout theday—as a replacement to orange juice in the morning, as a natural sports drink invented by MotherNature, as a refreshing alternative to both regular or plant-based milk in a smoothie, or simply on itsown as a great-tasting functional hydrator. Together, our brands help our consumers satiate their largeand growing thirst for healthy and functional hydration, which fuels well-being from the inside out. Thisenables us to serve a U.S. beverage market of over $119 billion, providing a long runway for growth,and within which the $13 billion natural segment is currently growing at twice the pace of theconventional brands, according to SPINS.
We do all of this as a responsible global citizen with a consistent appreciation of our impact onthe environment and social wellbeing of the communities in which we operate. We are a Public BenefitCorporation focused on harnessing, while protecting, nature’s resources for the betterment of the worldand its habitants by creating ethical, sustainable, better-for-you beverages and consumer products thatnot only uplift our communities, but that do right by our planet. That is why we bring our products tomarket through a responsibly designed supply chain, and provide our farmers and producers thepartnership, investment, and training they need to not only reduce waste and environmental impact,but bring income and opportunity to local communities. Ultimately, we believe it is our unique, inclusive,and entrepreneurial culture rooted in being kind to our bodies, our environment, and to each other, thatenables us to win in the marketplace and ride the healthy hydration wave of the future. Our journey isstill young, and we believe that we are well-positioned to continue to deliver exceptional growth andprofitability as we continue to grow our consumer reach in existing and new markets around the globe.We are laser focused on owning as many healthy hydration occasions as possible.
We have undertaken numerous initiatives to turn our ideals into action. In 2014, we created theVita Coco Project to support and empower our coconut farming communities through innovativefarming practices, improving education resources, and scaling our business to promote economicprosperity—through all of which we hope to positively impact the lives of over one million people.Additionally, we seek to partner with other third party organizations that share and advance our idealsincluding fair trade, accessible nutrition and wellness, and environmental responsibility.
125

Vita Coco: The Global Leader in Coconut Water
We pioneered the North American and European packaged coconut water market and madecoconut water a mainstream beverage loved by consumers who were seeking healthier alternatives.Today we are the largest brand globally in the coconut and other plant waters category, according toEuromonitor. Our visionary co-founder, co-CEO and Chairman, Mike Kirban, discovered coconut wateron an adventure in Brazil with his best friend. In many tropical countries, coconut water is viewed as agift from Mother Nature and has been consumed for centuries as a substitute for water given itshydrating and functional properties from electrolytes. Since the beginning, our goal has been to bringhigh quality yet affordably priced and sustainably sourced coconut water to the masses.
When Vita Coco launched in New York City in 2004, we established the coconut water categoryas a premium lifestyle drink, and we have been on the forefront of natural and functional beveragesever since. We believe the ongoing adoption of Vita Coco is largely attributable to its taste qualities andnutrients, and the fact that it is an alternative to sugar-packed sports drinks and other less healthyhydration alternatives. Vita Coco has evolved from a single pure coconut water SKU, to a full portfolioof coconut water flavors and enhanced coconut waters, as well as other plant based offerings such ascoconut oil and coconut milk, all of which have been commercially successful and loved by consumers,such as Vita Coco Boosted, Vita Coco Super Sparkling and Vita Coco Farmers Organic. With marketshare leadership, the Vita Coco brand is synonymous with coconut water and healthy hydration. VitaCoco is truly the brand that helps you “drink a little better, eat a little better, and live a little better.” Wehave leveraged the strength of our category leading Vita Coco brand and our innovation capabilities tobroaden our portfolio.
Vita Coco is the coconut water category leader with 46% market share in the United States, a36% relative market share advantage over the next leading competitor, according to IRI CustomResearch. Vita Coco is driving growth in the overall category as well as growing its share. The brandcompetes in the $2 billion global coconut and plant waters category, according to Euromonitor, and isonly being sold in 24 countries, with low household penetration in most of them. We believe that VitaCoco has had the biggest influence in making coconut water a mainstream beverage choice in theUnited States, and driving the category to its 15% year-over-year growth, which is in line withenhanced waters and outpacing sparkling waters, with 15% and 4% year-over-year growth,respectively, for the 26 weeks ended September 5, 2021, according to IRI Custom Research. Thecategory and the brand are sought after by consumers of all ages, but according to Numerator, doesskew to younger and more multicultural shoppers, supporting the exciting growth prospects we have.
Internationally, our business is anchored by Vita Coco’s footprint in the United Kingdom, where itis the coconut water category leader with over 70% market share, according to IRI U.K. Our U.K.footprint and operational base in Asia, has allowed us to start selling into other European and Asiancountries, where our brand while still nascent, has been well received. In collaboration with our keyretail partners in the United Kingdom, we have innovated beyond our current portfolio by extending thebrand into natural personal care products and CBD-infused beverages that have been well received byour loyal consumer base. We have established solid foundations in key markets such as China,France, Spain, the Nordic Region and the Middle East from which to build our brand.
126
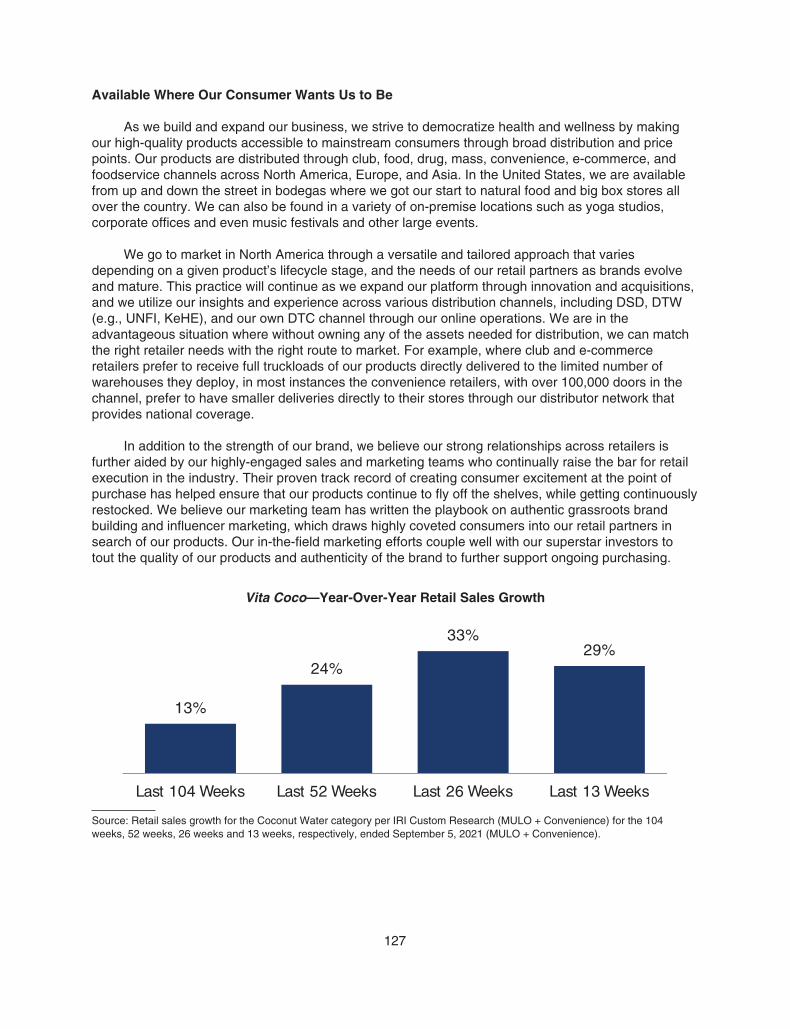
Available Where Our Consumer Wants Us to Be
As we build and expand our business, we strive to democratize health and wellness by makingour high-quality products accessible to mainstream consumers through broad distribution and pricepoints. Our products are distributed through club, food, drug, mass, convenience, e-commerce, andfoodservice channels across North America, Europe, and Asia. In the United States, we are availablefrom up and down the street in bodegas where we got our start to natural food and big box stores allover the country. We can also be found in a variety of on-premise locations such as yoga studios,corporate offices and even music festivals and other large events.
We go to market in North America through a versatile and tailored approach that variesdepending on a given product’s lifecycle stage, and the needs of our retail partners as brands evolveand mature. This practice will continue as we expand our platform through innovation and acquisitions,and we utilize our insights and experience across various distribution channels, including DSD, DTW(e.g., UNFI, KeHE), and our own DTC channel through our online operations. We are in theadvantageous situation where without owning any of the assets needed for distribution, we can matchthe right retailer needs with the right route to market. For example, where club and e-commerceretailers prefer to receive full truckloads of our products directly delivered to the limited number ofwarehouses they deploy, in most instances the convenience retailers, with over 100,000 doors in thechannel, prefer to have smaller deliveries directly to their stores through our distributor network thatprovides national coverage.
In addition to the strength of our brand, we believe our strong relationships across retailers isfurther aided by our highly-engaged sales and marketing teams who continually raise the bar for retailexecution in the industry. Their proven track record of creating consumer excitement at the point ofpurchase has helped ensure that our products continue to fly off the shelves, while getting continuouslyrestocked. We believe our marketing team has written the playbook on authentic grassroots brandbuilding and influencer marketing, which draws highly coveted consumers into our retail partners insearch of our products. Our in-the-field marketing efforts couple well with our superstar investors totout the quality of our products and authenticity of the brand to further support ongoing purchasing.
Vita Coco—Year-Over-Year Retail Sales Growth
13%
24%
33%29%
Last 104 Weeks Last 52 Weeks Last 26 Weeks Last 13 Weeks
Source: Retail sales growth for the Coconut Water category per IRI Custom Research (MULO + Convenience) for the 104weeks, 52 weeks, 26 weeks and 13 weeks, respectively, ended September 5, 2021 (MULO + Convenience).
127

2020 AMERICAS SALES BY CHANNEL 2020 AMERICAS SALES BY ROUTE TOMARKET
Food, Drug,Mass36%
Club35%
Other29% DSD
47%DTW47%
Broadline6%
Source: Management estimates based on Americas branded gross sales and IRI Custom Research.Notes: “Other” includes e-commerce, convenience and food service.
Unique Global Supply Chain Anchored in Upcycling and Supporting Growth Prospects
We have set up an asset-lite business model. We believe we have unique expertise sourcing andoverseeing the packaging of coconut water from the tropical belt, and delivering our high quality,branded packaged coconut water to consumers worldwide. Through our direct access to coconutfarmers globally and our relationships with processors in many countries, including the Philippines,Indonesia, and Brazil, we have built up a unique body of knowledge and relationships which we believecreates a competitive advantage unrivaled in the industry. We believe this is an important differentiatorfor our business and difficult to replicate.
As the pioneer of branded coconut water in the United States, we sourced our first coconut waterin the early 2000s in Brazil, and helped local producers set up the infrastructure needed to supply andgrow a high quality coconut water business. Over time, we took this capability to other parts of theworld and also started giving back to the local communities in which we operate.
We have carefully cultivated a coconut water supply chain of scale, which enables coconutprocessing facilities to monetize their coconut water. Prior to our involvement, many facilities had solelyfocused on desiccated coconut, coconut cream, and other coconut products, and were discarding thecoconut water as an un-needed byproduct of their coconut processing. Thus, we saw an opportunityfor upcycling the coconut water.
Unlike other packaged beverages that can be produced or co-packed anywhere, coconut waterneeds to be transferred from the coconut into an aseptic package within hours of the coconut being cutfrom the tree. This means that we had to set up our production process as close to the coconut farmsas possible to keep quality at the highest level. This was often in remote, less developed tropical areaswith unsophisticated infrastructure and antiquated farming practices. In the areas we source from, wehave established model farms to emulate, and we work closely with our manufacturing partners toassist the local farmers with best practices on how to grow and process coconuts in a sustainable andefficient manner. We believe the work we are doing with our manufacturing partners has set the goldstandard for coconut water processing.
128
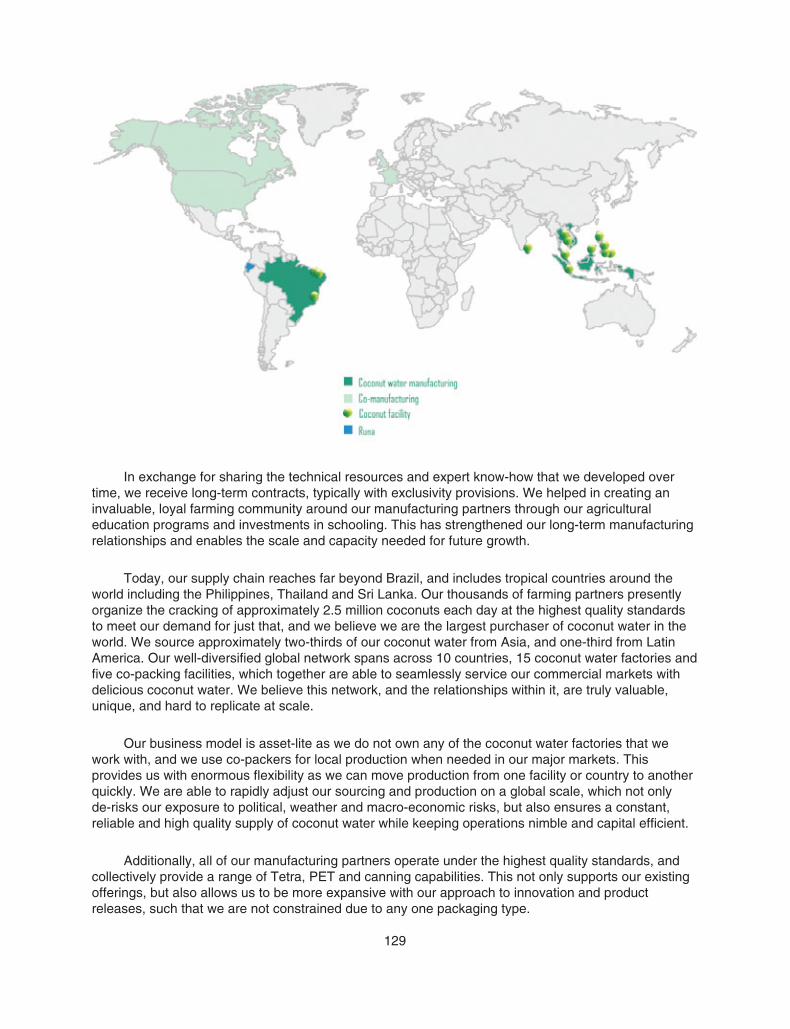
In exchange for sharing the technical resources and expert know-how that we developed overtime, we receive long-term contracts, typically with exclusivity provisions. We helped in creating aninvaluable, loyal farming community around our manufacturing partners through our agriculturaleducation programs and investments in schooling. This has strengthened our long-term manufacturingrelationships and enables the scale and capacity needed for future growth.
Today, our supply chain reaches far beyond Brazil, and includes tropical countries around theworld including the Philippines, Thailand and Sri Lanka. Our thousands of farming partners presentlyorganize the cracking of approximately 2.5 million coconuts each day at the highest quality standardsto meet our demand for just that, and we believe we are the largest purchaser of coconut water in theworld. We source approximately two-thirds of our coconut water from Asia, and one-third from LatinAmerica. Our well-diversified global network spans across 10 countries, 15 coconut water factories andfive co-packing facilities, which together are able to seamlessly service our commercial markets withdelicious coconut water. We believe this network, and the relationships within it, are truly valuable,unique, and hard to replicate at scale.
Our business model is asset-lite as we do not own any of the coconut water factories that wework with, and we use co-packers for local production when needed in our major markets. Thisprovides us with enormous flexibility as we can move production from one facility or country to anotherquickly. We are able to rapidly adjust our sourcing and production on a global scale, which not onlyde-risks our exposure to political, weather and macro-economic risks, but also ensures a constant,reliable and high quality supply of coconut water while keeping operations nimble and capital efficient.
Additionally, all of our manufacturing partners operate under the highest quality standards, andcollectively provide a range of Tetra, PET and canning capabilities. This not only supports our existingofferings, but also allows us to be more expansive with our approach to innovation and productreleases, such that we are not constrained due to any one packaging type.
129

Our supply chain scale, diversification, and flexibility also create leverage with manufacturers,warehouses, and logistics providers to reduce waste and operating and transportation costs, and helpus reduce our total costs while maintaining reliable supply. This scale also supports our position as oneof the largest and highest quality coconut water producers in the world and should allow us to continueto manage our supply and growth prospects for many years to come.
Leveraging Our Success and Scale into a Multi-Brand Platform
Over the past nearly two decades, we have built the scale to service our retailers and consumersaround the globe. While we have grown into a larger organization with a strong back office team, ourentrepreneurial spirit stays central to everything we do. Our sales team seeks to set the bar for retailexecution in the industry, and has a proven track record of creating consumer excitement at the pointof purchase. They are complemented by our marketing team who effectively employs authenticgrassroots brand building and influencer marketing campaigns to aid brand awareness. We haveleveraged our scale and entrepreneurial spirit to expand into other categories both organically andthrough acquisitions. We are constantly looking to expand our demographic reach and the beverageoccasions that our products serve. We remain very focused on growing our share of the beveragemarket that sits at the intersection of functional and natural through a wide variety of clean,responsible, good for you products.
We expanded into private label coconut water in 2016 as a way to develop stronger ties withselect, strategic retail partners and improve our operating scale. This strategic move has enabled us togrow our branded share in the category as well as improve our gross margins across the total portfolio.We leverage private label as a way to manage the overall coconut water category at retail, enabling usto be better stewards of the category and influence the look and feel at retail shelves and more of theoverall consumer experience with coconut water. Our private label offering strategically increases thescale and efficiency of our coconut water supply chain, and also proactively provides us with improvedrevenue management. Through this offering, we are able to better manage our products and capturethe value segment without diluting our own brand, while concurrently supporting more family farms inthe regions that we operate in. While our private label business has aided our growth historically, weexpect our brands to be the primary drivers of top-line growth going forward.
After building the scale and infrastructure to support our beloved Vita Coco brand, we realizedthat we were well positioned to support our platform with other innovations and brands that couldleverage our strong capabilities in sales, marketing, and distribution. Not only have we added VitaCoco Coconut Milk as a shelf stable dairy alternative in the club channel, and introduced in summer2021 the Vita Coco Hydration Drink Mix, a powdered form of flavored coconut water to test in limitedonline markets, but we have also added other complementary brands.
Since 2018, we have expanded our portfolio with three brands that align with our values andallow us to expand our reach and consumer base, and increase the number of occasions where wecan play a role in our consumers’ lives: Runa, Ever & Ever, and PWR LIFT.
Runa: As part of our ongoing evaluation of the broader beverage industry, we saw an opportunity toleverage our success and learning in building Vita Coco and apply it to a clean, plant-based energydrink, with an aim to disrupt the very large and fast growing energy drinks category with a plant-based and fully natural alternative for consumers. This led us to acquire Runa in 2018 given itsdistinct plant-based and natural energy positioning, and our proven ability to source products fromemerging markets. Runa’s clean energy drinks provide consumers a refreshing energy boostwithout the jolts and jitters, and with less sugar than traditional energy beverages. Runa’s cleantaste and smooth energy lift comes from Guayusa, an Amazonian jungle super-leaf containingtheobromine and L-theanine, which has been shown to boost energy levels, alertness, and improveconsumers’ moods and concentration.
130

Ever & Ever: Launched in 2019, Ever & Ever is a purified water brand packaged solely in aluminumbottles with a pH balance of 7.4. We saw an opportunity to quickly create a brand that responded tothe need for a sustainably packaged water product given the reusable nature of the bottles and itsinfinite recyclability, and transformed our concept into reality in under three months. Ever & Everwas launched with a focus on the foodservice and office channels, as top Fortune 500 companiesand large corporations continue to make a conscious effort to participate in the sustainabilitymovement with a focus on reducing plastic waste. Ever & Ever is also available in our DTCchannels.
PWR LIFT: In 2021, we released a functional beverage targeted at the post-workout and recoveryusage occasions in PWR LIFT. We believe the fitness market had been lacking drinks that not onlydeliver thirst-quenching refreshment but also nutritional benefits. These protein-infused flavoredwaters can do just that – they provide another option for our more fitness-minded consumers tohave a great tasting and hydrating beverage while also ensuring they consume their proteinfollowing increased levels of exertion. PWR LIFT is currently exclusively available through Amazon.
Track Record of Industry Leading Financial Performance
We exercise strong financial discipline when managing our business and executing on our growthstrategies, and our financial performance reflects that. While many companies at our stage and withour growth profile adopt a “growth-at-all-cost” mindset, we have always been focused on profitable,responsible, and sustainable growth. Still, we believe we have multiple opportunities to sustain themomentum of our branded coconut water business, and over time continue to expand our margins. Webelieve this strategy is the most prudent and value-maximizing for all of our stakeholders, includinginvestors, consumers, customers, employees, and global citizens, over the long-term horizon.
Our recent historical financial performance reflects the tremendous strides we have made toscale and grow our business:
• For the trailing twelve months ended June 30, 2021, we reported net sales of $334 million,representing a 17% increase from the twelve months ended June 30, 2020.
• For the year ended December 31, 2020, we reported net sales of $311 million, representing a9% increase from $284 million for the year ended December 31, 2019. For the six monthsended June 30, 2021, we reported net sales of $177 million, representing a 15% increase from$154 million for the six months ended June 30, 2020 primarily driven by a 29% increase in netsales of Vita Coco Coconut Water during the same period.
• For the year ended December 31, 2020, we generated gross profit of $105 million, representinga margin of 34% and a 13% increase from $93 million for the year ended December 31, 2019.For the six months ended June 30, 2021, we generated gross profit of $53 million, representinga margin of 30% and remaining relatively flat in absolute dollar terms compared to $53 millionfor the six months ended June 30, 2020.
• For the year ended December 31, 2020, our net income was $33 million, representing a marginof 11% and a 247% increase from our net income of $9 million and a margin of 3% for the yearended December 31, 2019. For the six months ended June 30, 2021, our net income was$9 million, representing a margin of 5% and a 43% increase from our net income of $7 millionand margin of 4% for the six months ended June 30, 2020.
• For the year ended December 31, 2020, our adjusted EBITDA was $35 million, representing amargin of 11% and an increase of 75% from our adjusted EBITDA of $20 million for the year endedDecember 31, 2019. This improved margin was a result of our gross profit margin expansion andright-sized marketing investments. For the six months ended June 30, 2021, our adjusted EBITDA
131
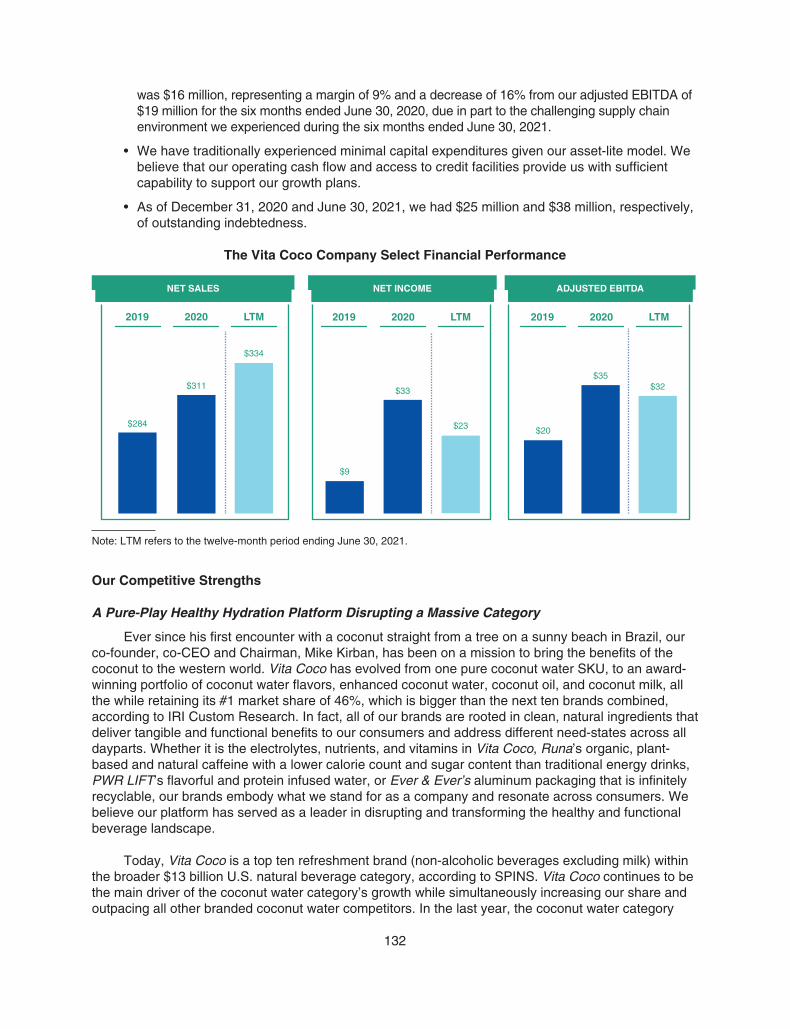
was $16 million, representing a margin of 9% and a decrease of 16% from our adjusted EBITDA of$19 million for the six months ended June 30, 2020, due in part to the challenging supply chainenvironment we experienced during the six months ended June 30, 2021.
• We have traditionally experienced minimal capital expenditures given our asset-lite model. Webelieve that our operating cash flow and access to credit facilities provide us with sufficientcapability to support our growth plans.
• As of December 31, 2020 and June 30, 2021, we had $25 million and $38 million, respectively,of outstanding indebtedness.
The Vita Coco Company Select Financial Performance
2019 2020 LTM 2019 2020 LTM
$9
$33
$23 $20
$35$32
2019 2020 LTM
$284
$311
$334
NET SALES NET INCOME ADJUSTED EBITDA
Note: LTM refers to the twelve-month period ending June 30, 2021.
Our Competitive Strengths
A Pure-Play Healthy Hydration Platform Disrupting a Massive Category
Ever since his first encounter with a coconut straight from a tree on a sunny beach in Brazil, ourco-founder, co-CEO and Chairman, Mike Kirban, has been on a mission to bring the benefits of thecoconut to the western world. Vita Coco has evolved from one pure coconut water SKU, to an award-winning portfolio of coconut water flavors, enhanced coconut water, coconut oil, and coconut milk, allthe while retaining its #1 market share of 46%, which is bigger than the next ten brands combined,according to IRI Custom Research. In fact, all of our brands are rooted in clean, natural ingredients thatdeliver tangible and functional benefits to our consumers and address different need-states across alldayparts. Whether it is the electrolytes, nutrients, and vitamins in Vita Coco, Runa’s organic, plant-based and natural caffeine with a lower calorie count and sugar content than traditional energy drinks,PWR LIFT’s flavorful and protein infused water, or Ever & Ever’s aluminum packaging that is infinitelyrecyclable, our brands embody what we stand for as a company and resonate across consumers. Webelieve our platform has served as a leader in disrupting and transforming the healthy and functionalbeverage landscape.
Today, Vita Coco is a top ten refreshment brand (non-alcoholic beverages excluding milk) withinthe broader $13 billion U.S. natural beverage category, according to SPINS. Vita Coco continues to bethe main driver of the coconut water category’s growth while simultaneously increasing our share andoutpacing all other branded coconut water competitors. In the last year, the coconut water category
132

has consistently outperformed the rest of the water category in the MULO+C channels according to IRICustom Research.
Coconut Water versus Total Water Year-Over-Year 12-Weekly Retail Sales Growth
4.1%
6.7%7.8% 8.0%
8.7% 9.0%8.1%
12.9%
15.3%16.1%
15.5%14.7%
15.4%
2.6%
5.7%
7.7% 7.4% 7.8% 7.7%
3.2%
6.6%
8.2%9.1%
9.6% 9.4%
11.0%
10/4/20 11/1/20 11/29/20 12/27/20 1/24/21 2/21/21 3/21/21 4/18/21 5/16/21 6/13/21 7/11/21 8/8/21 9/5/21
Coconut Water Total Water (excluding Coconut Water)
Rolling 26Weeks
Ending:
Source: Retail sales per IRI Custom Research (MULO + Convenience).
Authentic Brands Appealing to A Loyal and Attractive Base of Consumers Who Are Coveted byRetailers
Our consistent quality and accessibility has helped establish the Vita Coco brand as synonymouswith the coconut water category. According to Numerator, 50% of consumers report Vita Coco as theonly brand they consider within the category. As the most trusted brand in the category, according toBrandSpark, Vita Coco tends to be a planned purchase by 69% of brand shoppers, while also drivingincremental consumers into the coconut water category. Additionally, of the last twelve months’ growth,66% of our growth was attributable to new coconut water category consumers, according toNumerator.
Our brand resonates with the fastest growing demographic groups in the United States. We over-index to multi-cultural and younger consumers, and families, which we believe allows us to capture abroader array of the population, and creates early adoption allowing for long-term brand loyalists.According to Numerator, 55% of our consumers are non-white, with a large portion identifying as Asianor Hispanic, and 43% of our shoppers are Generation Z or Millennials, with 41% of our consumershaving children at home. These are valuable shoppers who are more likely to seek natural and organicfoods, prioritize healthy eating, stay up to date on health trends, care about the environment, andengage in an active lifestyle—all of which align with The Vita Coco Company’s core purpose.According to Mintel research, over 50% of Generation Z want the brands they use to be involved inactivism and nearly three out of four millennials are more likely to buy brands supporting social issuesthat they care about. We always strive to satisfy the functional hydration needs of the emerginggenerations that are leaving their mark on popular culture.
133

Source: 1. Lightspeed / Mintel, “U.S. Functional Drinks”, April 2020.2. Mintel, “American Consumer: A Look Ahead to 2021”.3. Nielsen, “Sustainable Brands Can Pivot With Purpose to Help Address COVID-19”, April 2020.
We believe retailers favor our brands because of the high quality shoppers we attract, alongsidethe premium products we offer. Our brands are able to attract new shoppers and encourage storetraffic, with 860,000+ new households estimated to have been added to our customer base over the12 months ended July 25, 2021, according to Numerator, and shopper baskets with Vita Coco productsare worth 22% more than the average water shopper’s basket over the six month period endedJuly 25, 2021, according to Numerator. Coconut water offers consumers an affordable health andwellness choice, priced more premium than traditional juices and carbonated soft drinks, while stillmore affordable than energy drinks and ready-to-drink coffee, enabling us to democratize healthyeating and natural products and drive strong shopper metrics for retailers.
Select Beverage Categories $/oz
$ 0.03 $ 0.04 $ 0.04 $ 0.04 $ 0.05 $ 0.05 $ 0.05 $ 0.05 $ 0.06 $ 0.06
$ 0.11 $ 0.13
$ 0.15
$ 0.19 $ 0.20
Milk
Carb
onat
edSo
ft Dr
inks
Enha
nced
Wat
er
RTD
Tea
Spar
klin
g W
ater
Juic
es
Spor
ts D
rinks
Dairy
Alte
rnat
ives
Refri
gera
ted
Juic
e &
Othe
r Fun
ct B
ev
Oran
ge J
uice
Coco
nut W
ater
Ener
gy D
rinks
RTD
Coffe
e
Kom
buch
a
Source: Retail and equivalent volume sales per SPINS for the 52 weeks ended May 16, 2021 (MULO + Convenience).
134

Vita Coco Shopper Characteristics
VITA COCO SHOPPERS ARE VALUABLESHOPPERS…
… AND ON ITEMS THROUGHOUT THESTORE!…WHO SPEND A LOT PER TRIP…
$7.01Per Trip
+12%vs. year ago
+37%higher than the Total Water
shopper’sspend per trip
$81.82Average Basket Spend
+11%vs. year ago
+22%higher than the Total Water
shopper’s average basket spend
43% of Vita Coco Shoppers areGen Z + Millennial
41% of Vita Coco Shoppers haveChildren at Home
55% of Vita Coco Shoppersare Non-White
Gen Z: 123 indexMillennials: 142 index
Asian: 227 indexHispanic/La�no: 170 index
Black/AA: 132 index
Age 0-5: 140 indexAge 6-12: 116 index
Age 13-17: 109 index
Source: Numerator for the twelve months ended July 25, 2021.Note: Index represents the relative concentration of Vita Coco shoppers as compared to average of the total U.S. population(represented by an index of 100).
Agile Innovator with a Proven Track Record
Since day one, we have been category innovators, as proven by our decision to initially launchVita Coco and pioneer packaged coconut water in the United States. As first-movers and leaders in amajor beverage category, we understand the key components to ensuring the lasting success of aproduct or brand. When we first started Vita Coco, the coconut water category barely existed in theUnited States and was mostly sold in ethnic grocery stores. We estimate that the coconut watercategory in the United States was under $10 million when we launched Vita Coco in 2004. Today, thiscategory has grown to $658 million in the United States alone, based on Euromonitor data, whichtracks both on-premise and off-premise sales.
We are consistently innovating our existing portfolio range to drive wider adoption of our brands,increase consumption occasions, and take market share across the natural beverage category. Ourcompany culture empowers our entire team such that our field salespeople and marketers are able tointeract with our consumers and incorporate real-time consumer and retailer feedback to identify gapsin our portfolio and find new innovations. For example, inspired by coconut water consumers whosometimes mixed coconut water with other flavored beverages, we created one of the first premiumflavored coconut waters in the United States. We develop and release new products where we believewe can differentiate ourselves in a way that is consistent with long-term consumer trends and canleverage our supply chain and distribution capabilities.
More recently, we launched Vita Coco Pressed, a drink that packs more coconutty flavor intoevery sip. Today, Pressed alone makes up over 8% of the coconut water category, which would makeit the third largest standalone brand, and the second fastest growing coconut water brand in thecategory relative to competing brands, according to IRI Custom Research. Only 9% of householdspurchasing Vita Coco products reported purchasing both Vita Coco Pure and Vita Coco Pressed,according to Numerator, demonstrating that growth from Pressed has been incremental to ourbusiness. We also recently successfully launched a shelf stable coconut milk under the Vita Coco
135

brand to enter the large and growing plant-based dairy alternatives segment, while also increasing VitaCoco’s ability to participate in additional use occasions such as coffee and cereal.
Additionally, we are constantly evaluating our product formats to ensure we are deliveringconsumers what they want in the best possible format. We have released new package types, multi-packs, and larger formats, all of which have supported category growth, and aided in increasingshoppers’ basket sizes by 12%, according to Numerator, and, in 2022, we plan to introduce Vita Cocococonut juice in cans in the United States, where canned coconut water represents approximately 30%of the coconut water category by volume.
Hybrid Go-to-Market Strategy Enabling Us to Win at Retail
Our entire route to market is designed to maximize efficiency, reliability, flexibility, and profitability:from the way we source our coconut water all the way to how our products are delivered to retailersand consumers. We have refined our distribution model over the past two decades, which has enabledus to deliberately tailor our production and go-to-market capabilities to better serve our diversecustomers.
With our unique product portfolio, sophisticated and experienced team, and differentiated supplychain, we believe we are able to outperform smaller competitors with our scale and global reach, while
136

distinguishing ourselves from larger beverage players through our nimbler, hybrid platform. Ourdistribution capabilities ensure our go-to-market path is efficient and effective for each channel weparticipate in, as well as each product in its respective lifecycle. For example, when a product is in itsearly stage of development, we might select a broadline distribution partner for going to market, and asscale increases we could decide to enter it into the DSD system or go DTW if the retailers prefer to doso. Having access to the full range of distribution options, while not being restricted or forced to useonly one of them, maximizes our execution speed and impact.
We employ a passionate and highly energetic sales force that is either on the ground talking toconsumers and store managers, or in regular dialogue with retailers to ensure we are securing the bestpossible shelf locations and displays, and executing programs to benefit our retailers’ business – all asa means to grow our business. This insatiable appetite for expansion is key to our growth andcontinued market position as retailers look to Vita Coco not only as the brand to stock within thecoconut water category, but also as a must-have brand within the natural beverages category. As asign of our ongoing brand and execution strength, we have been able to capture 89% of the growth inthe coconut water category in the current year to date, according to IRI Custom Research.
Year-to-Date Share of Retail Sales Growth in Coconut Water Category
89 %
18 %9 %
0 %
(17)%
Key Competitor 1 Private Label Key Competitor 2 All Others
Source: Retail sales per IRI Custom Research for the year-to-date period ended September 5, 2021 (MULO + Convenience).
In addition to our strong sales force and route to market, we have further entrenched ourrelationship as a value-add supplier to select retailers through servicing their private label needs. Our
137

private label business strengthens our relationships with retailers that are committed to their ownprivate label products, allows us to ensure the integrity and quality of the category and also allows usto enhance the relationships we have forged with coconut water manufacturers globally. This offeringsupports our leadership position within the coconut water category, and while we believe our brandedoffering will drive future growth, our private label offering ensures we are continuing to support bothretailers and suppliers.
A Unique, Asset-Lite Supply Chain That Starts Close to the Coconut Tree and Is Difficult toReplicate
As pioneers of the coconut water industry, and thought leaders in upcycling coconut water, wehave spent the last 17 years developing a global, asset-lite operating model of scale that starts in thetropical belt around the world and is able to seamlessly service our markets with the highest qualitypackaged coconut water. Our growing body of knowledge on efficient manufacturing and sourcingprocesses from farm to facility for coconut water has created a competitive advantage that is unrivaledin the industry today.
We believe we are the largest branded coconut water producer in the world, and to date, nocompetitor has been able to achieve what we do at the same scale and efficiency. We also believe thatreplicating our current supply chain set-up would be challenging and time consuming.
Our well-diversified global network of thousands of coconut farmers and 15 factories across 10countries is able to seamlessly service our end markets with the highest quality, delicious coconutwater. As we do not own any of the coconut water factories that we work with, our supply chain isasset-lite, which combined with our scale, enables us to be flexible and move production from onefacility or country to another as needed. We are able to quickly adapt to changes in the market orconsumer preferences while also efficiently introduce new products across our platform.
Our manufacturing partners arrange the cracking of approximately 2.5 million coconuts each dayat the highest quality standard for our coconut water needs, which requires supply from thousands ofindividual coconut farmers spread across the world and manufacturing operations located as closely aspractical to the farms. This makes our supply chain truly valuable and unique, and sets us apart fromother beverage companies. Our deep, long-standing relationships with our farming community havehelped us scale to where we are today and will continue to support our high-growth business model inthe future, while positioning us for ongoing profitability.
Finally, we believe our purchasing power is supported by our leading market position through VitaCoco and our private label offering, which provide significant scale-based cost advantages versuscompetitors and any potential new entrants across sourcing, shipping, and other logistics.
Social Responsibility Commitment That Permeates Through Our Products and Organization
The Vita Coco Company’s purpose is simple: we believe in harnessing, while protecting, nature’sresources for the betterment of the world and its inhabitants by delivering ethical, responsible, andbetter-for-you hydrating products, that not only taste delicious, but also uplift our communities and doright by our planet. We believe these ideals have had a direct effect on our growth, and causeincreased consumer adoption and spend on our products.
Our operational decision-making goes beyond solely maximizing shareholder value. We operateas a Delaware Public Benefit Corporation. Our commitment to social responsibility has three primaryareas of focus:
• promoting healthy lifestyles;
138

• cultivating communities and culture; and
• protecting natural resources.
In addition to our responsible consumer-facing and organizational initiatives, our business’ growthand scale have aided communities where our manufacturing relationships are located. Many of theseregions have limited modern infrastructure, and we created the Vita Coco Project to help these coconutfarmers increase their annual yield, diversify their crops, and grow sustainably. With our “Give, Grow,Guide” philosophy we remain committed and focused on the future, and seek to contribute toeducational programs and facilities through efforts such as building new classrooms and fundingscholarships; all to impact the lives of over one million people in these communities. We believe thispurpose-driven approach has aided our growth as it is strategically aligned with the beliefs of our globalconsumer base.
OUR MISSION IS TO POSITVELY IMPACT THE LIVES 1 MILLION PEOPLE IN OUR COMMUNITIES
We find and fund initiatives that better the whole community- projects include building classrooms and scholarship
programs.
GIVE
We renew Vita Coco palm groves through seedling andreplanting programs. In addition, we share best practices and
the latest techniques through model farms.
GROWWe are fully committed to only working with suppliers and
partners who respect and care for their employees and theirland. All of Vita Coco’s factories are routinely, independently
audited for ethical sourcing practices.
GUIDE
BUILT ~30 CLASSROOMSSUPPORTED DOZENS OF SCHOLARSHIPS
DISTRIBUTED THOUSANDS OF SEEDLINGS FACILITATED 800 TRAININGS
Entrepreneurial, Inclusive, and Mission-Driven Culture Led by an Experienced Leadership Team
We have built a high-energy, entrepreneurial, and mission-driven management team. This groupis comprised of experienced executives with a track record of success in growing better-for-youhydration and nutritious, healthy brands, developing large scale beverage platforms, and aiding ourcommunities.
Our co-founder, co-CEO and Chairman, Michael Kirban, is the visionary co-founder whopioneered the coconut water category in the United States before healthy, functional beverages weretop-of-mind for mainstream consumers. He partners closely with our other co-CEO, Martin Roper, whojoined the team in 2019 after having been the CEO of The Boston Beer Company for nearly twodecades. Mr. Roper was instrumental in transforming The Boston Beer Company from a regional,disruptive, single-branded craft beer company to an international beverage powerhouse with a portfolioof multiple mainstream brands. Mr. Roper’s experience in achieving diversified growth across multiplebrands and channels through in-house innovation, strategic M&A and a keen sense for whereconsumer appetite is have already proven immensely valuable at The Vita Coco Company.
The passion and focus of our leadership permeate throughout our organization. As such, we havebeen able to attract diverse and highly engaged employees and directors who share our belief in ourmission and have further promoted our inclusive company culture.
Our people are at the heart of everything we do, and we pride ourselves on living our values. Weare human beings first, we operate with a culture of inclusivity, transparency, and optimism, and we
139
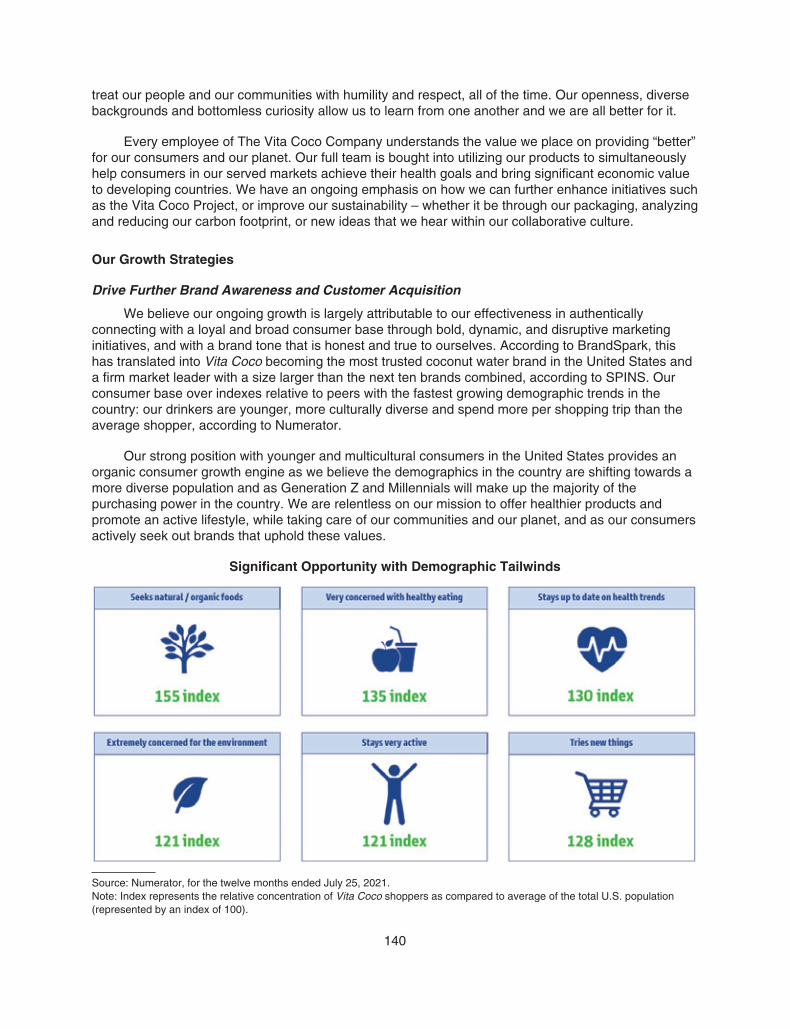
treat our people and our communities with humility and respect, all of the time. Our openness, diversebackgrounds and bottomless curiosity allow us to learn from one another and we are all better for it.
Every employee of The Vita Coco Company understands the value we place on providing “better”for our consumers and our planet. Our full team is bought into utilizing our products to simultaneouslyhelp consumers in our served markets achieve their health goals and bring significant economic valueto developing countries. We have an ongoing emphasis on how we can further enhance initiatives suchas the Vita Coco Project, or improve our sustainability – whether it be through our packaging, analyzingand reducing our carbon footprint, or new ideas that we hear within our collaborative culture.
Our Growth Strategies
Drive Further Brand Awareness and Customer Acquisition
We believe our ongoing growth is largely attributable to our effectiveness in authenticallyconnecting with a loyal and broad consumer base through bold, dynamic, and disruptive marketinginitiatives, and with a brand tone that is honest and true to ourselves. According to BrandSpark, thishas translated into Vita Coco becoming the most trusted coconut water brand in the United States anda firm market leader with a size larger than the next ten brands combined, according to SPINS. Ourconsumer base over indexes relative to peers with the fastest growing demographic trends in thecountry: our drinkers are younger, more culturally diverse and spend more per shopping trip than theaverage shopper, according to Numerator.
Our strong position with younger and multicultural consumers in the United States provides anorganic consumer growth engine as we believe the demographics in the country are shifting towards amore diverse population and as Generation Z and Millennials will make up the majority of thepurchasing power in the country. We are relentless on our mission to offer healthier products andpromote an active lifestyle, while taking care of our communities and our planet, and as our consumersactively seek out brands that uphold these values.
Significant Opportunity with Demographic Tailwinds
Source: Numerator, for the twelve months ended July 25, 2021.Note: Index represents the relative concentration of Vita Coco shoppers as compared to average of the total U.S. population(represented by an index of 100).
140
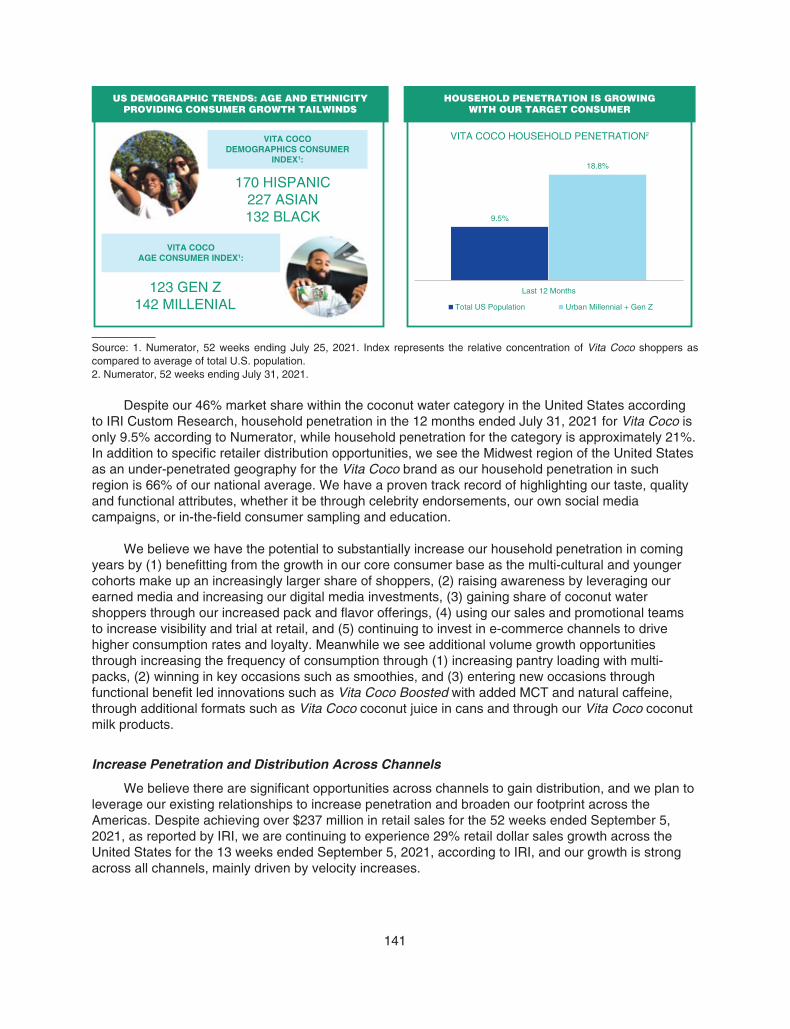
170 HISPANIC227 ASIAN132 BLACK
123 GEN Z142 MILLENIAL
9.5%
18.8%
Last 12 Months
VITA COCO HOUSEHOLD PENETRATION2
Total US Population Urban Millennial + Gen Z
VITA COCODEMOGRAPHICS CONSUMER
INDEX1:
US DEMOGRAPHIC TRENDS: AGE AND ETHNICITYPROVIDING CONSUMER GROWTH TAILWINDS
HOUSEHOLD PENETRATION IS GROWINGWITH OUR TARGET CONSUMER
VITA COCOAGE CONSUMER INDEX1:
Source: 1. Numerator, 52 weeks ending July 25, 2021. Index represents the relative concentration of Vita Coco shoppers ascompared to average of total U.S. population.2. Numerator, 52 weeks ending July 31, 2021.
Despite our 46% market share within the coconut water category in the United States accordingto IRI Custom Research, household penetration in the 12 months ended July 31, 2021 for Vita Coco isonly 9.5% according to Numerator, while household penetration for the category is approximately 21%.In addition to specific retailer distribution opportunities, we see the Midwest region of the United Statesas an under-penetrated geography for the Vita Coco brand as our household penetration in suchregion is 66% of our national average. We have a proven track record of highlighting our taste, qualityand functional attributes, whether it be through celebrity endorsements, our own social mediacampaigns, or in-the-field consumer sampling and education.
We believe we have the potential to substantially increase our household penetration in comingyears by (1) benefitting from the growth in our core consumer base as the multi-cultural and youngercohorts make up an increasingly larger share of shoppers, (2) raising awareness by leveraging ourearned media and increasing our digital media investments, (3) gaining share of coconut watershoppers through our increased pack and flavor offerings, (4) using our sales and promotional teamsto increase visibility and trial at retail, and (5) continuing to invest in e-commerce channels to drivehigher consumption rates and loyalty. Meanwhile we see additional volume growth opportunitiesthrough increasing the frequency of consumption through (1) increasing pantry loading with multi-packs, (2) winning in key occasions such as smoothies, and (3) entering new occasions throughfunctional benefit led innovations such as Vita Coco Boosted with added MCT and natural caffeine,through additional formats such as Vita Coco coconut juice in cans and through our Vita Coco coconutmilk products.
Increase Penetration and Distribution Across Channels
We believe there are significant opportunities across channels to gain distribution, and we plan toleverage our existing relationships to increase penetration and broaden our footprint across theAmericas. Despite achieving over $237 million in retail sales for the 52 weeks ended September 5,2021, as reported by IRI, we are continuing to experience 29% retail dollar sales growth across theUnited States for the 13 weeks ended September 5, 2021, according to IRI, and our growth is strongacross all channels, mainly driven by velocity increases.
141

Vita Coco YoY Retail Sales Growth
23% 27%18%
9%
28%
55%
19%
40%
MULO C-store Food Drug
Last 52 Weeks Last 26 Weeks
Source: Retail sales per IRI for the 52 and 26 weeks ended September 5, 2021 (MULO + Convenience).
We see opportunities to translate this consumption growth into further distribution gains acrosschannels, with a simultaneous focus on increasing shelf space and velocity in current doors. Due to ourstrong velocities across channels, we believe we have the opportunity to grow our points of distributionby approximately two fold with the Vita Coco brand alone. Specifically, we believe we have anopportunity in large format accounts to increase the number of items per store by maximizing our coreitem distribution in regional chains as well as the introduction of multipacks and new product lines suchas our premium Farmers Organic products and Vita Coco Boosted, which highlights our sustainablesourcing, and Vita Coco Boosted. Coconut water multipacks are particularly attractive for our business,as retail sales of multipacks are outgrowing competing natural and healthy beverage categories, butonly take up approximately one-half the shelf space that we believe should be allocated to multipacksin our category, according to IRI. In addition, we see a large opportunity to increase the number ofdoors in the convenience channel, where Vita Coco remains under distributed with only 55% of all-commodities-value weighted distribution, or ACV distribution, according to IRI. Furthermore, ourintroduction of Vita Coco coconut juice in cans is intended to support our convenience channeldistribution with an opportunity to add more items per store.
In addition, we see a large opportunity to increase the number of doors in the conveniencechannel, where Vita Coco remains under distributed with only 55% of all-commodities-value weighteddistribution, or ACV distribution, according to IRI. Furthermore, our introduction of Vita Coco coconutjuice in cans is intended to support our convenience channel distribution with an opportunity to addmore items per store.
IRI reported velocity, defined as dollars per point of distribution, is already higher than select cranberryjuice, enhanced water and sparkling water brands that are two to five times our size. However, our totaldistribution points are significantly below any of these brands. We believe this represents a significantopportunity to meaningfully expand our distribution levels across channels and capture additional shelfspace, while simultaneously focusing on increasing the number of our products sold per store.
142

Vita Coco Velocity Growth
24%
32%
22%
33%
MULO C-store Food Drug
% Change in Velocity vs. Year Ago
Add Additional Multipacks
Add New Doors and Grow Space
Add Additional Multipacks
Grow Single Serve Space93 55 94 92
Distribution Opportunity ACV Weighted Distribution
Source: Velocity is % change in Retail $ sales per TDP for the 13 weeks ended September 5, 2021. ACV weighted distribution isfor the 52 weeks ended September 5, 2021 (Both from IRI Custom Research, MULO + Convenience).
We also believe the foodservice channel contains massive whitespace for us and, as the channelwhere Vita Coco originally found its roots, we are confident in our ability to capture it. In partnershipwith strong route to market partners specializing in the foodservice channel, we are especially focusedon gyms, travel, office delivery, vending, healthcare, and education segments with a longer-term focuson casual dining opportunities. Lastly, we see a large opportunity to expand our e-commerce business,where we are a market share leader on Amazon, Instacart, and on various other e-commerceplatforms such as Walmart.com and Ready Refresh, and are in the process of building in-house DTCcapabilities.
Our Amazon business in the Americas represented approximately 6% of our Vita Coco grosssales in 2020, and we have experienced significant momentum on Amazon-based branded retail salesas demonstrated by the 45% increase in such retail sales in the 12 months ended August 28, 2021 ascompared to the prior 12 month period.
Continue Investing in Innovation Initiatives
As the market leader in the coconut water category, we have led the way in innovation. Wecontinue to seek ways to leverage our expertise in product development to innovate within our portfolioand be ahead of the ever-changing consumer demands and preferences. We set a high bar for productextensions and new brands when developing potential additions to our portfolio and we demandsuperior quality products, healthier attributes and clean labels. We extensively test our products withconsumers in-market as well as in test environments.
As an example, in 2021 we identified the growing consumer need for functional beverages thatprovide sustained energy all day, but without the high caffeine and coffee aftertaste, and we launchedVita Coco Boosted, a coconut water product with a blend of coconut MCT oil, coconut cream,B-vitamins, and tea extract, with no added sugar. With geographically focused distribution across keyretailers, the product is proving to be highly incremental to the brand and the category.
We intend to focus on introducing products that are aligned with our mission and consumer base,and to expand in categories where we believe we can compete and win, such as our recentintroductions of Vita Coco Hydration Drink Mix and PWR LIFT.
Broaden Our Geographic Reach
For the six month ended June 30, 2021, 15% of our net sales were international and we see anopportunity to grow further within existing and new geographies over the coming years. We pioneered
143

the coconut water category in Europe and were early entrants into China in 2014, and as of June 30,2021 our international business is approximately 60% in Europe, 15% in Asia Pacific, and 25% in otherregions and includes private label and commodities. The success of our coconut water productsdemonstrates both our ability to win in new markets, and the international appeal of our brands. Ourinternational business is anchored by Vita Coco’s footprint in the United Kingdom, where it is thecoconut water category leader with over 70% market share, according to IRI U.K. Our scale and nimbleroute to market which combines direct to retail, wholesalers and ecommerce in the United Kingdom,and a local sales and marketing team directing promotions and investments against marketopportunities, allows us to be impactful and reactive to changes in the beverage market. While ourprimary focus is on beverages, we have innovated in collaboration with key retail partners by extendingthe brand into natural personal care products that have been well received by our loyal consumer baseand are allowing us to test which broader consumer needs our brand can expand to meet.
We entered the United Kingdom, China, France and Spain early in our international journey, andlearned from some of the keys to success in different export markets. We adjusted our approach in2019 to focus on key markets and retailers to build a stronger base business, and now have healthyprofitable stable businesses that we can build from. Our U.K. team runs market development activitiesin Europe and the Middle East. In the China market, we have a commercial team focused on localexecution for which costs are shared with our local distribution partner. We have differing route tomarket models for each country and the varied approaches have allowed us to establish our brandsand invest in these markets for long-term growth in a prudent financial way, and to evolve ourapproach in each market as our brand develops.
We believe we are uniquely positioned to take greater share of the large and growing globalnatural beverages market based on the functional benefits that our Vita Coco brand offers consumersinterested in health and wellness and our company’s mission and responsible sourcing that shouldappeal to consumers’ interest in purpose driven brands. Leveraging our global capabilities, we believewe can continue to grow existing markets and broaden our global reach through the addition of newmarkets. For each country we customize our product offering and packaging, initially focus onmarketing and sales activation in key cities to establish the brand, and look for potential innovationopportunities unique to that culture that would boost our brand’s probability of success.
We plan to prioritize regions where we believe the most attractive opportunities are available tous based on product fit with consumer demographics and interest in health, wellness and purpose, andmarket opportunity. We are currently focused on regions such as Western Europe and China, wherewe believe the interest in health and wellness is growing and the markets are sizable and expected togrow significantly.
Leverage Growth, Continuous Improvement, and Scale for Margin Expansion
Since our founding, we have exercised healthy financial discipline when managing our businessand executing on our growth strategies. While many companies at our stage and with our growthprofile employ a “growth-at-all-cost” mindset, we have always been focused on profitable, responsible,and sustainable growth. We view this strategy to be most prudent and value-maximizing for all of ourstakeholders, including investors, consumers, customers, employees, and global citizens, over thelong-term horizon.
Our financial discipline was a primary motivator to build out an asset-lite model that provides usstrong gross margins and high free cash flow generation, which together provides us financialflexibility. Our investment in engineering resources to support our suppliers has identified a consistentflow of operational improvement projects that we and the suppliers have benefited from, and whileslightly paused during COVID-19, we anticipate this continuing on an ongoing basis. As we continue to
144
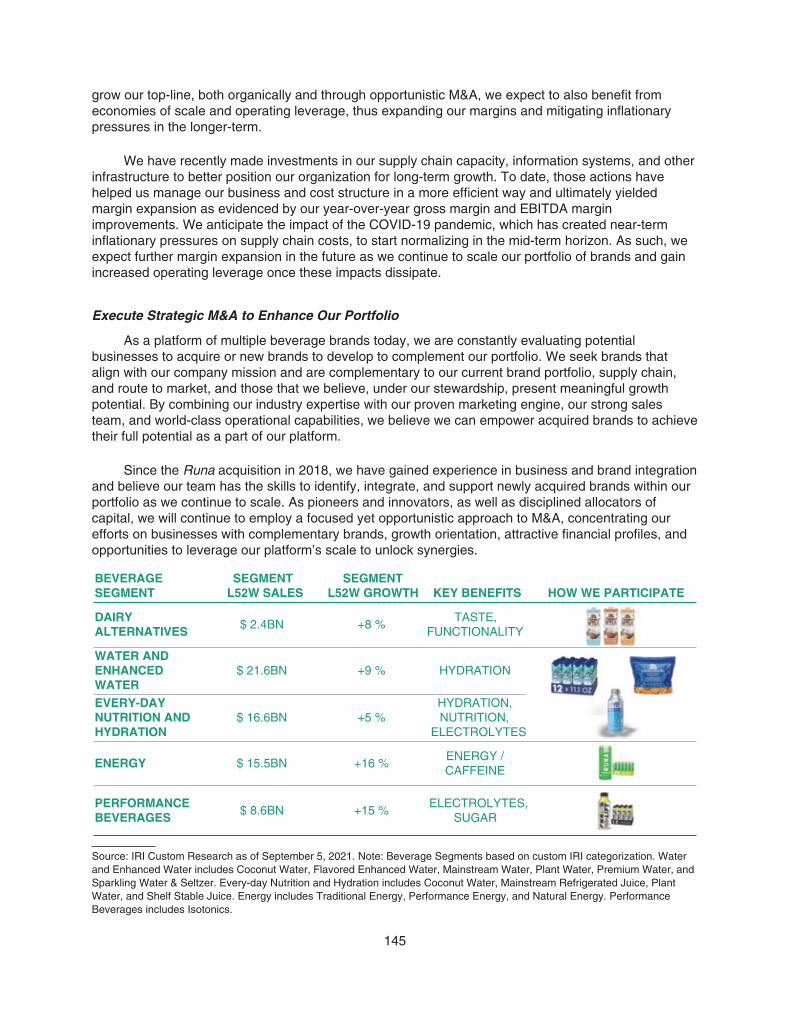
grow our top-line, both organically and through opportunistic M&A, we expect to also benefit fromeconomies of scale and operating leverage, thus expanding our margins and mitigating inflationarypressures in the longer-term.
We have recently made investments in our supply chain capacity, information systems, and otherinfrastructure to better position our organization for long-term growth. To date, those actions havehelped us manage our business and cost structure in a more efficient way and ultimately yieldedmargin expansion as evidenced by our year-over-year gross margin and EBITDA marginimprovements. We anticipate the impact of the COVID-19 pandemic, which has created near-terminflationary pressures on supply chain costs, to start normalizing in the mid-term horizon. As such, weexpect further margin expansion in the future as we continue to scale our portfolio of brands and gainincreased operating leverage once these impacts dissipate.
Execute Strategic M&A to Enhance Our Portfolio
As a platform of multiple beverage brands today, we are constantly evaluating potentialbusinesses to acquire or new brands to develop to complement our portfolio. We seek brands thatalign with our company mission and are complementary to our current brand portfolio, supply chain,and route to market, and those that we believe, under our stewardship, present meaningful growthpotential. By combining our industry expertise with our proven marketing engine, our strong salesteam, and world-class operational capabilities, we believe we can empower acquired brands to achievetheir full potential as a part of our platform.
Since the Runa acquisition in 2018, we have gained experience in business and brand integrationand believe our team has the skills to identify, integrate, and support newly acquired brands within ourportfolio as we continue to scale. As pioneers and innovators, as well as disciplined allocators ofcapital, we will continue to employ a focused yet opportunistic approach to M&A, concentrating ourefforts on businesses with complementary brands, growth orientation, attractive financial profiles, andopportunities to leverage our platform’s scale to unlock synergies.
BEVERAGESEGMENT
SEGMENTL52W SALES
SEGMENTL52W GROWTH KEY BENEFITS HOW WE PARTICIPATE
DAIRYALTERNATIVES
$ 2.4BN +8 %TASTE,
FUNCTIONALITY
WATER ANDENHANCEDWATER
$ 21.6BN +9 % HYDRATION
EVERY-DAYNUTRITION ANDHYDRATION
$ 16.6BN +5 %HYDRATION,NUTRITION,
ELECTROLYTES
ENERGY $ 15.5BN +16 %ENERGY /CAFFEINE
PERFORMANCEBEVERAGES
$ 8.6BN +15 %ELECTROLYTES,
SUGAR
Source: IRI Custom Research as of September 5, 2021. Note: Beverage Segments based on custom IRI categorization. Waterand Enhanced Water includes Coconut Water, Flavored Enhanced Water, Mainstream Water, Plant Water, Premium Water, andSparkling Water & Seltzer. Every-day Nutrition and Hydration includes Coconut Water, Mainstream Refrigerated Juice, PlantWater, and Shelf Stable Juice. Energy includes Traditional Energy, Performance Energy, and Natural Energy. PerformanceBeverages includes Isotonics.
145

Our Industry
Large and Attractive Category Aligned with Key Consumer Trends
We operate in the large and growing non-alcoholic beverages industry, which consists of bottledwater, carbonated soft drinks, juice, ready-to-drink coffee and tea, energy drinks, sports drinks,drinking milk products and other non-alcoholic beverages. Global non-alcoholic beverages on-and-off-combined retail sales exceeded $952 billion in 2020 and are expected to reach $1.36 trillion by 2025,representing a CAGR of 7%, according to Euromonitor. The United States, which is our largest market,generated retail sales of over $119 billion for the 52 weeks ended May 16, 2021, according to SPINS.In line with retail, foodservice also represents a significant opportunity for us, which we believeexpands the total addressable market even further.
Our brands Vita Coco and Runa participate in the natural, plant-based category of the beveragesindustry, and offer consumers better-for-you products with functional benefits. Through the brands inour platform, we are able to cover many functional needs, spanning across hydration, nutrition, andenergy. With our coconut milk product, we are also able to tap into the plant-based dairy substitutecategory, which is rapidly increasing in popularity and size, and fits with our mission of creatingresponsible, natural, and better-for-you products. Our product attributes deliver what consumers todaydesire, as is evidenced by rapid growth in plant-based products. According to an April 2021 onlinearticle published by SPINS, plant-based food and beverage consumption increased 29% in 2020alone, and in a recent consumer survey powered by Lightspeed/Mintel, 65% of consumers reportedenjoying a functional beverage in the three months preceding the survey.
The natural beverages category generates $13 billion in U.S. retail sales, and is growing twice asfast as conventional beverages, according to SPINS. Since our launch in the early 2000s, we haveseen spending on natural beverages far outpace that of conventional beverages due to increasedconsumer demand for health and wellness focused products, and today the average price per liquidounce for the natural beverage brands is indexed at 206 compared to the average price per liquidounce for the total beverage category. Health is the fastest growing beverage need state, withoccasions up over 30% in the past 10 years according to Kantar, thereby fueling incrementalconsumption. People are increasingly consuming better-for-you, plant-based beverages to hydrateafter and during exercise, to add nutritional benefits to their diets, and to enhance their well-being. We,and industry data aggregators, believe this trend is expected to continue as consumers keep searchingfor products that make them feel good and provide functional benefits. Based on SPINS data, webelieve our current market share is less than 2% of total U.S. natural beverages retail sales, providingour platform with significant room for future growth.
146
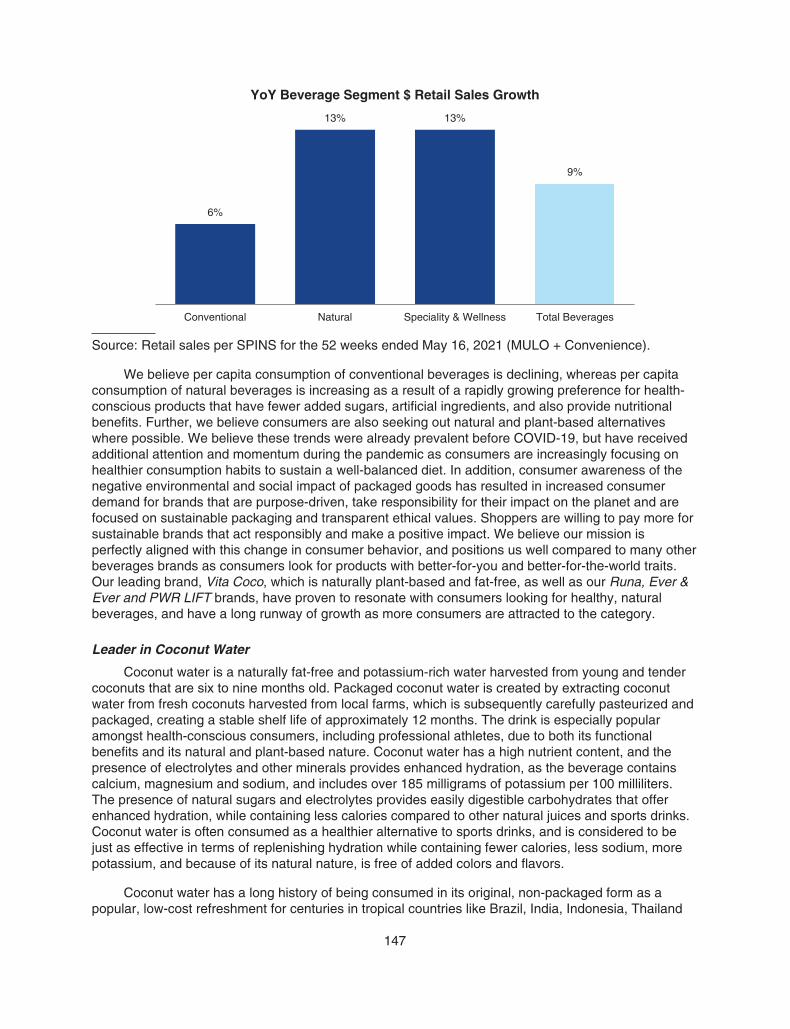
YoY Beverage Segment $ Retail Sales Growth
6%
13% 13%
9%
Conventional Natural Speciality & Wellness Total Beverages
Source: Retail sales per SPINS for the 52 weeks ended May 16, 2021 (MULO + Convenience).
We believe per capita consumption of conventional beverages is declining, whereas per capitaconsumption of natural beverages is increasing as a result of a rapidly growing preference for health-conscious products that have fewer added sugars, artificial ingredients, and also provide nutritionalbenefits. Further, we believe consumers are also seeking out natural and plant-based alternativeswhere possible. We believe these trends were already prevalent before COVID-19, but have receivedadditional attention and momentum during the pandemic as consumers are increasingly focusing onhealthier consumption habits to sustain a well-balanced diet. In addition, consumer awareness of thenegative environmental and social impact of packaged goods has resulted in increased consumerdemand for brands that are purpose-driven, take responsibility for their impact on the planet and arefocused on sustainable packaging and transparent ethical values. Shoppers are willing to pay more forsustainable brands that act responsibly and make a positive impact. We believe our mission isperfectly aligned with this change in consumer behavior, and positions us well compared to many otherbeverages brands as consumers look for products with better-for-you and better-for-the-world traits.Our leading brand, Vita Coco, which is naturally plant-based and fat-free, as well as our Runa, Ever &Ever and PWR LIFT brands, have proven to resonate with consumers looking for healthy, naturalbeverages, and have a long runway of growth as more consumers are attracted to the category.
Leader in Coconut Water
Coconut water is a naturally fat-free and potassium-rich water harvested from young and tendercoconuts that are six to nine months old. Packaged coconut water is created by extracting coconutwater from fresh coconuts harvested from local farms, which is subsequently carefully pasteurized andpackaged, creating a stable shelf life of approximately 12 months. The drink is especially popularamongst health-conscious consumers, including professional athletes, due to both its functionalbenefits and its natural and plant-based nature. Coconut water has a high nutrient content, and thepresence of electrolytes and other minerals provides enhanced hydration, as the beverage containscalcium, magnesium and sodium, and includes over 185 milligrams of potassium per 100 milliliters.The presence of natural sugars and electrolytes provides easily digestible carbohydrates that offerenhanced hydration, while containing less calories compared to other natural juices and sports drinks.Coconut water is often consumed as a healthier alternative to sports drinks, and is considered to bejust as effective in terms of replenishing hydration while containing fewer calories, less sodium, morepotassium, and because of its natural nature, is free of added colors and flavors.
Coconut water has a long history of being consumed in its original, non-packaged form as apopular, low-cost refreshment for centuries in tropical countries like Brazil, India, Indonesia, Thailand
147

and the Philippines. Advancements in aseptic packaging allowed coconut water to be commerciallysold and available to other markets as a packaged beverage since the early 2000s. The beverage wasfirst introduced to the U.S. market with the introduction of Vita Coco, offering U.S. consumers apremium, yet affordable, better-for-you natural beverage. The category quickly reached $103 million inU.S. retail sales by 2010, as packaged coconut water grew into a mainstream better-for-you beverage.According to Euromonitor, the category has grown at a CAGR of approximately 20% to reach$658 million in retail sales in 2020, inclusive of on-premise.
The majority of the coconut water category’s U.S. growth from 2011 to 2020 was driven by VitaCoco, which contributed over 60% of total coconut water retail sales growth during that period,according to Euromonitor. Vita Coco was the leading brand that made coconut water into themainstream beverage it is today, and has been the leading category brand in the United States overthe last decade. The category’s expansion has been driven by a shift towards natural and functionalbeverages as consumers increasingly seek healthy alternatives for traditional soft drinks, processedjuices and sports drinks. Growth has been largely driven by increased household penetration fromshoppers trading-up from other beverage categories, as well as increased consumption from existingcategory buyers. For the six months ended July 25, 2021, 21% of coconut water growth came fromshoppers shifting away from other beverage categories and 75% of growth was a result of increasedconsumption from existing category buyers, according to Numerator.
We have been able to consistently maintain and grow our number one market share position as thecategory’s most preferred and trusted brand both before and during the COVID-19 pandemic. Accordingto Numerator, for 69% of our shoppers, Vita Coco is a planned purchase and for 50% of our shoppers, itis the only brand considered. From September 2020 to September 2021, we have increased our marketshare from 42% to 46%, according to IRI Custom Research. Vita Coco is continuing to drive thecategory’s accelerated growth by adding more incremental dollar sales than any other competing brand.According to IRI Custom Research, Vita Coco’s retail sales grew more than twice as fast as the totalcoconut water category for the 13 and 26 week periods ended September 5, 2021, which we believe isthe result of attracting new customers to the category and taking share from competing brands. In manylarge categories like ready-to-drink coffee and sports drinks, we believe leading brands have marketshare positions well above 60%. We believe these represent a meaningful opportunity to grow our marketshare from our current levels as well. This is further supported by the fact that our relatively lowhousehold penetration of approximately 9.5% leaves us ample opportunity for further penetration withinour relevant markets.
Vita Coco Coconut Water Dollar Market Share
L52W September 2020
Vita Coco:42%
L52W September 2021
Vita Coco:46%
Vita Coco Other Brands
Source: Coconut water category per IRI Custom Research for the 52 weeks ended September 5, 2021 (MULO + Convenience).
148

Within the broader water category, coconut water has outperformed most other competitive beverages,as well as the overall water category, over the past year, according to IRI Custom Research. Additionally,coconut water’s velocity is one of the fastest growing of all water categories. We believe that the strength ofour Vita Coco brand, coupled with investments in new product innovation, positions us to continue to deliverindustry-leading growth within the coconut water and broader functional beverages category.
Year-over-Year Dollar Sales Growth
9%13%
20%
11% 12%
6%
11%
15%
29%
4%
15%
9%
TotalWater
CoconutWater
PremiumWater
SparklingWater
EnhancedWater
MainstreamWater
L52W L26W
Velocity %Change -
L26W:+21% +32% +6% +18% +11%+14%
Source: Retail sales per IRI Custom Research, MULO + Convenience channels, for the 26 and 52 week periods endedSeptember 5, 2021. Velocity per IRI Custom Research, MULO + Convenience channels, for the 26 week periods endedSeptember 5, 2021. Velocity change represents L26W % change in average weekly dollars sold per store.
Sales, Marketing and Innovation
Sales
As of June 30, 2021, we had approximately 114 employees within our global sales andcommercial team. In the Americas the sales team reports to our Chief Sales Officer and is broken intothree main groups, DSD management, national account management (including club, mass food andconvenience) and retail execution, and our e-commerce channel reports to our Chief Marketing Officer.The Americas sales team has an extensive range of experience from leading beverage and consumergoods companies including Heineken, Nestle Waters North America (now Triton Brands), andPepsiCo. The teams work cooperatively and in close coordination with our national network of DSDcustomers, broadline distribution partners and select brokers, to access and support our accountsacross the United States and Canada, and with importers to support our business outside of NorthAmerica. The broader Americas sales organization is supported by a category management, revenuemanagement and sales operations team. Our retail execution team is expanded by seasonal hires toprovide seasonal and tactical program support and is supported by an active field marketing team forpromotions and samplings.
Our European Sales team, reporting to our managing director of Europe/Middle East is alignedgeographically and by major account or country importer partner, and is further supported by a smallfield execution team and field marketing in the United Kingdom. Private label accounts are handled byeach geographic division in close cooperation with supply chain leadership.
149

Marketing
The primary goal of our marketing is to educate consumers about our functional benefits whileinspiring and exciting consumers to fall in love with our brands. To market our Vita Coco brand, wefocus on educating consumers around when and why to drink our products, but do so with humor andlevity in our unique brand tone.
Our efforts span all marketing levers with particular focus on package design, retail execution anda combination of paid and owned media, where we have a highly engaged consumer base, as a way tocommunicate with current and potential Vita Coco drinkers seeking to entertain and inform about whowe are and what we offer in our unique, lighthearted brand tone. We have leveraged the strength ofour category leading Vita Coco brand, our disruptive marketing and our innovation capabilities tocontinually broaden our portfolio.
150

151

We use our internal consumer insights, coupled with external data sources and advisors, toimprove our consumer understanding and the effectiveness of our consumer and retailer messaging.We use a blend of both internal resources and strategic partnerships with key marketing agencies tohelp us develop our messaging and promotional materials. We also maintain internal designcapabilities to support packaging and promotional material needs and supplement that with externaldesign creatives or agencies depending on the size of project. These capabilities enable us totransition quickly and ensure that our communication is relevant in the moment. We use externalresearch to iterate our learning and ensure that final packaging or promotions have a better probabilityof improving our business.
Our Vita Coco packaging serves as a disruptor at shelf, and is designed to communicate thesource of our coconuts and our natural roots. We also use our packing to educate about our coreproposition, the benefits of drinking coconut water, and our brand values. We use creative displays andprograms in store to bring our brand to life, and tell our story. Our diversity of occasions enables us toexecute in multiple parts of the store, at multiple times of year, and with a diverse set of partners. Ourfield marketing and experiential activation efforts similarly focus on sampling consumers at the point ofneed, leveraging our core occasions.
152

We have built a strong digital presence in e-commerce channels for the brand. We use ownedsocial media channels, where we have a highly engaged consumer base as a way to communicatewith current and potential Vita Coco drinkers in a way that is true to our brand with the goal ofentertaining and informing about who we are and what we offer. We primarily utilize Instagram, TikTok,Twitter and Facebook. These platforms are fundamentally changing the way we engage with ourconsumers and allow us to directly reach desirable target demographics such as millennials and“Generation Z.” This has earned and continues to earn the brand high consumer engagement levelsand strong consumer appraisal as Vita Coco currently is the most reviewed and highest-rated coconutwater on Amazon.
We maintain an active company LinkedIn account, which we use to disseminate news related toThe Vita Coco Company and its brands and as a job board for individuals interested in working with us.As of June 30, 2021, we had more than 60,000 LinkedIn followers.
Since the early days, Vita Coco has enjoyed a roster of celebrity and athlete fans. In 2010 and2011, a group of well-known celebrities including Madonna, Rihanna, Demi Moore and MatthewMcConaughey invested in the brand, touting the efficacy of the product and authenticity of the brand as
153

their reasons for betting on coconut water. Today, Vita Coco continues to leverage relationships withtalent and influencers who are aligned with our values and are genuine fans of our brand. This team of“real partners” serves as the mouthpiece for the brand, credibly speaking to the products’ benefits andamplifying our message across traditional and digital media channels. This earned media approachhas been very successful at driving awareness and buzz, embedding the brand in pop culture andultimately driving genuine connections with our consumers.
We have distinct brand marketing teams supporting our business in the Americas and Europe,with teams dedicated to the individual brands in our portfolio. Each brand has a strategy tailored togrowing the brand’s consumer base, and building emotional connections with our consumers. We havea 26 person brand, marketing, e-commerce and insights team with strong creative, social, and digitalcapabilities. Historically, our marketing spend as a percentage of net sales has been in the mid-to-highsingle digits. We intend to continue supporting our brands and marketing efforts with similar investmentlevels in the future.
Innovation
Our vision for innovation is to disrupt the status quo by bringing better products using natural,functional ingredients, to compete in big legacy beverage categories that are wrought with syntheticingredients. We have significant expertise working with versatile plant based ingredients to delivergreat tasting nutritious products. We balance exploring ways to add functionality and taste to existingbrands to keep them relevant with consumers, and researching and developing products for newoccasions, needs states or specific retailer opportunities.
Our global innovation function sits in the marketing team to ensure alignment with current brandinitiatives and sharing of consumer insights across teams and markets. We emphasize combiningconsumer insights and market observations to drive activity, to deliver a consistent product pipeline forexisting brands and to attempt to solve consumer needs with new to world brands that can be tested inmarket and iterated based on consumer and retailer feedback. The innovation team works closely withour internal global research and development and technical teams that includes members in the UnitedStates, Europe and Singapore working on supplier capability, quality improvements and newprocesses. This team has expert capabilities in working with natural ingredients, and leverage theadvantage of our suppliers’ capabilities to convert our ideas into shelf stable products. To support ourefforts, we also have strong supplier relationships that give us access to a broad scope of ingredients,packaging offerings and technology. The team also works closely with our commercial sales teams todesign test markets and to build commercial plans that will give each project the best chance ofsuccess. Our team has a track record of bringing new ideas to market in three to six months, and webelieve this speed to market represents a core competitive advantage. Our diverse route-to-market andchannel access enables us to test and learn in market, and our ability to learn and pivot from suchtests is a key capability for our long-term innovation success.
Channels and Customers
Our diversified portfolio of products is available in 24 countries across three continents through avariety of channels. Our primary market is the Americas where we sell product direct to certainretailers, direct to e-commerce operators, and to a national DSD network that supports most of ournon-direct retail partners, and to broadline distributors such as UNFI and KEHE to support retailerswith special service requirement. Our biggest direct retailers are Costco, Sam’s Club and Amazon. Ourbiggest DSD customers are KDP, Canada Dry and Polar Distributing. Our Canada business ismanaged by our Americas team and is primarily retail direct. Our European market is primarily retailand e-commerce operator direct sales, with some countries or route-to-market supported by distributor
154
or importer type relationships. In China, we sell to Reignwood which is our import and distributorpartner for the territory, and one of our principal shareholders since 2014. Other countries are servedthrough importers with limited retail direct relationships or in partnership with one of our manufacturingpartners through licensing or other agreements.
In the United States, we have broad Vita Coco retail distribution nationally, but still haveopportunities to build retail distribution particularly in convenience stores and smaller grocery chainaccounts as well as independent stores, and in the food service channel. Our other brands are still atearly stage development of building distribution and success in key test markets or with early adoptingretailers or foodservice.
Our DSD customers support our brands and build and service our distribution, particularly inmarkets and or smaller accounts that our sales teams would not reach. As the leading coconut waterbrand, we believe we play an important role in our DSD customers portfolio and add importantincremental margin to their business.
We manage our e-commerce channel internally with help from media agencies, and see thischannel continuing to grow share of our business. We invest in capturing consumers in the channel tomaintain our brand share position, and use the channel to test new products and new messaging toselling our products. To support this innovation learning, and to build stronger relationships with ourmost loyal customers, we are in early stages of developing DTC capability and sales to date arenegligible.
Our Supply Chain
We primarily engage contract manufacturers, co-packers and third-party logistics providers tomanufacture and distribute our products. Our asset-lite model enhances production flexibility andcapacity and enables us to focus on our core in-house capabilities, including supplier management,logistics, sales and marketing, brand management and customer service, allowing management todrive profitable growth. We have a dedicated in-house supply chain team that partners with our globalsupplier and distribution network to seamlessly source, package and deliver the highest quality productto our customers and consumers around the world.
Sourcing
Raw materials used in our business and by our co-packers consist of ingredients and packagingmaterials purchased from local, regional and international suppliers. The principal ingredients includecoconut water, Tetra Paks and caps, cardboard cartons, PET bottles and aluminum bottles and cans.We work with our contract manufacturing partners to purchase our raw ingredients from local suppliersin accordance with rigorous standards to assure responsible sourcing, quality and safety. The majorityof our products are produced and packaged with materials sourced from a single supplier, Tetra Pak,whether purchased by the Company or by our contract manufacturers on our behalf, which provides usefficiency in the packaging and export of our products, and furthers our commitment to responsiblesourcing, packaging near source, and sustainability.
Manufacturing
We engage contract manufacturers and co-packers to produce our finished goods. We purchaseproducts from these manufacturing and co-packing partners, which include all packaging andingredients used.
155
Our well-diversified global network spans across 10 countries, 15 coconut water factories and fiveco-packing facilities, which together provide us with significant production capacity and capabilities,and an ability to quickly re-allocate purchasing volume in the event of weather, logistics or othermacroeconomic impacts. We have long-term relationships with most of these partners and exclusivecoconut water supply relationships with many of them which provides us a stable supply base. Ournetwork of eight co-packing partners located across North America and Europe possess expertise incanning, PET and Tetra to support our packaging needs for local production close to market, forinnovation and expand our total packaging capabilities beyond what is available at our contractmanufacturing partners.
Our two largest co-parking and/or contract manufacturer partners, Century Pacific AgriculturalVentures, Inc., or CPIV, and Fresh Fruit Ingredients, Inc., or FFI, an affiliate of Axelum ResourcesCorp., accounted for 27% and 18%, respectively, of our purchases for the year ended December 31,2020.
We currently operate under a Manufacturing and Purchase Agreement with CPIV, datedSeptember 17, 2012 (as subsequently amended, supplemented or modified), or the CPIV Agreement,pursuant to which CPIV manufactures and packages coconut water and coconut oil products. Underthe terms of the CPIV Agreement, we are required to purchase, and CPIV must manufacture andproduce, a minimum monthly order volume of certain specified products. The CPIV Agreement alsocontains detailed provisions regarding plant improvements, product specification and quality standardsfor the products manufactured and packaged by CPIV, trademark and intellectual property rights,shipping and storage obligations, allocation of production costs, rights in the event one party breachesits obligations under the CPIV Agreement, certain obligations in respect of a transition period inconnection with a termination of the CPIV Agreement, and other customary contractual terms andconditions. The CPIV Agreement expires on December 31, 2025, unless extended in accordance withits terms.
We currently operate under a Manufacturing and Purchase Agreement with FFI, dated April 8,2010 (as subsequently amended, supplemented or modified), pursuant to which FFI manufactures andpackages certain specified products. Under the terms of the FFI Agreement, FFI is required to maintainon hand a quantity of raw materials sufficient to produce a specified minimum monthly order volume.The FFI Agreement also sets forth certain rights and obligations of each party upon the failure to sell,in the case of FFI, or purchase, in our case, a specified minimum monthly order for a specified periodof time. The FFI Agreement also contains detailed provisions regarding plant improvements, productspecification and quality standards for the products to be manufactured and packaged by FFI,trademark and intellectual property rights, shipping and storage obligations, allocation of productioncosts, rights in the event one party breaches its obligations under the FFI Agreement, certainobligations in respect of a transition period in connection with a termination of the FFI Agreement, andother customary contractual terms and conditions. The FFI Agreement had an initial term of ten years,and was automatically extended in 2020 for a subsequent five year term in accordance with its terms.
The descriptions of the CPIV Agreement and the FFI Agreement are qualified in their entirety byreference to the full text of the CPIV Agreement and the FFI Agreement, respectively, each of whichhas been filed as an exhibit to the registration statement of which this prospectus is a part.
We regularly evaluate our contract manufacturing and co-packing arrangements to ensure thecost-effective manufacturing and production of our products. Our engineering and quality teams workwith our coconut water contract manufacturers to improve efficiency, yields, quality and costs, toensure we have a strong, reliable and efficient supply chain. We select our partners based onexpertise, quality, cost and location. Our supply chain and quality team monitors contractmanufacturing and co-packing partners to ensure our partners meet our rigorous processing and
156

quality standards, including plant audits and any requirements for third party certification of GoodManufacturing Practices. We also monitor the capacity and performance of our contract manufacturingand co-packing partners and occasionally work with these partners to increase production capacity attheir facilities by helping with engineering projects or providing financial support for investments thatare dedicated to our products. Given the growth profile of our products, we are continuously evaluatingoptions for incremental capacity and reviewing additional strategic relationships that might support ourbusiness.
Warehousing and Distribution
Our products are typically shipped directly from our contract manufacturing partners to a networkof third party warehouses located in our selling markets. Most of our products ship by oceantransportation from source country and are subject to customs and other inspections at port of arrivalbefore being received into our third-party warehouse network. Products are distributed from thesethird-party warehouses to our customer’s distribution centers, to retail stores or in limited cases directto the consumer. We also occasionally ship products directly from our contract manufacturers,co-packers or from receiving port direct to our customers’ distribution centers.
Competition
The beverage industry is highly competitive and is constantly evolving in response to ever-changing consumer preferences. Competition is generally based on brand recognition, taste, quality,price, availability, selection and convenience, as well as factors related to corporate responsibility andsustainability. We are focused on providing the general public with accessible products that containfunctional and nutritious benefits to be consumed and enjoyed across dayparts.
We compete within the broad non-alcoholic beverage category as we vie to gain share of theconsumer’s stomach, and our flagship brand, Vita Coco, is the market leader in the Coconut Watercategory. Our competitors in the beverage market include category leaders such as The Coca-ColaCompany, PepsiCo, Inc. and Nestlé S.A. We also compete with functional beverages including Goya,Harmless Harvest, BodyArmor, Bai, Monster Energy, Red Bull, Bang, Ocean Spray, Bubly and Bai, aswell as a range of emerging brands and retailers’ own private label beverage brands.
Although some companies offer competing brands in categories we participate in, they are alsoour partners in certain instances such as KDP through our national distribution partnership. Ourcompetition varies by market due to regional brands and taste preferences. We are also a leadingsupplier of coconuts for private label coconut water and oil brands, and we compete with other privatelabel suppliers.
We believe the principal competitive factors in our industry are:
• taste;
• nutritional profile and dietary attributes;
• quality and type of ingredients;
• functional benefits;
• convenience;
• cost;
• brand awareness and loyalty among consumers;
• sustainability and reliability of supply chain
157

• service to customers;
• access to high-quality raw materials;
• product variety and packaging;
• access to major retailer shelf space and retail locations;
• presence across digitally-oriented marketplaces; and
• access to major foodservice outlets.
We rely on our portfolio of better-for-you products, purpose-driven brands, passionate and loyalconsumer base, innovation capabilities, bespoke go-to-market strategy, strong retail relationships,flexible supply chain and experienced management team to effectively compete and succeed in ourindustry. We also believe it is important to have a presence across channels and we have anestablished and growing reach across grocery, mass, club, drug, convenience, eCommerce andfoodservice.
Even though we operate in a competitive industry, we believe that we effectively compete withrespect to each of the above factors. However, many companies in our industry are significantly largerthan we are, and have substantially greater financial resources, more comprehensive product lines,broader market presence and go-to-market reach, longer standing relationships with distributors andsuppliers, longer operating histories, greater production and distribution capabilities, stronger brandrecognition and greater marketing resources than we have.
Intellectual Property
We own domestic and international trademarks and other proprietary rights that are important toour business. Our trademarks are valuable assets that reinforce the distinctiveness of our brand to ourconsumers. We view our primary trademarks to be VITA COCO and RUNA. We have a globalapproach to protecting our trademarks, designs, patents and other IP rights. We believe the protectionof our trademarks, designs, copyrights, patents, domain names, trade dress and trade secrets areimportant to our success. As of June 30, 2021, we had over 30 registered trademarks and over 8pending trademark applications in the United States, and over 200 registered trademarks and over 25pending trademark applications in other countries. We endeavor to take prudent measures to protectour brands, including by employing a global trademark watch service, by notifying potential infringers ofour trademark rights and issuing “cease and desist” letters, as appropriate.
We consider information related to formulas, processes, know-how and methods used in ourproduction and manufacturing as proprietary and endeavor to maintain them as trade secrets. We havein place reasonable measures to keep the above-mentioned items, as well as our business andmarketing plans, customer lists and contracts reasonably protected, and they are accordingly notreadily ascertainable by the public.
Government Regulation
Our products are regulated in the United States as conventional foods. We, along with ourdistributors, and manufacturing and co-packing partners, are subject to extensive laws and regulationsin the United States by federal, state and local government authorities including, among others, theU.S. Federal Trade Commission, or FTC, the U.S. Food and Drug Administration, or FDA, the U.S.Department of Agriculture, the U.S. Environmental Protection Agency and the U.S. OccupationalSafety and Health Administration and similar state and local agencies. Under various statutes, these
158

agencies regulate the manufacturing, preparation, quality control, import, export, packaging, labeling,storage, recordkeeping, marketing, advertising, promotion, distribution, safety, and/or adverse eventreporting of conventional foods. Among other things, the facilities in which our products and ingredientsare manufactured must register with the FDA, comply with current good manufacturing practices andother standards requirements applicable to the production and distribution of conventional foodproducts. We and our manufacturing and co-packing partners are also subject to similar requirementsin foreign jurisdictions in which we operate.
The FDA regulates food products pursuant to the Federal Food, Drug, and Cosmetic Act, orFDCA, and its implementing regulations. In addition, pursuant to the FDA Food Safety ModernizationAct, or FSMA, FDA promulgates requirements intended to enhance food safety and prevent foodcontamination, including more frequent inspections and increased recordkeeping and traceabilityrequirements. The FSMA also requires that imported foods adhere to the same quality standards asdomestic foods, and provides FDA with mandatory recall authority over food products that aremislabeled or misbranded. In addition, FDA requires that certain nutrient and product informationappear on product labels and that the labels and labeling be truthful, not misleading. Similarly, the FTCrequires that marketing and advertising claims be truthful, not misleading, not deceptive to customersand substantiated by adequate scientific data. We are also restricted from making certain types ofclaims about our products, including nutrient content claims, health claims, and claims regarding theeffects of our products on any structure or function of the body, whether express or implied, unless wesatisfy certain regulatory requirements.
In addition, under the FDCA, any substance that is reasonably expected to become a componentof food or added to food is a food additive, with a few exceptions, and is therefore subject to FDApremarket review and approval, unless the substance is generally recognized among experts qualifiedby scientific training and experience to evaluate its safety, as having been adequately shown throughscientific procedures or, in the case of a substance used prior to January 1, 1958, through experiencebased on common use in food, to be safe under the conditions of its intended use, a standard referredto as “generally recognized as safe,” or GRAS. Manufacturers of GRAS substances may notify theFDA of their view that a substance is GRAS and thus not subject to the premarket approvalrequirements. Upon review of such a notification, the FDA may respond with a “no questions” letterstating that while it has not made its own GRAS determination, it has no questions at the timeregarding the submitter’s GRAS determination. Alternatively, manufacturers may elect to “self-affirm” agiven substance is GRAS without the voluntary FDA notification but should retain all applicable safetydata used for the GRAS determination in the case of inquiry by the FDA. However, in neither casedoes this constitute an approval equivalent to that achieved through the food additive process. Amanufacturer’s use of such constituent in foods is at its own risk and is dependent upon adequatesubstantiation and/or scientific support demonstrating safe use.
Products that do not comply with applicable governmental or third-party regulations andstandards may be considered adulterated or misbranded and subject, but not limited, to, warning oruntitled letters, product withdrawals or recalls, product seizures, relabeling or repackaging, total orpartial suspensions of manufacturing or distribution, import holds, injunctions, fines, civil penalties orcriminal prosecution.
Similarly, we may be subject to similar requirements in other foreign countries in which we sellour products, including in the areas of:
• product standards;
• product safety;
• product safety reporting;
159

• marketing, sales, and distribution;
• packaging and labeling requirements;
• nutritional and health claims;
• advertising and promotion;
• post-market surveillance;
• import and export restrictions; and
• tariff regulations, duties, and tax requirements.
Public Benefit Corporation Status
As a demonstration of our long-term commitment to our mission to promote healthy andsustainable beverage and consumer products, we are incorporated in Delaware as a public benefitcorporation. Public benefit corporations are a relatively new class of corporations that are intended toproduce a public benefit and to operate in a responsible and sustainable manner. Under Delaware law,public benefit corporations are required to identify in their certificate of incorporation the public benefitor benefits they will promote and their directors have a duty to manage the affairs of the corporation ina manner that balances the pecuniary interests of the stockholders, the best interests of thosematerially affected by the corporation’s conduct and the specific public benefit or public benefitsidentified in the public benefit corporation’s certificate of incorporation. See “Description of CapitalStock—Public Benefit Corporation Status.”
Our public benefit purpose, as provided in our certificate of incorporation, is harnessing, whileprotecting, nature’s resources for the betterment of the world and its inhabitants through creatingethical, sustainable, and better-for-you beverage and consumers goods products that not only upliftcommunities but that do right by our planet. Furthermore, in order to advance the best interests ofthose materially affected by the Corporation’s conduct, it is intended that our business and operationscreate a material positive impact on society and the environment, taken as a whole.
Employees and Human Capital Resources
As of June 30, 2021, we had 265 full-time employees, including three in research anddevelopment, 133 in sales and marketing and 30 in finance. Of these employees, 186 were employedin the United States, 30 were employed in Singapore, 36 were employed in the United Kingdom and 13were employed in Ecuador. None of these employees are represented by labor unions or covered bycollective bargaining agreements. We have never experienced a labor-related work stoppage.
Legal Proceedings
From time to time, we may be involved in various claims and legal proceedings related to claimsarising out of our operations. We are not currently a party to any material legal proceedings, includingany such proceedings that are pending or threatened, of which we are aware.
160

MANAGEMENT
Executive Officers and Directors
The following table provides information regarding our executive officers and directors as of thedate of this prospectus:
Name Age Position(s)
Executive Officers:Michael Kirban(1) 47 Co-Founder, Co-Chief Executive Officer, Chairman, DirectorMartin Roper 58 Co-Chief Executive Officer, DirectorKevin Benmoussa 40 Chief Financial OfficerJonathan Burth 40 Chief Operating OfficerJane Prior 43 Chief Marketing OfficerCharles van Es 44 Chief Sales Officer
Non-Executive Directors:John Leahy(2)(3) 68 DirectorIra Liran 43 Co-Founder, Director of Sourcing, DirectorAxelle Henry(2)(4) 49 Director NomineeEric Melloul(3) 52 DirectorJane Morreau(1)(2) 62 DirectorKenneth Sadowsky(1) 59 DirectorJohn Zupo(3) 48 Director
(1) Member of the nominating and ESG Committee(2) Member of the audit committee(3) Member of the compensation committee(4) Ms. Henry will join our board of directors immediately upon the effectiveness of the registration
statement of which this prospectus is a part.
Executive Officers
Michael Kirban is one of our co-founders and has served as Chief Executive Officer and asExecutive Chairman of our board of directors since our inception in 2004. Mr. Kirban is co-founder andcurrently serves on the board of directors of Software Answers Inc., a technology service provider, aposition he has held since 1995, and previously served as a member of the board of directors of RunaLLC from 2014 to 2017 before it was acquired by us in 2018. We believe Mr. Kirban’s perspective andexperience as our co-founder and co-Chief Executive Officer, as well as his general knowledge of thefood and beverage industry, makes him qualified to serve on our board of directors.
Martin Roper has served as co-Chief Executive Officer and as a member of our board of directorssince January 2021. Mr. Roper previously served as our President from September 2019 to December2020. Prior to his time at the Company, Mr. Roper served as Chief Executive Officer of The BostonBeer Company, Inc. (NYSE: SAM), an alcoholic beverage company, from 2001 to 2018, where heoversaw the net revenue growth and diversification of brand portfolio. Mr. Roper also served as theChief Operating Officer and Vice President of Manufacturing and Business Development of The BostonBeer Company, Inc. from 1994 to 2001. In addition to his service on our board, Mr. Roper has servedas a member of the board of directors of Lumber Liquidators Inc. (NYSE: LL), a flooring retail company,since 2006, and served on the board of directors of The Boston Beer Company, Inc. from 2000 to2018. Mr. Roper holds a BA, MA and MEng from Trinity Hall, Cambridge and a MBA from Harvard
161

University. We believe Mr. Roper’s experience and reputation for growth and innovation of beveragecompanies, and his knowledge of strategy, finance, public company corporate governance, andgeneral management makes him qualified to serve on our board of directors.
Kevin Benmoussa has served as our Chief Financial Officer since January 2018. Prior to his timeat the Company, Mr. Benmoussa served at BlueTriton Brands, Inc., formerly known as Nestlé WatersNorth America, Inc., a beverage manufacturer and distributor, as Division CFO from July 2016 toJanuary 2018, and Director of Strategy and Business Development from July 2015 to June 2016. Priorto his time at BlueTriton Brands, from July 2008 to July 2015 Mr. Benmoussa served in variousfinance, strategy and business development positions at PepsiCo Inc., a food and beveragemanufacturer, including most recently as Finance Director for North America Beveragesfrom September 2014 to July 2015. Prior to joining PepsiCo Inc. Mr. Benmoussa served as aninvestment banker at Bear Stearns from March 2006 to June 2008. Mr. Benmoussa holds a Masters inApplied Economics from Paris IX Dauphine University and a MA in International Economics andFinance from Brandeis University.
Jonathan Burth has served as our Chief Operating Officer since 2016, and has served in variouscapacities since joining the Company in 2007, including most recently as Vice President of SupplyChain from 2011 to 2016 and as Director of Finance from 2008 to 2010. Before joining the Company,Mr. Burth served as a trainee at UBS from June 2006 to June 2007. He also serves on the board ofdirectors for Madecasse LLC, a chocolate manufacturer, a position he has held since June 2018.Mr. Burth holds a MA in International Business from the Grenoble Graduate School of Business.
Jane Prior has served as our Chief Marketing Officer since April 2019. Ms. Prior has previouslyheld various other marketing positions at the Company since 2009, including Vice President, USMarketing from 2011 to 2014, and EVP, Global Brand Strategy & Development from August 2014 toMarch 2019. Prior to her time with the Company, Ms. Prior served as Director of Marketing for the NewYork Red Bulls, a Major League Soccer team, from 2006 to 2008, and as Manager of Marketing andCommunications at Maxim Sports Marketing from 2002 to 2006. In 2019, Ms. Prior was included on theForbes “CMO Next” List. Ms. Prior holds a Bachelor of Commerce from University College Dublin anda MA in Business Studies from the Michael Smurfit Graduate School of Business at University CollegeDublin.
Charles van Es has served as our Chief Sales Officer since October 2019. Mr. Van Es previouslyserved as our Vice President of Marketing from June 2016 to September 2019. Prior to his time at theCompany, from October 2003 to May 2016 Mr. Van Es served in various marketing roles at HeinekenN.V., a Dutch alcoholic beverage company, including most recently as Senior Director of PortfolioBrands from 2013 to 2015. Mr. Van Es holds an MBA from Columbia University and a MSc in ChemicalEngineering from the Delft University of Technology.
Non-Executive Directors
Axelle Henry will join our board of directors upon the effectiveness of the registration statement ofwhich this prospectus forms a part. Ms. Henry has served as Chief Financial Officer for VerlinvestGroup since April 2014 and also serves on the board of directors for a number of their privatecompanies. Prior to joining Verlinvest, Ms. Henry was employed at Groupe Bruxelles Lambert, aEuronext-listed holding company, from November 1997 to March 2014 where she served in variousfinance roles, including most recently as deputy Chief Financial Officer since 2005. Ms. Henry holds amasters degree from the Solvay Brussels School of Economics and Management. We believeMs. Henry’s extensive leadership experience as well as her particular knowledge and experience infinance and accounting makes her qualified to serve on our board of directors.
162

John Leahy has served as a member of our board of directors since June 2019. Mr. Leahyserved as President and Chief Operating Officer of KIND, LLC, a snack food company, from February2009 to June 2019, and President of Nature’s Bounty Co., a vitamin and nutritional supplementmanufacturer, from June 2006 to February 2009. Mr. Leahy also served as a Senior Advisor forBlacksmith Applications, Inc., formerly known as TABS Group Inc., an analytics firm that services theconsumer packaged goods industry, from August 2009 to April 2010. In addition to his service on ourboard, Mr. Leahy has served as a strategic advisor for Beckon LLC, an ice cream manufacturer, sinceJanuary 2018, I Won Nutrition, Co., a packaged food manufacturer, since January 2019, and AllibelleFoods, Inc., a packaged food manufacturer, since January 2020. Prior to his time at Nature’s BountyCo., Mr. Leahy held various positions at numerous consumer packaged goods companies, includingNestlé S.A. (SIX: NESN), Johnson & Johnson Services, Inc. (NYSE: JNJ) and Edgewell Personal CareCompany (NYSE: EPC). Mr. Leahy holds a BS in Business Administration from Villanova University.We believe Mr. Leahy’s extensive experience related to the consumer industry, as well as hisexperience serving on other company boards, makes him qualified to serve on our board of directors.
Ira Liran is one of our co-founders and has served as a member of our board of directors since2006. He also currently serves as our Director of Sourcing, a position he has held with the Companysince February 2007. Mr. Liran holds a BA from Columbia University. Mr. Liran was chosen to serve onour board of directors for his perspective and knowledge of the Company as our co-founder.
Eric Melloul has served as a member of our board of directors since 2008. Mr. Melloul has servedas Managing Director for Verlinvest since August 2008. He currently serves as Chairman of the boardof directors of Oatly Group AB (Nasdaq: OTLY), a food and beverage company, since September2016, and has served on its Remuneration Committee since May 2021. Prior to Verlinvest, Mr. Melloulserved as Global Marketing VP and China Commercial Head for Anheuser-Busch InBev from 2003 to2008, and as an Associate Partner at McKinsey & Company from 1999 to 2003. Mr. Melloul has servedon the board of directors for Hint Inc., a beverage company, since August 2011 and Mutti S.p.A, a foodcompany, since September 2016. Mr. Melloul holds a MPA from the Kennedy School at HarvardUniversity and a Post Graduate Diploma from the London School of Economics and Political Science.We believe Mr. Melloul is qualified to serve on our board of directors due to his significant business,financial and investment experience related to the consumer industry and his experience serving onother public and private company boards.
Jane Morreau has served as a member of our board of directors since August 2021. From 2014to July 2021, Ms. Morreau served as Executive Vice President and Chief Financial Officer for Brown-Forman Corporation. Prior to becoming Chief Financial Officer, Ms. Morreau served multiple positionsat Brown-Forman Corporation, including Senior Vice President, Chief Production Officer and Head ofInformation Technology from 2013 to 2014, and Senior Vice President of Accounting and Director ofFinance, Accounting and Technology from 2008 to 2013, where she directed the financial managementof the company’s sales, marketing, production, and technology functions. Before joining Brown-FormanCorporation in 1991, Ms. Morreau worked at Kentucky Fried Chicken Corporation (now known as Yum!Brands) from 1980 to 1991. Ms. Morreau holds a BS in Commerce with an emphasis in accounting andan MBA from the University of Louisville. Ms. Morreau is a Certified Public Accountant. We believe Ms.Morreau’s extensive leadership experience as well as her particular knowledge and experience infinance and accounting makes her qualified to serve on our board of directors.
Kenneth Sadowsky has served as a member of our board of directors since 2006. Mr. Sadowskyhas served as US Beverages Advisor for Verlinvest since 2009 and as the Executive Director of theNortheast Independent Distributors Association, a group of independent beverage distributors in theNortheast United States, since 2008. Mr. Sadowsky has served on the boards of directors of Lifeaid
163

Beverage and Hint. Inc., both health beverage companies, since December 2019 and May 2008,respectively. and previously served on the board of directors of Energy Brands Inc. (d/b/a Glacéau), abeverage company and the makers of vitaminwater, smartwater and fruitwater, from 2000 to 2006.Mr. Sadowsky holds a BA from Tulane University. We believe Mr. Sadowsky’s decades of experienceadvising beverage companies on sales, distribution and operational strategies makes him qualified toserve on our board of directors.
John Zupo has served as a member of our board of directors since January 2020, and has beenemployed by the Company in various roles to advise on strategy since 2018. Since 2019, Mr. Zupo hasserved as the co-founder and Chief Executive Officer of SABX, Inc., a business technology provider,and has served on its board of directors since July 2020. Prior to his time at SABX, Inc., Mr. Zuposerved as President of BlueTriton Brands, Inc., formerly known as Nestle Waters North America, Inc., abeverage distributor, from 2013 to 2018. Mr. Zupo holds a BA and MBA from Westminster College. Webelieve Mr. Zupo’s experience advising the Company on strategy and his extensive knowledge of theconsumer packaged goods industry makes him qualified to serve on our board of directors.
Family Relationships
There are no family relationships among any of our directors or executive officers.
Board Composition and Election of Directors
Our business and affairs are managed under the direction of our board of directors, which willconsist of nine members upon consummation of this offering. Our amended and restated certificate ofincorporation will provide that the number of our directors on our board of directors shall be fixedexclusively by resolution adopted by our board of directors (provided that such number shall not beless than the aggregate number of directors that the parties to the Investor Rights Agreement areentitled to designate from time to time).
Pursuant to the terms of the Investor Rights Agreement, (i) Verlinvest will be entitled to nominate(a) three directors for election to our board of directors for so long as it holds, directly or indirectly, 35%or more of our outstanding common stock, (b) two directors for election to our board of directors for solong as it holds, directly or indirectly, less than 35% but at least 25% of outstanding common stock, and(c) one director for election to our board of directors for so long as it holds, directly or indirectly, lessthan 25% but at least 15% of our outstanding common stock; (ii) Michael Kirban, our co-founder, Co-Chief Executive Officer and Chairman, will be entitled to nominate (a) two directors for election to ourboard of directors for so long as he holds, directly or indirectly, together with his affiliates and certainpermitted transferees, at least 2.5% or more of our outstanding common stock, and (b) one director forelection to our board of directors until the later of such time as Mr. Kirban (a) ceases to be employedby the Company and (b) together with his affiliates and certain permitted transferees, beneficially owns,directly or indirectly, less than 1% of our outstanding common stock; and (iii) Ira Liran, our co-founderand member of our board of directors, will be entitled to nominate one director for election to our boardof directors from time to time and until the later of such time as Mr. Liran (a) ceases to be employed bythe Company and (b) together with his affiliates and certain of his permitted transferees, beneficiallyowns, directly or indirectly, less than 1% of our outstanding common stock.
When considering whether directors have the experience, qualifications, attributes or skills, takenas a whole, to enable our board of directors to satisfy its oversight responsibilities, effectively in light ofour business and structure, the board of directors focuses primarily on each person’s background andexperience as reflected in the information discussed in each of the directors’ individual biographies setforth above. We believe that our directors provide an appropriate mix of experience and skills relevantto the size and nature of our business.
164

In accordance with our amended and restated certificate of incorporation that will go into effectimmediately prior to the consummation of this offering, our board of directors will be divided into threeclasses with staggered, three-year terms. At each annual meeting of stockholders, the successors todirectors whose terms then expire will be elected to serve from the time of election and qualificationuntil the third annual meeting following election. Effective upon the closing of this offering, our directorswill be divided among the three classes as follows:
• the Class I directors will be Martin Roper, Axelle Henry and John Zupo, and their terms willexpire at our first annual meeting of stockholders following this offering;
• the Class II directors will be Michael Kirban, John Leahy and Kenneth Sadowsky, and theirterms will expire at our second annual meeting of stockholders following this offering; and
• the Class III directors will be Jane Morreau, Ira Liran and Eric Melloul, and their terms willexpire at the third annual meeting of stockholders following this offering.
Our amended and restated certificate of incorporation that will go into effect immediately prior tothe consummation of this offering will provide that the authorized number of directors may be changedonly by resolution of the board of directors. Any additional directorships resulting from an increase inthe number of directors will be distributed among the three classes so that, as nearly as possible, eachclass will consist of one-third of the directors. The division of our board of directors into three classeswith staggered three-year terms may delay or prevent a change of our management or a change incontrol of our company.
Pursuant to the terms of the Investor Rights Agreement, Verlinvest, Michael Kirban and Ira Liranwill have the right to remove one or more of their respective designated directors, as applicable, ineach case, with or without cause at any time. In all other cases, our directors may be removed only forcause by the affirmative vote of the holders of at least two-thirds of our outstanding voting stockentitled to vote in the election of directors.
Director Independence
Our board of directors has undertaken a review of the independence of each director and, basedon the information provided by each director concerning his or her background, employment andaffiliations, our board of directors has determined that Jane Morreau, Axelle Henry, John Leahy, EricMelloul and Kenneth Sadowsky qualify as independent directors in accordance with the Nasdaq StockMarket rules. Under the Nasdaq Stock Market rules, the definition of independence includes a series ofobjective tests, such as that the director is not, and has not been for at least three years, one of ouremployees and that neither the director nor any of his or her family members has engaged in varioustypes of business dealings with us. Our board of directors has made a subjective determination as toeach independent director that no relationships exists that, in the opinion of our board of directors,would interfere with the exercise of independent judgment in carrying out the responsibilities of adirector.
Role of the Board of Directors in Risk Oversight Process
Risk assessment and oversight are an integral part of our governance and managementprocesses. Our board of directors encourages management to promote a culture that incorporates riskmanagement into our corporate strategy and day-to-day business operations. Management discussesstrategic and operational risks at regular management meetings, and conducts specific strategicplanning and review sessions during the year that include a focused discussion and analysis of therisks facing us. Throughout the year, senior management reviews these risks with the board of
165

directors at regular board meetings as part of management presentations that focus on particularbusiness functions, operations, or strategies, and presents the steps taken by management to mitigateor eliminate such risks.
Our board of directors does not have a standing risk management committee, but ratheradministers this oversight function directly through our board of directors as a whole, as well asthrough various standing committees of our board of directors that address risks inherent in theirrespective areas of oversight. While our board of directors is responsible for monitoring and assessingstrategic risk exposure, our audit committee is responsible for overseeing our major financial riskexposures and the steps our management has taken to monitor and control these exposures. Theaudit committee also approves or disapproves any related person transactions. Our nominating andESG committee monitors the effectiveness of our corporate governance guidelines. Our compensationcommittee assesses and monitors whether any of our compensation policies and programs has thepotential to encourage excessive risk-taking.
Lead Independent Director
Michael Kirban serves as both our Co-Chief Executive Officer and as chairperson of our board ofdirectors. Consequently, our board of directors will adopt, effective prior to the completion of thisoffering, corporate governance guidelines that provide that one of our independent directors will serveas our lead independent director. Our board of directors has appointed Eric Melloul to serve as ourlead independent director. As lead independent director, Mr. Melloul will preside over periodic meetingsof our independent directors, serve as liaison between the chairperson of the board of directors and theindependent directors, and perform such additional duties as our board of directors may otherwisedetermine and delegate.
Committees of the Board of Directors
Our board of directors has established an audit committee, a compensation committee, and anominating and ESG committee. Our board of directors may establish other committees to facilitate themanagement of our business. The composition and functions of each committee are described below.Members serve on these committees until their resignation or until otherwise determined by our boardof directors. Each committee intends to adopt a written charter that satisfies the applicable rules andregulations of the SEC and the Nasdaq Stock Market, which we will post on our website atwww.thevitacococompany.com substantially concurrently with the consummation of this offering.Information contained on, or that can be accessed through, our website does not constitute part of thisprospectus, and the inclusion of our website address in this prospectus is an inactive textual referenceonly. Investors should not rely on any such information in deciding whether to purchase our commonstock.
Audit Committee
Our audit committee oversees our corporate accounting and financial reporting process. Amongother matters, the audit committee’s responsibilities include:
• appointing, approving the fees of, and assessing the independence of our registered publicaccounting firm;
• overseeing the work of our registered public accounting firm, including through the receipt andconsideration of reports from such firm;
• reviewing and discussing with management and the registered public accounting firm ourannual and quarterly financial statements and related disclosures;
166

• coordinating our board of directors’ oversight of our internal control over financial reporting,disclosure controls and procedures and code of business conduct and ethics;
• discussing our risk management policies;
• meeting independently with our internal auditing staff, if any, registered public accounting firmand management;
• reviewing and approving or ratifying any related person transactions; and
• preparing the audit committee report required by the SEC rules.
Upon the consummation of this offering, our audit committee will consist of Jane Morreau, JohnLeahy and Axelle Henry, with Jane Morreau serving as chair. Our board of directors has determinedthat Jane Morreau and John Leahy are independent under the Nasdaq Stock Market rules andRule 10A-3 of the Exchange Act. Our board of directors has determined that Jane Morreau is an “auditcommittee financial expert” as such term is currently defined in Item 407(d)(5) of Regulation S-K. Ourboard of directors has also determined that each member of our audit committee can read andunderstand fundamental consolidated financial statements, in accordance with applicablerequirements. We intend to comply with the independence requirements for all members of the auditcommittee within the time periods specified in the Nasdaq Stock Market rules.
Compensation Committee
Our compensation committee oversees policies relating to the compensation and benefits of ourofficers and employees. Among other matters, the compensation committee’s responsibilities include:
• reviewing and approving corporate goals and objectives relevant to the compensation of ourChief Executive Officer, evaluating the performance of each Chief Executive Officer in light ofthese goals and objectives and setting or making recommendations to the Board regarding thecompensation of each Chief Executive Officer;
• reviewing and setting or making recommendations to our board of directors regarding thecompensation of our other executive officers;
• making recommendations to our board of directors regarding the compensation of our directors;
• reviewing and approving or making recommendations to our board of directors regarding ourincentive compensation and equity-based plans and arrangements; and
• appointing and overseeing any compensation consultants.
Our compensation committee consists of Eric Melloul, John Leahy and John Zupo, with EricMelloul serving as chair. Our board of directors has affirmatively determined that John Leahy and EricMelloul each meets the definition of “independent director” under the Nasdaq Stock Market rules,including the heightened independence standards for members of a compensation committee, andJohn Leahy is a “non-employee director” as defined in Rule 16b-3 of the Exchange Act. We intend tocomply with the independence requirements for all members of the compensation committee within thetime periods specified in the Nasdaq Stock Market rules.
Nominating and ESG Committee
The nominating and ESG committee oversees and assists our board of directors in reviewing andrecommending nominees for election as directors. Among other matters, our nominating and ESGcommittee’s responsibilities include:
• identifying individuals qualified to become board members;
• recommending to our board of directors the persons to be nominated for election as directorsand to each board committee;
167

• developing and recommending to our board of directors corporate governance guidelines, andreviewing and recommending to our board of directors proposed changes to our corporategovernance guidelines from time to time; and
• overseeing a periodic evaluation of our board of directors.
Our nominating and ESG committee consists of Michael Kirban, Jane Morreau and KennethSadowsky, with Michael Kirban serving as chair. Our board of directors has affirmatively determined thatJane Morreau and Kenneth Sadowsky each meet the definition of “independent director” under theNasdaq Stock Market rules. We intend to comply with the independence requirements for all members ofthe nominating and ESG committee within the time periods specified in the Nasdaq Stock Market rules.
Compensation Committee Interlocks and Insider Participation
No member of our compensation committee is currently, or has been at any time, one of ourexecutive officers or employees. None of our executive officers currently serves, or has served duringthe last year, as a member of the board of directors or compensation committee of any entity that hasone or more executive officers serving as a member of our board of directors or on our compensationcommittee.
Board of Directors Diversity
Our nominating and ESG committee will be responsible for reviewing with the board of directors,on an annual basis, the appropriate characteristics, skills, and experience required for the board ofdirectors as a whole and its individual members. In evaluating the suitability of individual candidates(both new candidates and current members), the nominating and ESG committee, in recommendingcandidates for election, and the board of directors, in approving (and, in the case of vacancies,appointing) such candidates, may take into account many factors, including but not limited to thefollowing:
• personal and professional integrity;
• ethics and values;
• experience in corporate management, such as serving as an officer or former officer of apublicly-held company;
• professional and academic experience relevant to our industry;
• experience as a board member of another publicly-held company;
• strength of leadership skills;
• experience in finance and accounting and/or executive compensation practices;
• ability to devote the time required for preparation, participation, and attendance at board ofdirectors meetings and committee meetings, if applicable;
• background, gender, age, and ethnicity;
• conflicts of interest; and
• ability to make mature business judgments.
Our board of directors will evaluate each individual in the context of the board of directors as awhole, with the objective of ensuring that the board of directors, as a whole, has the necessary tools toperform its oversight function effectively in light of our business and structure.
168

Code of Ethics and Code of Conduct
Prior to the completion of this offering, we will adopt a written code of business conduct andethics that applies to all of our directors, officers, and employees, including those officers responsiblefor financial reporting. The full text of our code of business conduct and ethics will be posted on ourwebsite at www.thevitacococompany.com. Any substantive amendment to, or waiver of, a provision ofthe code that applies to our principal executive officer, principal financial officer, principal accountingofficer or controller, or persons performing similar functions will be disclosed on our website.Information contained on, or that can be accessed through, our website does not constitute part of thisprospectus, and the inclusion of our website address in this prospectus is an inactive textual referenceonly. Investors should not rely on any such information in deciding whether to purchase our commonstock.
Director Compensation
At the time of the filing of the registration statement of which this prospectus forms a part, we arein the process of determining the philosophy and design of our director compensation plans andprograms going forward. We will include the relevant disclosure relating to the go-forwardcompensation of our directors in subsequent amendments to the registration statement, of which thisprospectus is a part, and prior to the completion of this offering.
169

EXECUTIVE COMPENSATION
This section discusses the material components of the executive compensation program for ourexecutive officers who are named in the “Summary Compensation Table” below. In fiscal year 2020,our “named executive officers” and their positions were as follows:
• Michael Kirban, Chief Executive Officer and Director;
• Martin Roper, President; and
• Jonathan Burth, Chief Operating Officer.
Effective as of January 1, 2021, Mr. Roper was appointed to serve as our Co-Chief ExecutiveOfficer and also joined our Board of Directors.
Summary Compensation Table
The following table presents all of the compensation awarded to or earned by or paid to ournamed executive officers for the year ended December 31, 2020.
Name and PrincipalPosition Year Salary ($)
OptionAwards
($)(1)
Non-EquityIncentive PlanCompensation
($)(2)
All OtherCompensation
($)(3) Total
Michael KirbanChief Executive Officer and
Director . . . . . . . . . . . . . . . . . 2020 470,917 — 755,200 8,550 1,234,667
Martin RoperPresident . . . . . . . . . . . . . . . . . 2020 356,250 — 462,991 8,550 827,791
Jonathan BurthChief Operating Officer . . . . . . 2020 321,066 1,036,007 258,000 8,550 1,623,623
(1) Amounts reflect the full grant-date fair value of stock options granted during fiscal year 2020computed in accordance with ASC Topic 718, rather than the amounts paid to or realized by thenamed individual. For additional information regarding the assumptions used to calculate thevalue of all option awards, please see Note 15 to our audited consolidated financial statementsappearing elsewhere in this prospectus.
(2) Amounts reflect annual cash performance-based bonuses earned during the year endedDecember 31, 2020. For additional information regarding the annual cash performance-basedbonuses, please see the section titled “Fiscal 2020 Bonuses” below.
(3) Amounts reflect the matching contributions under the Company’s 401(k) plan.
Elements of Our Executive Compensation Program
For the year ended December 31, 2020, the compensation for our named executive officersgenerally consisted of a base salary, cash bonuses and equity awards. These elements (and theamounts of compensation and benefits under each element) were selected because we believe theyare necessary to help us attract and retain executive talent which is fundamental to our success.
Below is a more detailed summary of the current executive compensation program as it relates toour named executive officers.
170

Base Salaries
Our named executive officers receive a base salary to compensate them for the services theyprovide to the Company. The base salary payable to each named executive officer is intended toprovide a fixed component of compensation reflecting the executive’s skill set, experience, role andresponsibilities. Mr. Kirban and Mr. Burth’s base salary for fiscal year 2020 was $472,000 and$322,500, respectively. Mr. Roper’s base salary for fiscal year 2020 was initially $325,000 and,effective retroactively as of May 18, 2020, was increased to $375,000. The actual salaries paid to eachnamed executive officer for fiscal year 2020 are set forth in the “Summary Compensation Table” abovein the column titled “Salary.”
Bonus Compensation
Fiscal 2020 Bonus
Mr. Kirban, Mr. Roper and Mr. Burth are eligible to earn an annual performance-based bonus inrespect of the fiscal year 2020 equal to 80%, 65%, and 35% of his annual base salary, respectively,and an additional stretch bonus equal to an additional 80%, 65% and 35% of his annual base salary,respectively, both based on the Company’s achievement of performance goals. Mr. Burth also had anadditional bonus opportunity of 10% of his salary tied to the completion of targeted supply chain relatedcost and efficiency measures that would improve costs in 2021. The Company performance goals werefifty percent based on Net Revenue growth and fifty percent based on Adjusted EBITDA. The actualbonuses paid to each named executive officer for fiscal year 2020 are set forth in the “SummaryCompensation Table” above in the column titled “Non-Equity Incentive Plan Compensation.”
Two-Year Leadership Team Bonus Incentive
Certain of our executives, including Mr. Burth but excluding Mr. Kirban and Mr. Roper, are eligibleto participate in the Two-Year Leadership Team Bonus incentive pursuant to their respectiveemployment agreements, which are paid out based on the achievement of certain 2021 Net Revenueand Adjusted EBITDA and other performance metrics. For more details about the Two-YearLeadership Team Bonus Incentive, please see the descriptions set forth in the “ExecutiveCompensation Arrangement” section below.
CEO Special Incentive Bonus
In connection with this offering, we intend to enter into an IPO bonus agreement with Mr. Kirban,which, if this offering is consummated, will replace and supersede a liquidity event bonus agreementpreviously entered into between Mr. Kirban and the Company in all respects. Pursuant to Mr. Kirban’sIPO bonus agreement, in the event the IPO is consummated on or prior to June 30, 2023, (i) each ofVerlinvest, and RW VC S.a.r.l. (the “Bonus Stockholders”) shall pay Mr. Kirban a bonus equal to 1.4%of the total cash consideration received by the Bonus Stockholders through the sale by the BonusStockholders of the Company’s securities pursuant to the IPO, as of the closing date of the IPO (the“Bonus Stockholders Proceeds”); and (ii) the Company shall pay Mr. Kirban a bonus equal to 1.4% ofthe total cash consideration received by the Company through the sale of the Company’s securitiespursuant to the IPO, as of the closing date of the IPO (the “Company Proceeds”). The forms ofpayment will be (i) for the Bonus Stockholders’ portion, cash equal to 1.4% of the Bonus StockholdersProceeds to be made on the closing date of the IPO; and (ii) for the Company’s portion, a number ofrestricted stock units pursuant to the 2021 Plan that is equal to the ratio of (x) an amount equal to 1.4%of the Company IPO Proceeds to (y) the fair market value per share of the Company’s common stockon the date of grant, which shall vest in full on the six (6) month anniversary of the date of grant subjectto Mr. Kirban’s continued employment with the Company through such vesting date.
171
Mr. Kirban and the Company had previously entered into a liquidity event bonus agreement thatprovided that Mr. Kirban would be eligible to receive payments upon specified Company sale orrecapitalization events, including an initial public offering. Under this liquidity event bonus agreement,in connection with an initial public offering, Mr. Kirban would have been entitled to receive apercentage ranging from 0.5% to 1% of the total cash consideration received through the sale of theCompany’s securities pursuant to the initial public offering, as of the one-month anniversary of the dateof the initial public offering, by the Company and the Company’s shareholders of record immediatelyprior to the initial public offering, depending on the valuation of the Company as reasonably determinedby the Board immediately prior to the initial public offering. As described above, in connection with theconsummation of this offering, this liquidity event bonus agreement will not apply since it will besuperseded by the special IPO bonus agreement described in the preceding paragraph.
In the event the IPO is not consummated on or prior to June 30, 2023, both the special liquidityevent bonus agreement and the IPO bonus agreement will terminate automatically on June 30, 2023,and thereafter be null and void.
Equity Compensation
Stock Plan and Option Grants
We maintain the All Market Inc. 2014 Stock Option and Restricted Stock Plan, or the 2014 Plan,in order to advance the interests of the Company by providing to key employees, directors, consultantsand advisors of the Company grants of restricted stock and stock options. A total of 3,854,760 sharessubject to stock options and 0 shares subject to restricted stock awards granted under the 2014 Planwere outstanding as of December 31, 2020. For more details about the 2014 Plan, please see thedescriptions set forth in the “—Equity Plans” section below.
We have historically granted stock options to our executives pursuant to the 2014 Plan. Our stockoptions generally vest over four years, subject to continued service (50% on or after the twenty-fourthmonth anniversary of the grant date and the remaining 50% on and after the forty-eighth monthanniversary of the grant date). In some instances, the time vesting period may be shorter. Performancevesting criteria are also required for some grants to senior management. The stock options are furtherdescribed in the Outstanding Equity Awards at Fiscal Year-End Table and related footnotes below.
The following equity awards currently are held by our named executive officers. Mr. Kirban holds614,250 options (including those described below and in the table), of which 546,000 are currentlyvested. Mr. Roper holds 647,920 options (including those described below and in the table), all ofwhich are currently not vested. Mr. Burth holds 530,985 options (including those described below andin the table), of which 177,905 are currently vested. In December 2019, the Board of Directorsapproved a one-time repricing of outstanding stock options, which included those held by our namedexecutive officers, pursuant to which stock options were modified and re-issued. In addition, theCompany extended the expiration date of the modified stock options with the contractual term beingten years from the date of the modification, while all other modified option terms remained the same.
In fiscal year 2020, we granted stock options to certain of our named executive officers pursuantto the 2014 Plan. On February 10, 2020, Mr. Burth was granted 204,750 options to purchase shares,which vest pursuant to the general time-vesting schedule described above. On February 10, 2020,Mr. Burth was also granted 68,250 options to purchase shares, which vest if certain performanceconditions for each tranche of the options are met by the target dates for those performance conditionsand expire relative to each tranche if the performance conditions for such tranche are not met at thefinal target date for such tranche.
On January 11, 2021, Mr. Burth was granted an additional 45,500 options to purchase shares,which vest pursuant to the general time-vesting schedule described above, and/or if the Company
172

achieves certain EBITDA and net revenue goals in 2021. On January 11, 2021, Mr. Kirban andMr. Roper were each eligible to receive up to a total of 68,250 options to purchase shares if theCompany achieves certain EBITDA and net revenue goals in 2021. If the performance measures aremet, such options will vest pursuant the general time-vesting schedule described above.
In connection with this offering, we intend to grant equity awards to certain of our employees,including our named executive officers, pursuant to the 2021 Plan. We expect that Mr. Kirban andMr. Roper will each be granted options with a value of $1.8 million and that Mr. Burth will be granted anoption with a value of $350,000. In addition, Mr. Burth will be granted restricted stock units with a valueof $175,000. Each of the equity awards to our named executive officers described in this paragraphgranted in connection to the offering will vest in equal installments of 25% each over four years.
Other Elements of Compensation
Retirement Plans
We currently maintain a 401(k) retirement savings plan for our employees, including our namedexecutive officers, who satisfy certain eligibility requirements. Eligible employees defer a portion oftheir compensation, within prescribed limits, on a pre-tax basis through contributions to the 401(k) plan.Currently, we provide matching contributions in the 401(k) plan up to a specified percentage of theemployee’s contributions.
We do not maintain any defined benefit pension plans or deferred compensation plans for ournamed executive officers.
Employee Benefits and Perquisites
All of our full-time employees, including our named executive officers, are eligible to participate inour health and welfare plans, which include medical, dental and vision benefits.
Outstanding Equity Awards at Fiscal Year-End
The following table presents information regarding outstanding equity awards held by our namedexecutive officers as of December 31, 2020.
Option awards
Name Grant Date
Equity IncentivePlan Awards:
Number ofShares Underlying
Unexercised OptionsThat Have
Not Vested (#)
Equity IncentivePlan Awards:
Number ofShares Underlying
Unexercised OptionsThat HaveVested (#)
Option ExercisePrice ($)
OptionExpiration
Date
Michael Kirban . . . . . . 12/16/2019 — 546,000(1) 10.18 12/16/2029Martin Roper . . . . . . . . 09/19/2019 579,670(2) — 10.18 09/19/2029Jonathan Burth . . . . . . 02/01/2013 — 23,660(3) 6.42 02/01/2023
12/16/2019 34,580 154,245(4) 10.18 12/16/202902/10/2020 204,750(5) — 10.18 02/10/203002/10/2020 68,250(6) — 10.18 02/10/2030
(1) The options vested in three equal tranches on each of July 15, 2015, July 15, 2016, and July 15,2017. These vesting dates precede the grant date, because these options were modified and re-issued in connection with the one-time stock option repricing in December 2019, which isdescribed under “Equity Compensation—Stock Plan and Option Grants” above.
173

(2) The options vest upon certain events, including (i) an IPO and (ii) (a) if the equity value of theCompany (defined as enterprise value less net debt) is equal to or greater than $1 billion USD atthe time of the IPO, or (b) the total market cap of the Company (defined as total Company sharesoutstanding multiplied by trading price) is equal to or greater than $1 billion USD for a period of atleast ninety days post-IPO.
(3) The option to purchase 7,735 shares of the Company’s stock vested on February 1, 2015, andthe remaining option to purchase 15,925 shares of the Company’s stock vested on February 1,2016.
(4) The options generally vest in two equal tranches, the first tranche at various times betweenOctober 2016 and August 2020, and the second tranche two years after the first tranche vested.Some vesting dates precede the grant date, because these options were modified and re-issuedin connection with the one-time stock option repricing in December 2019, which is describedunder “Equity Compensation—Stock Plan and Option Grants” above.
(5) The options vest over four years (50% on or after the twenty-fourth month anniversary of thegrant date and the remaining 50% on and after the forty-eighth month anniversary of the grantdate), subject to the named executive officer’s continued service through the applicable vestingdate.
(6) The options vest if certain performance conditions for each tranche of the options are met by thetarget dates for those performance conditions and expire relative to each tranche if theperformance conditions for such tranche are not met at the final target date for such tranche.
Executive Compensation Arrangements
Below are written descriptions of our employment arrangements with each of our namedexecutive officers. In connection with this offering, we intend to enter into amended and restatedemployment agreements with Mr. Kirban and Mr. Roper, as described in further detail below.
Michael Kirban
On July 14, 2014, we entered into an employment agreement with Mr. Kirban, providing for hisemployment as our Chief Executive Officer and co-founder, which was subsequently amended onMarch 1, 2019, and again on February 3, 2020, or the CEO Agreement. In connection with thisoffering, we intend to enter into an amended and restated employment agreement with Mr. Kirban.Many of the material terms of Mr. Kirban’s employment agreement will remain the same. Some keychanges to be made to Mr. Kirban’s employment agreement include, without limitation, eliminating therestriction on the sale of his Company securities to any unrelated third party and subjecting his benefitsand compensation, to the extent applicable, to any claw-back or similar policy and any amendments,policies and procedures with regards to Section 409A that the Company may adopt.
Pursuant to the CEO Agreement, Mr. Kirban is entitled to a base salary of $472,000. The CEOAgreement also provides that Mr. Kirban is eligible to receive an annual bonus equal to 80% of hisannual base salary, and an additional stretch bonus equal to an additional 80% of his annual basesalary, both based on the Company’s achievement of performance goals.
In the event Mr. Kirban terminates his employment for Good Reason or without Cause, orterminated due to death or disability, conditional on his signing a general release, the Company willpay Mr. Kirban: (a) any accrued but unpaid salary rendered to the date of termination; and (b) anamount equal to one year of salary at the time of such termination, payable over a one-year periodbeginning thirty days after the date of such termination.
In the event Mr. Kirban is terminated by the Company for Cause or voluntary terminates otherthan for Good Reason, the Company will pay Mr. Kirban any accrued but unpaid salary for servicesrendered prior to the date of termination.
174

For purposes of the CEO Agreement, “Good Reason” means a termination by the employee ofhis employment with the Company for the following events, provided that (x) the employee provideswritten notice to the Company specifying in reasonable detail the circumstances claimed to provide thebasis for such termination within thirty days following the occurrence, without his consent, of suchevents, (y) the Company fails to correct the circumstances set forth in his notice of termination withinthirty days of receipt of such notice, and (z) the employee actually terminates employment within sixtydays following such occurrence: (i) any requirement that the employee relocate to an office that is morethan fifty miles from the Company’s current headquarters located in Manhattan, New York; or (ii) anybreach by the Company of the Company’s material obligations under the CEO Agreement.
For the purposes of the CEO Agreement, the Company may terminate the employee’semployment (A) upon written notice in the event of any conviction of the employee with respect to anycrime constituting a felony or other crime involving moral turpitude, whether or not in the course of theemployee’s duties, or (B) for “Cause”; provided that (x) the Company provides written notice to theemployee specifying in reasonable detail the circumstances claimed to provide the basis for suchtermination within twenty days following the occurrence, without the Company’s consent, of an eventconstituting “Cause”, (y) the employee fails to correct the circumstances set forth in the Company’snotice of termination within forty-five days of receipt of such notice, and (z) the Company actuallyterminates employment within sixty days following such occurrence. “Cause” means (i) the employee’sknowing and willful failure to comply with any laws, rules or regulations of any federal, state or localauthority having jurisdiction over the Company and its business operations; (ii) the employee’s knowingand willful failure to comply with the lawful specific directions of the Board related to the employee’sduties; (iii) the employee’s knowingly and willfully committing any act which constitutes a conflict ofinterest with the Company, or a breach of fiduciary duty owed by the employee to the Company;provided, however, the Company acknowledges and agrees that in no event shall services theemployee may provide to certain other approved organizations, companies and/or businesses bedeemed (x) a breach of his fiduciary duties to the Company or its shareholders, (y) a conflict of interest,or (z) a breach of the CEO Agreement; (iv) the employee’s willful or intentional breach of any materialprovision of the CEO Agreement; or (v) any conviction of the employee with respect to any crimeconstituting a felony or other crime involving moral turpitude (in each case, excluding a traffic orparking violation, jaywalking, driving while intoxicated or similar offense), which was committed in thecourse of the employee’s duties.
The Company may not terminate the employee without Cause prior to July 1, 2022. TheCompany may terminate the employee without Cause after July 1, 2022, by providing sixty days writtennotice to the employee (provided that such notice may be provided prior to July 1, 2022). From July 1,2022 through June 30, 2023, any termination without Cause will be determined by a supermajority voteof the Board; and from July 1, 2023 through the remainder of the employment period, any terminationwithout Cause will be determined by a simple majority vote of the Board. For the avoidance of doubt,nothing in the CEO Agreement will limit the Company’s right to terminate the employee for Cause atany time in accordance with the CEO Agreement.
The CEO Agreement provides for a possibility of transitioning the employee to a part-timeposition at any time, by the employee’s discretion, without such transition being deemed in breach ofthe CEO Agreement. The CEO Agreement also provides for a possibility of transitioning the employeeto a part-time position from and after July 1, 2022, and through June 30, 2023, by a supermajority voteby the Board, and from July 1, 2023, through the remainder of the employment period, by a simplemajority vote by the Board; and such a transition will not constitute Good Reason, or an effectivetermination of the employee’s position without Cause. In the event of the aforementioned transitions,the Board will proportionally adjust the salary and bonus and stretch bonus payable to the employeepursuant to the CEO Agreement based on the new level of commitment from the Employee; providedthat for the avoidance of doubt, and notwithstanding anything to the CEO Agreement, such adjusted
175

bonus and stretch bonus will be determined by the Board, and will be based upon the Company andthe employee achieving certain performance goals to be established by the Board. For the avoidanceof doubt, the employee, as a member of the Board, may participate in discussion by the Board, butshall be excluded from participating in vote of the Board related to his transition.
The CEO Agreement contains a one year post-termination non-solicitation of customers andemployees and non-competition covenants, as well as a perpetual confidentiality covenant.
Martin Roper
On September 18, 2019, we entered into an employment agreement with Mr. Roper, providing forhis employment as our President, which was subsequently amended on March 19, 2020, and again onDecember 27, 2020, or the President Agreement. Effective as of January 1, 2021, Mr. Roper wasappointed to serve as our Co-Chief Executive Officer. In connection with this offering, we intend toenter into an amended and restated employment agreement with Mr. Roper. Many of the materialterms of Mr. Roper’s employment agreement will remain the same. Some key changes to be made toMr. Roper’s employment agreement include, without limitation, subjecting his benefits andcompensation under the agreement, to the extent applicable, to any claw-back or similar policy andany amendments, policies and procedures with regards to Section 409A that the Company may adopt.
Pursuant to the President Agreement, Mr. Roper is entitled to, effective retroactively as ofMay 18, 2020, an annual base salary of $375,000. Effective as of January 1, 2021, his base salary willbe $425,000 per year, and effective as of January 1, 2022, it will automatically increase to $460,000per year. The President Agreement also provides that Mr. Roper was eligible to receive annualperformance-based bonus equal to 65% of his annual base salary, and an additional stretch bonusequal to an additional 65% of his annual base salary, both based on the Company’s achievement ofperformance goals. Effective as of January 1, 2022, the annual performance-based bonus and theadditional stretch bonus was each increased to 75%, respectively.
Pursuant to the President Agreement, Mr. Roper was eligible to acquire 3,822 shares of theCompany’s common stock, which are subject to certain rights and restrictions (including a call right thatwill fully expire upon an IPO provided the employee is then still employed on such dates). Inconnection with the purchase of these shares, in September 2019, Mr. Roper entered into a securedpromissory note in the amount of $17.7 million at an interest rate equal to the U.S. mid-term ApplicableFederal Rate in effect as of the signing date, or 1.78%, compounded annually. The loan is secured bya pledge of these shares and has the following terms: (i) a five year term, (ii) accrued interest,compounded annually, for the five-year term, (iii) interest at the “applicable federal rate” pursuant toSection 1274 of the Internal Revenue Code, and (iv) recourse to Mr. Roper with respect to 50% of theamount of the loan on the purchase date and penalties and 100% on the costs of collection andaccrued interest thereon. In May 2020, the secured promissory note was amended, extending the termof the loan to the fifth anniversary from the effective date of the amendment, and amending the interestrate on the loan to 0.58%. This loan will be repaid at the earlier of the contractually stated term of fiveyears from the date of the amendment or prior to the filing of a registration statement in connectionwith an initial public offering.
Mr. Roper was also eligible to receive a stock option reflecting the option to purchase 1% of theCompany at current fair market value price per share, which will become exercisable upon thefollowing two conditions: (a) if the Company goes public via an IPO or gets fully acquired via a merger,sale of assets, sale of stock or otherwise, whereby one hundred percent of the equity or assets of theCompany is purchased by a third-party, or, in the alternative, a lesser percentage of such equity ofassets of the Company is first acquired together simultaneously with obtaining the exclusive right topurchase the remainder of the Company’s then outstanding equity or assets at a later date; and (b) if
176

the equity value of the Company (defined as enterprise value less net debt) is equal to or greater than$1 billion USD at the time of the IPO or upon the closing of any such acquisition as specifically detailedabove, or the total market capitalization of the Company (defined as total Company shares outstandingmultiplied by trading price) is equal to or greater than $1 billion USD for a period of at least ninetyconsecutive trading days post-IPO. His equity awards are further described in detail in the “EquityCompensation—Stock Plan and Option Grants” above.
In the event Mr. Roper terminates his employment for Good Reason or by the Company withoutCause, conditional on his signing a general release, the Company will pay Mr. Roper: (i) any accrued butunpaid salary rendered to the date of termination; (ii) a severance payment amount equal to theemployee’s salary and bonus at the time of such termination, payable in substantially equal installmentsover a one-year period beginning thirty days after the date of such termination; and (iii) in addition to theseverance payment described above, a rent compensation amount equal to any employee obligations fornon-cancelable New York apartment and furniture lease payments, not to exceed $65,000.
In the event Mr. Roper is terminated due to death or for disability, the Company will payMr. Roper any accrued but unpaid salary and earned bonus for a prior completed year for servicesrendered to the date of termination.
In the event Mr. Roper is terminated by the Company for Cause or voluntary terminates otherthan for Good Reason, the Company will pay Mr. Roper any accrued but unpaid salary and earnedbonus for a prior completed year for services rendered prior to the date of termination and nothingelse.
For the purposes of the President Agreement, as intended to be amended in connection with thisoffering, “Good Reason” means a termination by the employee of his employment with the Companyfollowing one or more of the following occurrences (without the employee’s express written consent): (i)any breach by the Company of the Company’s material obligations under the President Agreement orany other material written agreements between the employee and the Company, including but notlimited to a change in the employee’s roles to lesser roles than specified in the President Agreement, areduction or material adverse change in the employee’s responsibilities, authorities, duties or directreports (all direct reports of the prior Chief Executive Officer), (ii) a termination by the employee due toconflicts created by the Company’s entrance into business areas in unresolvable conflict with theemployee’s non -compete obligations with The Boston Beer Company, (iii) any relocation of theemployee’s principal place of employment (without the employee’s written consent) to an office orlocation more than fifty miles from the location the Employee is assigned as of the date of the secondamendment to the President Agreement or (iv) the failure to appoint the employee as sole ChiefExecutive Officer of the Company (if not then already serving as sole Chief Executive Officer) followingthe completion of an IPO of any class of the Company’s securities; provided that (x) the employeeprovides written notice to the Company specifying in reasonable detail the circumstances claimed toprovide the basis for such termination within forty-five days following the date the employee firstbecomes aware of the occurrence (or reasonably should have been aware of such occurrence),without the employee’s written consent, of such events, (y) the Company fails to correct thecircumstances set forth in the employee’s notice of termination within thirty days of receipt of suchnotice, or the President Cure Period, and (z) the employee actually terminates employment within sixtydays following the end of the President Cure Period.
For the purposes of the President Agreement, the Company may terminate the employee’semployment (A) upon written notice in the event of any indictment (or charge) of the employee or hisentering of a plea of nolo contendere with respect to any crime constituting a felony or with any othercrime involving moral turpitude (in each case, excluding a traffic or parking violation, jaywalking, drivingwhile intoxicated or similar offense), whether or not in the course of the employee’s duties, or (B) for
177
“Cause”; provided that (x) the Company provides written notice to the employee specifying inreasonable detail the circumstances claimed to provide the basis for such termination within twentydays following the occurrence (or, if later, within twenty days following the date the Company firstbecomes aware), without Company’s consent, of an event constituting “Cause”, (y) the employee failsto correct the circumstances set forth in the Company’s notice of termination within forty-five days ofreceipt of such notice, and (z) the Company actually terminates the employee’s employment withinsixty days following such occurrence. “Cause” means (i) the employee’s failure to comply with anyapplicable laws, rules or regulations of any federal, state or local authority having jurisdiction over theCompany and its business operations; (ii) the employee’s failure to comply with the lawful specificdirections of the Board related to the Employee’s duties (provided if the employee receives contrarylawful directives, the Board’s lawful directive shall control); (iii) the employee’s committing any willfulact which constitutes a conflict of interest with the Company, or any act which constitutes a breach offiduciary duty owed by the employee to the Company; provided, however, the Company acknowledgesand agrees that in no event shall services the employee may provide to certain other approvedorganizations, companies and/or businesses limited to an aggregate of a maximum of fifteen days percalendar year be deemed (x) a breach of his fiduciary duties to the Company or its shareholders, (y) aconflict of interest, or (z) a breach of the President Agreement; (iv) the employee’s willful breach of anymaterial provision of the President Agreement; or (v) the employee’s conviction, or entering of a plea ofno lo contendere, to a felony or other crime involving moral turpitude.
The President Agreement contains a one year post-termination non-solicitation of customers andemployees and a six month post-termination (or, if longer, the period of months, not in excess of twelvemonths, determined by dividing the aggregate severance (if any) payable to the employee byone-twelfth of the sum of the employee’s annual salary and bonus, if such quotient exceeds six)non-competition covenants, as well as a perpetual confidentiality covenant.
Jonathan Burth
On February 10, 2020, we entered into an employment agreement with Mr. Jonathan Burth,providing for his employment as our Chief Operating Officer, or the COO Agreement.
Pursuant to the COO Agreement, Mr. Burth is entitled to an annual base salary of $322,500,which will be automatically adjusted on January 1, 2021, and January 1, 2022, to $337,500 and$352,500, respectively, provided he continues to be employed in good standing. The COO Agreementalso provides that Mr. Burth is eligible to receive an annual bonus of up to a 35% of his then applicablesalary, and an additional stretch bonus equal to 35% of his then applicable salary, based upon theCompany’s achievement of its annual performance goals. Mr. Burth also had an additional bonusopportunity of 10% of his salary tied to the completion of targeted supply chain related cost andefficiency measures that would improve costs in 2021.
Mr. Burth is also eligible to participate in the Two-Year Leadership Team Bonus incentive, ofwhich payout and conditions are based on the Company’s 2021 net revenue, adjusted EBITDA andcertain other performance metrics (including the Company’s branded net revenue CAGR for the 2021year over the 2019 year for existing brands), and which rewards Company performance through the2021 year. Mr. Burth’s potential Two-Year Leadership Team Bonus incentive bonus amount rangesfrom $300,000 to $750,000, depending on the size of the Company’s branded net revenue CAGR forthe 2021 year over the 2019 year. Such bonus will be paid in 2022 as part of the normal year-endreview cycle if performance merits.
Pursuant to the COO Agreement, Mr. Burth received stock options described in the “EquityCompensation—Stock Plan and Option Grants” above.
178

In the event Mr. Burth is terminated for Good Reason or by the Company without Cause,conditional on his signing a general release, the Company will pay Mr. Burth: (i) any accrued butunpaid salary plus, any earned bonus for a prior completed year for services rendered prior to the dateof termination (including but not limited to those amounts that are due during the applicable period ofnotice); (ii) a severance payment amount equal to six months of his salary and prorated target bonus atthe time of such termination, payable in substantially equal installments over a six month periodbeginning thirty days after the date of such termination; (iii) an additional severance payment ifMr. Burth has six full years of service with the Company, reflecting an addition month of salary for eachfull year of service in excess of six years, capped at a maximum of six additional months of salary fortwelve or more full years of service, payable in ongoing monthly installments of a month’s salary afterthe six month period in the preceding (ii) finishes until the additional severance payment is complete;and (iv) if the Company terminates his employment without Cause, and the effective date of thecessation of employment is more than four months into the financial year, then provided that Mr. Burthhas met all requests for transition support including agreeing to the termination employment daterequested by the Company, then the Company will pay out a bonus for a partial year calculated basedon the salary paid for those months of service that year, such payout being made within two months ofthe performance and bonus determination for other similar executives at the end of that year.
In the event Mr. Burth is terminated due to death or for disability, the Company will pay Mr. Burthany accrued but unpaid salary plus any earned bonus for a prior completed year for services renderedprior to the date of termination.
In the event Mr. Burth is terminated by the Company for Cause or voluntary terminates other thanfor Good Reason, the Company will pay Mr. Burth any accrued but unpaid salary plus any earnedbonus for a prior completed year for services rendered prior to the date of termination and nothing else.
For purposes of the COO Agreement, “Good Reason” means a termination by the employee ofhis employment with the Company following any breach by the Company of the Company’s materialobligations under the COO Agreement or any other material written agreements between the employeeand the Company, or any decrease in salary or material decrease in annual bonus opportunity,provided that (x) Mr. Burth provides written notice to the Company specifying in reasonable detail thecircumstances claimed to provide the basis for such termination within forty-five days following the datehe first becomes aware of the occurrence (or reasonably should have been aware of such occurrence),without his written consent, of such events, (y) the Company fails to correct the circumstances set forthin his notice of termination within thirty days of receipt of such notice, or the COO Cure Period, and(z) Mr. Burth actually terminates employment within sixty days following the end of the COO CurePeriod.
For the purposes of the COO Agreement, the Company may terminate the employee’semployment (A) upon written notice in the event of any indictment (or charge) of the employee or hisentering of a plea of nolo contendere with respect to any crime constituting a felony or with any othercrime involving moral turpitude (in each case, excluding a traffic or parking violation, jaywalking, drivingwhile intoxicated or similar offense), whether or not in the course of the employee’s duties, or (B) for“Cause”; provided that (x) the Company provides written notice to the employee specifying inreasonable detail the circumstances claimed to provide the basis for such termination within twentydays following the occurrence (or, if later, within twenty days following the date the Company firstbecomes aware), without Company’s consent, of an event constituting “Cause”, (y) the employee failsto correct the circumstances set forth in the Company’s notice of termination within forty-five days ofreceipt of such notice, and (z) the Company actually terminates the employee’s employment withinsixty days following such occurrence. “Cause” means (i) the employee’s failure to comply with anyapplicable laws, rules or regulations of any federal, state or local authority having jurisdiction over theCompany and its business operations; (ii) the employee’s failure to comply with the lawful specific
179

directions of the CEO, the President and/or the Board related to the Employee’s duties (provided if theemployee receives contrary lawful directives, the Board’s lawful directive shall control); (iii) theemployee’s committing any willful act which constitutes a conflict of interest with the Company, or anyact which constitutes a breach of fiduciary duty owed by the employee to the Company; (iv) theemployee’s willful breach of any material provision of the COO Agreement; or (v) the employee’sconviction, or entering of a plea of no lo contendere, to a felony or other crime involving moralturpitude.
The COO Agreement contains a one year post-termination non-solicitation of customers andemployees and non-competition covenants, as well as a perpetual confidentiality covenant.
Director Compensation
The only compensation paid to non-employee directors in fiscal year 2020 are grants of stockoptions. On January 2, 2020, we granted John Leahy 27,300 stock options and Kenneth Sadowsky27,300 stock options pursuant to the 2014 Plan.
Name
OptionAwards($)(1)(2)
John Leahy . . . . . . . . . . . . . . . . . . . . . . . . . . . . . . . . . . . . . . . . . . . . . . . . . . . . . . . . . . . . . . . . . . . . 90,920Kenneth Sadowsky . . . . . . . . . . . . . . . . . . . . . . . . . . . . . . . . . . . . . . . . . . . . . . . . . . . . . . . . . . . . . . 90,920
(1) Amounts reflect the full grant-date fair value of stock options granted during fiscal year 2020 computed in accordance withASC Topic 718, rather than the amounts paid to or realized by the named individual. For additional information regarding theassumptions used to calculate the value of all option awards, please see Note 15 to our audited consolidated financialstatements appearing elsewhere in this prospectus.
(2) Both Mr. Leahy and Mr. Sadowsky’s stock options vest as follows so long as each remains a director of the Company’sboard: one-third of the total stock option will become exercisable on and after twelve month anniversary of the date of grant,an additional one-third of the total stock option will become exercisable on and after the twenty-four month anniversary ofthe date of grant; and an additional one-third of the total stock option will become exercisable on and after the thirty-sixmonth anniversary of the date of grant.
In connection with this offering, we intend to adopt a director compensation program, under whichwe may grant cash retainers and equity incentive awards to each of our non-employee directors for hisor her services on our board of directors, including a grant in connection with this offering to each ofour non-employee directors of restricted stock units with a value of $35,000, to vest on the earlier of(i) the day immediately preceding the date of the first annual meeting following the date of grant and(ii) the first anniversary of the date of grant, subject to continued service on the Company’s Boardthrough the applicable vesting date; provided that, notwithstanding the foregoing, such restricted stockunits shall vest in full immediately prior to the occurrence of a change in control of the Company.
Equity Plans
2014 Plan
We currently maintain the 2014 Plan, as described above. The 2014 Plan allowed for a maximumof 8% of the sum of (i) the total then outstanding shares of common stock of the Company and (ii) allavailable stock options (i.e., granted and outstanding stock options and stock options not yet granted)to be delivered in satisfaction of equity awards under the 2014 Plan and any other incentive plans ofthe Company.
The compensation committee designated by the board of directors is the plan administrator of the2014 Plan. If no compensation committee is designated, the board of directors is deemed the plan
180

administrator. The plan administrator has discretionary authority, subject to the 2014 Plan, to interpretthe 2014 Plan, determine eligibility for and grant awards, determine, modify or waive the terms andconditions of any award, prescribe forms, rules and procedures, and otherwise do all things necessaryto carry out the purposes of the 2014 Plan.
The plan administrator also has the ability to select participants from among those key employeesand directors of, and consultants and advisors to, the Company or its affiliates who, in the opinion ofthe plan administrator, are in a position to make a significant contribution to the success of theCompany and its affiliates. Awards under the 2014 plan maybe be either or both (i) stock options or (ii)restricted stock. The plan administrator will determine the terms of all awards, subject to certainlimitations provided in the 2014 Plan.
In the event of certain covered transactions, as defined in the 2014 Plan, in which there is anacquiring or surviving entity, the plan administrator may provide for the assumption of some or alloutstanding awards, or for the grant of new awards in substitution therefor, by the acquiror or survivoror an affiliate of the acquiror or survivor, in each case on such terms and subject to such conditions asthe plan administrator determines. In addition to, or in lieu of the foregoing, with respect to outstandingstock options, the plan administrator may, upon written notice to the affected optionees, terminate oneor more stock options in exchange for a cash payment equal to the excess of the fair market value (asdetermined by the board in its sole discretion) of the shares subject to such stock options (to the extentthen exercisable or to be exercisable as a result of the covered transaction) over the exercise pricethereof. In the absence of such an assumption or substitution, or if there is no such termination, eachstock option will become fully exercisable prior to the covered transaction (on a basis that gives theholder of such stock option a reasonable opportunity, as determined by the plan administrator, toexercise and participate as a shareholder in the covered transaction) and will terminate uponconsummation of the covered transaction. In the case of restricted stock, the plan administrator mayrequire that any amounts delivered, exchanged or otherwise paid in respect of such stock inconnection with the covered transaction be placed in escrow or otherwise made subject to suchrestrictions as the plan administrator deems appropriate to carry out the intent of the 2014 Plan.
The plan administrator may at any time or times amend, and may at any time terminate, the 2014Plan or any outstanding award for any purpose which may at the time be permitted by law; provided,that the plan administrator may not, without the participant’s consent, alter the terms of an award so asto affect adversely the participant’s rights under the award, unless the plan administrator expresslyreserved the right to do so at the time of the award.
On and after the closing of this offering and following the effectiveness of the 2021 Plan, nofurther grants will be made under the 2014 Plan.
New Equity Incentive Plans
2021 Incentive Award Plan
In connection with this offering, we intend to adopt the 2021 Incentive Award Plan, or the 2021Plan, subject to approval by our stockholders, under which we may grant cash and equity-basedincentive awards to eligible service providers in order to attract, motivate and retain the talent for whichwe compete. The material terms of the 2021 Plan, as it is currently contemplated, are summarizedbelow. This summary is not a complete description of all provisions of the 2021 Plan and is qualified inits entirety by reference to the 2021 Plan, which will be filed as an exhibit to the registration statementof which this prospectus is a part.
181

Eligibility and Administration
Our employees, consultants and directors, and employees, consultants and directors of oursubsidiaries, are eligible to receive awards under the 2021 Plan. The 2021 Plan is expected to beinitially administered by our board of directors, which may delegate its duties and responsibilities tocommittees of our directors and/or officers (referred to below as, collectively, the plan administrator),subject to certain limitations that may be imposed under Section 16 of the Exchange Act, and/or stockexchange rules, as applicable. The plan administrator will have the authority to make all determinationsand interpretations under, prescribe all forms for use with, and adopt rules for the administration of, the2021 Plan, subject to its express terms and conditions. The plan administrator will also set the termsand conditions of all awards under the 2021 Plan, including any vesting and vesting accelerationconditions.
Limitation on Awards and Shares Available
The maximum number of shares of our common stock available for issuance under the 2021 Planis equal to the sum of (i) 3,431,312 shares of our common stock and (ii) an annual increase on the firstday of each year beginning in 2022 and ending in and including 2031, equal to the lesser of (A) twopercent (2%) of the outstanding shares of our common stock on the last day of the immediatelypreceding fiscal year and (B) such lesser amount as determined by our board of directors; provided,however, no more than 3,431,312 shares may be issued upon the exercise of incentive stock options,or ISOs. The share reserve formula under the 2021 Plan is intended to provide us with the continuingability to grant equity awards to eligible employees, directors and consultants for the ten-year term ofthe 2021 Plan.
Awards granted under the 2021 Plan upon the assumption of, or in substitution for, outstandingequity awards previously granted under a qualifying equity plan maintained by an entity in connectionwith a corporate transaction with the Company, such as a merger, combination, consolidation oracquisition of property or stock will not reduce the shares authorized for grant under the 2021 Plan.The maximum grant date fair value of cash and equity awards granted to any non-employee directorpursuant to the 2021 Plan during any calendar year is $750,000.
Awards
The 2021 Plan provides for the grant of stock options, including ISOs and nonqualified stockoptions, or NSOs, restricted stock, dividend equivalents, stock payments, restricted stock units, orRSUs, other incentive awards, SARs, and cash awards. Certain awards under the 2021 Plan mayconstitute or provide for a deferral of compensation, subject to Section 409A of the Code, which mayimpose additional requirements on the terms and conditions of such awards. All awards under the2021 Plan will be set forth in award agreements, which will detail all terms and conditions of theawards, including any applicable vesting and payment terms and post-termination exercise limitations.Awards other than cash awards generally will be settled in shares of our common stock, but the planadministrator may provide for cash settlement of any award. A brief description of each award typefollows.
• Stock Options. Stock options provide for the purchase of shares of our common stock in thefuture at an exercise price set on the grant date. ISOs, by contrast to NSOs, may provide taxdeferral beyond exercise and favorable capital gains tax treatment to their holders if certainholding period and other requirements of the Code are satisfied. The exercise price of astock option may not be less than 100% of the fair market value of the underlying share onthe date of grant (or 110% in the case of ISOs granted to certain significant stockholders),except with respect to certain substitute options granted in connection with a corporatetransaction. The term of a stock option may not be longer than ten years (or five years in the
182

case of ISOs granted to certain significant stockholders). Vesting conditions determined bythe plan administrator may apply to stock options and may include continued service,performance and/or other conditions.
• SARs. SARs entitle their holder, upon exercise, to receive from us an amount equal to theappreciation of the shares subject to the award between the grant date and the exercisedate. The exercise price of a SAR may not be less than 100% of the fair market value of theunderlying share on the date of grant (except with respect to certain substitute SARs grantedin connection with a corporate transaction). The term of a SAR may not be longer than tenyears. Vesting conditions determined by the plan administrator may apply to SARs and mayinclude continued service, performance and/or other conditions.
• Restricted Stock and RSUs. Restricted stock is an award of nontransferable shares of ourcommon stock that remain forfeitable unless and until specified conditions are met, andwhich may be subject to a purchase price. RSUs are contractual promises to deliver sharesof our common stock in the future, which may also remain forfeitable unless and untilspecified conditions are met, and may be accompanied by the right to receive the equivalentvalue of dividends paid on shares of our common stock prior to the delivery of the underlyingshares. Delivery of the shares underlying RSUs may be deferred under the terms of theaward or at the election of the participant, if the plan administrator permits such a deferral.Conditions applicable to restricted stock and RSUs may be based on continuing service, theattainment of performance goals and/or such other conditions as the plan administrator maydetermine.
• Other Stock or Cash Based Awards. Other stock or cash based awards of cash, fully vestedshares of our common stock and other awards valued wholly or partially by referring to, orotherwise based on, shares of our common stock. Other stock or cash based awards may begranted to participants and may also be available as a payment form in the settlement ofother awards, as standalone payments and as payment in lieu of base salary, bonus, fees orother cash compensation otherwise payable to any individual who is eligible to receiveawards.
• Dividend Equivalents. Dividend equivalents represent the right to receive the equivalentvalue of dividends paid on shares of our common stock and may be granted alone or intandem with awards other than stock options or SARs. Dividend equivalents are credited asof dividend record dates during the period between the date an award is granted and thedate such award vests, is exercised, is distributed or expires, as determined by the planadministrator.
Performance Awards
Performance awards include any of the foregoing awards that are granted subject to vesting and/or payment based on the attainment of specified performance goals or other criteria the planadministrator may determine, which may or may not be objectively determinable. Performance criteriaupon which performance goals are established by the plan administrator may include but are notlimited to: net earnings or losses (either before or after one or more of interest, taxes, depreciation,amortization, and non-cash equity-based compensation expense); gross or net sales or revenue orsales or revenue growth; net income (either before or after taxes) or adjusted net income; profits(including but not limited to gross profits, net profits, profit growth, net operation profit or economicprofit), profit return ratios or operating margin; budget or operating earnings (either before or aftertaxes or before or after allocation of corporate overhead and bonus); cash flow (including operatingcash flow and free cash flow or cash flow return on capital); return on assets; return on capital orinvested capital; cost of capital; return on stockholders’ equity; total stockholder return; return on sales;costs, reductions in costs and cost control measures; expenses; working capital; earnings or loss per
183
share; adjusted earnings or loss per share; price per share or dividends per share (or appreciation in ormaintenance of such price or dividends); regulatory achievements or compliance; implementation,completion or attainment of objectives relating to research, development, regulatory, commercial, orstrategic milestones or developments; market share; economic value or economic value addedmodels; division, group or corporate financial goals; customer satisfaction/growth; customer service;employee satisfaction; recruitment and maintenance of personnel; human resources management;supervision of litigation and other legal matters; strategic partnerships and transactions; financial ratios(including those measuring liquidity, activity, profitability or leverage); debt levels or reductions; sales-related goals; financing and other capital raising transactions; cash on hand; acquisition activity;investment sourcing activity; and marketing initiatives, any of which may be measured in absoluteterms or as compared to any incremental increase or decrease.
Vesting
Vesting conditions determined by the plan administrator may apply to each award and mayinclude continued service, performance and/or other conditions.
Certain Transactions
The plan administrator has broad discretion to take action under the 2021 Plan, as well as tomake adjustments to the terms and conditions of existing and future awards, to prevent the dilution orenlargement of intended benefits, to facilitate the transaction, or to give effect to changes in applicablelaw or accounting principles, in connection with certain transactions and events affecting our commonstock, such as a change in control, stock dividends, stock splits, mergers, consolidations and othercorporate transactions. This includes cancelling awards for cash or property, accelerating the vestingof awards, providing for the assumption or substitution of awards by a successor entity, adjusting thenumber and type of shares subject to outstanding awards and/or with respect to which awards may begranted under the 2021 Plan and replacing or terminating awards under the 2021 Plan. In addition, inthe event of certain non-reciprocal transactions with our stockholders known as “equity restructurings,”the plan administrator will make equitable adjustments to the 2021 Plan and outstanding awards.
In the event of a “change in control” of our company (as defined in the 2021 Plan), (a) to theextent that the surviving entity declines to continue, convert, assume or replace outstanding awards,then all such awards may become fully vested and exercisable in connection with the transaction; and(b) to the extent that the surviving entity assumes outstanding awards and the participant is terminatedby the surviving entity (other than for “cause” (as defined in the 2021 Plan) and other than as a result ofdeath or disability) within twelve (12) months following such change in control, then all of theparticipant’s unvested awards may become fully vested and exercisable in connection with suchtermination. Upon or in anticipation of a change of control, the plan administrator may cause anyoutstanding awards to terminate at a specified time in the future and give the participant the right toexercise such awards during a period of time determined by the plan administrator in its solediscretion.
Individual award agreements may provide for additional accelerated vesting and paymentprovisions.
Foreign Participants, Claw-Back Provisions, Transferability, and Participant Payments
The plan administrator may modify award terms, establish subplans and/or adjust other termsand conditions of awards, subject to the share limits described above, in order to facilitate grants ofawards subject to the laws and/or stock exchange rules of countries outside of the United States. Allawards will be subject to the provisions of any claw-back policy implemented by us to the extent set
184

forth in such claw-back policy and/or in the applicable award agreement. With limited exceptions forestate planning, domestic relations orders, certain beneficiary designations and the laws of descentand distribution, awards under the 2021 Plan are generally non-transferable, and are exercisable onlyby the participant. With regard to tax withholding, exercise price and purchase price obligations arisingin connection with awards under the 2021 Plan, the plan administrator may, in its discretion, acceptcash or check, provide for net withholding of shares, allow shares of our common stock that meetspecified conditions to be repurchased, allow a “market sell order” or such other consideration as itdeems suitable.
Plan Amendment and Termination
Our board of directors may amend or terminate the 2021 Plan at any time; however, except inconnection with certain changes in our capital structure, stockholder approval will be required for anyamendment that increases the number of shares available under the 2021 Plan. No award may begranted pursuant to the 2021 Plan after the tenth anniversary of the earlier of (i) the date on which ourboard of directors adopts the 2021 Plan and (ii) the date on which our stockholders approve the 2021Plan.
2021 Employee Stock Purchase Plan
In connection with this offering, we intend to adopt the 2021 Employee Stock Purchase Plan, orthe ESPP, subject to approval by our stockholders. The ESPP is designed to allow our eligibleemployees to purchase shares of our common stock, at periodic intervals, with their accumulatedpayroll deductions. The ESPP consists of two components: a Section 423 component, which isintended to qualify under Section 423 of the Code and a non-Section 423 component, which need notqualify under Section 423 of the Code. The material terms of the ESPP as currently contemplated aresummarized below. This summary is not a complete description of all provisions of the ESPP and isqualified in its entirety by reference to the ESPP, which will be filed as an exhibit to the registrationstatement of which this prospectus is a part.
Shares Available; Administration
The aggregate number of shares of our common stock available for issuance under the ESPP isequal to the sum of (i) 571,885 shares of our common stock and (ii) an annual increase on the first dayof each year beginning in 2022 and ending in and including 2031, equal to the lesser of (A) 1 percent(1%) of the outstanding shares of our common stock on the last day of the immediately precedingcalendar year and (B) such lesser amount as determined by our board of directors; provided that in noevent will more than 6,290,739 shares of our common stock be available for issuance under theSection 423 component of the ESPP. Our board of directors or the compensation committee will haveauthority to interpret the terms of the ESPP and determine eligibility of participants. We expect that theboard of directors will be the initial administrator of the ESPP.
Eligibility
The plan administrator may designate certain of our subsidiaries as participating “designatedsubsidiaries” in the ESPP and may change these designations from time to time. We expect that ouremployees, other than employees who, immediately after the grant of a right to purchase commonstock under the ESPP, would own (directly or through attribution) stock possessing 5% or more of thetotal combined voting power or value of all classes of our common or other class of stock (includingClass B common stock), will be eligible to participate in the ESPP.
185

Grant of Rights
The Section 423 component of the ESPP will be intended to qualify under Section 423 of theCode and shares of our common stock will be offered under the ESPP during offering periods. Thelength of the offering periods under the ESPP will be determined by the plan administrator and may beup to 27 months long. Employee payroll deductions will be used to purchase shares on each purchasedate during an offering period. The purchase dates for each offering period will be the final trading dayin each purchase period. Offering periods under the ESPP will commence when determined by theplan administrator. The plan administrator may, in its discretion, modify the terms of future offeringperiods. We do not expect that any offering periods will commence under the ESPP at the time of thisoffering.
The ESPP will permit participants to purchase common stock through payroll deductions of up toa percentage of their eligible compensation, which includes a participant’s gross base compensationfor services to us. The plan administrator will establish a maximum number of shares that may bepurchased by a participant during any offering period, which, in the absence of a contrary designation,will be equal to 10,000 shares. In addition, under the Section 423 component, no employee will bepermitted to accrue the right to purchase stock under the ESPP at a rate in excess of $25,000 worth ofshares during any calendar year during which such a purchase right is outstanding (based on the fairmarket value per share of our common stock as of the first trading day of the offering period).
On the first trading day of each offering period, each participant will automatically be granted anoption to purchase shares of our common stock. The option will expire at the end of the applicableoffering period and will be exercised on each purchase date during such offering period to the extent ofthe payroll deductions accumulated during the offering period. The purchase price will be the lower of85% of the fair market value of a share on the first day of an offering period in which a participant isenrolled or 85% of the fair market value of a share on the purchase date, which will occur on the lastday of each purchase period. Participants may voluntarily end their participation in the ESPP at anytime at least two weeks prior to the end of the applicable offering period (or such longer or shorterperiod specified by the plan administrator), and will be paid their accrued payroll deductions that havenot yet been used to purchase shares of common stock.
Unless a participant has previously canceled his or her participation in the ESPP before thepurchase date, the participant will be deemed to have exercised his or her option in full as of eachpurchase date. Upon exercise, the participant will purchase the number of whole shares that his or heraccumulated payroll deductions will buy at the option purchase price, subject to the participationlimitations listed above. Participation will end automatically upon a participant’s termination ofemployment.
A participant will not be permitted to transfer rights granted under the ESPP other than by will, thelaws of descent and distribution or as otherwise provided under the ESPP.
Certain Transactions
In the event of certain transactions or events affecting our common stock, such as any stockdividend or other distribution, reorganization, merger, consolidation, or other corporate transaction, theplan administrator will make equitable adjustments to the ESPP and outstanding rights if the planadministrator determines it is appropriate to prevent dilution or enlargement of rights. In addition, in theevent of the foregoing transactions or events or certain significant transactions, the plan administratormay provide for (1) either the replacement of outstanding rights with other rights or property ortermination of outstanding rights in exchange for cash, (2) the assumption or substitution ofoutstanding rights by the successor or survivor corporation or parent or subsidiary thereof, if any, (3)
186

the adjustment in the number and type of shares of stock subject to outstanding rights, (4) the use ofparticipants’ accumulated payroll deductions to purchase stock on a new purchase date prior to thenext scheduled purchase date and termination of any rights under ongoing offering periods or (5) thetermination of all outstanding rights.
Plan Amendment
The plan administrator may amend, suspend or terminate the ESPP at any time. However,stockholder approval of any amendment to the ESPP will be obtained for any amendment thatincreases the aggregate number or changes the type of shares that may be sold pursuant to rightsunder the ESPP, or changes the corporations or classes of corporations the employees of which areeligible to participate in the ESPP.
Plan Amendment and Termination
The plan administrator may amend, suspend or terminate the ESPP at any time. However,stockholder approval will be obtained for any amendment to the ESPP that increases the aggregatenumber or changes the type of shares that may be sold pursuant to rights under the ESPP or as mayotherwise be required under Section 423(b) of the Code or other applicable law.
187

CERTAIN RELATIONSHIPS AND RELATED PARTY TRANSACTIONS
The following includes a summary of transactions since January 1, 2018 and any currentlyproposed transactions to which we were or are expected to be a participant in which (i) the amountinvolved exceeded or will exceed $120,000, and (ii) any of our directors, executive officers, or holdersof more than 5% of our capital stock, or any affiliate or member of the immediate family of theforegoing persons, had or will have a direct or indirect material interest, other than compensation andother arrangements that are described under the section titled “Executive Compensation.” Share andper share amounts in this section do not give effect to the Stock Split.
Share Repurchase
In January 2021, we entered into a Stock Purchase Agreement with RW VC S.a.r.l, a holder ofmore than 5% of our outstanding capital stock, pursuant to which we repurchased 11,411 shares of ourcommon stock at a purchase price of $4,382 per share, or an aggregate purchase price ofapproximately $50 million. The purchase price per share approximated the then most recent third-partycommon stock valuation prepared in conjunction with the accounting of stock-based compensation.See Note 10 to our unaudited condensed consolidated financial statements appearing elsewhere inthis prospectus.
In connection with the share repurchase, RW VC S.a.r.l amended their preemptive anddesignation rights under our prior shareholders agreement commensurate with their reducedownership percentage of our common stock.
Distribution Agreement
On October 1, 2019, our subsidiary, All Market Singapore PTE Ltd., entered into a distributionagreement, or the Distribution Agreement, with Reignwood Investment (China) Co., Ltd., or ReignwoodChina, an entity affiliated with RW VC S.a.r.l, providing for the exclusive distribution of coconut water-basedproducts by Reignwood China in mainland China. Pursuant to the terms of the Distribution Agreement,Reignwood China is obligated to purchase the products at an agreed upon price and in minimum volumesbased on product type. The amount of revenue recognized related to the Distribution Agreement was$7.2 million and $5.3 million for the years ended December 31, 2019 and 2020, respectively.
The current term of the Distribution Agreement continues to December 31, 2021, and thereafter maybe renewed and extended for successive one year terms upon the mutual agreement of each party.
See Note 20 to our audited consolidated financial statements appearing elsewhere in thisprospectus.
Pre-IPO Shareholders Agreement
We are party to a Third Amended and Restated Shareholders Agreement, dated as ofJanuary 15, 2021, or the Pre-IPO Shareholders Agreement, among us and certain of our stockholders,including our Founders, Verlinvest Beverages SA, or Verlinvest, and RW VC S.a.r.l., and certain of ourother executive officers and directors, providing for, among others, rights of first refusal, drag-alongrights, rights to distribution and rights to nominate directors for election to our board of directors. In July2021, we and RW VC S.a.r.l. entered into a waiver to the Pre-IPO Shareholders Agreement pursuantto which RW VC S.a.r.l. agreed to forfeit all remaining rights to designate a director to our board ofdirectors. In connection with the closing of this offering, the Pre-IPO Shareholders Agreement willeffectively be replaced by a registration rights agreement, or the Registration Rights Agreement, and aseparate investor rights agreement, or the Investor Rights Agreement, each as described in moredetail below.
188

Registration Rights Agreement
In connection with this offering, we expect to enter into the Registration Rights Agreement withVerlinvest, RW VC S.a.r.l, and certain of our other stockholders, pursuant to which such investors willhave certain demand rights, short-form registration rights and piggyback registration rights from us,subject to customary restrictions and exceptions. All fees, costs and expenses of registrations, otherthan underwriting discounts and commissions, are expected to be borne by us. The Registration RightsAgreement will not provide for any maximum cash penalties or any penalties connected with delays inregistering our common stock.
Investor Rights Agreement
In connection with this offering, we intend to enter into an Investor Rights Agreement pursuant towhich certain of our stockholders will have the right to nominate directors for election to our board ofdirectors for so long as such stockholder beneficially owns a specified percentage of our outstandingcapital stock. We intend to describe the material terms of this agreement in a subsequent pre-effectiveamendment to the registration statement of which this prospectus forms a part.
Loan to Officer
In September 2019, we entered into a secured promissory note with Martin Roper, our currentCo-Chief Executive Officer, in the amount of $17.7 million at an interest rate equal to the U.S. mid-termApplicable Federal Rate in effect as of the signing date, or 1.78%, compounded annually, in connectionwith the purchase of 3,822 shares of our common stock, or the Roper Purchased Shares. The loanwas secured by a pledge of the Roper Purchased Shares. In May 2020, we entered into anamendment to the secured promissory note, extending the term of the loan to the fifth anniversary fromthe effective date of the amendment, and amending the interest rate on the loan to 0.58%. The loanoutstanding was repaid prior to the filing of the registration statement in connection with this offering.
Indemnification Agreements
Prior to the consummation of this offering, we intend to enter into separate indemnificationagreements with each of our directors and executive officers. We have also purchased directors’ andofficers’ liability insurance. Our amended and restated certificate of incorporation and our amendedand restated bylaws will provide that we will indemnify our directors and officers to the fullest extentpermitted under Delaware law. See “Description of Capital Stock—Limitations on Liability andIndemnification Matters.”
Directed Share Program
At our request, the underwriters have reserved for sale at the initial public offering price per shareup to 2.0% of the common stock offered by this prospectus for sale at the initial public offering pricethrough a directed share program to certain individuals identified by management. See “Underwriting(Conflict of Interest)—Directed Share Program.”
Policies and Procedures for Related Party Transactions
Our board of directors intends to adopt a written related person transaction policy, to be effectiveupon the completion of this offering, setting forth the policies and procedures for the review and
189

approval or ratification of related person transactions. This policy will cover, with certain exceptions setforth in Item 404 of Regulation S-K under the Securities Act, any transaction, arrangement, orrelationship, or any series of similar transactions, arrangements, or relationships in which we were orare to be a participant, where the amount involved exceeds $120,000 and a related person had or willhave a direct or indirect material interest, including without limitation purchases of goods or services byor from the related person or entities in which the related person has a material interest, indebtedness,guarantees of indebtedness, and employment by us of a related person. In reviewing and approvingany such transactions, our audit committee is tasked to consider all relevant facts and circumstances,including but not limited to whether the transaction is on terms comparable to those that could beobtained in an arm’s length transaction with an unrelated third party and the extent of the relatedperson’s interest in the transaction. All of the transactions described in this section occurred prior to theadoption of this policy.
190

PRINCIPAL AND SELLING STOCKHOLDERS
The following table sets forth information with respect to the beneficial ownership of our commonstock as of September 30, 2021, assuming no exercise of the underwriters’ option to purchaseadditional shares, by:
• each of our named executive officers;
• each of our directors;
• all of our directors and executive officers as a group;
• each person or entity know by us to own beneficially more than 5% of our common stock; and
• each selling stockholder, as indicated by the stockholder shown as having shares listed in thecolumn “Number of Shares Being Offered” below.
The number of shares beneficially owned by each stockholder is determined under rules issuedby the SEC. Under these rules, a person is deemed to be a “beneficial” owner of a security if thatperson has or shares voting power or investment power, which includes the power to dispose of or todirect the disposition of such security. Except as indicated in the footnotes below, we believe, based onthe information furnished to us, that the individuals and entities named in the table below have solevoting and investment power with respect to all shares beneficially owned by them, subject to anyapplicable community property laws.
We have based percentage ownership of our common stock before this offering on 53,009,366shares of our common stock outstanding as of September 30, 2021, after giving effect to a 455-for-oneforward stock split of our common stock effected on October 11, 2021. The percentage ownership ofour common stock after this offering also assumes the foregoing, the issuance and sale of 2,500,000shares by us, the sale of 9,000,000 shares by the selling stockholders in this offering and theConcurrent Private Placement and does not include the exercise of the underwriters’ option topurchase 1,725,000 additional shares from the selling stockholders.
In computing the number of shares beneficially owned by a person and the percentage ownershipof such person, we deemed to be outstanding all shares subject to options held by the person that arecurrently exercisable, or would become exercisable or would vest based on service-based vestingconditions within 60 days of September 30, 2021. However, except as described above, we did notdeem such shares outstanding for the purpose of computing the percentage ownership of any otherperson. The table below excludes any purchases that may be made through our directed shareprogram or otherwise in this offering. Unless otherwise indicated, the address of each beneficial ownerlisted in the table below is c/o 250 Park Avenue South, Floor 7, New York, New York 10003.
191

Shares BeneficiallyOwned Beforethis Offering Number of Shares
Being Offered
Shares BeneficiallyOwned Afterthis Offering
and theConcurrent
PrivatePlacement
Name of Beneficial Owner Shares % Shares %
5% Stockholders:Verlinvest Beverages SA(1) . . . . . . . . . . . . . . . . . . . . . . . . . . . . . . . . . . . . . . 25,370,991 47.9% 3,240,000 21,105,350 38.0%RW VC S.a.r.l.(2) . . . . . . . . . . . . . . . . . . . . . . . . . . . . . . . . . . . . . . . . . . . . . . . 9,336,894 17.6% 5,760,000 3,576,894 6.4%Named Executive Officers, Directors and Director Nominee:Martin Roper(3) . . . . . . . . . . . . . . . . . . . . . . . . . . . . . . . . . . . . . . . . . . . . . . . . 2,318,680 4.4% — 2,318,680 4.2%Michael Kirban(4) . . . . . . . . . . . . . . . . . . . . . . . . . . . . . . . . . . . . . . . . . . . . . . 3,367,910 6.4% — 3,367,910 6.1%Jonathan Burth(5) . . . . . . . . . . . . . . . . . . . . . . . . . . . . . . . . . . . . . . . . . . . . . . 368,550 * — 368,550 *Eric Melloul(6) . . . . . . . . . . . . . . . . . . . . . . . . . . . . . . . . . . . . . . . . . . . . . . . . . 25,370,991 47.9% 3,240,000 21,105,350 38.0%Jane Morreau . . . . . . . . . . . . . . . . . . . . . . . . . . . . . . . . . . . . . . . . . . . . . . . . . — — — — —Ira Liran(7) . . . . . . . . . . . . . . . . . . . . . . . . . . . . . . . . . . . . . . . . . . . . . . . . . . . . 1,719,900 3.2% — 1,719,900 3.1%John Leahy(8) . . . . . . . . . . . . . . . . . . . . . . . . . . . . . . . . . . . . . . . . . . . . . . . . . 9,100 * — 9,100 *John Zupo(9) . . . . . . . . . . . . . . . . . . . . . . . . . . . . . . . . . . . . . . . . . . . . . . . . . . 38,675 * — 38,675 *Kenneth Sadowsky(10) . . . . . . . . . . . . . . . . . . . . . . . . . . . . . . . . . . . . . . . . . . 605,150 1.1% — 605,150 *Axelle Henry(11) . . . . . . . . . . . . . . . . . . . . . . . . . . . . . . . . . . . . . . . . . . . . . . . 25,370,991 47.9% 3,240,000 21,105,350 38.0%All Executive Officers, Directors and Director Nominee as a Group (13
individuals)(12): . . . . . . . . . . . . . . . . . . . . . . . . . . . . . . . . . . . . . . . . . . . . . . 34,189,792 62.5% 3,240,000 29,924,151 52.2%
* Denotes less than one percent (1.0%) of beneficial ownership.(1) Axelle Henry, Bernard Hours, and Tangula Srl, a Belgian limited company permanently represented by Eric Melloul, are the
members of the board of directors of Verlinvest Beverages SA, and share the voting and dispositive powers of our shares ofcommon stock. The business address for Verlinvest Beverages SA is Place Eugene Flagey 18, 1050 Brussels, Belgium.
(2) RW VC S.a.r.l. is controlled by its sole shareholder Reignwood Europe Holdings S.a.r.l., a limited company organized andexisting under the Luxembourger law. Yi-Chun Lai and Frank Walenta are managers of Reignwood Europe Holdings S.a.r.l.,and as a result they may be deemed to have voting and dispositive power over the shares held by RW VC S.a.r.l. Thebusiness address of both of the entities is 11 Avenue de la Porte-Neuve, 2227, Luxembourg.
(3) Consists of (a)(i) 435,435 shares of our common stock and (ii) 579,670 shares of our common stock subject to options heldby Mr. Roper with performance-based vesting conditions within 60 days of September 30, 2021 that we expect will besatisfied in connection with this offering, (b) 434,525 shares of our common stock held by Christopher G. Roper ExemptFamily Trust, for which Mr. Roper’s spouse is the trustee, (c) 434,525 shares of our common stock held by Peter S. RoperExempt Family Trust, for which Mr. Roper’s spouse is the trustee and (d) 434,525 shares of our common stock held byThomas L. Roper Exempt Family Trust, for which Mr. Roper’s spouse is the trustee.
(4) Consists of (i) 2,026,251 shares of our common stock held by Michael Kirban 2010 Trust (ii) 795,659 shares of our commonstock held by Michael Kirban Revocable Trust and (iii) 546,000 shares of our common stock subject to options held by Mr.Kirban that are exercisable within 60 days of September 30, 2021.
(5) Consists of (i) 173,355 shares of our common stock and (ii) 195,195 shares of our common stock subject to options that areexercisable within 60 days of September 30, 2021.
(6) Mr. Melloul holds no shares of common stock directly. Consists of the shares of our common stock held of record byVerlinvest Beverages SA and disclosed in footnote (1) above. Mr. Melloul is a member of the board of directors of VerlinvestBeverages SA and therefore may be deemed to have shared voting power with respect to our shares of common stock.Mr. Melloul disclaims beneficial ownership of such shares except to the extent of his pecuniary interest therein. Thebusiness address for Verlinvest Beverages SA is Place Euge’ ne Flagey 18, 1050 Brussels, Belgium.
(7) Consists of (i) 608,153 shares of our common stock held by Mir. Liran and (ii) 1,111,747 shares of our common stock heldby Ira Liran 2012 Family Trust.
(8) Consists of 9,100 shares of our common stock subject to options that are exercisable within 60 days of September 30, 2021.(9) Consists of 38,675 shares of our common stock subject to options that are exercisable within 60 days of September 30,
2021.(10) Consists of (i) 596,050 shares of our common stock and (ii) 9,100 shares of our common stock subject to options that are
exercisable within 60 days of September 30, 2021.(11) Ms. Henry holds no shares of common stock directly. Consists of the shares of common stock held of record by Verlinvest
Beverages SA and disclosed in footnote (1) above. Ms. Henry serves as Chief Financial Officer of Verlinvest Group, aparent entity of Verlinvest Beverages SA, and as a member of the board of directors of Verlinvest Beverages SA andtherefore may be deemed to have shared voting power with respect to our shares of common stock. Ms. Henry disclaimsbeneficial ownership of such shares except to the extent of her pecuniary interest therein. The business address forVerlinvest Beverages SA is Place Euge’ ne Flagey 18, 1050 Brussels, Belgium.
(12) Consists of (i) 32,472,622 shares of common stock and (ii) 1,717,170 shares of our common stock underlying options topurchase common stock that are exercisable (or expect to become exercisable in connection with the satisfaction of certainperformance-based vesting conditions as discussed in footnote (3)) within 60 days of September 30, 2021.
192

DESCRIPTION OF CAPITAL STOCK
The following summary describes our capital stock and the material provisions of our amendedand restated certificate of incorporation and our amended and restated bylaws are summaries and arequalified by reference to the amended and restated certificate of incorporation and the amended andrestated bylaws that will be in effect upon the closing of this offering. Copies of these documents will befiled with the SEC as exhibits to our registration statement, of which this prospectus forms a part.
General
Upon the completion of this offering, our authorized capital stock will consist of:
• 500,000,000 shares of common stock, par value of $0.01 per share, and
• 10,000,000 shares of preferred stock, par value of $0.01 per share.
As of June 30, 2021, assuming the filing and effectiveness of our amended and restatedcertificate of incorporation and the effectiveness of our amended and restated bylaws, each of whichwill occur immediately prior to the completion of this offering, there were outstanding:
• 52,996,125 shares of our common stock, held by approximately 127 stockholders of record;and
• no shares of our preferred stock outstanding.
Common Stock
Voting Rights
Holders of our common stock are entitled to one vote for each share held on all matterssubmitted to a vote of stockholders. The holders of our common stock will vote together as a singleclass, unless otherwise required by law. The holders of our common stock will not have cumulativevoting rights in the election of directors.
Dividend Rights
The holders of our common stock are entitled to receive dividends out of funds legally available ifour board of directors, in its discretion, determines to issue dividends and then only at the times and inthe amounts that our board of directors may determine. See the section titled “Dividend Policy” foradditional information.
No Preemptive or Similar Rights
Our common stock is not entitled to preemptive rights and is not subject to redemption or sinkingfund provisions. The rights, preferences and privileges of the holders of our common stock will besubject to and may be adversely affected by the rights of the holders of shares of any series of ourpreferred stock that we may designate in the future.
Right to Receive Liquidation Distributions
Upon our liquidation, dissolution, or winding up, the assets legally available for distribution to ourstockholders would be distributable ratably among the holders of our common stock and anyparticipating preferred stock outstanding at that time, subject to the prior satisfaction of all outstandingdebt and liabilities and the preferential rights of and the payment of liquidation preferences, if any, onany shares of preferred stock outstanding at that time.
193

Fully Paid and Nonassessable
All of our outstanding shares of common stock are, and the shares of common stock to be issuedin this offering will be, fully paid and nonassessable.
Preferred Stock
Following the completion of this offering, and pursuant to the provisions of our amended andrestated certificate of incorporation that will be in effect thereafter, our board of directors will beauthorized, subject to limitations prescribed by Delaware law, to issue preferred stock in one or moreseries, to establish from time to time the number of shares to be included in each series, and to fix thedesignation, powers, preferences, and rights of the shares of each series and any of its qualifications,limitations, or restrictions, in each case without further vote or action by our stockholders. Our board ofdirectors can also increase or decrease the number of shares of any series of preferred stock, but notbelow the number of shares of that series then outstanding, without any further vote or action by ourstockholders. Our board of directors may authorize the issuance of preferred stock with voting orconversion rights that could adversely affect the voting power or other rights of the holders of ourcommon stock. The issuance of preferred stock, while providing flexibility in connection with possibleacquisitions and other corporate purposes, could, among other things, have the effect of delaying,deferring, or preventing a change in control of our company and might adversely affect the marketprice of our common stock and the voting and other rights of the holders of our common stock. Wehave no current plans to issue any shares of preferred stock.
Stock Options
As of June 30, 2021, we had outstanding options to purchase an aggregate of 4,143,230 shares ofour common stock under our 2014 Plan, with a weighted average exercise price of $10.05 per share.
Registration Rights
We intend to enter into a Registration Rights Agreement with certain of our stockholders inconnection with this offering pursuant to which such parties will have specified rights to require us toregister all or a portion of their shares under the Securities Act. See “Certain Relationships and RelatedParty Transactions—Registration Rights Agreement.”
Anti-Takeover Provisions
The provisions of Delaware law, our amended and restated certificate of incorporation and ouramended and restated bylaws, as we expect they will be in effect upon the completion of this offering,could have the effect of delaying, deferring, or discouraging another person from acquiring control ofour company. These provisions, which are summarized below, may have the effect of discouragingtakeover bids. They are also designed, in part, to encourage persons seeking to acquire control of usto negotiate first with our board of directors. We believe that the benefits of increased protection of ourpotential ability to negotiate with an unfriendly or unsolicited acquirer outweigh the disadvantages ofdiscouraging a proposal to acquire us because negotiation of these proposals could result in animprovement of their terms.
194
Public Benefit Corporation Status
We are a public benefit corporation under Section 362 of the Delaware General Corporation Law.
As a public benefit corporation, our board of directors is required by the Delaware GeneralCorporation Law to manage or direct our business and affairs in a manner that balances the pecuniaryinterests of our stockholders, the best interests of those materially affected by our conduct, and thespecific public benefits identified in our certificate of incorporation. Under the Delaware GeneralCorporation Law, our stockholders may bring a derivative suit to enforce this requirement only if theyown (individually or collectively), at least 2% of our outstanding shares or, upon our listing, the lesser ofsuch percentage or shares of at least $2 million in market value.
We believe that our public benefit corporation status will make it more difficult for another party toobtain control of us without maintaining our public benefit corporation status and purpose.
Section 203 of the DGCL
Our amended and restated certificate of incorporation will contain a provision opting out ofSection 203 of the DGCL. However, our amended and restated certificate of incorporation will containprovisions that are similar to Section 203. Specifically, our amended and restated certificate ofincorporation will provide that, subject to certain exceptions, we will not be able to engage in a“business combination” with any “interested stockholder” for a period of three years following the datesuch person became an interested stockholder, unless the interested stockholder attained such statuswith the approval of our board of directors or unless the business combination is approved in aprescribed manner. A “business combination” includes, among other things, a merger or consolidationinvolving us and the “interested stockholder” and the sale of more than 10% of our assets. In general,an “interested stockholder” is any entity or person beneficially owning 15% or more of a corporation’soutstanding voting stock and any entity or person affiliated with or controlling or controlled by suchentity or person.
However, under our amended and restated certificate of incorporation, neither VerlinvestBeverages SA nor any of its affiliates will be deemed to be interested stockholders regardless ofthe percentage of our outstanding voting stock owned by them, and accordingly will not be subject tosuch restrictions.
Amended and Restated Certificate of Incorporation and Amended and Restated BylawProvisions
Our amended and restated certificate of incorporation and our amended and restated bylaws willinclude a number of provisions that could deter hostile takeovers or delay or prevent changes in controlof our management team, including the following:
• Board of Directors Vacancies. Verlinvest, Mr. Kirban and Mr. Liran, in the case of their boardnominees, will have the power to fill any vacancy caused by the removal or departure of theirdirector. In all other cases, our amended and restated certificate of incorporation and amendedand restated bylaws will authorize only our board of directors to fill vacant directorships,including newly created seats. In addition, the number of directors constituting our board ofdirectors is permitted to be set only by a resolution adopted by a majority vote of our entireboard of directors. These provisions would prevent a stockholder from increasing the size ofour board of directors and then gaining control of our board of directors by filling the resultingvacancies with its own nominees. This makes it more difficult to change the composition of ourboard of directors but promotes continuity of management.
195

• Classified Board. Our amended and restated certificate of incorporation and amended andrestated bylaws will provide that our board of directors will be classified into three classes ofdirectors. The existence of a classified board of directors could discourage a third party frommaking a tender offer or otherwise attempting to obtain control of us as it is more difficult andtime consuming for stockholders to replace a majority of the directors on a classified board ofdirectors. See the section titled “Management—Board Composition and Election of Directors”for additional information.
• Removal of Directors. Pursuant to the terms of the Investor Rights Agreement, directorsnominated by may be removed with or without cause by the affirmative vote of entitled tonominate such director. Our amended and restated certificate of incorporation will provide that,in all other cases and at any other time, directors may only be removed for cause by theaffirmative of at least a majority of the voting power of our common stock.
• Supermajority Requirements for Amendments of Our Amended and Restated Certificate ofIncorporation and Amended and Restated Bylaws. Our amended and restated certificate ofincorporation will further provide that the affirmative vote of holders of at least two-thirds of thevoting power of all of the then outstanding shares of voting stock will be required to amendcertain provisions of our amended and restated certificate of incorporation, including provisionsrelating to the classified board, the size of the board, removal of directors, special meetings,actions by written consent, and designation of our preferred stock. The affirmative vote ofholders of at least 66 2/3% of the voting power of all of the then outstanding shares of votingstock will be required to amend or repeal our amended and restated bylaws, although ouramended and restated bylaws may be amended by a simple majority vote of our board ofdirectors.
• Stockholder Action; Special Meeting of Stockholders. Our amended and restated certificate ofincorporation will provide that special meetings of our stockholders may be called only by amajority of our board of directors, the chairman of our board of directors, our lead independentdirector, or our chief executive officer. Our amended and restated certificate of incorporationwill provide that our stockholders may not take action by written consent, but may only takeaction at annual or special meetings of our stockholders. As a result, holders of our capitalstock would not be able to amend our amended and amended and restated bylaws or removedirectors without holding a meeting of our stockholders called in accordance with our restatedbylaws. Further, our amended and restated bylaws will provide that special meetings of ourstockholders may be called only by a majority of our board of directors, the chairman of ourboard of directors, our lead independent director, or our chief executive officer, thus prohibitinga stockholder from calling a special meeting. These provisions might delay the ability of ourstockholders to force consideration of a proposal or for stockholders to take any action,including the removal of directors.
• Advance Notice Requirements for Stockholder Proposals and Director Nominations. Ouramended and restated bylaws will provide advance notice procedures for stockholders seekingto bring business before our annual meeting of stockholders or to nominate candidates forelection as directors at our annual meeting of stockholders. Our amended and restated bylawswill also specify certain requirements regarding the form and content of a stockholder’s notice.These provisions might preclude our stockholders from bringing matters before our annualmeeting of stockholders or from making nominations for directors at our annual meeting ofstockholders if the proper procedures are not followed. We expect that these provisions mightalso discourage or deter a potential acquirer from conducting a solicitation of proxies to electthe acquirer’s own slate of directors or otherwise attempting to obtain control of our company.
• No Cumulative Voting. The DGCL provides that stockholders are not entitled to the right tocumulate votes in the election of directors unless a corporation’s certificate of incorporation
196

provides otherwise. Our amended and restated certificate of incorporation and amended andrestated bylaws will not provide for cumulative voting.
• Issuance of Undesignated Preferred Stock. After the filing of our amended and restatedcertificate of incorporation, our board of directors will have the authority, without further actionby the stockholders, to issue up to 10,000,000 shares of undesignated preferred stock withrights and preferences, including voting rights, designated from time to time by our board ofdirectors. The existence of authorized but unissued shares of preferred stock enables ourboard of directors to render more difficult or to discourage an attempt to obtain control of us bymeans of a merger, tender offer, proxy contest, or other means.
• Choice of Forum. Our amended and restated certificate of incorporation will provide that,unless we consent in writing to the selection of an alternative forum, (A)(i) any derivative actionor proceeding brought on behalf of us, (ii) any action asserting a claim of breach of a fiduciaryduty owed by any of our current or former directors, officers, other employees or stockholdersto us or our stockholders, (iii) any action asserting a claim arising pursuant to any provision ofthe DGCL, our amended and restated certificate of incorporation or amended and restatedbylaws (as either may be amended or restated) or as to which the DGCL confers exclusivejurisdiction on the Court of Chancery of the State of Delaware, or (iv) any action asserting aclaim governed by the internal affairs doctrine of the law of the State of Delaware shall, to thefullest extent permitted by law, be exclusively brought in the Court of Chancery of the State ofDelaware or, if such court does not have subject matter jurisdiction thereof, the federal districtcourt of the State of Delaware, and (B) the federal district courts of the United States shall bethe exclusive forum for the resolution of any complaint asserting a cause of action arising underthe Securities Act. Notwithstanding the foregoing, the exclusive forum provision shall not applyto claims seeking to enforce any liability or duty created by the Exchange Act. Our amendedand restated certificate of incorporation will also provide that, to the fullest extent permitted bylaw, any person or entity purchasing or otherwise acquiring or holding any interest in shares ofour capital stock shall be deemed to have notice of and consented to the foregoing. Byagreeing to this provision, however, stockholders will not be deemed to have waived ourcompliance with the federal securities laws and the rules and regulations thereunder.
Limitations on Liability and Indemnification Matters
Our amended and restated certificate of incorporation, which will become effective upon theclosing of this offering, will provide that we will indemnify each of our directors and executive officers tothe fullest extent permitted by the DGCL. We have entered into indemnification agreements with eachof our directors and executive officers that may, in some cases, be broader than the specificindemnification provisions contained under Delaware law. Further, pursuant to our indemnificationagreements and directors’ and officers’ liability insurance, our directors and executive officers areindemnified and insured against the cost of defense, settlement or payment of a judgment undercertain circumstances. In addition, as permitted by Delaware law, our amended and restated certificateof incorporation will include provisions that eliminate the personal liability of our directors for monetarydamages resulting from breaches of certain fiduciary duties as a director. The effect of this provision isto restrict our rights and the rights of our stockholders in derivative suits to recover monetary damagesagainst a director for breach of fiduciary duties as a director.
These provisions may be held not to be enforceable for violations of the federal securities laws ofthe United States.
197

Transfer Agent and Registrar
Upon the completion of this offering, the transfer agent and registrar for our common stock will beAmerican Stock Transfer & Trust Company, LLC.
Listing
We have applied to list our common stock on the Nasdaq Global Select Market under the symbol“COCO.”
198

DESCRIPTION OF CERTAIN INDEBTEDNESS
Revolving Facility
General
On May 12, 2020, we entered into a senior secured revolving facility, or the Revolving Facilitywith the lenders party thereto and Wells Fargo Bank, National Association, or Wells Fargo, providingfor commitments of up to $50 million. On May 21, 2021, we, and certain of our subsidiaries, asguarantors, entered into an amendment, which provided for an additional $10 million of revolvingcommitments. The Revolving Facility is scheduled to mature on May 21, 2026. There is no scheduledamortization under the Revolving Facility.
The Revolving Facility provides for revolving borrowings of up to $60 million. Borrowings underthe Revolving Facility are subject to the satisfaction of customary conditions, including absence ofdefault and accuracy of representations and warranties.
Interest
Borrowings under the Revolving Facility bear interest at a rate per annum equal to, at our option,either (a) adjusted LIBOR (which shall not be less than 0.0%) plus the applicable rate or (b) base rate(determined by reference to the greatest of the prime rate published by Wells Fargo, the federal fundseffective rate plus 1.5% and one-month LIBOR plus 1.5%). The applicable rate for LIBOR borrowingsunder the Revolving Facility is subject step-downs based on our total net leverage for the immediatelypreceding fiscal quarter in accordance with the following schedule:
PricingLevel Total Net Leverage LIBOR Margin
I Less than or equal to 1.25 to 1.00 1.00%II Greater than 1.25 to 1.00 but less than 2.00 to 1.00 1.25%III Greater than 2.00 to 1.00 but less than 2.50 to 1.00 1.50%IV Greater than 2.50 to 1.00 1.75%
Optional and Mandatory Prepayments
At our option, the Revolving Facility may be prepaid at any time without a premium or penalty withnotice to Wells Fargo. We may also terminate or permanently reduce the unused commitments underthe Revolving Facility, with notice to Wells Fargo. Such termination or reduction must be in a minimumaggregate amount of $500,000. We are required to prepay the Revolving Facility with the proceeds ofcertain equity interests in excess of $5.0 million per issuance and $10 million in total if the Term LoanFacility has been repaid. In addition, we are not permitted to terminate or reduce the commitments ifsuch termination or reduction (and any concurrent prepayments) would cause the total outstandingamount to exceed the amount of the Revolving Facility.
Guarantee and Collateral
Obligations in respect of the Revolving Facility are guaranteed by us and each of our existing, newlyacquired or created wholly-owned domestic subsidiaries. Obligations under the Revolving Facility aresecured by a first priority lien on substantially all of our assets and the assets of each guarantor.
Covenants and Other Matters
The Revolving Facility requires that we comply with a number of covenants, as well as certainfinancial tests. We are required to comply with (i) a total net leverage of not greater than 3.00 to 1.00
199
(which may increase to 3.50 to 1.00 after not more than two material acquisitions), (ii) a fixed chargecoverage ratio of not less than 1.25 to 1.00 and (iii) an asset coverage ratio of not less than 1.25 to 1.00.In addition, we are subject to certain liquidity conditions in connection with making certain earnouts.
Our future compliance with the financial covenants and tests under the Revolving Facility will dependon our ability to maintain sufficient liquidity, generate earnings and manage our assets effectively. TheRevolving Facility also has various non-financial covenants, both requiring us and the guarantors to refrainfrom taking certain future actions (as described above) and requiring us and the guarantors to take certainactions, such as keeping in good standing our corporate existence, maintaining insurance and providing thebank lending group with financial information on a timely basis. The Revolving Facility also contains certaincustomary representations and warranties and events of default, including, among other things, paymentdefaults, breach of representations and warranties, covenant defaults, certain events of bankruptcy,material judgments, change of control, the dissolution of any borrower or guarantor and any materialadverse effect due to COVID-19. If such an event of default occurs, Wells Fargo would be entitled to takevarious actions, including the acceleration of amounts due under the Revolving Facility and all actionspermitted to be taken by a secured creditor.
Term Loan Facility
General
On May 21, 2021, we and certain of our subsidiaries, as guarantors, entered into the Term CommitmentNote, or the Term Facility, with Wells Fargo, providing for term loans of up to $30 million, or the Term Loans.The Term Loan amortizes in quarterly installments of $1,071,428.57 and matures on May 21, 2026.
Interest
The Term Loan bears interest at a rate per annum equal to, at our option, either (a) adjusted LIBORplus the applicable rate or (b) base rate (determined by reference to the greatest of the prime ratepublished by Wells Fargo Bank, National Association, the federal funds effective rate plus 1.5%and one-month LIBOR plus 1.5%). The applicable rate for LIBOR borrowings under the Term LoanFacility is subject step-downs based on our total net leverage for the immediately preceding fiscal quarterin accordance with the following schedule:
PricingLevel Total Net Leverage LIBOR Margin
I Less than or equal to 1.25 to 1.00 1.00%II Greater than 1.25 to 1.00 but less than 2.00 to 1.00 1.25%III Greater than 2.00 to 1.00 but less than 2.50 to 1.00 1.50%IV Greater than 2.50 to 1.00 1.75%
Optional and Mandatory Prepayments
At our option, the Term Loan may be prepaid at any time, in whole or in part, with notice to Wells Fargosubject to LIBOR breakage costs. Such prepayments must be in a minimum aggregate amount of $500,000.
Guarantee and Collateral
Our obligations in respect of the Term Loan Facility are guaranteed by each of our existing and newlyacquired or created wholly-owned domestic restricted subsidiaries. Our obligations under the Term LoanFacility are secured by a first priority lien on substantially all of our assets and the assets of each guarantor.
Covenants and Other Matters
The Term Loan Facility is subject to the same covenants, customary representations andwarranties, events of defaults and remedies as the Revolving Facility described above.
200

SHARES ELIGIBLE FOR FUTURE SALE
Prior to this offering, there has been no public market for our common stock, and a liquid tradingmarket for our common stock may not develop or be sustained after this offering. Sales of substantialamounts of our common stock in the public market after this offering, or the perception that such salescould occur, could adversely affect the trading price of our common stock and may make it moredifficult for you to sell your common stock at a time and price that you deem appropriate.
Upon the completion of this offering, we will have an aggregate of 55,496,125 shares of commonstock outstanding. Of these shares, all of the shares of common stock sold in this offering will be freelytradable without restrictions or further registration under the Securities Act, except for any shares purchasedby our “affiliates,” as that term is defined in Rule 144 under the Securities Act, whose sales would besubject to the Rule 144 resale restrictions described below, other than the holding period requirement.
The remaining 444,503,875 shares of common stock, and shares of common stock underlying RSUs,or subject to stock options will be on issuance, deemed “restricted securities,” as that term is defined inRule 144 under the Securities Act. These restricted securities are eligible for public sale only if they areregistered under the Securities Act or if they qualify for an exemption from registration under Rules 144 or701 under the Securities Act, which are summarized below. We expect that substantially all of these shareswill be subject to the 180-day lock-up period under the lock-up agreements described below.
As a result of the lock-up agreements described below and subject to the provisions of Rule 144or Rule 701, shares will be available for sale in the public market as follows:
• beginning on the date of this prospectus, all of the shares of common stock sold in this offering,which includes 9,000,000 shares of common stock to be sold in this offering by the sellingstockholders, will be immediately available for sale in the public market;
• an additional 105,428 shares of our common stock held by current employees (other than an“officer” of the company (as defined in Rule 16a-1(f) of the Exchange Act) or a member of theboard of directors of the company) will become eligible for sale in the public market beginningon the third trading day following the later of the date we publish our first quarterly or annualfinancial results following the date set forth on this prospectus and 30 days after the date of thisprospectus, provided that the conditions described in “—Lock-Up Agreements and MarketStandoff Provisions” are met;
• an additional 8,757,782 shares of our common stock will become eligible for sale in the publicmarket beginning on the third trading day following the later of the date we publish our firstquarterly or annual financial results following the date set forth on this prospectus and 90 daysafter the date of this prospectus, provided that the conditions described in “—Lock-UpAgreements and Market Standoff Provisions” are met; and
• the remainder of the shares of our common stock subject to lock-up will be eligible for sale inthe public market beginning 180 days after the date of this prospectus.
Lock-Up Arrangements
All of our directors, executive officers, and the holders of substantially all of our outstanding equitysecurities, including the selling stockholders, have agreed, subject to certain exceptions, not to sell ortransfer any common stock or securities convertible into, exchangeable for, exercisable for, orrepayable with common stock, for 180 days after the date of this prospectus without first obtaining theprior written consent of Goldman Sachs & Co. LLC, BofA Securities, Inc., Credit Suisse Securities(USA) LLC and Evercore Group L.L.C. on behalf of the underwriters. Upon the expiration of the lock-upperiod, substantially all of the shares subject to such lock-up restrictions will become eligible for sale,subject to the limitations discussed above. ” The entity affiliated with KDP purchasing shares in theConcurrent Private Placement has also agreed to a lock-up agreement with the underwriters pursuant
201

to which the shares purchased in the Concurrent Private Placement will be locked up for a period of180 days from the date of this prospectus, subject to certain exceptions. See “Prospectus Summary—Concurrent Private Placement” for additional information.
Notwithstanding the foregoing,
(1) if the lock-up party is (i) a current employee (that is an individual) of the company (other thanan “officer” of the company (as defined in Rule 16a-1(f) under the Exchange Act) or a member of theboard of directors of the company) that holds less than 1% of our common stock (an “employee”) or (ii)an immediate family member of an employee (an “employee transferee”), the lock-up Period will expire(the “Early Release”) with respect to a number of shares equal to 15% of the aggregate number ofshares of common stock owned by the employee or employee transferee or issuable upon exercise ofvested equity awards owned by such employee or employee transferee (measured as of the date ofthe Initial Measurement Date (as defined below)) immediately prior to the commencement of trading onthe third trading day following the date that the following conditions are met (the “Initial MeasurementDate”): (A) the later of (1) the date the company publishes its first quarterly or annual financial resultsfollowing this offering and (2) the 30th day following the date of this prospectus (the “Initial ThresholdDate”) and (B) the closing price of our common stock of on the Nasdaq is at least 33% greater than theinitial public offering price of the shares to the public as set forth on the cover of this prospectus (the“IPO Price”) for any 10 out of the 15 consecutive trading days ending on or after the Initial ThresholdDate, including the last day of such 15-day trading period (the “Initial Measurement Period”); and
(2) the lock-up period shall expire (the “Subsequent Early Release”) with respect to a number ofshares equal to 20% of the aggregate number of shares of our common stock owned by the lock-upparties or issuable upon exercise of vested equity awards owned by the lock-up parties (measured asof the date of the Subsequent Measurement Date (as defined below)) immediately prior to thecommencement of trading on the third trading day following the date that the following conditions aremet (the “Subsequent Measurement Date”): (A) the later of (1) the date the company publishes its firstquarterly or annual financial results following this offering and (2) the 90th day following the PublicOffering Date (the “Subsequent Threshold Date”) and (B) the closing price of our common stock on theNasdaq is at least 33% greater than the IPO Price for any 10 out of the 15 consecutive trading daysending on or after the Subsequent Threshold Date, including the last day of such 15-day trading period(the “Subsequent Measurement Period”).
We may, in our discretion, extend the date of the Initial Early Release and Subsequent EarlyRelease, as the case may be, as reasonably needed for administrative processing or to the extentsuch release date would occur during a company blackout period, in which case, we will publiclyannounce the date of the Initial Early Release or Subsequent Early Release, as the case may be,following the close of trading on the date that is at least two trading days prior to the Initial EarlyRelease or Subsequent Early Release, as applicable. See “Underwriting (Conflict of Interest)” for afurther description of these lock-up agreements.
Rule 144
In general, Rule 144 provides that once we have been subject to the public company reportingrequirements of Section 13 or Section 15(d) of the Exchange Act for at least 90 days, a person who isnot deemed to have been one of our affiliates for purposes of the Securities Act at any time during the90 days preceding a sale and who has beneficially owned the shares of our common stock proposed tobe sold for at least six months is entitled to sell those shares without complying with the manner ofsale, volume limitation or notice provisions of Rule 144, subject to compliance with the publicinformation requirements of Rule 144. If such a person has beneficially owned the shares proposed to
202

be sold for at least one year, including the holding period of any prior owner other than our affiliates,then that person would be entitled to sell those shares without complying with any of the requirementsof Rule 144.
In general, Rule 144 provides that our affiliates or persons selling shares of our common stock onbehalf of our affiliates are entitled to sell upon expiration of the lock-up agreements described in thisprospectus, within any three-month period, a number of shares of common stock that does not exceedthe greater of:
• 1% of the number of shares of our common stock then outstanding, which will equalapproximately shares immediately after this offering; or
• the average weekly trading volume of our common stock on the Nasdaq Global Select Marketduring the four calendar weeks preceding the filing of a notice on Form 144 with respect to thesale;
provided, in each case, that we are subject to the Exchange Act periodic reporting requirementsfor at least 90 days before the sale. Such sales made in reliance upon Rule 144 by our affiliates orpersons selling shares on behalf of our affiliates are also subject to certain manner of sale provisionsand notice requirements and to the availability of current public information about us.
Rule 701
Rule 701 generally allows a stockholder who purchased shares of our capital stock pursuant to awritten compensatory plan or contract and who is not deemed to have been an affiliate of our companyduring the immediately preceding 90 days to sell these shares in reliance upon Rule 144, but withoutbeing required to comply with the public information, holding period, volume limitation, or noticeprovisions of Rule 144. Rule 701 also permits affiliates of our company to sell their Rule 701 sharesunder Rule 144 without complying with the holding period requirements of Rule 144. All holders of Rule701 shares, however, are required by that rule to wait until 90 days after the date of this prospectusbefore selling those shares pursuant to Rule 701. Moreover, all Rule 701 shares are subject to lock-upagreements and or market standoff agreements as described above and under the section titled“Underwriting (Conflict of Interest)” and will not become eligible for sale until the expiration of thoseagreements.
Equity Incentive Plans
We intend to file one or more registration statements on Form S-8 under the Securities Act toregister all shares of our common stock issuable or reserved for issuance under our 2014 Plan and2021 Plan. We expect to file the registration statement covering shares offered pursuant to our plansshortly after the date of this prospectus, permitting the resale of such shares by non-affiliates in thepublic market without restriction under the Securities Act and the sale by affiliates in the public market,subject to compliance with the resale provisions of Rule 144.
Registration Rights
In connection with this offering, we expect to grant demand, Form S-3, and piggyback registrationrights to certain of our stockholders to sell our common stock. Registration of the sale of these sharesunder the Securities Act would result in these shares becoming freely tradable without restriction underthe Securities Act immediately upon the effectiveness of the registration, except for shares purchasedby affiliates. See the section titled “Certain Relationships and Related Party Transactions—RegistrationRights Agreement” for additional information.
203

MATERIAL U.S. FEDERAL INCOME TAX CONSIDERATIONS FOR NON-U.S. HOLDERS OF OURCOMMON STOCK
The following discussion is a summary of the material U.S. federal income tax consequences toNon-U.S. Holders (as defined below) of the purchase, ownership and disposition of our common stockissued pursuant to this offering, but does not purport to be a complete analysis of all potential taxeffects. The effects of other U.S. federal tax laws, such as estate and gift tax laws, and any applicablestate, local or non-U.S. tax laws are not discussed. This discussion is based on the U.S. InternalRevenue Code of 1986, as amended, or the Code, Treasury Regulations promulgated thereunder,judicial decisions, and published rulings and administrative pronouncements of the U.S. InternalRevenue Service, or the IRS , in each case in effect as of the date hereof. These authorities maychange or be subject to differing interpretations. Any such change or differing interpretation may beapplied retroactively in a manner that could adversely affect a Non-U.S. Holder. We have not soughtand will not seek any rulings from the IRS regarding the matters discussed below. There can be noassurance the IRS or a court will not take a contrary position to that discussed below regarding the taxconsequences of the purchase, ownership and disposition of our common stock.
This discussion is limited to Non-U.S. Holders that hold our common stock as a “capital asset”within the meaning of Section 1221 of the Code (generally, property held for investment). Thisdiscussion does not address all U.S. federal income tax consequences relevant to a Non-U.S. Holder’sparticular circumstances, including the impact of the Medicare contribution tax on net investmentincome and the alternative minimum tax. In addition, it does not address consequences relevant toNon-U.S. Holders subject to special rules, including, without limitation:
• U.S. expatriates and former citizens or long-term residents of the United States;
• persons holding our common stock as part of a hedge, straddle or other risk reduction strategyor as part of a conversion transaction or other integrated investment;
• banks, insurance companies, and other financial institutions;
• brokers, dealers or traders in securities;
• “controlled foreign corporations,” “passive foreign investment companies,” and corporationsthat accumulate earnings to avoid U.S. federal income tax;
• partnerships or other entities or arrangements treated as partnerships for U.S. federal incometax purposes (and investors therein);
• tax-exempt organizations or governmental organizations;
• persons deemed to sell our common stock under the constructive sale provisions of the Code;
• persons who hold or receive our common stock pursuant to the exercise of any employee stockoption or otherwise as compensation;
• tax-qualified retirement plans; and
• “qualified foreign pension funds” as defined in Section 897(l)(2) of the Code and entities all ofthe interests of which are held by qualified foreign pension funds.
If an entity treated as a partnership for U.S. federal income tax purposes holds our commonstock, the tax treatment of an owner in such an entity will depend on the status of the owner, theactivities of such entity, and certain determinations made at the owner level. Accordingly, entitiestreated as partnerships for U.S. federal income tax purposes holding our common stock and theowners in such entities should consult their tax advisors regarding the U.S. federal income taxconsequences to them.
204

THIS DISCUSSION IS FOR INFORMATIONAL PURPOSES ONLY AND IS NOT TAX ADVICE.INVESTORS SHOULD CONSULT THEIR TAX ADVISORS WITH RESPECT TO THE APPLICATIONOF THE U.S. FEDERAL INCOME TAX LAWS TO THEIR PARTICULAR SITUATIONS AS WELL ASANY TAX CONSEQUENCES OF THE PURCHASE, OWNERSHIP AND DISPOSITION OF OURCOMMON STOCK ARISING UNDER THE U.S. FEDERAL ESTATE OR GIFT TAX LAWS ORUNDER THE LAWS OF ANY STATE, LOCAL OR NON-U.S. TAXING JURISDICTION OR UNDERANY APPLICABLE INCOME TAX TREATY.
Definition of a Non-U.S. Holder
For purposes of this discussion, a “Non-U.S. Holder” is any beneficial owner of our common stockthat is neither a “U.S. person” nor an entity treated as a partnership for U.S. federal income taxpurposes. A U.S. person is any person that, for U.S. federal income tax purposes, is or is treated asany of the following:
• an individual who is a citizen or resident of the United States;
• a corporation created or organized under the laws of the United States, any state thereof, orthe District of Columbia;
• an estate, the income of which is subject to U.S. federal income tax regardless of its source; or
• a trust that (i) is subject to the primary supervision of a U.S. court and the control of one ormore “United States persons” (within the meaning of Section 7701(a)(30) of the Code), or(ii) has a valid election in effect to be treated as a United States person for U.S. federal incometax purposes.
Distributions
As described in the section entitled “Dividend Policy,” we currently intend to retain all availablefunds and future earnings, if any, for the operation and expansion of our business and do not anticipatedeclaring or paying any dividends in the foreseeable future. Any future determination related to ourdividend policy will be made at the discretion of our board of directors after considering our financialcondition, results of operations, capital requirements, contractual requirements, business prospects andother factors the board of directors deems relevant. In addition, the terms of our current credit facilitiescontain restrictions on our ability to declare and pay dividends. However, if we do make distributions ofcash or property on our common stock, such distributions will constitute dividends for U.S. federal incometax purposes to the extent paid from our current or accumulated earnings and profits, as determinedunder U.S. federal income tax principles. Amounts not treated as dividends for U.S. federal income taxpurposes will constitute a return of capital and first be applied against and reduce a Non-U.S. Holder’sadjusted tax basis in its common stock, but not below zero. Any excess will be treated as capital gain andwill be treated as described below under “—Sale or Other Taxable Disposition.”
Subject to the discussion below on effectively connected income, dividends paid to a Non-U.S.Holder will be subject to U.S. federal withholding tax at a rate of 30% of the gross amount of thedividends (or such lower rate specified by an applicable income tax treaty, provided the Non-U.S.Holder furnishes a valid IRS Form W-8BEN or W-8BEN-E (or other applicable documentation)certifying qualification for the lower treaty rate). A Non-U.S. Holder that does not timely furnish therequired documentation, but that qualifies for a reduced treaty rate, may obtain a refund of any excessamounts withheld by timely filing an appropriate claim for refund with the IRS. Non-U.S. Holders shouldconsult their tax advisors regarding their entitlement to benefits under any applicable tax treaties.
If dividends paid to a Non-U.S. Holder are effectively connected with the Non-U.S. Holder’sconduct of a trade or business within the United States (and, if required by an applicable income tax
205
treaty, the Non-U.S. Holder maintains a permanent establishment in the United States to which suchdividends are attributable), the Non-U.S. Holder will be exempt from the U.S. federal withholding taxdescribed above. To claim the exemption, the Non-U.S. Holder must furnish to the applicablewithholding agent a valid IRS Form W-8ECI, certifying that the dividends are effectively connected withthe Non-U.S. Holder’s conduct of a trade or business within the United States.
Any such effectively connected dividends will be subject to U.S. federal income tax on a netincome basis at the regular rates. A Non-U.S. Holder that is a corporation also may be subject to abranch profits tax at a rate of 30% (or such lower rate specified by an applicable income tax treaty) onsuch effectively connected dividends, as adjusted for certain items. Non-U.S. Holders should consulttheir tax advisors regarding any applicable tax treaties that may provide for different rules.
Sale or Other Taxable Disposition
A Non-U.S. Holder will not be subject to U.S. federal income tax on any gain realized upon thesale or other taxable disposition of our common stock unless:
• the gain is effectively connected with the Non-U.S. Holder’s conduct of a trade or businesswithin the United States (and, if required by an applicable income tax treaty, the Non-U.S.Holder maintains a permanent establishment in the United States to which such gain isattributable);
• the Non-U.S. Holder is a nonresident alien individual present in the United States for 183 daysor more during the taxable year of the disposition and certain other requirements are met; or
• our common stock constitutes a U.S. real property interest, or USRPI, by reason of our statusas a U.S. real property holding corporation, or USRPHC, for U.S. federal income tax purposes.
Gain described in the first bullet point above generally will be subject to U.S. federal income taxon a net income basis at the regular rates. A Non-U.S. Holder that is a corporation also may be subjectto a branch profits tax at a rate of 30% (or such lower rate specified by an applicable income tax treaty)on such effectively connected gain, as adjusted for certain items.
A Non-U.S. Holder described in the second bullet point above will be subject to U.S. federalincome tax at a rate of 30% (or such lower rate specified by an applicable income tax treaty) on gainrealized upon the sale or other taxable disposition of our common stock, which may be offset by U.S.source capital losses of the Non-U.S. Holder (even though the individual is not considered a resident ofthe United States), provided the Non-U.S. Holder has timely filed U.S. federal income tax returns withrespect to such losses.
With respect to the third bullet point above, we believe we currently are not, and do not anticipatebecoming, a USRPHC. Because the determination of whether we are a USRPHC depends, however,on the fair market value of our USRPIs relative to the fair market value of our non-U.S. real propertyinterests and our other business assets, there can be no assurance we currently are not a USRPHC orwill not become one in the future. Even if we are or were to become a USRPHC, gain arising from thesale or other taxable disposition of our common stock by a Non-U.S. Holder will not be subject to U.S.federal income tax if our common stock is “regularly traded,” as defined by applicable TreasuryRegulations, on an established securities market, and such Non-U.S. Holder owned, actually andconstructively, 5% or less of our common stock throughout the shorter of the five-year period ending onthe date of the sale or other taxable disposition or the Non-U.S. Holder’s holding period.
Non-U.S. Holders should consult their tax advisors regarding potentially applicable income taxtreaties that may provide for different rules.
206

Information Reporting and Backup Withholding
Payments of dividends on our common stock will not be subject to backup withholding, providedthe applicable withholding agent does not have actual knowledge or reason to know the holder is aUnited States person and the holder either certifies its non-U.S. status, such as by furnishing a validIRS Form W-8BEN, W-8BEN-E, or W-8ECI, or otherwise establishes an exemption. However,information returns are required to be filed with the IRS in connection with any distributions on ourcommon stock paid to the Non-U.S. Holder, regardless of whether such distributions constitutedividends or whether any tax was actually withheld. In addition, proceeds of the sale or other taxabledisposition of our common stock within the United States or conducted through certain U.S.-relatedbrokers generally will not be subject to backup withholding or information reporting if the applicablewithholding agent receives the certification described above and does not have actual knowledge orreason to know that such holder is a United States person or the holder otherwise establishes anexemption. Proceeds of a disposition of our common stock conducted through a non-U.S. office of anon-U.S. broker generally will not be subject to backup withholding or information reporting.
Copies of information returns that are filed with the IRS may also be made available under theprovisions of an applicable treaty or agreement to the tax authorities of the country in which theNon-U.S. Holder resides or is established.
Backup withholding is not an additional tax. Any amounts withheld under the backup withholdingrules may be allowed as a refund or a credit against a Non-U.S. Holder’s U.S. federal income taxliability, provided the required information is timely furnished to the IRS.
Additional Withholding Tax on Payments Made to Foreign Accounts
Withholding taxes may be imposed under Sections 1471 to 1474 of the Code (such Sectionscommonly referred to as the Foreign Account Tax Compliance Act, or FATCA) on certain types ofpayments made to non-U.S. financial institutions and certain other non-U.S. entities. Specifically, a 30%withholding tax may be imposed on dividends on, or (subject to the proposed Treasury Regulationsdiscussed below) gross proceeds from the sale or other disposition of, our common stock paid to a “foreignfinancial institution” or a “non-financial foreign entity” (each as defined in the Code), unless (i) the foreignfinancial institution undertakes certain diligence and reporting obligations, (ii) the non-financial foreign entityeither certifies it does not have any “substantial United States owners” (as defined in the Code) or furnishesidentifying information regarding each substantial United States owner, or (iii) the foreign financial institutionor non-financial foreign entity otherwise qualifies for an exemption from these rules. If the payee is a foreignfinancial institution and is subject to the diligence and reporting requirements in (i) above, it must enter intoan agreement with the U.S. Department of the Treasury requiring, among other things, that it undertake toidentify accounts held by certain “specified United States persons” or “United States owned foreign entities”(each as defined in the Code), annually report certain information about such accounts, and withhold 30%on certain payments to non-compliant foreign financial institutions and certain other account holders.Foreign financial institutions located in jurisdictions that have an intergovernmental agreement with theUnited States governing FATCA may be subject to different rules.
Under the applicable Treasury Regulations and administrative guidance, withholding underFATCA generally applies to payments of dividends on our common stock. While withholding underFATCA would have applied also to payments of gross proceeds from the sale or other disposition ofstock on or after January 1, 2019, proposed Treasury Regulations eliminate FATCA withholding onpayments of gross proceeds entirely. Taxpayers generally may rely on these proposed TreasuryRegulations until final Treasury Regulations are issued.
Prospective investors should consult their tax advisors regarding the potential application ofwithholding under FATCA to their investment in our common stock.
207

UNDERWRITING
The Company, the selling stockholders and the underwriters named below have entered into anunderwriting agreement with respect to the shares being offered. Subject to certain conditions, eachunderwriter has severally agreed to purchase the number of shares indicated in the following table.Goldman Sachs & Co. LLC, BofA Securities, Inc., Credit Suisse Securities (USA) LLC and EvercoreGroup L.L.C. are the representatives of the underwriters.
Underwriters Number of Shares
Goldman Sachs & Co. LLC . . . . . . . . . . . . . . . . . . . . . . . . . . . . . . . . . . . . . . . . . . . . . . . .BofA Securities, Inc. . . . . . . . . . . . . . . . . . . . . . . . . . . . . . . . . . . . . . . . . . . . . . . . . . . . . . .Credit Suisse Securities (USA) LLC . . . . . . . . . . . . . . . . . . . . . . . . . . . . . . . . . . . . . . . . .Evercore Group L.L.C. . . . . . . . . . . . . . . . . . . . . . . . . . . . . . . . . . . . . . . . . . . . . . . . . . . . .Wells Fargo Securities, LLC . . . . . . . . . . . . . . . . . . . . . . . . . . . . . . . . . . . . . . . . . . . . . . .Guggenheim Securities, LLC . . . . . . . . . . . . . . . . . . . . . . . . . . . . . . . . . . . . . . . . . . . . . . .Piper Sandler & Co. . . . . . . . . . . . . . . . . . . . . . . . . . . . . . . . . . . . . . . . . . . . . . . . . . . . . . .William Blair & Company, L.L.C. . . . . . . . . . . . . . . . . . . . . . . . . . . . . . . . . . . . . . . . . . . . .
Total . . . . . . . . . . . . . . . . . . . . . . . . . . . . . . . . . . . . . . . . . . . . . . . . . . . . . . . . . . . . . . . 11,500,000
The underwriters are committed to take and pay for all of the shares being offered, if any aretaken, other than the shares covered by the option described below unless and until this option isexercised.
The underwriters have an option to buy up to an additional 1,725,000 shares from the sellingstockholders to cover sales by the underwriters of a greater number of shares than the total numberset forth in the table above. They may exercise that option for 30 days. If any shares are purchasedpursuant to this option, the underwriters will severally purchase shares in approximately the sameproportion as set forth in the table above.
The following table shows the per share and total underwriting discounts and commissions to bepaid to the underwriters by the Company and the selling stockholders. Such amounts are shownassuming both no exercise and full exercise of the underwriters’ option to purchase up toadditional shares.
Paid by the Company
Per Share . . . . . . . . . . . . . . . . . . . . . . . . . . . . . . . . . . . . . . . . . . . . . . . . . . . . . . . . . . . . . . . . . . . $Total . . . . . . . . . . . . . . . . . . . . . . . . . . . . . . . . . . . . . . . . . . . . . . . . . . . . . . . . . . . . . . . . . . . . . . . $
Paid by the Selling Stockholders
No Exercise Full Exercise
Per Share . . . . . . . . . . . . . . . . . . . . . . . . . . . . . . . . . . . . . . . . . . . . . . . . . . . . . . . $ $Total . . . . . . . . . . . . . . . . . . . . . . . . . . . . . . . . . . . . . . . . . . . . . . . . . . . . . . . . . . . . $ $
Shares sold by the underwriters to the public will initially be offered at the initial public offeringprice set forth on the cover of this prospectus. Any shares sold by the underwriters to securities dealersmay be sold at a discount of up to $ per share from the initial public offering price. After theinitial offering of the shares, the representatives may change the offering price and the other sellingterms. The offering of the shares by the underwriters is subject to receipt and acceptance and subjectto the underwriters’ right to reject any order in whole or in part.
208

The Company and its officers, directors, and holders of substantially all of the Company’scommon stock, including the selling stockholders, have agreed with the underwriters, subject to certainexceptions, not to dispose of or hedge any of their common stock or securities convertible into orexchangeable for shares of common stock during the period from the date of this prospectuscontinuing through the date 180 days after the date of this prospectus, except with the prior writtenconsent of Goldman Sachs & Co. LLC, BofA Securities Inc., Credit Suisse Securities (USA) LLC andEvercore Group L.L.C.
Notwithstanding the foregoing,
(1) if the lock-up party is (i) a current employee (that is an individual) of the company (other thanan “officer” of the company (as defined in Rule 16a-1(f) under the Exchange Act) or a member of theboard of directors of the company) that holds less than 1% of our common stock (an “employee”) or(ii) an immediate family member of an employee (an “employee transferee”), the lock-up Period willexpire (the “Early Release”) with respect to a number of shares equal to 15% of the aggregate numberof shares of common stock owned by the employee or employee transferee or issuable upon exerciseof vested equity awards owned by such employee or employee transferee (measured as of the date ofthe Initial Measurement Date (as defined below)) immediately prior to the commencement of trading onthe third trading day following the date that the following conditions are met (the “Initial MeasurementDate”): (A) the later of (1) the date the company publishes its first quarterly or annual financial resultsfollowing this offering and (2) the 30th day following the date of this prospectus (the “Initial ThresholdDate”) and (B) the closing price of our common stock of on the Nasdaq is at least 33% greater than theinitial public offering price of the shares to the public as set forth on the cover of this prospectus (the“IPO Price”) for any 10 out of the 15 consecutive trading days ending on or after the Initial ThresholdDate, including the last day of such 15-day trading period (the “Initial Measurement Period”); and
(2) the lock-up period shall expire (the “Subsequent Early Release”) with respect to a number ofshares equal to 20% of the aggregate number of shares of our common stock owned by the lock-upparties or issuable upon exercise of vested equity awards owned by the lock-up parties (measured asof the date of the Subsequent Measurement Date (as defined below)) immediately prior to thecommencement of trading on the third trading day following the date that the following conditions aremet (the “Subsequent Measurement Date”): (A) the later of (1) the date the company publishes its firstquarterly or annual financial results following this offering and (2) the 90th day following the PublicOffering Date (the “Subsequent Threshold Date”) and (B) the closing price of our common stock on theNasdaq is at least 33% greater than the IPO Price for any 10 out of the 15 consecutive trading daysending on or after the Subsequent Threshold Date, including the last day of such 15-day trading period(the “Subsequent Measurement Period”).
We may, in our discretion, extend the date of the Initial Early Release and Subsequent EarlyRelease, as the case may be, as reasonably needed for administrative processing or to the extentsuch release date would occur during a company blackout period, in which case, we will publiclyannounce the date of the Initial Early Release or Subsequent Early Release, as the case may be,following the close of trading on the date that is at least two trading days prior to the Initial EarlyRelease or Subsequent Early Release, as applicable.
The restrictions contained in the lock-up agreements between the underwriters and the lock-upparties will not apply, subject in certain cases and various conditions, to certain transactions, including:
(a) any transfers of common stock to the underwriters pursuant to the underwriting agreement;
(b) any shares of common stock acquired by the lock-up party (1) in the open market after thecompletion of this offering or (2) in the offering if the lock-up party is not a director or officerof the company;
209

(c) any of the lock-up parties’ shares transferred as a bona fide gift or gifts, including tocharitable organizations, or for bona fide estate planning purposes, provided that the doneeor donees thereof agree to be bound in writing by the restrictions set forth therein;
(d) any of the lock-up parties’ shares transferred to any beneficiary of the lock-up partypursuant to a will, other testamentary document or intestate succession to the legalrepresentatives, heirs or beneficiary of the lock-up party, provided that the donee or donees,beneficiary or beneficiaries, heir or heirs or legal representatives thereof agree to be boundin writing by the restrictions set forth therein and that any such transfer shall not involve adisposition for value, and provided, further that any filing required under Section 16 of theExchange Act to be made during the lock-up period shall include a statement to the effectthat such transaction reflects the circumstances described in this clause;
(e) transfers to any immediate family member, provided that such immediate family memberagrees to be bound by the restrictions set forth therein, and provided, further that any suchtransfer shall not involve a disposition for value;
(f) any of the lock-up parties’ shares transferred to any trust, partnership, limited liabilitycompany or other entity for the direct or indirect benefit of the lock-up party or the immediatefamily of the lock-up party, or if the lock-up party is a trust, to any beneficiary (including suchbeneficiary’s estate) of the lock-up party, provided that the trustee of the trust or thepartnership, limited liability company or other entity or beneficiary agrees to be bound inwriting by the restrictions set forth therein, and provided, further that any such transfer shallnot involve a disposition for value;
(g) any of the lock-up parties’ shares transferred or disposed of pursuant to an order of a courtor regulatory agency or to comply with any regulations related to the lock-up parties’ownership of the lock-up parties’ shares provided that any filing required under Section 16 ofthe Exchange Act to be made during the lock-up period shall include a statement to theeffect that such transaction reflects the circumstances described in this clause;
(h) transfers by operation of law or pursuant to a qualified domestic order or in connection witha divorce settlement or any related court order, provided that any filing required underSection 16 of the Exchange Act to be made during the lock-up period shall include astatement to the effect that such transaction reflects the circumstances described in thisclause;
(i) any of the lock-up parties’ shares transferred to the company or its affiliates upon death,disability or termination of employment, in each case, of the lock-up party, provided that anyfiling required under Section 16 of the Exchange Act to be made during the lock-up periodshall include a statement to the effect that such transaction reflects the circumstancesdescribed in this clause;
(j) (1) the receipt by the lock-up parties of shares of common stock from the company or othersecurities of the company upon the exercise, vesting or settlement of options, restrictedstock units or other equity awards granted under a stock incentive plan or other equityaward plan, which plan is described in the prospectus and registration statement or warrantsto purchase shares of common stock or securities of the company, insofar as such optionsor warrants are outstanding as of the date of this prospectus and are disclosed in thisprospectus; or (2) the transfer of shares of common stock or other securities of company tothe company upon a vesting or settlement event of the company’s securities or upon theexercise of options to purchase the company’s securities on a “cashless” or “net exercise”basis to the extent permitted by the instruments representing such options (and any transferto the company necessary in respect of such amount needed for the payment of exerciseprice, taxes, including estimated taxes and withholding tax and remittance obligations, due
210

as a result of such vesting, settlement or exercise whether by means of a “net settlement” orotherwise); provided (i) that the shares or other securities received upon vesting, settlement orexercise of the restricted stock unit, option or other equity award are subject to the lock-upagreement, and (ii) that in the case of clauses (1) or (2), any filing required under Section 16 ofthe Exchange Act to be made during the lock-up period shall include a statement to the effectthat such transaction reflects the circumstances described in (1) or (2), as the case may be;
(k) any transfer of the lock-up parties’ shares to the company in connection with the repurchaseof shares of common stock or other securities granted under any stock incentive plan, stockpurchase plan or other equity award plan of the company, which plan is described in theprospectus and registration statement, provided that the underlying shares or othersecurities shall continue to be subject to the restrictions on transfer set forth in the lock-upagreement and provided, further that any filing required under Section 16 of the ExchangeAct to be made during the lock-up period shall include a statement to the effect that suchtransaction reflects the circumstances described in this clause;
(l) to a nominee or custodian of a person or entity to whom a disposition or transfer would bepermissible in connection with the foregoing clauses (c) through (f) as applicable;
(m) the establishment of a trading plan pursuant to Rule 10b5-1 under the Exchange Act;provided that (i) no transfers occur under such plan during such lock-up period and (ii) nopublic announcement or filing under the Exchange Act shall be required or voluntarily madeby or on behalf of the lock-up party or the company regarding the establishment of suchplan during the lock-up period;
(n) transfers, sales, tenders or other dispositions of the lock-up parties’ shares pursuant to a bonafide third-party tender offer, merger, consolidation or other similar transaction involving achange of control of the company that, in each case, has been approved by the company’sboard of directors and made to all holders of the company’s capital stock (including, withoutlimitation, entering into any lock-up, voting or similar agreement pursuant to which the lock-upparty may agree to transfer, sell, tender or otherwise dispose of the lock-up parties’ shares inconnection with any such transaction, or vote any of the lock-up parties’ shares in favor of anysuch transaction), provided that (i) all of the lock-up parties’ shares subject to the lock-upagreement that are not so transferred, sold, tendered or otherwise disposed of remain subjectto the lock-up agreement or (ii) if such tender offer, merger, consolidation or other suchtransaction is not completed, any of the lock-up parties’ shares subject to the lock-upagreement shall remain subject to the restrictions set forth therein;
(o) if the lock-up party is a corporation, partnership, limited liability company, trust or otherbusiness entity, the transfer the lock-up parties’ shares (A) to another corporation,partnership, limited liability company, trust or other business entity that is an affiliate (asdefined in Rule 405 promulgated under the Securities Act) of the lock-up party, or to anyinvestment fund or other entity controlled or managed by the lock-up party or affiliates of thelock-up party, in each case without consideration or (B) as part of a distribution, transfer ordisposition without consideration by the lock-up party to its stockholders, partners,members, beneficiaries or other equity holders; provided, however, that in the case of(A) and (B), it shall be a condition to the transfer that the transferee execute an agreementstating that the transferee is receiving and holding such capital stock subject to theprovisions of the lock-up agreement and there shall be no further transfer of such shares ofcommon stock except in accordance with the lock-up agreement, and provided further thatany such transfer shall not involve a disposition for value;
(p) in the case of Verlinvest Beverages SA, transfers in connection with the Concurrent PrivatePlacement as described under “Prospectus Summary—Concurrent Private Placement”; or
(q) with the prior written consent of the representatives on behalf of the underwriters.
211
provided that in the case of any transfer or distribution pursuant to clause (b) through (f) or (o)above no filing under Section 16 of the Exchange Act, reporting a reduction in beneficial ownership ofthe lock-up parties’ shares, shall be required or voluntarily made during the lock-up period (other thanon Form 5 if such Form 5 is filed after the expiration of the lock-up period) nor shall a publicannouncement be voluntarily made by the lock-up parties or the transferees during the lock-up period.
Prior to the offering, there has been no public market for the shares. The initial public offeringprice has been negotiated among the Company and the representatives. Among the factors to beconsidered in determining the initial public offering price of the shares, in addition to prevailing marketconditions, will be the Company’s historical performance, estimates of the business potential andearnings prospects of the Company, an assessment of the Company’s management and theconsideration of the above factors in relation to market valuation of companies in related businesses.
We currently anticipate that up to 5.0% of the shares of common stock offered hereby will, at ourrequest, be offered to retail investors through Robinhood Financial, LLC, as a selling group member,via its online brokerage platform. Robinhood Financial is not affiliated with the company. Purchasesthrough the Robinhood platform will be subject to the terms, conditions and requirements set byRobinhood. Any purchase of our common stock in this offering through the Robinhood platform will beat the same initial public offering price, and at the same time, as any other purchases in this offering,including purchases by institutions and other large investors. The Robinhood platform and informationon the Robinhood application do not form a part of this prospectus.
We have applied to list our common stock on the Nasdaq Global Select Market under the symbol“COCO.” In order to meet one of the requirements for listing the common stock on the Nasdaq GlobalSelect Market, the underwriters have undertaken to sell lots of 100 or more shares to a minimum of400 beneficial holders.
In connection with the offering, the underwriters may purchase and sell shares of common stockin the open market. These transactions may include short sales, stabilizing transactions and purchasesto cover positions created by short sales. Short sales involve the sale by the underwriters of a greaternumber of shares than they are required to purchase in the offering, and a short position representsthe amount of such sales that have not been covered by subsequent purchases. A “covered shortposition” is a short position that is not greater than the amount of additional shares for which theunderwriters’ option described above may be exercised. The underwriters may cover any coveredshort position by either exercising their option to purchase additional shares or purchasing shares inthe open market. In determining the source of shares to cover the covered short position, theunderwriters will consider, among other things, the price of shares available for purchase in the openmarket as compared to the price at which they may purchase additional shares pursuant to the optiondescribed above. “Naked” short sales are any short sales that create a short position greater than theamount of additional shares for which the option described above may be exercised. The underwritersmust cover any such naked short position by purchasing shares in the open market. A naked shortposition is more likely to be created if the underwriters are concerned that there may be downwardpressure on the price of the common stock in the open market after pricing that could adversely affectinvestors who purchase in the offering. Stabilizing transactions consist of various bids for or purchasesof common stock made by the underwriters in the open market prior to the completion of the offering.
The underwriters may also impose a penalty bid. This occurs when a particular underwriterrepays to the underwriters a portion of the underwriting discount received by it because therepresentatives have repurchased shares sold by or for the account of such underwriter in stabilizing orshort covering transactions.
Purchases to cover a short position and stabilizing transactions, as well as other purchases bythe underwriters for their own accounts, may have the effect of preventing or retarding a decline in the
212

market price of the company’s stock, and together with the imposition of the penalty bid, may stabilize,maintain or otherwise affect the market price of the common stock. As a result, the price of thecommon stock may be higher than the price that otherwise might exist in the open market. Theunderwriters are not required to engage in these activities and may end any of these activities at anytime. These transactions may be effected on the Nasdaq Global Select Market, in the over-the-countermarket or otherwise.
Directed Share Program
At our request, the underwriters have reserved up to 2.0% of the shares of common stock offeredby this prospectus for sale at the initial public offering price through a directed share program to certainindividuals identified by management. Any shares sold under the directed share program will not besubject to the terms of any lock-up agreement, except in the case of shares purchased by any of ourofficers or directors. The number of shares of common stock available for sale to the general public willbe reduced by the number of reserved shares sold to these individuals. Any reserved shares notpurchased by these individuals will be offered by the underwriters to the general public on the samebasis as the other shares of common stock offered under this prospectus. We will agree to indemnifythe underwriters against certain liabilities and expenses, including liabilities under the Securities Act of1933, in connection with sales of the shares reserved for the directed share program. The directedshare program will be arranged through Goldman Sachs & Co. LLC.
Expenses
The Company and the selling stockholders estimate that the total expenses of the offering,excluding underwriting discounts and commissions, will be approximately $4.5 million. The Companyhas agreed to reimburse the underwriters for certain expenses in an amount up to $40,000. Theunderwriters have agreed to reimburse us for certain expenses incurred by us in connection with thisoffering upon the closing of the offering.
The Company has agreed to indemnify the several underwriters against certain liabilities,including liabilities under the Securities Act of 1933.
Conflict of Interest
An affiliate of Wells Fargo Securities, LLC currently holds 100% of our Revolving Facility andTerm Loan Facility and, as such, will receive 5% or more of the net proceeds of this offering due to therepayment of outstanding borrowings and related fees and expenses thereunder. See “Use ofProceeds.” Because of the manner in which the proceeds will be used, the offering will be conducted inaccordance with FINRA Rule 5121. In accordance with that rule, no “qualified independent underwriter”is required because the underwriters primarily responsible for managing this offering are free of anyconflict of interest, as that term is defined in the rule. Additionally, pursuant to FINRA Rule 5121, WellsFargo Securities, LLC will not confirm sales of securities to any account over which they exercisediscretionary authority without the prior written approval of the customer.
Other Relationships
The underwriters and their respective affiliates are full service financial institutions engaged invarious activities, which may include sales and trading, commercial and investment banking, advisory,investment management, investment research, principal investment, hedging, market making,brokerage and other financial and non-financial activities and services. Certain of the underwriters andtheir respective affiliates have provided, and may in the future provide, a variety of these services to
213

the Company and to persons and entities with relationships with the Company, for which they receivedor will receive customary fees and expenses. For example, as described above under “—Conflict ofInterest,” an affiliate of Wells Fargo Securities, LLC hold 100% of our Revolving Facility and Term LoanFacility.
In the ordinary course of their various business activities, the underwriters and their respectiveaffiliates, officers, directors and employees may purchase, sell or hold a broad array of investmentsand actively trade securities, derivatives, loans, commodities, currencies, credit default swaps andother financial instruments for their own account and for the accounts of their customers, and suchinvestment and trading activities may involve or relate to assets, securities and/or instruments of theissuer (directly, as collateral securing other obligations or otherwise) and/or persons and entities withrelationships with the issuer. The underwriters and their respective affiliates may also communicateindependent investment recommendations, market color or trading ideas and/or publish or expressindependent research views in respect of such assets, securities or instruments and may at any timehold, or recommend to clients that they should acquire, long and/or short positions in such assets,securities and instruments.
Selling Restrictions
European Economic Area
In relation to each EEA Member State, each a Relevant Member State, no shares of commonstock have been offered or will be offered pursuant to the offering to the public in that RelevantMember State prior to the publication of a prospectus in relation to the shares which has beenapproved by the competent authority in that Relevant Member State or, where appropriate, approved inanother Relevant Member State and notified to the competent authority in that Relevant Member State,all in accordance with the Prospectus Regulation, except that the shares may be offered to the publicin that Relevant Member State at any time:
(a) to any legal entity which is a qualified investor as defined under Article 2 of the ProspectusRegulation;
(b) to fewer than 150 natural or legal persons (other than qualified investors as defined underArticle 2 of the Prospectus Regulation) subject to obtaining the prior consent of therepresentatives for any such offer; or
(c) in any other circumstances falling within Article 1(4) of the Prospectus Regulation,
provided that no such offer of the shares shall require the company or any underwriter to publish aprospectus pursuant to Article 3 of the Prospectus Regulation or supplement a prospectus pursuant toArticle 23 of the Prospectus Regulation.
For the purposes of this provision, the expression an ‘offer to the public’ in relation to the sharesin any Relevant Member State means the communication in any form and by any means of sufficientinformation on the terms of the offer and any shares to be offered so as to enable an investor to decideto purchase any shares, and the expression “Prospectus Regulation” means Regulation (EU)2017/1129.
Each person in a Relevant Member State who receives any communication in respect of, or whoacquires any shares under, the offering contemplated hereby will be deemed to have represented,warranted and agreed to and with each of the underwriters and their affiliates and the company that:
(a) it is a qualified investor within the meaning of the Prospectus Regulation; and
214

(b) in the case of any shares acquired by it as a financial intermediary, as that term is used inArticle 5 of the Prospectus Regulation, (i) the shares acquired by it in the offering have notbeen acquired on a non-discretionary basis on behalf of, nor have they been acquired with aview to their offer or resale to, persons in any Relevant Member State other than qualifiedinvestors, as that term is defined in the Prospectus Regulation, or have been acquired inother circumstances falling within the points (a) to (d) of Article 1(4) of the ProspectusRegulation and the prior consent of the representatives has been given to the offer orresale; or (ii) where the Shares have been acquired by it on behalf of persons in anyRelevant Member State other than qualified investors, the offer of those shares to it is nottreated under the Prospectus Regulation as having been made to such persons.
The Company, the underwriters and their affiliates, and others will rely upon the truth andaccuracy of the foregoing representation, acknowledgement and agreement. Notwithstanding theabove, a person who is not a qualified investor and who has notified the representatives of such fact inwriting may, with the prior consent of the representatives, be permitted to acquire shares in theoffering.
United Kingdom
This prospectus and any other material in relation to the shares of common stock describedherein is only being distributed to, and is only directed at, and any investment or investment activity towhich this prospectus relates is available only to, and will be engaged in only with persons who are(i) persons having professional experience in matters relating to investments who fall within thedefinition of investment professionals in Article 19(5) of the FPO; or (ii) high net worth entities fallingwithin Article 49(2)(a) to (d) of the FPO; (iii) outside the United Kingdom; or (iv) persons to whom aninvitation or inducement to engage in investment activity (within the meaning of Section 21 of theFSMA) in connection with the issue or sale of any shares may otherwise lawfully be communicated orcaused to be communicated, (all such persons together being referred to as “Relevant Persons”). Theshares are only available in the United Kingdom to, and any invitation, offer or agreement to purchaseor otherwise acquire the Shares will be engaged in only with, the Relevant Persons. This prospectusand its contents are confidential and should not be distributed, published or reproduced (in whole or inpart) or disclosed by recipients to any other person in the United Kingdom. Any person in the UnitedKingdom that is not a Relevant Person should not act or rely on this prospectus or any of its contents.
No shares have been offered or will be offered pursuant to the offering to the public in theUnited Kingdom prior to the publication of a prospectus in relation to the shares which has beenapproved by the Financial Conduct Authority, except that the Shares may be offered to the public in theUnited Kingdom at any time:
(a) to any legal entity which is a qualified investor as defined under Article 2 of the U.K.Prospectus Regulation;
(b) to fewer than 150 natural or legal persons (other than qualified investors as defined underArticle 2 of the U.K. Prospectus Regulation), subject to obtaining the prior consent of theGlobal Coordinators for any such offer; or
(c) in any other circumstances falling within Section 86 of the FSMA.
provided that no such offer of the shares shall require the company and/or any underwriter or any oftheir affiliates to publish a prospectus pursuant to Section 85 of the FSMA or supplement a prospectuspursuant to Article 23 of the U.K. Prospectus Regulation. For the purposes of this provision, theexpression an “offer to the public” in relation to the shares in the United Kingdom means thecommunication in any form and by any means of sufficient information on the terms of the offer and
215

any shares to be offered so as to enable an investor to decide to purchase or subscribe for any Sharesand the expression “U.K. Prospectus Regulation” means Regulation (EU) 2017/1129 as it forms part ofdomestic law by virtue of the European Union (Withdrawal) Act 2018.
Each person in the United Kingdom who acquires any shares in the offer or to whom any offer ismade will be deemed to have represented, acknowledged and agreed to and with the company, theunderwriters and their affiliates that it meets the criteria outlined in this section.
Canada
The securities may be sold in Canada only to purchasers purchasing, or deemed to bepurchasing, as principal that are accredited investors, as defined in National Instrument 45-106Prospectus Exemptions or subsection 73.3(1) of the Securities Act (Ontario), and are permitted clients,as defined in National Instrument 31-103 Registration Requirements, Exemptions, and OngoingRegistrant Obligations. Any resale of the securities must be made in accordance with an exemptionform, or in a transaction not subject to, the prospectus requirements of applicable securities laws.
Securities legislation in certain provinces or territories of Canada may provide a purchaser withremedies for rescission or damages if this offering memorandum (including any amendment thereto)contains a misrepresentation, provided that the remedies for rescission or damages are exercised bythe purchaser within the time limit prescribed by the securities legislation of the purchaser’s province orterritory. The purchaser should refer to any applicable provisions of the securities legislation of thepurchaser’s province or territory of these rights or consult with a legal advisor.
Pursuant to section 3A.3 of National Instrument 33-105 Underwriting Conflicts (NI 33-105), theunderwriters are not required to comply with the disclosure requirements of NI 33-105 regardingunderwriter conflicts of interest in connection with this offering.
Hong Kong
The shares may not be offered or sold in Hong Kong by means of any document other than (i) incircumstances which do not constitute an offer to the public within the meaning of the Companies(Winding Up and Miscellaneous Provisions) Ordinance (Cap. 32 of the Laws of Hong Kong), or theCompanies (Winding Up and Miscellaneous Provisions) Ordinance, or which do not constitute aninvitation to the public within the meaning of the Securities and Futures Ordinance (Cap. 571 of theLaws of Hong Kong), or the Securities and Futures Ordinance, or (ii) to “professional investors” asdefined in the Securities and Futures Ordinance and any rules made thereunder, or (iii) in othercircumstances which do not result in the document being a “prospectus” as defined in the Companies(Winding Up and Miscellaneous Provisions) Ordinance, and no advertisement, invitation or documentrelating to the shares may be issued or may be in the possession of any person for the purpose ofissue (in each case whether in Hong Kong or elsewhere), which is directed at, or the contents of whichare likely to be accessed or read by, the public in Hong Kong (except if permitted to do so under thesecurities laws of Hong Kong) other than with respect to shares which are or are intended to bedisposed of only to persons outside Hong Kong or only to “professional investors” in Hong Kong asdefined in the Securities and Futures Ordinance and any rules made thereunder.
Singapore
This prospectus has not been registered as a prospectus with the Monetary Authority ofSingapore. Accordingly, this prospectus and any other document or material in connection with theoffer or sale, or invitation for subscription or purchase, of the shares may not be circulated ordistributed, nor may the shares be offered or sold, or be made the subject of an invitation forsubscription or purchase, whether directly or indirectly, to persons in Singapore other than (i) to an
216

institutional investor (as defined under Section 4A of the Securities and Futures Act, Chapter 289 ofSingapore, or the SFA) under Section 274 of the SFA, (ii) to a relevant person (as defined inSection 275(2) of the SFA) pursuant to Section 275(1) of the SFA, or any person pursuant toSection 275(1A) of the SFA, and in accordance with the conditions specified in Section 275 of the SFAor (iii) otherwise pursuant to, and in accordance with the conditions of, any other applicable provision ofthe SFA, in each case subject to conditions set forth in the SFA.
Where the shares are subscribed or purchased under Section 275 of the SFA by a relevantperson which is a corporation (which is not an accredited investor (as defined in Section 4A of theSFA)) the sole business of which is to hold investments and the entire share capital of which is ownedby one or more individuals, each of whom is an accredited investor, the securities (as defined inSection 239(1) of the SFA) of that corporation shall not be transferable for 6 months after thatcorporation has acquired the shares under Section 275 of the SFA except: (1) to an institutionalinvestor under Section 274 of the SFA or to a relevant person (as defined in Section 275(2) of theSFA), (2) where such transfer arises from an offer in that corporation’s securities pursuant toSection 275(1A) of the SFA, (3) where no consideration is or will be given for the transfer, (4) wherethe transfer is by operation of law, (5) as specified in Section 276(7) of the SFA, or (6) as specified inRegulation 32 of the Securities and Futures (Offers of Investments) (Shares and Debentures)Regulations 2005 of Singapore, or Regulation 32.
Where the shares are subscribed or purchased under Section 275 of the SFA by a relevantperson which is a trust (where the trustee is not an accredited investor (as defined in Section 4A of theSFA)) whose sole purpose is to hold investments and each beneficiary of the trust is an accreditedinvestor, the beneficiaries’ rights and interest (howsoever described) in that trust shall not betransferable for 6 months after that trust has acquired the shares under Section 275 of the SFA except:(1) to an institutional investor under Section 274 of the SFA or to a relevant person (as defined inSection 275(2) of the SFA), (2) where such transfer arises from an offer that is made on terms thatsuch rights or interest are acquired at a consideration of not less than $200,000 (or its equivalent in aforeign currency) for each transaction (whether such amount is to be paid for in cash or by exchange ofsecurities or other assets), (3) where no consideration is or will be given for the transfer, (4) where thetransfer is by operation of law, (5) as specified in Section 276(7) of the SFA, or (6) as specified inRegulation 32.
Japan
The securities have not been and will not be registered under the Financial Instruments andExchange Act of Japan (Act No. 25 of 1948, as amended), or the FIEA. The securities may not beoffered or sold, directly or indirectly, in Japan or to or for the benefit of any resident of Japan (includingany person resident in Japan or any corporation or other entity organized under the laws of Japan) orto others for reoffering or resale, directly or indirectly, in Japan or to or for the benefit of any resident ofJapan, except pursuant to an exemption from the registration requirements of the FIEA and otherwisein compliance with any relevant laws and regulations of Japan.
217
LEGAL MATTERS
The validity of the shares of common stock offered hereby will be passed upon for us byLatham & Watkins LLP. Weil, Gotshal & Manges LLP has acted as counsel for the underwriters inconnection with certain legal matters related to this offering.
EXPERTS
The consolidated financial statements as of December 31, 2020 and 2019, and for each of thetwo years in the period ended December 31, 2020, included in this Prospectus have been audited byDeloitte & Touche LLP, an independent registered public accounting firm, as stated in their reportappearing herein. Such financial statements have been so included in reliance upon the report of suchfirm given upon their authority as experts in accounting and auditing.
WHERE YOU CAN FIND ADDITIONAL INFORMATION
We have filed with the SEC a registration statement on Form S-1 under the Securities Act withrespect to the shares of our common stock offered hereby. This prospectus, which constitutes a part ofthe registration statement, does not contain all of the information set forth in the registration statementor the exhibits filed therewith. For further information about us and the common stock offered hereby,reference is made to the registration statement and the exhibits filed therewith. Statements containedin this prospectus regarding the contents of any contract or any other document that is filed as anexhibit to the registration statement are not necessarily complete, and in each instance, we refer you tothe copy of such contract or other document filed as an exhibit to the registration statement. The SECmaintains a website that contains reports, proxy, and information statements, and other informationregarding registrants that file electronically with the SEC. The address of the website is www.sec.gov.
As a result of this offering, we will become subject to the information and reporting requirementsof the Exchange Act and, in accordance with this law, will file periodic reports, proxy statements, andother information with the SEC. These periodic reports, proxy statements, and other information will beavailable for inspection and copying at the SEC’s public reference facilities and the website of the SECreferred to above. We also maintain a website at www.thevitacococompany.com. Upon the completionof this offering, you may access these materials free of charge as soon as reasonably practicable afterthey are electronically filed with, or furnished to, the SEC. The inclusion of our website address in thisprospectus is an inactive textual reference only. The information contained in or accessible through ourwebsite is not part of this prospectus or the registration statement of which this prospectus forms apart, and investors should not rely on such information in making a decision to purchase our commonstock in this offering.
218

INDEX TO CONSOLIDATED FINANCIAL STATEMENTS
Audited Consolidated Financial StatementsPage
Report of Independent Registered Public Accounting Firm . . . . . . . . . . . . . . . . . . . . . . . . . . . . . . . . F-2Consolidated Balance Sheets as of December 31, 2020 and 2019 . . . . . . . . . . . . . . . . . . . . . . . . . F-3Consolidated Statements of Operations for the years ended December 31, 2020 and 2019 . . . . F-4Consolidated Statements of Comprehensive Income for the years ended December 31, 2020
and 2019 . . . . . . . . . . . . . . . . . . . . . . . . . . . . . . . . . . . . . . . . . . . . . . . . . . . . . . . . . . . . . . . . . . . . . . F-5Consolidated Statements of Non-Controlling Interests and Stockholders’ Equity for the years
ended December 31, 2020 and 2019 . . . . . . . . . . . . . . . . . . . . . . . . . . . . . . . . . . . . . . . . . . . . . . . F-6Consolidated Statements of Cash Flows for the years ended December 31, 2020 and 2019 . . . . F-7Notes to Consolidated Financial Statements . . . . . . . . . . . . . . . . . . . . . . . . . . . . . . . . . . . . . . . . . . . F-8
Unaudited Condensed Consolidated Financial StatementsPage
Condensed Consolidated Balance Sheet as of June 30, 2021 (unaudited) . . . . . . . . . . . . . . . . . . . F-42Condensed Consolidated Statements of Operations for the six months ended June 30, 2021
and 2020 (unaudited) . . . . . . . . . . . . . . . . . . . . . . . . . . . . . . . . . . . . . . . . . . . . . . . . . . . . . . . . . . . . F-43Condensed Consolidated Statements of Comprehensive Income for the six months ended
June 30, 2021 and 2020 (unaudited) . . . . . . . . . . . . . . . . . . . . . . . . . . . . . . . . . . . . . . . . . . . . . . . F-44Condensed Consolidated Statements of Non-Controlling Interests and Stockholders’ Equity for
the six months ended June 30, 2021 and 2020 (unaudited) . . . . . . . . . . . . . . . . . . . . . . . . . . . . . F-45Condensed Consolidated Statements of Cash Flows for the six months ended June 30, 2021
and 2020 (unaudited) . . . . . . . . . . . . . . . . . . . . . . . . . . . . . . . . . . . . . . . . . . . . . . . . . . . . . . . . . . . . F-47Notes to Condensed Consolidated Financial Statements (unaudited) . . . . . . . . . . . . . . . . . . . . . . . F-48
F-1

REPORT OF INDEPENDENT REGISTERED PUBLIC ACCOUNTING FIRM
To the Board of Directors of The Vita Coco Company, Inc. and Subsidiaries:
Opinion on the Financial Statements
We have audited the accompanying consolidated balance sheets of The Vita Coco Company,Inc. and subsidiaries (formerly known as All Market Inc. (“AMI”)) (the “Company”) as of December 31,2020 and 2019, the related consolidated statements of operations, comprehensive income,non-controlling interests and stockholders’ equity, and cash flows, for each of the two years in theperiod ended December 31, 2020, and the related notes (collectively referred to as the “financialstatements”). In our opinion, the financial statements present fairly, in all material respects, thefinancial position of the Company as of December 31, 2020 and 2019, and the results of its operationsand its cash flows for each of the two years in the period ended December 31, 2020, in conformity withaccounting principles generally accepted in the United States of America.
Basis for Opinion
These financial statements are the responsibility of the Company’s management. Ourresponsibility is to express an opinion on the Company’s financial statements based on our audits. Weare a public accounting firm registered with the Public Company Accounting Oversight Board(United States) (PCAOB) and are required to be independent with respect to the Company inaccordance with the U.S. federal securities laws and the applicable rules and regulations of theSecurities and Exchange Commission and the PCAOB.
We conducted our audits in accordance with the standards of the PCAOB. Those standardsrequire that we plan and perform the audit to obtain reasonable assurance about whether the financialstatements are free of material misstatement, whether due to error or fraud. The Company is notrequired to have, nor were we engaged to perform, an audit of its internal control over financialreporting. As part of our audits, we are required to obtain an understanding of internal control overfinancial reporting but not for the purpose of expressing an opinion on the effectiveness of theCompany’s internal control over financial reporting. Accordingly, we express no such opinion.
Our audits included performing procedures to assess the risks of material misstatement of thefinancial statements, whether due to error or fraud, and performing procedures that respond to thoserisks. Such procedures included examining, on a test basis, evidence regarding the amounts anddisclosures in the financial statements. Our audits also included evaluating the accounting principlesused and significant estimates made by management, as well as evaluating the overall presentation ofthe financial statements. We believe that our audits provide a reasonable basis for our opinion.
/s/ Deloitte & Touche LLP
New York, New YorkJuly 16, 2021 (October 12, 2021 as to the effect of the stock split described in Note 21)
We have served as the Company’s auditor since 2012.
F-2
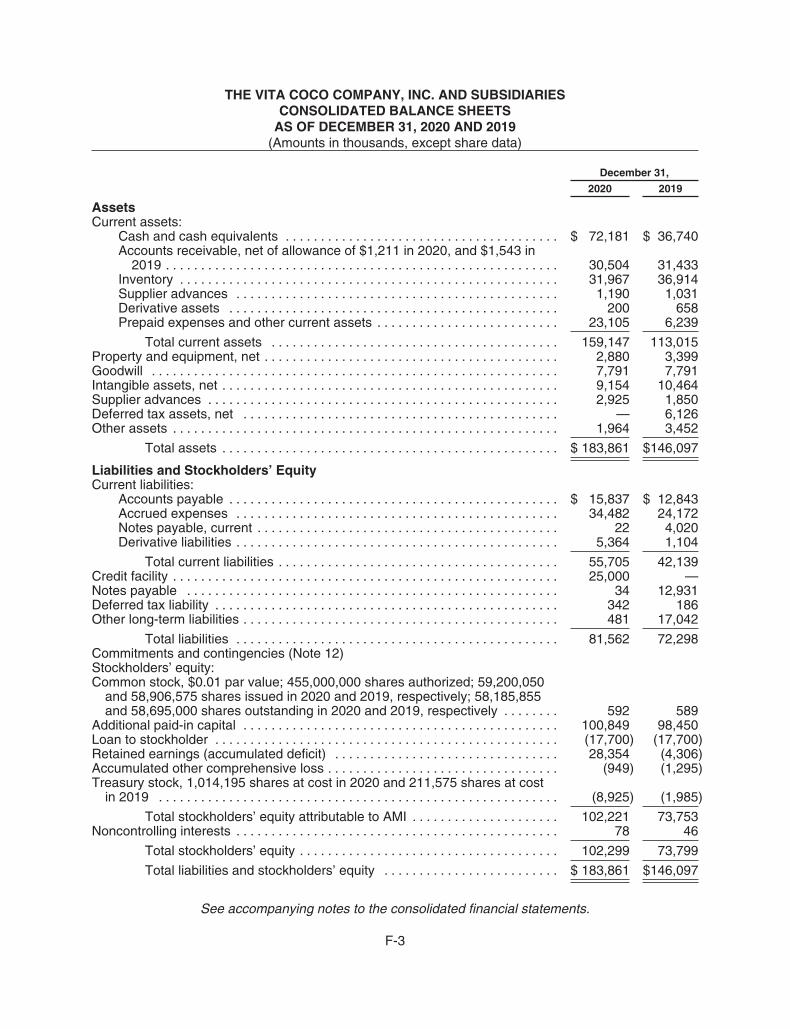
THE VITA COCO COMPANY, INC. AND SUBSIDIARIESCONSOLIDATED BALANCE SHEETS
AS OF DECEMBER 31, 2020 AND 2019(Amounts in thousands, except share data)
December 31,
2020 2019
AssetsCurrent assets:
Cash and cash equivalents . . . . . . . . . . . . . . . . . . . . . . . . . . . . . . . . . . . . . . . $ 72,181 $ 36,740Accounts receivable, net of allowance of $1,211 in 2020, and $1,543 in
2019 . . . . . . . . . . . . . . . . . . . . . . . . . . . . . . . . . . . . . . . . . . . . . . . . . . . . . . . . 30,504 31,433Inventory . . . . . . . . . . . . . . . . . . . . . . . . . . . . . . . . . . . . . . . . . . . . . . . . . . . . . . 31,967 36,914Supplier advances . . . . . . . . . . . . . . . . . . . . . . . . . . . . . . . . . . . . . . . . . . . . . . 1,190 1,031Derivative assets . . . . . . . . . . . . . . . . . . . . . . . . . . . . . . . . . . . . . . . . . . . . . . . 200 658Prepaid expenses and other current assets . . . . . . . . . . . . . . . . . . . . . . . . . . 23,105 6,239
Total current assets . . . . . . . . . . . . . . . . . . . . . . . . . . . . . . . . . . . . . . . . . 159,147 113,015Property and equipment, net . . . . . . . . . . . . . . . . . . . . . . . . . . . . . . . . . . . . . . . . . . 2,880 3,399Goodwill . . . . . . . . . . . . . . . . . . . . . . . . . . . . . . . . . . . . . . . . . . . . . . . . . . . . . . . . . . 7,791 7,791Intangible assets, net . . . . . . . . . . . . . . . . . . . . . . . . . . . . . . . . . . . . . . . . . . . . . . . . 9,154 10,464Supplier advances . . . . . . . . . . . . . . . . . . . . . . . . . . . . . . . . . . . . . . . . . . . . . . . . . . 2,925 1,850Deferred tax assets, net . . . . . . . . . . . . . . . . . . . . . . . . . . . . . . . . . . . . . . . . . . . . . — 6,126Other assets . . . . . . . . . . . . . . . . . . . . . . . . . . . . . . . . . . . . . . . . . . . . . . . . . . . . . . . 1,964 3,452
Total assets . . . . . . . . . . . . . . . . . . . . . . . . . . . . . . . . . . . . . . . . . . . . . . . . $ 183,861 $146,097
Liabilities and Stockholders’ EquityCurrent liabilities:
Accounts payable . . . . . . . . . . . . . . . . . . . . . . . . . . . . . . . . . . . . . . . . . . . . . . . $ 15,837 $ 12,843Accrued expenses . . . . . . . . . . . . . . . . . . . . . . . . . . . . . . . . . . . . . . . . . . . . . . 34,482 24,172Notes payable, current . . . . . . . . . . . . . . . . . . . . . . . . . . . . . . . . . . . . . . . . . . . 22 4,020Derivative liabilities . . . . . . . . . . . . . . . . . . . . . . . . . . . . . . . . . . . . . . . . . . . . . . 5,364 1,104
Total current liabilities . . . . . . . . . . . . . . . . . . . . . . . . . . . . . . . . . . . . . . . . 55,705 42,139Credit facility . . . . . . . . . . . . . . . . . . . . . . . . . . . . . . . . . . . . . . . . . . . . . . . . . . . . . . . 25,000 —Notes payable . . . . . . . . . . . . . . . . . . . . . . . . . . . . . . . . . . . . . . . . . . . . . . . . . . . . . 34 12,931Deferred tax liability . . . . . . . . . . . . . . . . . . . . . . . . . . . . . . . . . . . . . . . . . . . . . . . . . 342 186Other long-term liabilities . . . . . . . . . . . . . . . . . . . . . . . . . . . . . . . . . . . . . . . . . . . . . 481 17,042
Total liabilities . . . . . . . . . . . . . . . . . . . . . . . . . . . . . . . . . . . . . . . . . . . . . . 81,562 72,298Commitments and contingencies (Note 12)Stockholders’ equity:Common stock, $0.01 par value; 455,000,000 shares authorized; 59,200,050
and 58,906,575 shares issued in 2020 and 2019, respectively; 58,185,855and 58,695,000 shares outstanding in 2020 and 2019, respectively . . . . . . . . 592 589
Additional paid-in capital . . . . . . . . . . . . . . . . . . . . . . . . . . . . . . . . . . . . . . . . . . . . . 100,849 98,450Loan to stockholder . . . . . . . . . . . . . . . . . . . . . . . . . . . . . . . . . . . . . . . . . . . . . . . . . (17,700) (17,700)Retained earnings (accumulated deficit) . . . . . . . . . . . . . . . . . . . . . . . . . . . . . . . . 28,354 (4,306)Accumulated other comprehensive loss . . . . . . . . . . . . . . . . . . . . . . . . . . . . . . . . . (949) (1,295)Treasury stock, 1,014,195 shares at cost in 2020 and 211,575 shares at cost
in 2019 . . . . . . . . . . . . . . . . . . . . . . . . . . . . . . . . . . . . . . . . . . . . . . . . . . . . . . . . . (8,925) (1,985)
Total stockholders’ equity attributable to AMI . . . . . . . . . . . . . . . . . . . . . 102,221 73,753Noncontrolling interests . . . . . . . . . . . . . . . . . . . . . . . . . . . . . . . . . . . . . . . . . . . . . . 78 46
Total stockholders’ equity . . . . . . . . . . . . . . . . . . . . . . . . . . . . . . . . . . . . . 102,299 73,799
Total liabilities and stockholders’ equity . . . . . . . . . . . . . . . . . . . . . . . . . $ 183,861 $146,097
See accompanying notes to the consolidated financial statements.
F-3
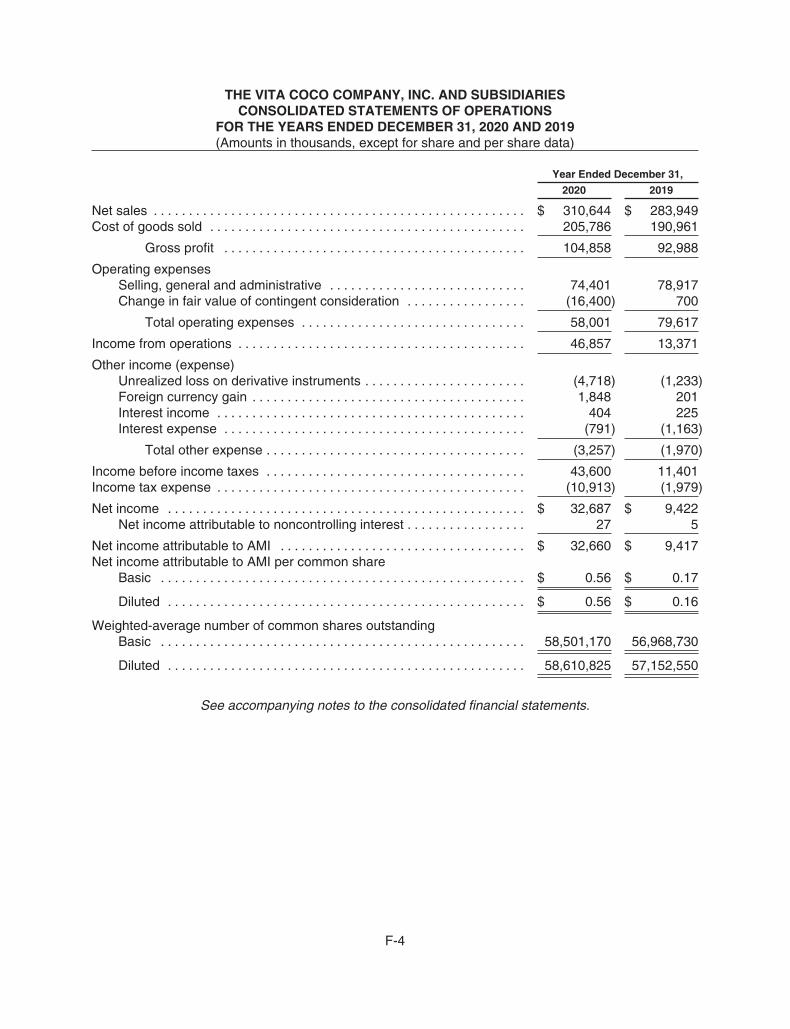
THE VITA COCO COMPANY, INC. AND SUBSIDIARIESCONSOLIDATED STATEMENTS OF OPERATIONS
FOR THE YEARS ENDED DECEMBER 31, 2020 AND 2019(Amounts in thousands, except for share and per share data)
Year Ended December 31,
2020 2019
Net sales . . . . . . . . . . . . . . . . . . . . . . . . . . . . . . . . . . . . . . . . . . . . . . . . . . . . . $ 310,644 $ 283,949Cost of goods sold . . . . . . . . . . . . . . . . . . . . . . . . . . . . . . . . . . . . . . . . . . . . . 205,786 190,961
Gross profit . . . . . . . . . . . . . . . . . . . . . . . . . . . . . . . . . . . . . . . . . . . 104,858 92,988
Operating expensesSelling, general and administrative . . . . . . . . . . . . . . . . . . . . . . . . . . . . 74,401 78,917Change in fair value of contingent consideration . . . . . . . . . . . . . . . . . (16,400) 700
Total operating expenses . . . . . . . . . . . . . . . . . . . . . . . . . . . . . . . . 58,001 79,617
Income from operations . . . . . . . . . . . . . . . . . . . . . . . . . . . . . . . . . . . . . . . . . 46,857 13,371
Other income (expense)Unrealized loss on derivative instruments . . . . . . . . . . . . . . . . . . . . . . . (4,718) (1,233)Foreign currency gain . . . . . . . . . . . . . . . . . . . . . . . . . . . . . . . . . . . . . . . 1,848 201Interest income . . . . . . . . . . . . . . . . . . . . . . . . . . . . . . . . . . . . . . . . . . . . 404 225Interest expense . . . . . . . . . . . . . . . . . . . . . . . . . . . . . . . . . . . . . . . . . . . (791) (1,163)
Total other expense . . . . . . . . . . . . . . . . . . . . . . . . . . . . . . . . . . . . . (3,257) (1,970)
Income before income taxes . . . . . . . . . . . . . . . . . . . . . . . . . . . . . . . . . . . . . 43,600 11,401Income tax expense . . . . . . . . . . . . . . . . . . . . . . . . . . . . . . . . . . . . . . . . . . . . (10,913) (1,979)
Net income . . . . . . . . . . . . . . . . . . . . . . . . . . . . . . . . . . . . . . . . . . . . . . . . . . . $ 32,687 $ 9,422Net income attributable to noncontrolling interest . . . . . . . . . . . . . . . . . 27 5
Net income attributable to AMI . . . . . . . . . . . . . . . . . . . . . . . . . . . . . . . . . . . $ 32,660 $ 9,417Net income attributable to AMI per common share
Basic . . . . . . . . . . . . . . . . . . . . . . . . . . . . . . . . . . . . . . . . . . . . . . . . . . . . $ 0.56 $ 0.17
Diluted . . . . . . . . . . . . . . . . . . . . . . . . . . . . . . . . . . . . . . . . . . . . . . . . . . . $ 0.56 $ 0.16
Weighted-average number of common shares outstandingBasic . . . . . . . . . . . . . . . . . . . . . . . . . . . . . . . . . . . . . . . . . . . . . . . . . . . . 58,501,170 56,968,730
Diluted . . . . . . . . . . . . . . . . . . . . . . . . . . . . . . . . . . . . . . . . . . . . . . . . . . . 58,610,825 57,152,550
See accompanying notes to the consolidated financial statements.
F-4

THE VITA COCO COMPANY, INC. AND SUBSIDIARIESCONSOLIDATED STATEMENTS OF COMPREHENSIVE INCOME
FOR THE YEARS ENDED DECEMBER 31, 2020 AND 2019(Amounts in thousands)
Year Ended December 31,
2020 2019
Net income . . . . . . . . . . . . . . . . . . . . . . . . . . . . . . . . . . . . . . . . . . . . . . . . . . . . . . . . $32,687 $ 9,422Other comprehensive income:
Foreign currency translation adjustment . . . . . . . . . . . . . . . . . . . . . . . . . . . . 346 855
Total comprehensive income including noncontrolling interest . . . . . . . . . . . . . . 33,033 10,277Net income attributable to noncontrolling interest . . . . . . . . . . . . . . . . . . . . . 27 5Foreign currency translation adjustment attributable to noncontrolling
interest . . . . . . . . . . . . . . . . . . . . . . . . . . . . . . . . . . . . . . . . . . . . . . . . . . . . . 5 11
Total comprehensive income attributable to noncontrolling interest . . . . . . . . . . 32 16
Total comprehensive income attributable to AMI . . . . . . . . . . . . . . . . . . . . . . . . . $33,001 $10,261
See accompanying notes to the consolidated financial statements.
F-5
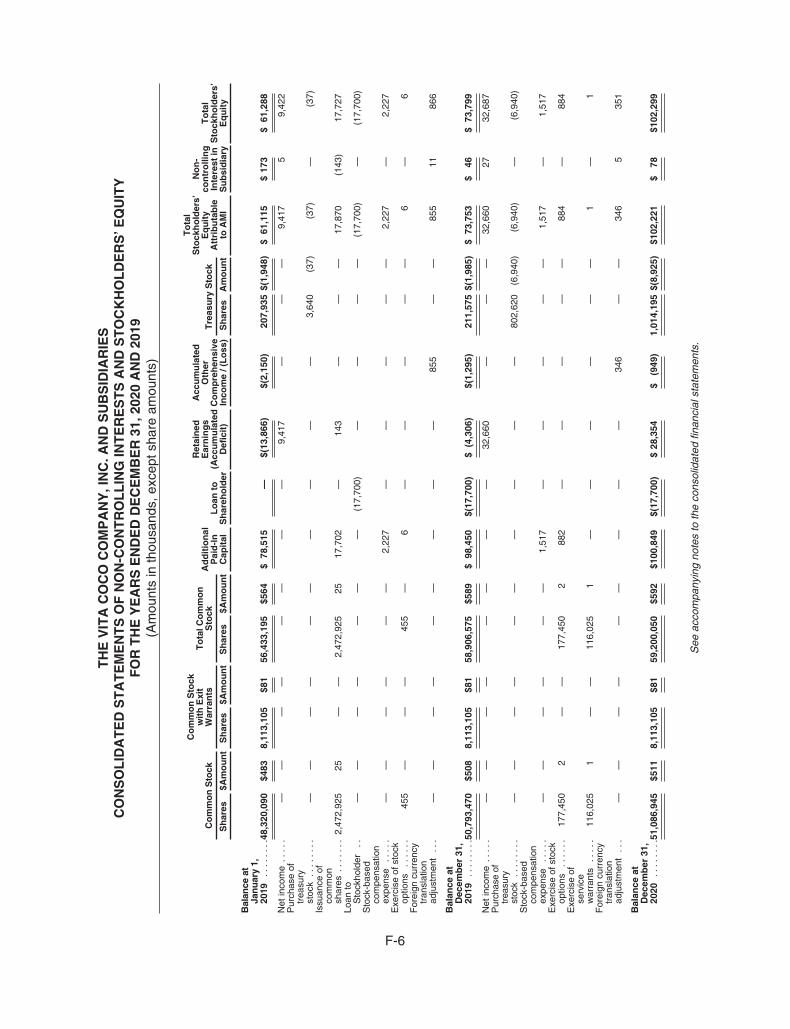
TH
EV
ITA
CO
CO
CO
MP
AN
Y,I
NC
.AN
DS
UB
SID
IAR
IES
CO
NS
OL
IDA
TE
DS
TA
TE
ME
NT
SO
FN
ON
-CO
NT
RO
LL
ING
INT
ER
ES
TS
AN
DS
TO
CK
HO
LD
ER
S’E
QU
ITY
FO
RT
HE
YE
AR
SE
ND
ED
DE
CE
MB
ER
31,2
020
AN
D20
19(A
mou
nts
inth
ousa
nds,
exce
ptsh
are
amou
nts)
Co
mm
on
Sto
ck
Co
mm
on
Sto
ckw
ith
Exi
tW
arra
nts
To
talC
om
mo
nS
tock
Ad
dit
ion
alP
aid
-In
Cap
ital
Lo
anto
Sh
areh
old
er
Ret
ain
edE
arn
ing
s(A
ccu
mu
late
dD
efic
it)
Acc
um
ula
ted
Oth
erC
om
pre
hen
sive
Inco
me
/(L
oss
)
Tre
asu
ryS
tock
To
tal
Sto
ckh
old
ers’
Eq
uit
yA
ttri
bu
tab
leto
AM
I
No
n-
con
tro
llin
gIn
tere
stin
Su
bsi
dia
ry
To
tal
Sto
ckh
old
ers’
Eq
uit
yS
har
es$A
mo
un
tS
har
es$A
mo
un
tS
har
es$A
mo
un
tS
har
esA
mo
un
t
Bal
ance
atJa
nu
ary
1,20
19..
....
..48
,320
,090
$483
8,11
3,10
5$8
156
,433
,195
$564
$78
,515
—$(
13,8
66)
$(2,
150)
207,
935
$(1,
948)
$61
,115
$17
3$
61,2
88
Net
inco
me
....
.—
——
——
——
—9,
417
——
—9,
417
59,
422
Pur
chas
eof
trea
sury
stoc
k..
....
..—
——
——
——
——
—3,
640
(37)
(37)
—(3
7)Is
suan
ceof
com
mon
shar
es..
....
.2,
472,
925
25—
—2,
472,
925
2517
,702
—14
3—
——
17,8
70(1
43)
17,7
27Lo
anto
Sto
ckho
lder
..—
——
——
——
(17,
700)
——
——
(17,
700)
—(1
7,70
0)S
tock
-bas
edco
mpe
nsat
ion
expe
nse
....
.—
——
——
—2,
227
——
——
—2,
227
—2,
227
Exe
rcis
eof
stoc
kop
tions
....
..45
5—
——
455
—6
——
——
—6
—6
For
eign
curr
ency
tran
slat
ion
adju
stm
ent
...
——
——
——
——
—85
5—
—85
511
866
Bal
ance
atD
ecem
ber
31,
2019
....
....
50,7
93,4
70$5
088,
113,
105
$81
58,9
06,5
75$5
89$
98,4
50$(
17,7
00)
$(4
,306
)$(
1,29
5)21
1,57
5$(
1,98
5)$
73,7
53$
46$
73,7
99
Net
inco
me
....
.—
——
——
——
—32
,660
——
—32
,660
2732
,687
Pur
chas
eof
trea
sury
stoc
k..
....
..—
——
——
——
——
—80
2,62
0(6
,940
)(6
,940
)—
(6,9
40)
Sto
ck-b
ased
com
pens
atio
nex
pens
e..
...
——
——
——
1,51
7—
——
——
1,51
7—
1,51
7E
xerc
ise
ofst
ock
optio
ns..
....
177,
450
2—
—17
7,45
02
882
——
——
—88
4—
884
Exe
rcis
eof
serv
ice
war
rant
s..
...
116,
025
1—
—11
6,02
51
——
——
——
1—
1F
orei
gncu
rren
cytr
ansl
atio
nad
just
men
t..
.—
——
——
——
——
346
——
346
535
1
Bal
ance
atD
ecem
ber
31,
2020
....
....
51,0
86,9
45$5
118,
113,
105
$81
59,2
00,0
50$5
92$1
00,8
49$(
17,7
00)
$28
,354
$(9
49)
1,01
4,19
5$(
8,92
5)$1
02,2
21$
78$1
02,2
99
See
acco
mpa
nyin
gno
tes
toth
eco
nsol
idat
edfin
anci
alst
atem
ents
.
F-6
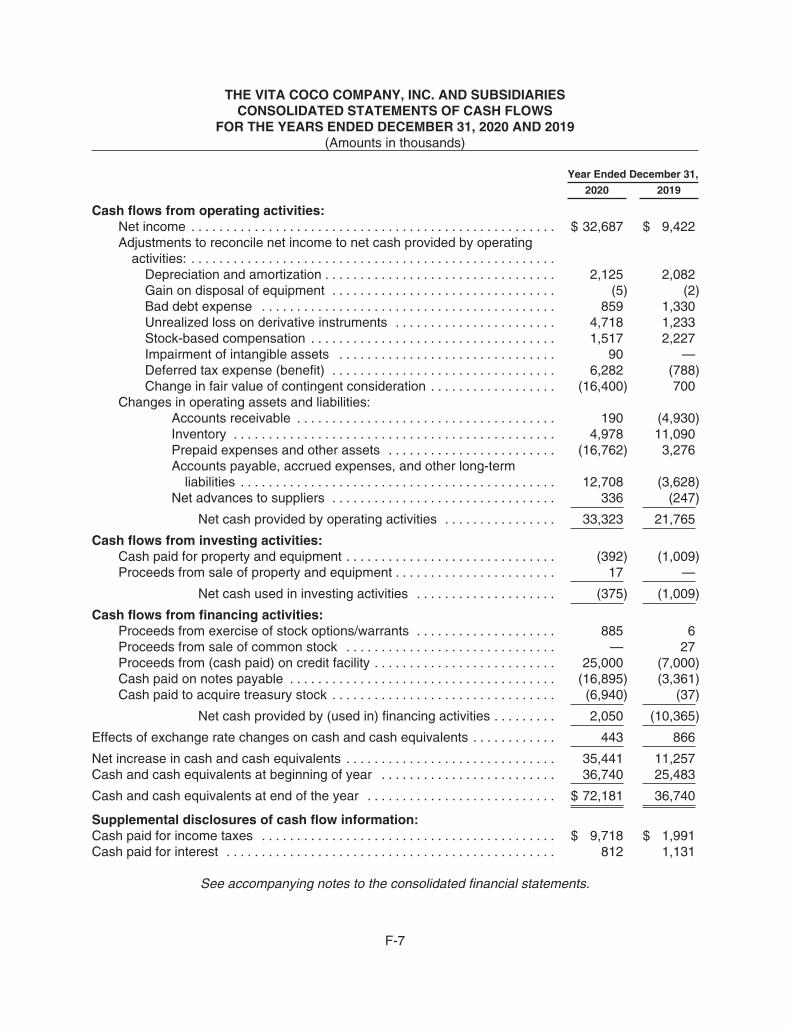
THE VITA COCO COMPANY, INC. AND SUBSIDIARIESCONSOLIDATED STATEMENTS OF CASH FLOWS
FOR THE YEARS ENDED DECEMBER 31, 2020 AND 2019(Amounts in thousands)
Year Ended December 31,
2020 2019
Cash flows from operating activities:Net income . . . . . . . . . . . . . . . . . . . . . . . . . . . . . . . . . . . . . . . . . . . . . . . . . . . . $ 32,687 $ 9,422Adjustments to reconcile net income to net cash provided by operating
activities: . . . . . . . . . . . . . . . . . . . . . . . . . . . . . . . . . . . . . . . . . . . . . . . . . . . .Depreciation and amortization . . . . . . . . . . . . . . . . . . . . . . . . . . . . . . . . . 2,125 2,082Gain on disposal of equipment . . . . . . . . . . . . . . . . . . . . . . . . . . . . . . . . (5) (2)Bad debt expense . . . . . . . . . . . . . . . . . . . . . . . . . . . . . . . . . . . . . . . . . . 859 1,330Unrealized loss on derivative instruments . . . . . . . . . . . . . . . . . . . . . . . 4,718 1,233Stock-based compensation . . . . . . . . . . . . . . . . . . . . . . . . . . . . . . . . . . . 1,517 2,227Impairment of intangible assets . . . . . . . . . . . . . . . . . . . . . . . . . . . . . . . 90 —Deferred tax expense (benefit) . . . . . . . . . . . . . . . . . . . . . . . . . . . . . . . . 6,282 (788)Change in fair value of contingent consideration . . . . . . . . . . . . . . . . . . (16,400) 700
Changes in operating assets and liabilities:Accounts receivable . . . . . . . . . . . . . . . . . . . . . . . . . . . . . . . . . . . . . 190 (4,930)Inventory . . . . . . . . . . . . . . . . . . . . . . . . . . . . . . . . . . . . . . . . . . . . . . 4,978 11,090Prepaid expenses and other assets . . . . . . . . . . . . . . . . . . . . . . . . (16,762) 3,276Accounts payable, accrued expenses, and other long-term
liabilities . . . . . . . . . . . . . . . . . . . . . . . . . . . . . . . . . . . . . . . . . . . . . 12,708 (3,628)Net advances to suppliers . . . . . . . . . . . . . . . . . . . . . . . . . . . . . . . . 336 (247)
Net cash provided by operating activities . . . . . . . . . . . . . . . . 33,323 21,765
Cash flows from investing activities:Cash paid for property and equipment . . . . . . . . . . . . . . . . . . . . . . . . . . . . . . (392) (1,009)Proceeds from sale of property and equipment . . . . . . . . . . . . . . . . . . . . . . . 17 —
Net cash used in investing activities . . . . . . . . . . . . . . . . . . . . (375) (1,009)
Cash flows from financing activities:Proceeds from exercise of stock options/warrants . . . . . . . . . . . . . . . . . . . . 885 6Proceeds from sale of common stock . . . . . . . . . . . . . . . . . . . . . . . . . . . . . . — 27Proceeds from (cash paid) on credit facility . . . . . . . . . . . . . . . . . . . . . . . . . . 25,000 (7,000)Cash paid on notes payable . . . . . . . . . . . . . . . . . . . . . . . . . . . . . . . . . . . . . . (16,895) (3,361)Cash paid to acquire treasury stock . . . . . . . . . . . . . . . . . . . . . . . . . . . . . . . . (6,940) (37)
Net cash provided by (used in) financing activities . . . . . . . . . 2,050 (10,365)
Effects of exchange rate changes on cash and cash equivalents . . . . . . . . . . . . 443 866
Net increase in cash and cash equivalents . . . . . . . . . . . . . . . . . . . . . . . . . . . . . . 35,441 11,257Cash and cash equivalents at beginning of year . . . . . . . . . . . . . . . . . . . . . . . . . 36,740 25,483
Cash and cash equivalents at end of the year . . . . . . . . . . . . . . . . . . . . . . . . . . . $ 72,181 36,740
Supplemental disclosures of cash flow information:Cash paid for income taxes . . . . . . . . . . . . . . . . . . . . . . . . . . . . . . . . . . . . . . . . . . $ 9,718 $ 1,991Cash paid for interest . . . . . . . . . . . . . . . . . . . . . . . . . . . . . . . . . . . . . . . . . . . . . . . 812 1,131
See accompanying notes to the consolidated financial statements.
F-7

THE VITA COCO COMPANY, INC. AND SUBSIDIARIESNOTES TO CONSOLIDATED FINANCIAL STATEMENTS
FOR THE YEARS ENDED DECEMBER 31, 2020 AND 2019(Amounts in thousands)
1. NATURE OF BUSINESS AND BASIS OF PRESENTATION
The Vita Coco Company, Inc. and subsidiaries (formerly known as All Market Inc. (“AMI”)) (the“Company”) develops, markets, and distributes various coconut water products under the brand nameVita Coco and for retailers own brands, predominantly in the United States. Other products includecoconut oil, coconut milk, coconut as a commodity, natural energy drink (under the brand name, Runa)and water (under the brand name, Ever & Ever).
The Company was incorporated in Delaware January 17th, 2007. In 2018, the Companypurchased certain assets and liabilities of Runa, which is marketed and distributed primarily in theUnited States.
The Company has nine wholly-owned subsidiaries including four wholly-owned Asian subsidiariesestablished between fiscal 2012 and 2015, one North American subsidiary established in 2015, as wellas majority ownership in All Market Europe, Ltd. (AME) in the United Kingdom. AME was established infiscal 2009 and has 100% ownership in two European subsidiaries established in 2015. Thenoncontrolling interest in AME represents minority stockholders’ proportionate share (1.3%) of theequity in AME. The noncontrolling interest is presented in the equity section of the Company’sconsolidated balance sheets. One of the wholly-owned Asian subsidiaries, All Market Singapore PteLtd (AMS), has 100% ownership in one subsidiary, established in 2018 in Ecuador.
Basis of Presentation
The accompanying consolidated financial statements are presented in accordance withaccounting principles generally accepted in the United States of America (“U.S. GAAP”).
Stock Split and Authorized Shares
On October 11, 2021, the Company’s Board of Directors and stockholders approved an amendedand restated certificate of incorporation of the Company effecting a 455-for-1 stock split of theCompany’s issued and outstanding shares of common stock, and an increase to the authorized sharesof our common stock to 500,000,000 shares. The split was effected on October 11, 2021 and withoutany change in the par value per share. All information related to the Company’s common stock andstock awards has been retrospectively adjusted to give effect to the 455-for-1 stock split, without anychange in the par value per share.
Principles of Consolidation
The consolidated financial statements include all the accounts of the wholly owned subsidiaries.All intercompany accounts and transactions have been eliminated in consolidation; the noncontrollinginterest in consolidated subsidiaries presented in the accompanying consolidated financial statementsrepresents the portion of AME stockholders’ equity, which is not directly owned by the Company.
Impact of the Covid-19 Pandemic
On March 11, 2020, the World Health Organization declared the recent novel coronavirus(“COVID-19”) outbreak a pandemic. In response to the outbreak many jurisdictions, including those inwhich the Company has locations, have implemented measures to combat the outbreak, such as travelrestrictions and shelter in place orders. The global spread and unprecedented impact of COVID-19continues to create significant volatility, uncertainty and economic disruption.
F-8

THE VITA COCO COMPANY, INC. AND SUBSIDIARIESNOTES TO CONSOLIDATED FINANCIAL STATEMENTS
FOR THE YEARS ENDED DECEMBER 31, 2020 AND 2019(Amounts in thousands)
The COVID-19 pandemic has caused general business disruption worldwide beginning inJanuary 2020. The full extent to which the COVID-19 pandemic will directly or indirectly impact theCompany’s cash flow, business, financial condition, results of operations and prospects will depend onfuture developments, including the duration, spread and intensity of the pandemic (including anyresurgences), impact of the new COVID-19 variants and the rollout of COVID-19 vaccines, and thelevel of social and economic restrictions imposed in the United States and abroad in an effort to curbthe spread of the virus, all of which are uncertain and difficult to predict considering the rapidly evolvinglandscape. The Company has experienced some impacts on inventory availability and deliverycapacity since the outbreak which have impacted, at times, the Company’s ability to fully service itscustomers, including temporary facility shutdowns, local transportation interruptions, and generalpressure on global shipping lines. The Company has taken measures to bolster key aspects of itssupply chain and the Company continues to work with its supply chain partners to try to ensure itsability to service its customers. Although not a material impact in the years ended December 31, 2020and 2019, the Company has also seen significant cost inflation to global shipping costs and someinflationary pressures on other cost elements, only some of which have been covered by pricingactions to date. The Company is continuing to monitor the situation carefully to understand any futurepotential impact on its people and business. The Company is taking all necessary steps to protect itspeople and mitigate any risk to its business. As a result, it is not currently possible to ascertain theoverall impact of COVID-19 on the Company’s business, results of operations, financial condition orliquidity. Future events and effects related to COVID-19 cannot be determined with precision andactual results could significantly differ from estimates or forecasts.
2. SUMMARY OF SIGNIFICANT ACCOUNTING POLICIES
Use of Estimates
Preparation of consolidated financial statements in conformity with U.S. GAAP requiresmanagement to make estimates and assumptions that affect the reported amounts of assets andliabilities and disclosure of contingent assets and liabilities at the date of the consolidated financialstatements and the reported amounts of revenues and expenses during the reporting period.Management considers many factors in selecting appropriate financial accounting policies and controlsin developing the estimates and assumptions that are used in the preparation of these consolidatedfinancial statements. Management must apply significant judgement in this process. In addition, otherfactors may affect estimates, including expected business and operational changes, sensitivity andvolatility associated with the assumptions used in developing estimates, and whether historical trendsare expected to be representative of future trends. The estimation process often may yield a range ofreasonable estimates of the ultimate future outcomes, and management must select an amount thatfalls within that range of reasonable estimates. The most significant estimates in the consolidatedfinancial statements relate to share-based compensation, assessing long-lived assets for impairment,estimating the net realizable value of inventories, the determination of accounts receivables reserve,assessing goodwill for impairment, the determination of the value of trade promotions and assessingthe realizability of deferred income taxes. Actual results could differ from those estimates.
Revenue Recognition
The Company recognizes revenue in accordance with ASC Topic 606, Revenue from Contractswith Customers (ASC 606). ASC 606 defines a five-step model that requires entities exercise judgmentwhen considering the terms of contract(s), which include (1) identifying the contract or agreement witha customer, (2) identifying the performance obligations in the contract or agreement, (3) determining
F-9

THE VITA COCO COMPANY, INC. AND SUBSIDIARIESNOTES TO CONSOLIDATED FINANCIAL STATEMENTS
FOR THE YEARS ENDED DECEMBER 31, 2020 AND 2019(Amounts in thousands)
the transaction price, (4) allocating the transaction price to the separate performance obligations, and(5) recognizing revenue as each performance obligation is satisfied. Revenue is recognized whencontrol of the promised good is transferred to the customer in an amount that reflects the considerationto which the Company is expected to be entitled to receive in exchange for those products. Eachcontract includes a single performance obligation to transfer control of the product to the customer.
For the Company’s various products in the Vita Coco Coconut Water and Other productcategories (refer to Note 3, Revenue Recognition), control is transferred upon customer receipt, atwhich point the Company recognizes the transaction price for the product as revenue. The transactionprice recognized reflects the consideration the Company expects to receive in exchange for the sale ofthe product. The Company’s performance obligations are satisfied at that time. The Company does nothave any significant contracts with customers requiring performance beyond delivery, and contractswith customers contain no incentives or discounts that would meet the criteria for a distinct good orservice that could cause revenue to be allocated or adjusted over time. Shipping and handling activitiesare performed before the customer obtains control of the goods and therefore represent fulfillmentcosts, which are included in cost of goods sold, rather than a revenue.
Additionally, the Company determined the production and distribution of private label productsrepresents a distinct performance obligation. Since there is no alternative use for these products andthe Company has the right to payment for performance completed to date, the Company recognizesthe revenue for the production of these private label products over time as the production for openpurchase orders is completed, which may be prior to any shipment. The resulting contract assets arerecorded in Prepaid expenses and other current assets.
The Company provides trade promotions to its customers. These discounts do not meet thecriteria for a distinct good or service and therefore, the Company reduces revenue for the discountsassociated with meeting this obligation based on the expected value method. These consolidatedfinancial statements include trade promotion accruals. Trade promotion accruals are made for invoicesthat have not yet been received as of year-end and are recorded as a reduction of sales. Thispromotion accrual is a management estimate based upon the known price of retail promotions andestimates of the sales volume during the promotion period.
Cost of Goods Sold
Costs of goods sold includes the costs of the products sold to customers, inbound and outboundshipping and handling costs, freight and duties, shipping and packaging supplies, and warehousefulfillment costs incurred in operating and staffing warehouses.
Shipping and Handling Costs
Shipping and handling costs related the sale of inventory are included in cost of goods sold in theconsolidated statement of operations. Shipping and handling costs were $7,353 and $7,928 for theyears ended December 31, 2020 and 2019, respectively.
Advertising Expenses
Advertising expenses are charged to expense in the period they are incurred and are recorded inselling, general and administrative expenses. Advertising expenses were $12,862 and $16,571 for theyears ended December 31, 2020 and 2019, respectively.
F-10

THE VITA COCO COMPANY, INC. AND SUBSIDIARIESNOTES TO CONSOLIDATED FINANCIAL STATEMENTS
FOR THE YEARS ENDED DECEMBER 31, 2020 AND 2019(Amounts in thousands)
Research and Development
Research and development costs are charged to expense in the period incurred and are recordedin selling, general and administrative expenses. Research and development expenses were $313 and$642 for the years ended December 31, 2020 and 2019, respectively.
Stock-Based Compensation
The Company accounts for stock-based compensation in accordance with ASC Topic 718,Compensation — Stock Compensation (ASC 718) for stock options issued under the 2014 StockOption and Restricted Stock Plan.
The Company measures all stock option awards based on their fair value on the date of the grantand recognizes compensation expense for those awards over the requisite service period of eachstock-option grant, which is generally the vesting period of the respective award by using theaccelerated attribution method. The Company applies an estimated forfeiture rate derived fromhistorical employee termination behavior. If the actual forfeitures differ from those estimated bymanagement, adjustment to compensation expense may be required in future periods. The Companyissues stock-based awards with service-based and performance-based and market-based vestingconditions. The Company recognizes expense for performance-based awards when it becomesprobable that such awards will be earned over a requisite service period. The Company defers therecognition of compensation expense for the stock-option awards that vest upon a qualifying liquidityevents until the qualifying events are probable of occurrence. Stock option awards are equity-classified, as they do not contain a cash settlement option or other features requiring them to beliability-classified.
The Company uses the Black-Scholes-Merton (“Black-Scholes”) option-pricing model todetermine the fair value of stock awards with service-based vesting conditions and performance-basedvesting conditions. For stock awards with performance-based and market-based vesting conditions,the Company uses the Barrier option valuation model to determine the fair value.
The Company has classified stock-based compensation expense in its consolidated statementsof operations in selling, general, and administrative expenses, reflecting the same manner in which theaward recipient’s payroll costs are classified or in which the award recipient’s service payments areclassified. See Note 15, Stockholders’ Equity, for further information.
Income Taxes
The Company accounts for income taxes under Accounting Standards Codification (ASC) 740,Income Taxes, which requires an asset and liability approach to financial accounting and reporting forincome taxes. Deferred income tax assets and liabilities are computed annually for differencesbetween the consolidated financial statements and tax bases of assets and liabilities that will result intaxable or deductible amounts in the future. Such deferred income tax assets and liabilitiescomputations are based on enacted tax laws and rates applicable to periods in which the differencesare expected to affect taxable income. Valuation allowances are established when necessary to reducedeferred income tax assets to the amount expected to be realized. Interest and penalties related tounrecognized tax positions are included in income tax expense in the consolidated statement ofoperations and comprehensive income and accrued expenses in the consolidated balance sheets. TheCompany recognizes the effect of income tax positions only if those positions are more likely than not
F-11

THE VITA COCO COMPANY, INC. AND SUBSIDIARIESNOTES TO CONSOLIDATED FINANCIAL STATEMENTS
FOR THE YEARS ENDED DECEMBER 31, 2020 AND 2019(Amounts in thousands)
of being sustained. Recognized income tax positions are measured at the largest amount that isgreater than 50% likely of being realized. Changes in recognition or measurement are reflected in theperiod in which the change in judgment occurs.
Net Income per Common Share
In accordance with ASC Topic 260 Earnings Per Share (ASC 260), net income per commonshare, on a basic and diluted basis, is presented for all periods, calculated using the treasury stockmethod. Basic net income per share is computed by dividing net income by the weighted averagenumber of common shares and service warrants outstanding during each period. Diluted net incomeper share is computed by dividing net income by the weighted average number of common and dilutivecommon equivalent shares outstanding. The calculation of common equivalent shares assumes theexercise of dilutive in-the-money stock options, net of assumed treasury share repurchases at averagemarket prices, as applicable.
Cash and Cash Equivalents
Cash and cash equivalents include cash on hand and money market instruments with maturitiesof three months or less.
Accounts Receivable
Accounts receivable are reported net of an allowance for doubtful accounts. In determining suchan allowance, the Company considers historical losses and existing economic conditions, as well asthe credit quality of each customer. Accounts receivable are charged off when the Company deemsamounts to be uncollectible.
Inventory
Inventory represents raw materials, finished goods, packaging, and shipping and handling and isreported at the lower of cost or net realizable value being determined using the first-in, first-out method.Net realizable value is the estimated selling price in the ordinary course of business, less reasonablypredictable costs of completion, disposal and transportation. The Company reserves for finished goodsthat are close to the date of expiration.
Deferred Offering Costs
The Company capitalizes certain legal, professional accounting and other third-party fees that aredirectly associated with in-process equity financings as deferred offering costs until such financings areconsummated. After consummation of an equity financing, these costs are recorded in stockholders’equity as a reduction of additional paid-in capital generated as a result of the offering. If an in-processequity financing is abandoned, the deferred offering costs will be expensed immediately as a charge tooperating expenses in the consolidated statements of operations. As of December 31, 2020 and 2019,the Company did not record any deferred offering costs in the consolidated balance sheets.
Property and Equipment
Property and equipment, are stated at cost and are depreciated over the estimated useful lives ofthe related assets or in the case of leasehold improvements, the lease term if shorter, using thestraight-line method of depreciation. Repairs and maintenance are charged to expense as incurred.The estimated useful lives of the Company’s property and equipment are as follows:
• Equipment and computer software and hardware – 3-7 years
F-12
THE VITA COCO COMPANY, INC. AND SUBSIDIARIESNOTES TO CONSOLIDATED FINANCIAL STATEMENTS
FOR THE YEARS ENDED DECEMBER 31, 2020 AND 2019(Amounts in thousands)
• Leasehold improvements – The lesser of the life of the asset or the term of the lease
• Vehicles – 5 years
• Furniture and fixtures – 3-5 years
Impairment of Long-Lived Assets
The Company evaluates the recoverability of its long-lived assets, principally intangibles andproperty and equipment, by comparing asset group’s carrying value to the expected undiscountedfuture cash flows to be generated from such assets when events or circumstances indicate that animpairment may have occurred. If the estimated undiscounted future cash flows are less than thecarrying amount, an impairment loss is recorded based upon the difference between the carryingamount and the fair value of the asset.
Acquisitions
The Company evaluates each of its acquisitions under the accounting framework in AccountingStandards Codification (“ASC”) Topic 805, Business Combinations (ASC 805). ASC 805 requires thereporting entity to identify the acquirer, determine the acquisition date, recognize and measure theidentifiable tangible and intangible assets acquired, the liabilities assumed and any non-controllinginterest in the acquired entity, and recognize and measure goodwill or a gain from the purchase. Theacquiree’s results are included in the consolidated financial statements from the date of the acquisition.The Company allocated the purchase price, including the fair value of any non-cash and contingentconsideration, to the identifiable assets and liabilities of the relevant acquired business at theiracquisition date fair values. Any excess consideration over the fair value of assets acquired andliabilities assumed is recognized as goodwill.
Contingent consideration payable in cash or a fixed dollar amount settleable in a variable numberof shares is classified as a liability and recorded at fair value, with changes in fair value recorded as acomponent of operating expenses in the accompanying consolidated statements of operations.Transaction costs associated with business combinations are expensed as incurred and are includedin selling, general and administrative expense in the consolidated statements of operations.
The Company performs valuations of assets acquired, liabilities assumed, and contingentconsideration and allocate the purchase price to its respective assets and liabilities. Determining thefair value of assets acquired, liabilities assumed, and contingent consideration requires the use ofsignificant judgment and estimates including the selection of valuation methodologies, estimates offuture revenue, costs and cash flows, discount rates, the probability of the achievement of specifiedmilestones, and selection of comparable companies. The Company engages the assistance ofvaluation specialists in concluding on fair value measurements in connection with determining fairvalues of assets acquired, liabilities assumed, and contingent consideration in a business combination.
Intangible assets
Intangible assets consist primarily of acquired trade names and distributor relationships. TheCompany determines the appropriate useful life of the intangible assets by performing an analysis ofexpected cash flows of the acquired assets. Intangible assets are amortized over their estimated usefullives of ten years, using the straight-line method, which approximates the pattern in which theeconomic benefits are consumed.
F-13
THE VITA COCO COMPANY, INC. AND SUBSIDIARIESNOTES TO CONSOLIDATED FINANCIAL STATEMENTS
FOR THE YEARS ENDED DECEMBER 31, 2020 AND 2019(Amounts in thousands)
Goodwill
Goodwill represents the excess of the purchase price over the fair value of net assets acquired ina business combination and is measured in accordance with the provisions of ASC 350, Intangibles –Goodwill and Other (ASC 350). Goodwill is not amortized; instead goodwill is tested for impairment onan annual basis on December 31, or more frequently if the Company believes indicators of impairmentexist.
The Company has determined that there are three reporting units for purposes of testing goodwillfor impairment: (i) the Americas reporting unit, (ii) the Europe reporting unit, and (iii) the Asia reportingunit. All of the Company’s goodwill is allocated to the Americas reporting unit. The Company firstassesses qualitative factors to determine whether it is more-likely-than-not that the fair value of areporting unit is less than its carrying value. In performing the qualitative assessment, the Companyreviews factors both specific to the reporting units and to the Company as a whole, such as financialperformance, macroeconomic conditions, industry and market considerations, and the fair value ofeach reporting unit at the last valuation date. If the Company elects this option and believes, as a resultof the qualitative assessment, that it is more likely than not that the carrying value of each of thereporting units exceeds their fair value, the quantitative impairment test is required; otherwise, nofurther testing is required.
Alternatively, the Company may elect to bypass the qualitative assessment and perform thequantitative impairment test instead, or if the Company reasonably determines that it is more-likely-than-not that the fair value is less than the carrying value, the Company performs its annual, or interim,goodwill impairment test by comparing the fair value of each of the reporting units with their carryingamount. The fair value of each of the reporting units is estimated by blending the results from theincome approach and the market multiples approach. These valuation approaches consider a numberof factors that include, but are not limited to, expected future cash flows, growth rates, discount rates,and comparable multiples from publicly-traded companies in the Company’s industry, and require tomake certain assumptions and estimates regarding industry economic factors and future profitability ofthe Company’s business. It is the Company’s policy to conduct impairment testing based on its mostcurrent business plans, projected future revenues and cash flows, which reflect changes anticipated inthe economy and the industry. The cash flows are based on five-year financial forecasts developedinternally by management and are discounted to a present value using discount rates that properlyaccount for the risk and nature of the respective reporting unit’s cash flows and the rates of returnmarket participants would require to invest their capital in the Company’s reporting unit. The Companywill recognize an impairment for the amount by which the carrying amount exceeds a reporting unit’sfair value. For the years ended December 31, 2020 and 2019 there were no impairments recorded.
Supplier Advances
The Company issues advances to certain manufacturers with interest at rates between 0% and4% with terms extending to November 2024. These advances are assessed for collectability and anallowance for credit losses is recognized when it is probable that the Company will be unable to collectall amounts due according to the contractual terms. An allowance of $384 was recorded as ofDecember 31, 2020 and no allowance was recorded as of December 31, 2019.
F-14

THE VITA COCO COMPANY, INC. AND SUBSIDIARIESNOTES TO CONSOLIDATED FINANCIAL STATEMENTS
FOR THE YEARS ENDED DECEMBER 31, 2020 AND 2019(Amounts in thousands)
Foreign Currency
The Company’s reporting currency is the U.S. dollar. The Company maintains the financialstatements of each entity within the group in its local currency, which is also the entity’s functionalcurrency. Gains and losses on transactions denominated in currencies other than the functionalcurrency are included in determining net income for the period. All assets and liabilities denominated ina foreign currency are translated into U.S. dollars at the exchange rate on the balance sheet date.Revenue and expenses are translated at the average exchange rate applicable during the period.Translation gains and losses are included as a component of accumulated other comprehensiveincome in stockholders’ equity.
Transaction gains and losses that arise from exchange rate fluctuations on transactionsdenominated in a currency other than the functional currency are included as a component of otherincome (expense) in the accompanying consolidated statements of operations when incurred.
Derivative Instruments
The Company periodically enters into forward foreign currency exchange contracts to hedge itsforeign currency exposure. The fair value of these contracts is recorded in the consolidated balancesheets with a corresponding adjustment to the consolidated statements of operations for the change infair value of the derivative instruments, as the contracts have not been designated as a hedgeinstrument. Refer to Note 13, Derivative Instruments, for more information.
Segment Information
The Company operates as two operating and reportable segments: (i) Americas segment, whichis comprised of the Company’s operations in the Americas region, primarily in the U.S. and Canada,and (ii) International segment, which is comprised of the Company’s operations primarily in Europe,Middle East, and the Asia Pacific regions.
The Company’s Co-Chief Executive Officers (“Co-CEOs”), as the chief operating decision makers(CODM), manage and allocate resources between the Americas and International segments.Consistent with this decision-making process, the Co-CEOs use financial information disaggregatedbetween the Americas and International segment for purposes of evaluating performance, forecastingfuture period financial results, allocating resources and setting incentive targets. The Co-CEOsevaluate segment business performance based primarily on net sales and gross profit.
Concentration of Credit Risk
The Company’s cash and accounts receivable are subject to concentrations of credit risk. TheCompany’s cash balances are primarily on deposit with banks in the U.S. which are guaranteed by theFederal Deposit Insurance Corporation (FDIC) up to $250. At times, such cash may be in excess of theFDIC insurance limit. To minimize the risk, the Company’s policy is to maintain cash balances with highquality financial institutions and any excess cash above a certain minimum balance could be investedin overnight money market treasury deposits in widely diversified accounts. Substantially, all of theCompany’s customers are either wholesalers or retailers of beverages. A material default in payment,a material reduction in purchase from these or any large customers, or the loss of a large customer or
F-15

THE VITA COCO COMPANY, INC. AND SUBSIDIARIESNOTES TO CONSOLIDATED FINANCIAL STATEMENTS
FOR THE YEARS ENDED DECEMBER 31, 2020 AND 2019(Amounts in thousands)
customer groups could have a material adverse impact on the Company’s financial condition, results ofoperations, and liquidity. The Company is exposed to concentration of credit risk from its majorcustomers for which two customers represented 54% and 63% of total net sales during the yearsended December 31, 2020 and 2019, respectively. In addition, the two customers also accounted for38% and 37% of total accounts receivable as of December 31, 2020 and 2019, respectively. TheCompany has not experienced credit issues with these customers.
Recently Adopted Accounting Pronouncements
In May 2014, the FASB issued ASU No. 2014-09, Revenue from Contracts with Customers(Topic 606), and several amendments, codified as ASC 606, which supersedes the revenuerecognition guidance in ASC Topic 605. ASC 606, among other provisions, (i) is based on the principlethat revenue should depict the transfer of control of goods or services to customers in an amount thatreflects the consideration to which the entity expects to be entitled in exchange for those goods orservices, and (ii) requires additional disclosure about the nature, amount, timing and uncertainty ofrevenue and cash flows arising from customer contracts, including significant judgments.
The Company adopted ASC 606 and the related updates on January 1, 2019, for the year endedDecember 31, 2020. Implementation followed the modified retrospective method, which applies thenew guidance to contracts not completed as of the date of adoption. The cumulative effect of initialapplication of the new standard did not result in any material changes, and therefore, no adjustmentwas made to the opening balance of retained earnings. Prior year comparative information has notbeen restated and continues to be reported under the accounting standards in effect for those periods.The Company did not identify material changes to the consolidated financial statements for the periodof ASC 606 adoption, and there were no significant policy changes impacting the timing ormeasurement of revenue. The Company has updated its accounting policies to ensure ongoingcompliance with ASC 606.
In January 2017, the FASB issued Accounting Standards Update (“ASU”) 2017-04 – Intangibles –Goodwill and Other (Topic 350): Simplifying the Test for Goodwill Impairment (“ASU 2017-04”). Thisupdate removes Step 2 of the goodwill impairment test under current guidance, which requires ahypothetical purchase price allocation. The new guidance requires an impairment charge to berecognized for the amount by which the carrying amount exceeds the reporting unit’s fair value. Uponadoption, the guidance is to be applied prospectively. The amendments in ASU 2017-04 are effectivefor fiscal years beginning after December 15, 2019, with early adoption permitted for interim or annualgoodwill impairment test performed on testing dates after January 1, 2017. The Company adoptedASU 2017-04 on January 1, 2020. The adoption of ASU 2017-04 did not have a material impact on theconsolidated financial statements.
In June 2018, the FASB issued ASU 2018-07, Improvements to nonemployee share-basedpayment accounting (“ASU 2018-07”), that expands the scope of Topic 718 to include stock-basedpayments issued to nonemployees for goods and services, which are currently accounted for underTopic 505. The ASU specifies that Topic 718 will apply to all stock-based payment transactions inwhich a grantor acquires goods or services to be used or consumed in the grantor’s own operations inexchange for stock-based payment awards. The amendments in ASU 2018-07 are effective for fiscalyears beginning after December 15, 2019. The Company adopted the guidance in this amendmenteffective January 1, 2020. Upon transition, the Company remeasured equity-classified awards for
F-16

THE VITA COCO COMPANY, INC. AND SUBSIDIARIESNOTES TO CONSOLIDATED FINANCIAL STATEMENTS
FOR THE YEARS ENDED DECEMBER 31, 2020 AND 2019(Amounts in thousands)
which a measurement date had not been established. The adoption of ASU 2018-07 did not have amaterial impact on the consolidated financial statements.
In August 2018, the FASB issued ASU 2018-13, Changes to the disclosure requirements for fairvalue measurement, that modify the disclosure requirements on fair value measurements in Topic 820,based on the concepts in FASB Concepts Statement, Conceptual Framework for Financial Reporting—Chapter 8: Notes to Financial Statements, including the consideration of costs and benefits. Theamendments in this ASU are effective for fiscal years beginning after December 15, 2019. TheCompany adopted the guidance in this amendment effective January 1, 2020. The adoption of ASU2018-13 resulted in changes in disclosures but did not have an impact on the consolidated financialstatements.
Recently Issued Accounting Pronouncements
As a company with less than $1.07 billion of revenue during the last fiscal year, the Companyqualifies as an “emerging growth company”, as defined in the Jumpstart Our Business Startups Act.This classification allows the Company to delay adoption of new or revised accountingpronouncements applicable to public companies until such pronouncements are made applicable toprivate companies. The Company has elected to use the adoption dates applicable to privatecompanies. As a result, the Company’s financial statements may not be comparable to the financialstatements of issuers who are required to comply with the effective date for new or revised accountingstandards that are applicable to public companies.
In December 2019, the FASB issued ASU 2019-12, Income Taxes (Topic 740), (“ASU 2019-12”)that simplify the accounting for income taxes by removing certain exceptions for recognizing deferredtaxes for investments, performing intra-period allocation and calculating incomes taxes in interimperiods. ASU 2019-12 also adds guidance to reduce complexity in certain areas, including recognizingdeferred taxes for tax goodwill and allocating taxes to members of consolidated group. ASU 2019-2 iseffective for fiscal years beginning after December 15, 2021. The Company is assessing the impact ofadoption on the consolidated financial statements.
In August 2018, the FASB issued ASU 2018-15, Intangibles—Goodwill and Other—Internal UseSoftware (Subtopic 350-40): Customer’s accounting for implementation costs incurred in a cloudcomputing arrangement that is a service contract, (“ASU 2018-15”), which changes the accountingguidance for cloud computing arrangements. If a cloud computing arrangement includes a license tointernal-use software, then the software license is accounted for by the customer by recognizing anintangible asset for the software license and, to the extent that the payments attributable to thesoftware license are made over time, recognizing a corresponding liability. If a cloud computingarrangement does not include a software license, the entity should account for the arrangement as aservice contract and should expense any fees associated with the hosting element (service) of thearrangement as incurred. The guidance in ASU 2018-15 is effective for fiscal years beginning afterDecember 15, 2020, with early adoption permitted. The Company is assessing the impact of adoptionon the consolidated financial statements.
In June 2016, the FASB issued ASU 2016-13 Financial Instruments—Credit Losses (Topic 326):Measurement of Credit Losses on Financial Instruments (“ASU 2016-13”), to replace the currentincurred loss impairment methodology for financial assets measured at amortized cost with a
F-17

THE VITA COCO COMPANY, INC. AND SUBSIDIARIESNOTES TO CONSOLIDATED FINANCIAL STATEMENTS
FOR THE YEARS ENDED DECEMBER 31, 2020 AND 2019(Amounts in thousands)
methodology that reflects expected credit losses and requires consideration of a broader range ofreasonable and supportable information, including forecasted information, to develop credit lossestimates. ASU 2016-13 is effective for fiscal years beginning after December 15, 2022, includinginterim periods with those fiscal years, for nonpublic entities. Early adoption is permitted. This standardwill be effective for the Company in the first quarter of its fiscal year ending December 31, 2023. TheCompany is assessing the impact of adoption on the consolidated financial statements.
In February 2016, the FASB issued ASU 2016-02 Leases (Topic 842) (“ASU 2016-02”). In July2018, the FASB issued Accounting Standards Update 2018-11 Leases (Topic 842): TargetedImprovements (“ASU 2018-11”), which contains certain amendments to ASU 2016-02 intended toprovide relief in implementing the new standard. The new standard establishes a right-of-use (“ROU”)model that requires a lessee to record a ROU asset and a lease liability on the balance sheet for alloperating leases, with an exception provided for leases with a duration of one year or less. Further,incremental disclosures will be required around the amount, timing, and uncertainty of cash flowsarising from leases. ASU 2016-02 is effective for fiscal years beginning after December 15, 2021 fornonpublic entities. Early adoption is permitted. Entities are required to use a modified retrospectiveapproach of adoption for leases that exist or are entered into after the beginning of the earliestcomparative period in the consolidated financial statements. The Company will adopt ASU 2016-02beginning on January 1, 2022. The Company is assessing the impact of adoption on the consolidatedfinancial statements.
3. REVENUE RECOGNITION
Revenues are accounted for in accordance with ASC 606. The Company disaggregates revenueinto the following product categories:
• Vita Coco Coconut Water – This product category consists of all branded coconut waterproduct offerings under the Vita Coco labels, where the majority ingredient is coconut water.The Company determined that the sale of the products represents a distinct performanceobligation as customers can benefit from purchasing the products on their own or together withother resources that are readily available to the customers. For these products, control istransferred upon customer receipt, at which point the Company recognizes the transactionprice for the product as revenue.
• Private Label – This product category consists of all private label product offerings, whichincludes coconut water and oil. The Company determined the production and distribution ofprivate label products represents a distinct performance obligation. Since there is no alternativeuse for these products and the Company has the right to payment for performance completedto date, the Company recognizes the revenue for the production of these private label productsover time as the production for open purchase orders occurs, which may be prior to anyshipment.
• Other – This product category consists of all other products, which includes Runa and Ever &Ever product offerings, Vita Coco product extensions beyond coconut water, such as Vita CocoSparkling, coconut milk products, and other revenue transactions (e.g., bulk product sales). Forthese products, control is transferred upon customer receipt, at which point the Companyrecognizes the transaction price for the product as revenue.
F-18

THE VITA COCO COMPANY, INC. AND SUBSIDIARIESNOTES TO CONSOLIDATED FINANCIAL STATEMENTS
FOR THE YEARS ENDED DECEMBER 31, 2020 AND 2019(Amounts in thousands)
The Company excludes from revenues all taxes assessed by a governmental authority that areimposed on the sale of its products and collected from customers.
Disaggregation of Revenue
The following table disaggregates net revenue by product type and reportable segment:
December 31, 2020
Americas International Consolidated
Vita Coco Coconut Water . . . . . . . . . . . . . . . . . . . . . . . . . . . . . . . . $164,786 $27,167 $191,953Private Label . . . . . . . . . . . . . . . . . . . . . . . . . . . . . . . . . . . . . . . . . . 83,449 12,596 96,045Other . . . . . . . . . . . . . . . . . . . . . . . . . . . . . . . . . . . . . . . . . . . . . . . . . 14,664 7,982 22,646
Total . . . . . . . . . . . . . . . . . . . . . . . . . . . . . . . . . . . . . . . . . . . . . . . . . $262,899 $47,745 $310,644
December 31, 2019
Americas International Consolidated
Vita Coco Coconut Water . . . . . . . . . . . . . . . . . . . . . . . . . . . . . . . . $151,045 $31,742 $182,787Private Label . . . . . . . . . . . . . . . . . . . . . . . . . . . . . . . . . . . . . . . . . . 71,774 10,903 82,677Other . . . . . . . . . . . . . . . . . . . . . . . . . . . . . . . . . . . . . . . . . . . . . . . . . 14,596 3,889 18,485
Total . . . . . . . . . . . . . . . . . . . . . . . . . . . . . . . . . . . . . . . . . . . . . . . . . $237,415 $46,534 $283,949
4. ACCOUNTS RECEIVABLE, NET
Accounts receivable, net was $30,504 and $31,433 as of December 31, 2020 and 2019,respectively. The Company recorded an allowance for doubtful accounts of $1,211 and $1,543 as ofDecember 31, 2020 and 2019, respectively.
Changes in the allowance for doubtful accounts for the periods presented were as follows:
Balance as of January 1, 2019 . . . . . . . . . . . . . . . . . . . . . . . . . . . . . . . . . . . . . . . . . . . . . . . . . . . . $ 1,256
Provisions charged to operating results . . . . . . . . . . . . . . . . . . . . . . . . . . . . . . . . . . . . . . . . . 1,330Account write-offs and other deductions . . . . . . . . . . . . . . . . . . . . . . . . . . . . . . . . . . . . . . . . (1,043)
Balance as of December 31, 2019 . . . . . . . . . . . . . . . . . . . . . . . . . . . . . . . . . . . . . . . . . . . . . . . . . $ 1,543Provisions charged to operating results . . . . . . . . . . . . . . . . . . . . . . . . . . . . . . . . . . . . . . . . . 475Account write-offs and other deductions . . . . . . . . . . . . . . . . . . . . . . . . . . . . . . . . . . . . . . . . (807)
Balance as of December 31, 2020 . . . . . . . . . . . . . . . . . . . . . . . . . . . . . . . . . . . . . . . . . . . . . . . . . $ 1,211
F-19

THE VITA COCO COMPANY, INC. AND SUBSIDIARIESNOTES TO CONSOLIDATED FINANCIAL STATEMENTS
FOR THE YEARS ENDED DECEMBER 31, 2020 AND 2019(Amounts in thousands)
5. INVENTORY
Inventory consists of the following:
December 31,
2020 2019
Raw materials and packaging . . . . . . . . . . . . . . . . . . . . . . . . . . . . . . . . . . . . . . . . . . . $ 2,771 $ 5,551Finished goods . . . . . . . . . . . . . . . . . . . . . . . . . . . . . . . . . . . . . . . . . . . . . . . . . . . . . . . 29,196 31,363
Inventory . . . . . . . . . . . . . . . . . . . . . . . . . . . . . . . . . . . . . . . . . . . . . . . . . . . . . . . . . . . . $31,967 $36,914
6. PREPAID EXPENSES AND OTHER CURRENT ASSETS
Prepaid expenses and other current assets consist of the following:
December 31,
2020 2019
Tax receivables . . . . . . . . . . . . . . . . . . . . . . . . . . . . . . . . . . . . . . . . . . . . . . . . . . . . . . . . $ 6,920 $ 779Prepaid marketing . . . . . . . . . . . . . . . . . . . . . . . . . . . . . . . . . . . . . . . . . . . . . . . . . . . . . . 3,902 884Contract assets . . . . . . . . . . . . . . . . . . . . . . . . . . . . . . . . . . . . . . . . . . . . . . . . . . . . . . . . 2,128 —VAT receivables . . . . . . . . . . . . . . . . . . . . . . . . . . . . . . . . . . . . . . . . . . . . . . . . . . . . . . . 2,106 1,346Other prepaid expenses . . . . . . . . . . . . . . . . . . . . . . . . . . . . . . . . . . . . . . . . . . . . . . . . . 4,974 2,380Other receivables . . . . . . . . . . . . . . . . . . . . . . . . . . . . . . . . . . . . . . . . . . . . . . . . . . . . . . 3,075 850
$23,105 $6,239
7. PROPERTY AND EQUIPMENT, NET
Property and equipment, net consist of the following:
December 31,
2020 2019
Equipment and computer software and hardware . . . . . . . . . . . . . . . . . . . . . . . . . . . . $ 4,930 $ 4,612Leasehold improvements . . . . . . . . . . . . . . . . . . . . . . . . . . . . . . . . . . . . . . . . . . . . . . . . 818 880Vehicles . . . . . . . . . . . . . . . . . . . . . . . . . . . . . . . . . . . . . . . . . . . . . . . . . . . . . . . . . . . . . . 774 930Land and improvements . . . . . . . . . . . . . . . . . . . . . . . . . . . . . . . . . . . . . . . . . . . . . . . . . 506 506Furniture and fixtures . . . . . . . . . . . . . . . . . . . . . . . . . . . . . . . . . . . . . . . . . . . . . . . . . . . 370 359
Total Property and equipment . . . . . . . . . . . . . . . . . . . . . . . . . . . . . . . . . . . . . . . . 7,398 7,287
Less accumulated depreciation and amortization . . . . . . . . . . . . . . . . . . . . . . . . . . . . . (4,518) (3,888)
Property and equipment—net . . . . . . . . . . . . . . . . . . . . . . . . . . . . . . . . . . . . . . . . . . . . $ 2,880 $ 3,399
Depreciation expense related to property and equipment, net for the years ended December 31,2020 and 2019, was $905 and $846, respectively.
F-20

THE VITA COCO COMPANY, INC. AND SUBSIDIARIESNOTES TO CONSOLIDATED FINANCIAL STATEMENTS
FOR THE YEARS ENDED DECEMBER 31, 2020 AND 2019(Amounts in thousands)
8. GOODWILL AND INTANGIBLE ASSETS
Goodwill and Intangible Assets, net consist of the following:
December 31,
2020 2019
Goodwill . . . . . . . . . . . . . . . . . . . . . . . . . . . . . . . . . . . . . . . . . . . . . . . . . . . . . . . . . . . . . . . $7,791 $7,791
December 31, 2020 December 31, 2019
Gross CarryingAmount
AccumulatedAmortization Net
Gross CarryingAmount
AccumulatedAmortization Net
Intangible assets, netTrade names . . . . . . . . . . . . . . $ 6,200 $(1,567) $4,633 $ 6,200 $ (947) $ 5,253Distributor relationships . . . . . . 6,000 (1,517) $4,483 6,000 (917) 5,083Other . . . . . . . . . . . . . . . . . . . . . 38 — $ 38 144 (16) 128
Total intangible assetssubject toamortization . . . . . . . . . . $12,238 $(3,084) $9,154 12,344 $(1,880) $10,464
Annual Goodwill Impairment Testing
All of the Company’s goodwill is associated with the acquisition of Runa, which was acquired inJune 2018. The goodwill is allocated to the Americas reporting unit and is tax deductible. In assessingwhether goodwill was impaired in connection with its annual impairment testing performed atDecember 31st, the Company, elected to bypass the qualitative assessment and, performed aquantitative assessment in accordance with ASC 350. Refer to Note 2, Summary of SignificantAccounting Policies, for further discussion of the quantitative analysis. Based on the results of theannual impairment test, the Company concluded that no impairment to goodwill existed as ofDecember 31, 2020 and 2019.
Intangible Assets, net
The intangible assets, net associated with the acquisition of Runa was $9,154 and $10,374 as ofDecember 31, 2020 and 2019, respectively.
All the intangible assets are amortized over their useful life. Since the intangibles are subject toamortization, they are reviewed for impairment in accordance with ASC 360, Property, Plant, andEquipment. Under ASC 360, long-lived assets are tested for recoverability at the asset group levelwhenever events or changes in circumstances indicate that their carrying amounts may not berecoverable. In step 1, the entity determines recoverability of the asset group by comparing its carryingvalue with the sum of its undiscounted cash flows expected to result from the use and eventualdisposition of the asset group. If the sum of the undiscounted cash flows is less than the carrying valueof the asset group, then step 2 must be performed, in which the entity compares the fair value of theasset group to its carrying amount. The excess of the carrying value of the asset group over its fairvalue, if any, would be recognized as an impairment loss.
During 2020, the Company identified facts and circumstances that indicated that the fair value ofthe intangible assets associated with Runa, including the trade names and distributor relationships,
F-21

THE VITA COCO COMPANY, INC. AND SUBSIDIARIESNOTES TO CONSOLIDATED FINANCIAL STATEMENTS
FOR THE YEARS ENDED DECEMBER 31, 2020 AND 2019(Amounts in thousands)
and certain of its Other intangible assets not associated with Runa may not be recoverable, resulting inthe determination that a triggering event had occurred. Based on step 1, the Company determined thatthe Runa intangible assets were recoverable based on a test of recoverability using expectedundiscounted future cash flows for the Runa brand in the Americas. However, based on step 1, theOther intangible assets not associated with Runa were not recoverable based on a test ofrecoverability using expected undiscounted future cash flows. For the Other intangible assets notassociated with Runa, the Company then applied step 2, by determining the fair value of the Otherintangible asset using a discounted cash flow valuation analysis, which concluded that the fair valuewas below the carrying amount. Accordingly, the Company recorded an impairment charge of $90 forthe year ended December 31, 2020, which is recorded in selling, general and administrative expenseon the Company’s consolidated statements of operations. There were no indicators or impairment ofthe intangible assets for the year ended December 31, 2019.
Amortization expense of $1,220 and $1,236 for the years ended December 31, 2020 and 2019were included in selling, general and administrative expenses on the consolidated statements ofoperations.
As of December 31, 2020, the estimated future amortization expense for amortizable intangibleassets placed in service is as follows:
Year ending December 31,2021 . . . . . . . . . . . . . . . . . . . . . . . . . . . . . . . . . . . . . . . . . . . . . . . . . . . . . . . . . . . . . . . . . . . . . . . . . . $1,2242022 . . . . . . . . . . . . . . . . . . . . . . . . . . . . . . . . . . . . . . . . . . . . . . . . . . . . . . . . . . . . . . . . . . . . . . . . . . 1,2242023 . . . . . . . . . . . . . . . . . . . . . . . . . . . . . . . . . . . . . . . . . . . . . . . . . . . . . . . . . . . . . . . . . . . . . . . . . . 1,2242024 . . . . . . . . . . . . . . . . . . . . . . . . . . . . . . . . . . . . . . . . . . . . . . . . . . . . . . . . . . . . . . . . . . . . . . . . . . 1,2242025 . . . . . . . . . . . . . . . . . . . . . . . . . . . . . . . . . . . . . . . . . . . . . . . . . . . . . . . . . . . . . . . . . . . . . . . . . . 1,224Thereafter . . . . . . . . . . . . . . . . . . . . . . . . . . . . . . . . . . . . . . . . . . . . . . . . . . . . . . . . . . . . . . . . . . . . . 3,034
$9,154
9. ACCRUED EXPENSES
Accrued expenses consist of the following:
December 31,
2020 2019
Accrued promotions and marketing . . . . . . . . . . . . . . . . . . . . . . . . . . . . . . . . . . . . . . . $15,137 $11,653Payroll and benefits related expenses . . . . . . . . . . . . . . . . . . . . . . . . . . . . . . . . . . . . . 7,493 3,333Shipping and handling costs . . . . . . . . . . . . . . . . . . . . . . . . . . . . . . . . . . . . . . . . . . . . . 3,215 2,351Accrued trade payable . . . . . . . . . . . . . . . . . . . . . . . . . . . . . . . . . . . . . . . . . . . . . . . . . 2,782 2,087VAT payable . . . . . . . . . . . . . . . . . . . . . . . . . . . . . . . . . . . . . . . . . . . . . . . . . . . . . . . . . 1,927 1,654Income tax payable . . . . . . . . . . . . . . . . . . . . . . . . . . . . . . . . . . . . . . . . . . . . . . . . . . . . 1,661 781Accrued professional fees . . . . . . . . . . . . . . . . . . . . . . . . . . . . . . . . . . . . . . . . . . . . . . 380 254Other accrued expenses . . . . . . . . . . . . . . . . . . . . . . . . . . . . . . . . . . . . . . . . . . . . . . . . 1,887 2,059
$34,482 $24,172
F-22

THE VITA COCO COMPANY, INC. AND SUBSIDIARIESNOTES TO CONSOLIDATED FINANCIAL STATEMENTS
FOR THE YEARS ENDED DECEMBER 31, 2020 AND 2019(Amounts in thousands)
10. DEBT
The table below details the outstanding balances on the Company’s credit facility and notespayable as of December 31, 2020 and 2019:
December 31,
2020 2019
Credit facility . . . . . . . . . . . . . . . . . . . . . . . . . . . . . . . . . . . . . . . . . . . . . . . . . . . . . . . . . $25,000 $ —
Notes payableTerm Loan . . . . . . . . . . . . . . . . . . . . . . . . . . . . . . . . . . . . . . . . . . . . . . . . . . . . . . . $ — $ 6,000Term Loan 2017 . . . . . . . . . . . . . . . . . . . . . . . . . . . . . . . . . . . . . . . . . . . . . . . . . . . — 10,875Vehicle loans . . . . . . . . . . . . . . . . . . . . . . . . . . . . . . . . . . . . . . . . . . . . . . . . . . . . . 56 76
$ 56 $16,951
Current . . . . . . . . . . . . . . . . . . . . . . . . . . . . . . . . . . . . . . . . . . . . . . . . . . . . . . . . . . 22 4,020
Non-current . . . . . . . . . . . . . . . . . . . . . . . . . . . . . . . . . . . . . . . . . . . . . . . . . . . . . . $ 34 $12,931
2020 Credit Facility
In May 2020, the Company entered into a five-year credit facility (“2020 Credit Facility”) withWells Fargo consisting of a revolving line of credit, which provides for committed borrowings of$50 million and a $10 million non-committed accordion feature. Borrowings on the 2020 Credit Facilitybear interest at rates based on either London InterBank Offered Rate (LIBOR) or a specified base rate,as selected periodically by the Company. The LIBOR-based loans bear interest at LIBOR plus aspread ranging from 1.00% to 1.50% per annum, with the spread in each case being based on theCompany’s leverage ratio (as defined in the credit agreement). In addition, the Company is subject toan unused commitment fee ranging from 0.05% and 0.15% on the unused amount of the line of credit,with the rate being based on the Company’s leverage ratio (as defined in the credit agreement). Thematurity date on the 2020 Credit Facility is May 12, 2025.
In December 2020, the Company drew down $25,000 on the 2020 Credit Facility. As ofDecember 31, 2020, the Company had $25,000 outstanding, $25,000 undrawn and available as wellas a $10,000 non-committed accordion feature under its 2020 Credit Facility.
Interest expense and unused commitment fee for the 2020 Credit Facility amounted to $42 and$22, respectively, for the year ended December 31, 2020. The effective interest rate was 1.15% as ofDecember 31, 2020.
The 2020 Credit Facility is collateralized by substantially all of the Company’s assets.
The 2020 Credit Facility contains certain affirmative and negative covenants that, among otherthings, limit the Company’s ability to, subject to various exceptions and qualifications: (i) incur liens;(ii) incur additional debt; (iii) sell, transfer or dispose of assets; (iv) merge with or acquire othercompanies, (v) make loans, advances or guarantees; (vi) make investments; (vii) make dividends anddistributions on, or repurchases of, equity; and (viii) enter into certain transactions with affiliates. The2020 Credit Facility also requires the Company to maintain certain financial covenants including amaximum leverage ratio, a minimum fixed charge coverage ratio, and a minimum asset coverage ratio.As of December 31, 2020, the Company was compliant with all financial covenants.
F-23
THE VITA COCO COMPANY, INC. AND SUBSIDIARIESNOTES TO CONSOLIDATED FINANCIAL STATEMENTS
FOR THE YEARS ENDED DECEMBER 31, 2020 AND 2019(Amounts in thousands)
2016 Credit Facility
On August 9, 2016, the Company entered into a three-year credit facility (“2016 Revolver” or“2016 Credit Facility”) with JPMorgan Chase Bank, N.A (“Chase”). The Credit Facility provided forborrowings up to $30,000. Borrowings on the 2016 Credit Facility bear interest, at either LondonInterBank Offered Rate (LIBOR), plus 1.50% or prime rate. On December 31, 2018, the Companyentered into an amendment to the 2016 Credit Facility which extended the maturity date to July 31,2020, unless terminated prior by either party.
The Credit Facility was fully repaid during the year ended December 31, 2019. As ofDecember 31, 2019, the Company had no amount outstanding and $30,000 available under the 2016Credit Facility.
Interest expense for the 2016 Credit Facility amounted to $254 for the year ended December 31,2019. Unused commitment fee for the 2016 Credit Facility amounted to $20 and $60 for the yearsended December 31, 2020 and 2019, respectively. The effective interest rate was 4.43% as ofDecember 31, 2019.
The 2016 Credit Facility was collateralized by the Company’s trade receivables and inventory.The borrowing base limitation is equivalent to (a) 85% of eligible accounts receivable as defined in theagreement and (b) 50% of eligible inventory as defined in the agreement.
The 2016 Credit Facility contained certain affirmative and negative covenants that, among otherthings, limited the Company’s ability to, subject to various exceptions and qualifications: (i) incur liens;(ii) incur additional debt; (iii) sell, transfer or dispose of assets; (iv) merge with or acquire othercompanies, (v) make loans, advances or guarantees; (vi) make investments; and (vii) enter into certaintransactions with affiliates. The 2016 Credit Facility also required the Company to maintain certainfinancial covenants including a maximum leverage ratio and a minimum fixed charge coverage ratio.As of December 31, 2019, the Company was compliant with all financial covenants.
Term Loan
On August 9, 2016, the Company entered into a five-year term loan with JPMorgan Chase, N.A.(“Term Loan”). The total amount of the term loan is $10,000 which matures in August 2021. Principalpayments are based on an increasing percentage of the initial loan amount varying from 2.5% to 5%and are made at the end of each quarter.
On April 25, 2017, the Company entered into a five-year term loan with JPMorgan Chase, N.A.(“Term Loan 2017”). The total amount of the term loan is $15,000 which matures in April 2022.Principal payments are based on an increasing percentage of the initial loan amount varying from 2.5%to 5% and are made at the end of each quarter.
The Term Loan and the Term Loan 2017 bears interest at LIBOR plus 1.50% and werecollateralized by substantially all of the Company’s assets. In addition, the Term Loan and Term Loan2017 were subject to the same affirmative, negative and financial covenants as the 2016 CreditFacility.
F-24
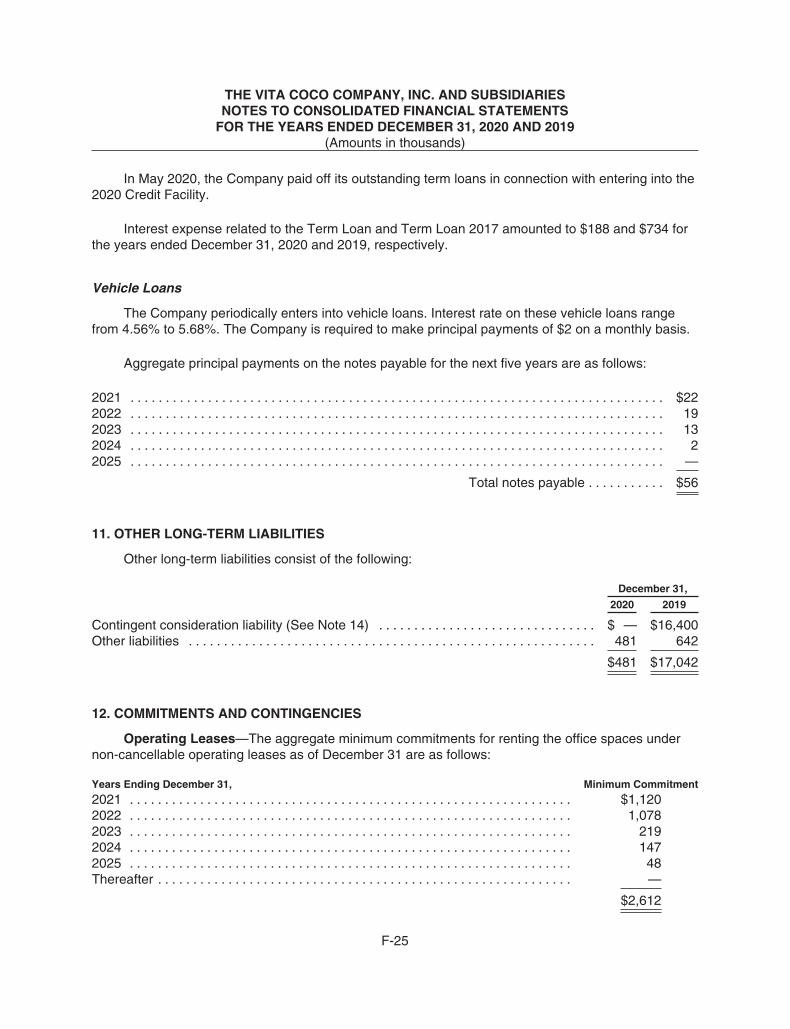
THE VITA COCO COMPANY, INC. AND SUBSIDIARIESNOTES TO CONSOLIDATED FINANCIAL STATEMENTS
FOR THE YEARS ENDED DECEMBER 31, 2020 AND 2019(Amounts in thousands)
In May 2020, the Company paid off its outstanding term loans in connection with entering into the2020 Credit Facility.
Interest expense related to the Term Loan and Term Loan 2017 amounted to $188 and $734 forthe years ended December 31, 2020 and 2019, respectively.
Vehicle Loans
The Company periodically enters into vehicle loans. Interest rate on these vehicle loans rangefrom 4.56% to 5.68%. The Company is required to make principal payments of $2 on a monthly basis.
Aggregate principal payments on the notes payable for the next five years are as follows:
2021 . . . . . . . . . . . . . . . . . . . . . . . . . . . . . . . . . . . . . . . . . . . . . . . . . . . . . . . . . . . . . . . . . . . . . . . . . . . . $222022 . . . . . . . . . . . . . . . . . . . . . . . . . . . . . . . . . . . . . . . . . . . . . . . . . . . . . . . . . . . . . . . . . . . . . . . . . . . . 192023 . . . . . . . . . . . . . . . . . . . . . . . . . . . . . . . . . . . . . . . . . . . . . . . . . . . . . . . . . . . . . . . . . . . . . . . . . . . . 132024 . . . . . . . . . . . . . . . . . . . . . . . . . . . . . . . . . . . . . . . . . . . . . . . . . . . . . . . . . . . . . . . . . . . . . . . . . . . . 22025 . . . . . . . . . . . . . . . . . . . . . . . . . . . . . . . . . . . . . . . . . . . . . . . . . . . . . . . . . . . . . . . . . . . . . . . . . . . . —
Total notes payable . . . . . . . . . . . $56
11. OTHER LONG-TERM LIABILITIES
Other long-term liabilities consist of the following:
December 31,
2020 2019
Contingent consideration liability (See Note 14) . . . . . . . . . . . . . . . . . . . . . . . . . . . . . . . $ — $16,400Other liabilities . . . . . . . . . . . . . . . . . . . . . . . . . . . . . . . . . . . . . . . . . . . . . . . . . . . . . . . . . . 481 642
$481 $17,042
12. COMMITMENTS AND CONTINGENCIES
Operating Leases—The aggregate minimum commitments for renting the office spaces undernon-cancellable operating leases as of December 31 are as follows:
Years Ending December 31, Minimum Commitment
2021 . . . . . . . . . . . . . . . . . . . . . . . . . . . . . . . . . . . . . . . . . . . . . . . . . . . . . . . . . . . . . . . $1,1202022 . . . . . . . . . . . . . . . . . . . . . . . . . . . . . . . . . . . . . . . . . . . . . . . . . . . . . . . . . . . . . . . 1,0782023 . . . . . . . . . . . . . . . . . . . . . . . . . . . . . . . . . . . . . . . . . . . . . . . . . . . . . . . . . . . . . . . 2192024 . . . . . . . . . . . . . . . . . . . . . . . . . . . . . . . . . . . . . . . . . . . . . . . . . . . . . . . . . . . . . . . 1472025 . . . . . . . . . . . . . . . . . . . . . . . . . . . . . . . . . . . . . . . . . . . . . . . . . . . . . . . . . . . . . . . 48Thereafter . . . . . . . . . . . . . . . . . . . . . . . . . . . . . . . . . . . . . . . . . . . . . . . . . . . . . . . . . . . —
$2,612
F-25

THE VITA COCO COMPANY, INC. AND SUBSIDIARIESNOTES TO CONSOLIDATED FINANCIAL STATEMENTS
FOR THE YEARS ENDED DECEMBER 31, 2020 AND 2019(Amounts in thousands)
Rent expense on the leases included above amounted to $1,126 and $1,140 for the years endedDecember 31, 2020 and 2019, respectively, and is recorded within selling, general and administrativeexpenses in the accompanying consolidated statements of operations.
Contingencies:
Litigation—The Company may engage in various litigation in the ordinary course of business.The Company intends to vigorously defend itself in such matters and management, based upon theadvice of legal counsel, is of the opinion that the resolution of these matters will not have a materialeffect on the consolidated financial statements. For the cases for which management believes that it ismore likely than not that it will lose the case, a provision for legal settlements has been recorded. As ofDecember 31, 2020, and 2019, the Company has not recorded any liabilities relating to legalsettlements.
Business Risk—The Company imports finished goods predominantly from manufacturerslocated in South American and Southeast Asian countries. The Company may be subject to certainbusiness risks due to potential instability in these regions.
Major Customers—The Company’s customers that accounted for 10% or more of total net salesand total accounts receivable were as follows:
Net sales Accounts receivable
Year Ended December 31, December 31,
2020 2019 2020 2019
Customer A . . . . . . . . . . . . . . . . . . . . . . . . . . . . . . . . . . . . . 35% 37% 22% 16%Customer B . . . . . . . . . . . . . . . . . . . . . . . . . . . . . . . . . . . . . 19% 26% 16% 21%
Major Suppliers—The Company’s suppliers that accounted for 10% or more of the Company’spurchases were as follows:
Year Ended December 31,
2020 2019
Supplier A . . . . . . . . . . . . . . . . . . . . . . . . . . . . . . . . . . . . . . . . . . . . . . . . . . . . . . . . 27% 28%Supplier B . . . . . . . . . . . . . . . . . . . . . . . . . . . . . . . . . . . . . . . . . . . . . . . . . . . . . . . . 18% 16%Supplier C . . . . . . . . . . . . . . . . . . . . . . . . . . . . . . . . . . . . . . . . . . . . . . . . . . . . . . . . 10% 14%
13. DERIVATIVE INSTRUMENTS
The Company accounts for derivative instruments in accordance with the ASC Topic 815,Derivatives and Hedging (ASC 815). These principles require that all derivative instruments berecognized at fair value on each balance sheet date unless they qualify for a scope exclusion as anormal purchases or sales transaction, which is accounted for under the accrual method of accounting.In addition, these principles permit derivative instruments that qualify for hedge accounting to reflectthe changes in the fair value of the derivative instruments through earnings or stockholders’ equity asother comprehensive income on a net basis until the hedged item is settled and recognized inearnings, depending on whether the derivative is being used to hedge changes in fair value or cashflows. The ineffective portion of a derivative instrument’s change in fair value is immediately recognizedin earnings. As of December 31, 2020 and December 31, 2019, the Company did not have anyderivative instruments that it had designated as fair value or cash flow hedges.
F-26
THE VITA COCO COMPANY, INC. AND SUBSIDIARIESNOTES TO CONSOLIDATED FINANCIAL STATEMENTS
FOR THE YEARS ENDED DECEMBER 31, 2020 AND 2019(Amounts in thousands)
The Company is subject to the following currency risks:
Inventory purchases from Brazilian and Malaysian manufacturers—In order to mitigate thecurrency risk on inventory purchases from its Brazilian and Malaysian manufacturers, which are settledin Brazilian Real (BRL) and Thai Bhatt (THB), the AMS subsidiary enters into a series of forwardcurrency swaps to buy BRL and THB.
Intercompany transactions between AME and AMS—In order to mitigate the currency risk onintercompany transactions between AME and AMS, AMS enters into foreign currency swaps to buy/sellBritish Pounds (GBP).
Intercompany transactions with Canadian customer and vendors—In order to mitigate thecurrency risk on transactions with Canadian customer and vendors, AMI enters into foreign currencyswaps to sell Canadian Dollars (CAD).
The Company was also subject to interest rate risk on its variable interest rate over the TermLoan 2017. On October 29, 2018 the Company entered into a swap agreement (ISDA) with JPMorganChase, N.A. to hedge part of its variable interest rate over the Term Loan 2017 listed in Note 10. Thelock in rate was fixed at 3.08% and covered a notional amount of $10,875 as of December 31, 2019.The Company terminated the swap agreement in May 2020, in connection with the repayment of theoutstanding Term Loan 2017 balance.
F-27
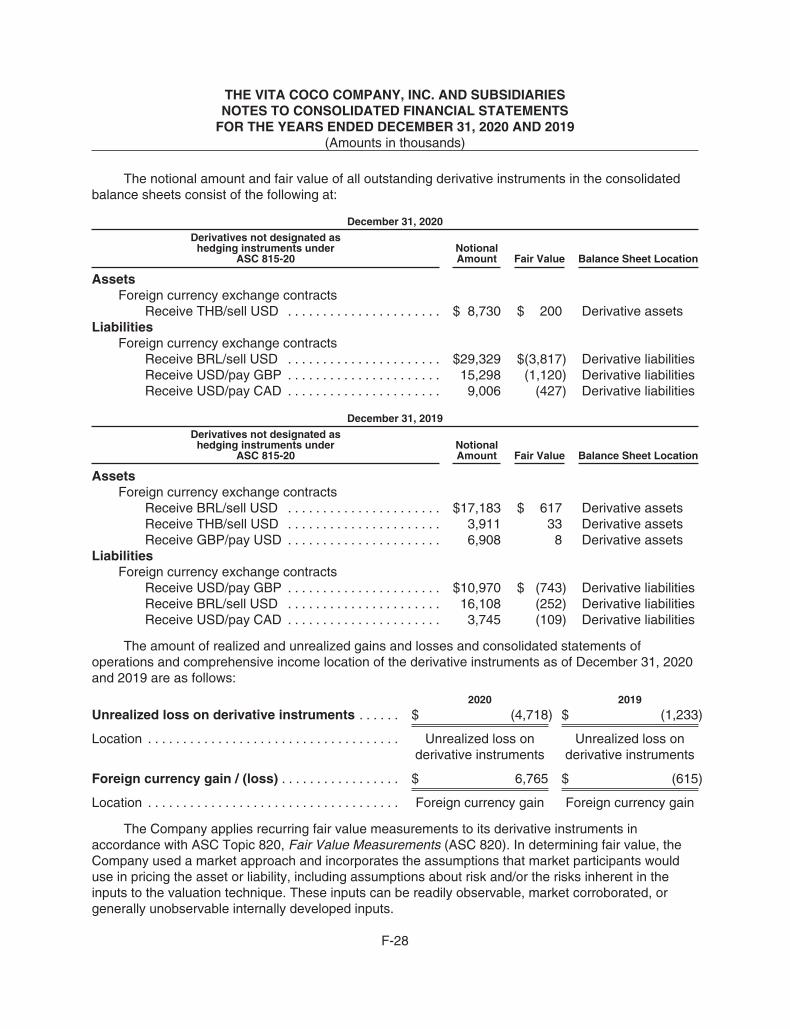
THE VITA COCO COMPANY, INC. AND SUBSIDIARIESNOTES TO CONSOLIDATED FINANCIAL STATEMENTS
FOR THE YEARS ENDED DECEMBER 31, 2020 AND 2019(Amounts in thousands)
The notional amount and fair value of all outstanding derivative instruments in the consolidatedbalance sheets consist of the following at:
December 31, 2020
Derivatives not designated ashedging instruments under
ASC 815-20NotionalAmount Fair Value Balance Sheet Location
AssetsForeign currency exchange contracts
Receive THB/sell USD . . . . . . . . . . . . . . . . . . . . . . $ 8,730 $ 200 Derivative assetsLiabilities
Foreign currency exchange contractsReceive BRL/sell USD . . . . . . . . . . . . . . . . . . . . . . $29,329 $(3,817) Derivative liabilitiesReceive USD/pay GBP . . . . . . . . . . . . . . . . . . . . . . 15,298 (1,120) Derivative liabilitiesReceive USD/pay CAD . . . . . . . . . . . . . . . . . . . . . . 9,006 (427) Derivative liabilities
December 31, 2019
Derivatives not designated ashedging instruments under
ASC 815-20NotionalAmount Fair Value Balance Sheet Location
AssetsForeign currency exchange contracts
Receive BRL/sell USD . . . . . . . . . . . . . . . . . . . . . . $17,183 $ 617 Derivative assetsReceive THB/sell USD . . . . . . . . . . . . . . . . . . . . . . 3,911 33 Derivative assetsReceive GBP/pay USD . . . . . . . . . . . . . . . . . . . . . . 6,908 8 Derivative assets
LiabilitiesForeign currency exchange contracts
Receive USD/pay GBP . . . . . . . . . . . . . . . . . . . . . . $10,970 $ (743) Derivative liabilitiesReceive BRL/sell USD . . . . . . . . . . . . . . . . . . . . . . 16,108 (252) Derivative liabilitiesReceive USD/pay CAD . . . . . . . . . . . . . . . . . . . . . . 3,745 (109) Derivative liabilities
The amount of realized and unrealized gains and losses and consolidated statements ofoperations and comprehensive income location of the derivative instruments as of December 31, 2020and 2019 are as follows:
2020 2019
Unrealized loss on derivative instruments . . . . . . $ (4,718) $ (1,233)
Location . . . . . . . . . . . . . . . . . . . . . . . . . . . . . . . . . . . . Unrealized loss onderivative instruments
Unrealized loss onderivative instruments
Foreign currency gain / (loss) . . . . . . . . . . . . . . . . . $ 6,765 $ (615)
Location . . . . . . . . . . . . . . . . . . . . . . . . . . . . . . . . . . . . Foreign currency gain Foreign currency gain
The Company applies recurring fair value measurements to its derivative instruments inaccordance with ASC Topic 820, Fair Value Measurements (ASC 820). In determining fair value, theCompany used a market approach and incorporates the assumptions that market participants woulduse in pricing the asset or liability, including assumptions about risk and/or the risks inherent in theinputs to the valuation technique. These inputs can be readily observable, market corroborated, orgenerally unobservable internally developed inputs.
F-28

THE VITA COCO COMPANY, INC. AND SUBSIDIARIESNOTES TO CONSOLIDATED FINANCIAL STATEMENTS
FOR THE YEARS ENDED DECEMBER 31, 2020 AND 2019(Amounts in thousands)
14. FAIR VALUE MEASUREMENTS
ASC 820 provides a framework for measuring fair value and requires expanded disclosuresregarding fair value measurements. ASC 820 defines fair value as the price that would be received tosell an asset or paid to transfer a liability in an orderly transaction between market participants at themeasurement date. ASC 820 also establishes a fair value hierarchy which requires an entity tomaximize the use of observable inputs and minimize the use of unobservable inputs. Based uponobservability of the inputs used in valuation techniques, the Company’s assets and liabilities areclassified as follows:
Level 1—Quoted market prices in active markets for identical assets or liabilities.
Level 2—Observable inputs other than Level 1 prices, such as quoted prices for similar assets orliabilities, quoted market prices in markets that are not active; or other inputs that are observable orcan be corroborated by observable market data.
Level 3—Unobservable inputs that are supported by little or no market activity and that aresignificant to the fair value of the assets or liabilities. This includes internally developed models andmethodologies utilizing significant unobservable inputs.
Forward currency swap contracts—The Company’s valuation methodology for forward currencyswap contracts is based upon third-party institution data.
Contingent consideration liability—The Company utilized a probability weighted scenario-basedmodel to determine the fair value of the contingent consideration.
The Company’s fair value hierarchy for those assets (liabilities) measured at fair value on arecurring basis at December 31, 2020 and 2019, is as follows:
Level 1 Level 2 Level 3 TotalForward CurrencySwaps/Contracts
Contingentconsideration liability
2020 . . . . . . . . . . . . . . . . . . . . . . . . . . . . . . . . . $ — $(5,164) $ — $ (5,164)
2019 . . . . . . . . . . . . . . . . . . . . . . . . . . . . . . . . . $ — $ (446) $(16,400) $(16,846)
In connection with the Company’s acquisition of Runa, the Company was obligated to paycontingent payments to Runa’s former shareholders only if a certain growth rate is achieved. Assumingthe revenue growth is achieved, the former shareholders could elect for payment to be calculatedbased on quarterly data available between December 2021 and December 2022, as follows: 49% ofthe product of (a) the net revenue for the trailing 12 calendar months and (b) a specified multiple, whichis contingent on the revenue growth achieved since December 31, 2017. Per the acquisitionagreement, the contingent payment cannot exceed $51,500. If a certain revenue growth rate is notachieved, the Company is not required to pay any contingent payment. The Company does not believethat the Runa business will achieve the growth targets required and thus expect that the contingentconsideration will be zero at December 2022.
The fair value of contingent consideration of $15,700 determined on the acquisition date in 2018was initially recognized as a liability and then subsequently remeasured to fair value at each reportingdate with changes in fair value recognized as a component of operating expenses in the accompanyingconsolidated statements of operations.
F-29

THE VITA COCO COMPANY, INC. AND SUBSIDIARIESNOTES TO CONSOLIDATED FINANCIAL STATEMENTS
FOR THE YEARS ENDED DECEMBER 31, 2020 AND 2019(Amounts in thousands)
The contingent consideration liability related to the acquisition of Runa LLC was considered aLevel 3 liability, as the fair value was determined based on significant inputs not observable in themarket, and recorded within other long-term liabilities in the accompanying consolidated balancesheets. The Company estimated the fair value of the contingent consideration liability based on aprobability-weighted present value of various future cash payment outcomes using a Monte Carlosimulation. The technique considered the following unobservable inputs as of each valuation date:
• The probability and timing of achieving the specified milestones,
• Revenue performance expectations, and
• Market-based discount rates
Based on updated revenue performance expectations during the earn-out period for Runa LLC,the Company remeasured the contingent consideration to zero at December 31, 2020. The $16,400decrease in the liability is included as a component of operating expenses in the accompanyingconsolidated statements of operations for the year ended December 31, 2020.
The following table presents the change in contingent consideration liability during the twelvemonths ended December 31, 2020 and 2019:
2020 2019
Balance at beginning of the period . . . . . . . . . . . . . . . . . . . . . . . . . . . . . . . . . . . . $(16,400) $(15,700)Change in fair value of contingent consideration . . . . . . . . . . . . . . . . . . . . . . . . . . . 16,400 (700)
Ending balance . . . . . . . . . . . . . . . . . . . . . . . . . . . . . . . . . . . . . . . . . . . . . . . . . . . . . $ — $(16,400)
There were no transfers between any levels of the fair value hierarchy for any of the Company’sfair value measurements.
15. STOCKHOLDERS’ EQUITY
Common and Treasury Stock—Each share of common stock entitles its holder to one vote onmatters required to be voted on by the stockholders of the Company and to receive dividends, whenand if declared by the Company’s Board of Directors.
As of December 31, 2020 and 2019, the Company held 1,014,195 and 211,575 shares,respectively, in treasury stock and had 3,883,425 and 3,594,045 shares, respectively, of commonstock reserved for issuance upon the conversion of outstanding warrants and stock options.
F-30

THE VITA COCO COMPANY, INC. AND SUBSIDIARIESNOTES TO CONSOLIDATED FINANCIAL STATEMENTS
FOR THE YEARS ENDED DECEMBER 31, 2020 AND 2019(Amounts in thousands)
Warrants—The following table summarizes warrant activity as of and for the years endedDecember 31, 2020 and 2019:
ExitWarrants
(a)
ServiceWarrants
(b)Total
Warrants
Weighted-Average
Exercise Price
Weighted-Average
RemainingContractual Term
(in Years)
Outstanding - January 1, 2020 . . . . . . . 285,285 123,760 409,045 $0.000022 0.6Granted . . . . . . . . . . . . . . . . . . . . . . . . . . — — — — —Exercised . . . . . . . . . . . . . . . . . . . . . . . . . — 116,025 116,025 $0.000022 —Expired . . . . . . . . . . . . . . . . . . . . . . . . . . 256,620 7,735 264,355 — —
Outstanding - December 31, 2020 . . . . 28,665 — 28,665 $0.000022 0.75
Exercisable - December 31, 2020 . . . . . — — — — —
Outstanding - January 1, 2019 . . . . . . . 442,260 123,760 566,020 $0.000044 0.1Granted . . . . . . . . . . . . . . . . . . . . . . . . . . — — — — —Exercised . . . . . . . . . . . . . . . . . . . . . . . . . — — — — —Expired . . . . . . . . . . . . . . . . . . . . . . . . . . 156,975 — 156,975 — —
Outstanding - December 31, 2019 . . . . 285,285 123,760 409,045 $0.000022 0.6
Exercisable - December 31, 2019 . . . . . — 123,760 123,760 $0.000022 1.0
(a) As of December 31, 2020 and 2019, the Company has exit warrants to purchase 28,665 and285,285, respectively, shares of common stock at a weighted-average exercise price of$0.000033 per share outstanding to certain investors. These exit warrants, expire upon the earlierof 10 years from the date of grant or the occurrence of a liquidity event, as defined in the warrantagreements. The warrants, which were issued in connection with the sale of common stock, onlyvest when proceeds from a liquidity event provide an annual internal rate of return of less than30%.
(b) As of December 31, 2020 and 2019, the Company has warrants to purchase 0 and 123,760shares of common stock at an exercise price of $0.000022 per share outstanding to severalindividuals for the performance of certain marketing services. Such warrants are fully vested andexpire in 10 years from the date of grant.
Stock Options—The stockholders of the Company approved the adoption of the Company’s 2014Stock Option and Restricted Stock Plan (the “Stock Option Plan”). The Stock Option Plan allowed for amaximum of 8% of the sum of the Available Equity defined as the sum of (i) the total then outstandingshares of common shares and (ii) all available stock option (i.e., granted and outstanding stock optionsand stock options not yet granted). Under the terms of the Stock Option Plan, the Company may grantemployees, directors, and consultants stock options and restricted stock awards and has the authorityto establish the specific terms of each award, including exercise price, expiration, and vesting.Generally, stock options issued pursuant to the Stock Option Plan must contain exercise prices no lessthan the fair value of the Company’s common stock on the date of grant and have a ten-yearcontractual term. As of December 31, 2020 and 2019, there were 545,545 and 1,392,755 shares,respectively, of common stock reserved for future issuance pursuant to the Stock Option Plan. Allshares awarded due to exercise of stock options are newly issued.
F-31

THE VITA COCO COMPANY, INC. AND SUBSIDIARIESNOTES TO CONSOLIDATED FINANCIAL STATEMENTS
FOR THE YEARS ENDED DECEMBER 31, 2020 AND 2019(Amounts in thousands)
The Company recognized stock-based compensation expense of $1,517 and $2,227 for theyears ended December 31, 2020 and 2019, respectively, in selling, general, and administrativeexpenses.
Awards with Service-based Vesting Conditions
Most of stock option awards granted under the Stock Option Plan vest based on the continuousservice. Generally, the 50% of the stock options granted vest over the two years and 50% of the stockoptions granted vest over the four years. The following table summarizes the service-based stockoption activity during the year ended December 31, 2020:
Number ofStock
Options
Weighted-AverageExercise
Price
Weighted-Average
RemainingContractual Term
AggregateIntrinsic Value
(per option) (in years) (in thousands)
Outstanding—December 31, 2019 . . . . . . . . . . 2,605,330 $ 9.67Granted . . . . . . . . . . . . . . . . . . . . . . . . . . . . . . . . 889,070 10.18Exercised . . . . . . . . . . . . . . . . . . . . . . . . . . . . . . (177,450) 4.99Forfeited . . . . . . . . . . . . . . . . . . . . . . . . . . . . . . . (110,110) 10.18
Outstanding—December 31, 2020 . . . . . . . . . . 3,206,840 $10.05 8.1 $877
Exercisable—December 31, 2020 . . . . . . . . . . 1,970,605 $ 9.97 7.4 $877
The weighted average grant-date fair value of the service-based stock option awards grantedduring the years ended December 31, 2020 and 2019 was $3.55 per option and $3.06 per option,respectively. The aggregate intrinsic value of service-based stock options exercised was $856 and $0for the years ended December 31, 2020 and 2019, respectively. The aggregate intrinsic value of stockoptions is calculated as the difference between the exercise price of the stock options and the fairvalue of the Company’s common stock for all stock options that had exercise prices lower than the fairvalue of the Company’s common stock.
In December 2019, the Board of Directors of the Company approved a one-time repricing of1,877,785 outstanding service-based stock options for 53 grantees. In addition, the Company extendedthe expiration date of the modified stock options with the contractual term being 10 years from the dateof the modification, while all other modified option terms remained the same. As a result of that optionmodification, the Company recognized incremental compensation expense of $408 and $1,608 for theyears ended December 31, 2020 and 2019, respectively.
The fair value of the service-based stock options granted in 2020 and 2019 pursuant to the StockOption Plan as well as the fair value of the modified in 2019 stock options was estimated on a grant oron a modification date using the Black-Scholes option-pricing model. The weighted averageassumptions used in the Black-Scholes option-pricing model were as follows:
2020 2019
Weighted average expected term . . . . . . . . . . . . . . . . . . . . . . . . . . . . . . . . . . . . . . 5.6 years 6.4 yearsWeighted average expected volatility . . . . . . . . . . . . . . . . . . . . . . . . . . . . . . . . . . . . 40% 30%Weighted average risk-free interest rate . . . . . . . . . . . . . . . . . . . . . . . . . . . . . . . . . 0.45% 1.80%Weighted average expected dividend yield . . . . . . . . . . . . . . . . . . . . . . . . . . . . . . . 0% 0%
F-32

THE VITA COCO COMPANY, INC. AND SUBSIDIARIESNOTES TO CONSOLIDATED FINANCIAL STATEMENTS
FOR THE YEARS ENDED DECEMBER 31, 2020 AND 2019(Amounts in thousands)
Expected Term: Represents the period that the stock-based awards are expected to beoutstanding based on a contractual term and service conditions specified for the awards. TheCompany estimated the expected term of the options with service conditions in accordance with the“simplified” method as defined in ASC 718, which enables the use of a practical expedient for “plainvanilla” share options.
Expected Volatility: The Company has historically been a private company and lacks company-specific historical and implied volatility information for its stock. Therefore, the Company estimatedvolatility for option grants by evaluating the average historical volatility of a peer group of companies forthe period immediately preceding the option grant for a term that is approximately equal to theexpected term of the options.
Risk-free Interest Rate: The risk-free interest rate was based on the yield, as of the optionvaluation date, by reference to the U.S. Treasury yield curve in effect at the time of the grant or themodification of the award for time periods equal to the expected term of the award.
Dividend Yield—The Company does not anticipate declaring a dividend over the expected term.As such, the dividend yield has been estimated to be zero.
Fair Value of Common Stock—Because there has been no public market for the Company’scommon stock, the board of directors has determined the estimated fair value of the common stock atthe time of grant of options by considering valuations performed by an independent third-partyvaluation specialist, which considers a number of objective and subjective factors including valuationsof comparable companies, operating and financial performance, the lack of liquidity of capital stock, thelikelihood of achieving an initial public offering and general and industry specific economic outlook.These third-party valuations were performed in accordance with the guidance outlined in the AmericanInstitute of Certified Public Accountants’ Accounting and Valuation Guide, Valuation of Privately-Held-Company Equity Securities Issued as Compensation. The third-party common stock valuations wereprepared using a combination of the income approach and market approach.
As of December 31, 2020, there was $2,616 of total unrecognized compensation cost related tounvested service-based stock options, which is expected to be recognized over a weighted-averageservice period of 2.2 years.
Awards with Performance and Market-based Vesting Conditions
During the year ended December 31, 2020, the Company awarded options for the purchase68,250 shares of common stock of the Company containing a performance-based vesting condition,subject to achievement of various performance goals by the end of 2025, including revenue and grossmargin targets. In addition, during the year ended December 31, 2019, the Company awarded optionsto purchase 579,670 shares of common stock of the Company containing performance and marketvesting conditions, such as option vesting upon occurrence of an initial public offering (“IPO”) or otherqualifying liquidity event and upon achieving predetermined equity value of the Company at a time ofthe IPO or other qualifying liquidity event.
F-33

THE VITA COCO COMPANY, INC. AND SUBSIDIARIESNOTES TO CONSOLIDATED FINANCIAL STATEMENTS
FOR THE YEARS ENDED DECEMBER 31, 2020 AND 2019(Amounts in thousands)
The following table summarizes the stock option activity during the year ended December 31,2020:
Number ofStock
Options
Weighted-AverageExercise
Price
Weighted-Average
RemainingContractual Term
AggregateIntrinsic Value
(per option) (in years) (in thousands)
Outstanding—December 31, 2019 . . . . . . . . . . . 579,675 $10.18Granted . . . . . . . . . . . . . . . . . . . . . . . . . . . . . . . . 68,250 10.18Exercised . . . . . . . . . . . . . . . . . . . . . . . . . . . . . . . — —Forfeited . . . . . . . . . . . . . . . . . . . . . . . . . . . . . . . . — —
Outstanding—December 31, 2020 . . . . . . . . . . . 647,920 $10.18 8.8 $—
None of the stock options included in the table above are exercisable at December 31, 2020.
The fair value of the awards with performance-based vesting condition was estimated using theBlack-Scholes option-pricing model used for the Company’s service-based stock options and assumedthat performance goals will be achieved. If such performance conditions are not met, no compensationcost is recognized and any recognized compensation cost is reversed. The grant-date fair value of thestock options with performance-based vesting condition granted during the year ended December 31,2020 was $4.56 per option. There were no stock options with performance-based vesting conditiongranted during the year ended December 31, 2019.
In December 2020, the Board of Directors of the Company approved a one-time modification ofthe options to purchase 579,670 shares of common stock containing both a performance and marketvesting conditions to reduce the equity value required to be achieved at the time of the IPO or otherqualifying liquidity event. All other option terms remained the same. In connection with the modification,the Company revalued the options using a Barrier option valuation model which resulted in a fair valueof $2.11 per option. There was no incremental compensation expense recognized in connection withthe modification during the year ended December 31, 2020, as the attainment of the performance andmarket vesting conditions was not probable. The assumptions used to revalue the performance andmarket-based stock option grants were as follows:
Weighted average expected term 2.44 yearsWeighted average expected volatility 40%Weighted average risk-free interest rate 0.16%Weighted average expected dividend yield 0%
Expected Term: The period of time for which the stock option awards are expected to beoutstanding until exercise and considers time until expected liquidity event.
Expected Volatility: The Company has historically been a private company and lacks company-specific historical and implied volatility information for its stock. Therefore, the Company estimatedvolatility for option grants by evaluating the average historical volatility of a peer group of companies forthe period immediately preceding the option grant for a term that is approximately equal to theexpected term of the options.
F-34

THE VITA COCO COMPANY, INC. AND SUBSIDIARIESNOTES TO CONSOLIDATED FINANCIAL STATEMENTS
FOR THE YEARS ENDED DECEMBER 31, 2020 AND 2019(Amounts in thousands)
Risk-free Interest Rate: The risk-free interest rate is based on the yield, as of the option valuationdate, by reference to the U.S. Treasury yield curve in effect at the time of the grant or the modificationof the award for time periods equal to the expected term of the award.
Dividend Yield—The Company does not anticipate declaring a dividend over the expected term.As such, the dividend yield has been estimated to be zero.
As of December 31, 2020, the unrecognized stock-based compensation cost related to the stockoptions for which performance-based vesting conditions are probable of being achieved was $265,expected to be recognized over the period of approximately 5 years. As of December 31, 2020, totalunrecognized compensation cost related to the unvested stock option awards containing performanceand market vesting conditions was $1,225, which will be recognized when attainment of theperformance and market vesting conditions becomes probable.
16. Income Taxes
The domestic and foreign components of the Company’s income before income taxes are asfollows:
2020 2019
Domestic . . . . . . . . . . . . . . . . . . . . . . . . . . . . . . . . . . . . . . . . . . . . . . . . . . . . . . . . . . . . $33,412 $ 7,835Foreign . . . . . . . . . . . . . . . . . . . . . . . . . . . . . . . . . . . . . . . . . . . . . . . . . . . . . . . . . . . . . . 10,188 3,566
Income before income taxes . . . . . . . . . . . . . . . . . . . . . . . . . . . . . . . . . . . . . . . . . . . . $43,600 $11,401
The income tax expense for the years ended December 31, 2020 and 2019, consist of thefollowing:
2020 2019
CurrentFederal . . . . . . . . . . . . . . . . . . . . . . . . . . . . . . . . . . . . . . . . . . . . . . . . . . . . . . . . . . . $ 1,871 $1,374State and local . . . . . . . . . . . . . . . . . . . . . . . . . . . . . . . . . . . . . . . . . . . . . . . . . . . . . 886 610Foreign . . . . . . . . . . . . . . . . . . . . . . . . . . . . . . . . . . . . . . . . . . . . . . . . . . . . . . . . . . . 1,874 848
4,631 2,832
DeferredFederal . . . . . . . . . . . . . . . . . . . . . . . . . . . . . . . . . . . . . . . . . . . . . . . . . . . . . . . . . . . $ 4,884 $ (447)State and local . . . . . . . . . . . . . . . . . . . . . . . . . . . . . . . . . . . . . . . . . . . . . . . . . . . . . 1,403 (380)Foreign . . . . . . . . . . . . . . . . . . . . . . . . . . . . . . . . . . . . . . . . . . . . . . . . . . . . . . . . . . . (5) (26)
6,282 (853)
Total . . . . . . . . . . . . . . . . . . . . . . . . . . . . . . . . . . . . . . . . . . . . . . . . . . . . . . . . . . . . . . . . . $10,913 $1,979
F-35
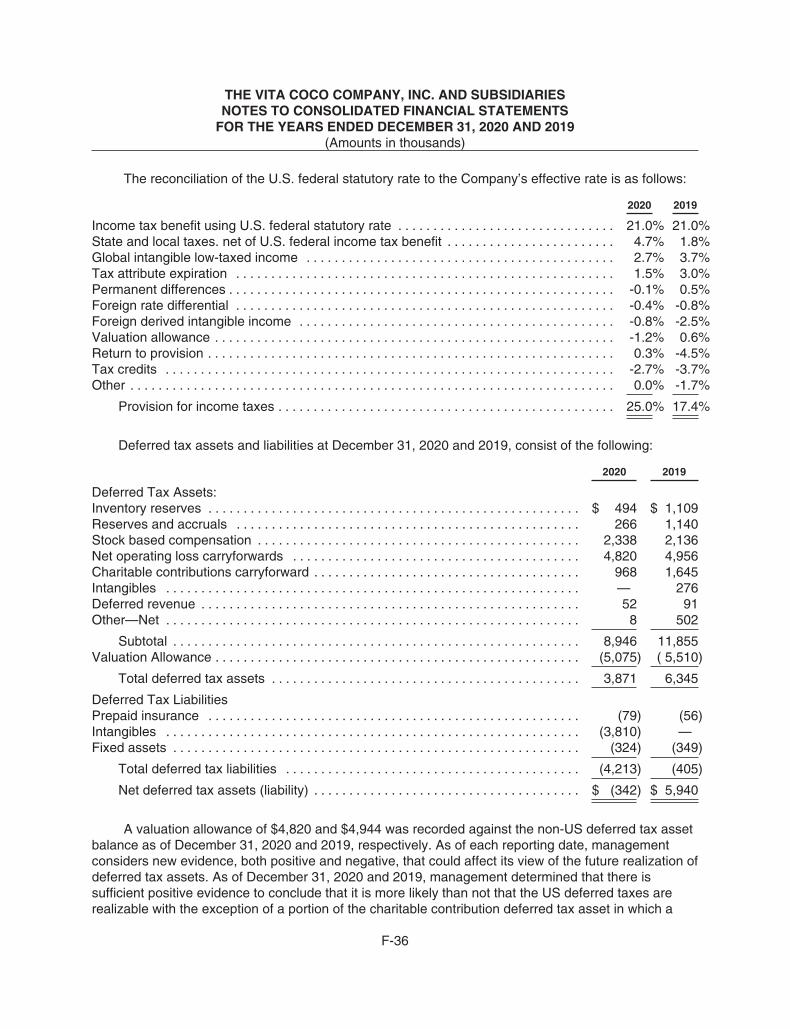
THE VITA COCO COMPANY, INC. AND SUBSIDIARIESNOTES TO CONSOLIDATED FINANCIAL STATEMENTS
FOR THE YEARS ENDED DECEMBER 31, 2020 AND 2019(Amounts in thousands)
The reconciliation of the U.S. federal statutory rate to the Company’s effective rate is as follows:
2020 2019
Income tax benefit using U.S. federal statutory rate . . . . . . . . . . . . . . . . . . . . . . . . . . . . . . . 21.0% 21.0%State and local taxes. net of U.S. federal income tax benefit . . . . . . . . . . . . . . . . . . . . . . . . 4.7% 1.8%Global intangible low-taxed income . . . . . . . . . . . . . . . . . . . . . . . . . . . . . . . . . . . . . . . . . . . . 2.7% 3.7%Tax attribute expiration . . . . . . . . . . . . . . . . . . . . . . . . . . . . . . . . . . . . . . . . . . . . . . . . . . . . . . 1.5% 3.0%Permanent differences . . . . . . . . . . . . . . . . . . . . . . . . . . . . . . . . . . . . . . . . . . . . . . . . . . . . . . . -0.1% 0.5%Foreign rate differential . . . . . . . . . . . . . . . . . . . . . . . . . . . . . . . . . . . . . . . . . . . . . . . . . . . . . . -0.4% -0.8%Foreign derived intangible income . . . . . . . . . . . . . . . . . . . . . . . . . . . . . . . . . . . . . . . . . . . . . -0.8% -2.5%Valuation allowance . . . . . . . . . . . . . . . . . . . . . . . . . . . . . . . . . . . . . . . . . . . . . . . . . . . . . . . . . -1.2% 0.6%Return to provision . . . . . . . . . . . . . . . . . . . . . . . . . . . . . . . . . . . . . . . . . . . . . . . . . . . . . . . . . . 0.3% -4.5%Tax credits . . . . . . . . . . . . . . . . . . . . . . . . . . . . . . . . . . . . . . . . . . . . . . . . . . . . . . . . . . . . . . . . -2.7% -3.7%Other . . . . . . . . . . . . . . . . . . . . . . . . . . . . . . . . . . . . . . . . . . . . . . . . . . . . . . . . . . . . . . . . . . . . . 0.0% -1.7%
Provision for income taxes . . . . . . . . . . . . . . . . . . . . . . . . . . . . . . . . . . . . . . . . . . . . . . . . 25.0% 17.4%
Deferred tax assets and liabilities at December 31, 2020 and 2019, consist of the following:
2020 2019
Deferred Tax Assets:Inventory reserves . . . . . . . . . . . . . . . . . . . . . . . . . . . . . . . . . . . . . . . . . . . . . . . . . . . . . $ 494 $ 1,109Reserves and accruals . . . . . . . . . . . . . . . . . . . . . . . . . . . . . . . . . . . . . . . . . . . . . . . . . 266 1,140Stock based compensation . . . . . . . . . . . . . . . . . . . . . . . . . . . . . . . . . . . . . . . . . . . . . . 2,338 2,136Net operating loss carryforwards . . . . . . . . . . . . . . . . . . . . . . . . . . . . . . . . . . . . . . . . . 4,820 4,956Charitable contributions carryforward . . . . . . . . . . . . . . . . . . . . . . . . . . . . . . . . . . . . . . 968 1,645Intangibles . . . . . . . . . . . . . . . . . . . . . . . . . . . . . . . . . . . . . . . . . . . . . . . . . . . . . . . . . . . — 276Deferred revenue . . . . . . . . . . . . . . . . . . . . . . . . . . . . . . . . . . . . . . . . . . . . . . . . . . . . . . 52 91Other—Net . . . . . . . . . . . . . . . . . . . . . . . . . . . . . . . . . . . . . . . . . . . . . . . . . . . . . . . . . . . 8 502
Subtotal . . . . . . . . . . . . . . . . . . . . . . . . . . . . . . . . . . . . . . . . . . . . . . . . . . . . . . . . . . 8,946 11,855Valuation Allowance . . . . . . . . . . . . . . . . . . . . . . . . . . . . . . . . . . . . . . . . . . . . . . . . . . . . (5,075) ( 5,510)
Total deferred tax assets . . . . . . . . . . . . . . . . . . . . . . . . . . . . . . . . . . . . . . . . . . . . 3,871 6,345
Deferred Tax LiabilitiesPrepaid insurance . . . . . . . . . . . . . . . . . . . . . . . . . . . . . . . . . . . . . . . . . . . . . . . . . . . . . (79) (56)Intangibles . . . . . . . . . . . . . . . . . . . . . . . . . . . . . . . . . . . . . . . . . . . . . . . . . . . . . . . . . . . (3,810) —Fixed assets . . . . . . . . . . . . . . . . . . . . . . . . . . . . . . . . . . . . . . . . . . . . . . . . . . . . . . . . . . (324) (349)
Total deferred tax liabilities . . . . . . . . . . . . . . . . . . . . . . . . . . . . . . . . . . . . . . . . . . (4,213) (405)
Net deferred tax assets (liability) . . . . . . . . . . . . . . . . . . . . . . . . . . . . . . . . . . . . . . $ (342) $ 5,940
A valuation allowance of $4,820 and $4,944 was recorded against the non-US deferred tax assetbalance as of December 31, 2020 and 2019, respectively. As of each reporting date, managementconsiders new evidence, both positive and negative, that could affect its view of the future realization ofdeferred tax assets. As of December 31, 2020 and 2019, management determined that there issufficient positive evidence to conclude that it is more likely than not that the US deferred taxes arerealizable with the exception of a portion of the charitable contribution deferred tax asset in which a
F-36

THE VITA COCO COMPANY, INC. AND SUBSIDIARIESNOTES TO CONSOLIDATED FINANCIAL STATEMENTS
FOR THE YEARS ENDED DECEMBER 31, 2020 AND 2019(Amounts in thousands)
valuation allowance for $255 was recorded as of December 31, 2020 and $566 as of December 31,2019. A valuation allowance has been established against the net operating loss carryforwards whichhas been generated by our foreign jurisdictions.
As of December 31, 2020 and 2019, the Company had US state and net operating losscarryforwards of $0 and $156, respectively. These US state net operating loss carryforwards start toexpire in 2030. As of December 31, 2020 and 2019, the Company had net operating loss carryforwardsrelated to foreign operations of $22,290 and $22,290, respectively. These net operating losscarryforwards have various lives ranging from 10 years to indefinite carryforward periods.
As of December 31, 2020 and 2019, there were no liabilities for income tax uncertaintiesrecorded in the Company’s consolidated balance sheets. The Company did not recognize any intereston penalties related to income tax uncertainties in its consolidated balance sheets or consolidatedstatements of operations and comprehensive income for years ended December 31, 2020 and 2019.The Company is subject to income tax examinations by the IRS and various state and localjurisdictions for the open tax years between December 31, 2017 and December 31, 2020.
As of December 31, 2019, income taxes on undistributed earnings of the Company’s subsidiarieshave not been provided for as the Company planned to indefinitely reinvest these amounts, had theability to do so, and the cumulative undistributed foreign earnings were not material.
As of December 31, 2020, income taxes on undistributed earnings of the Company’s foreignsubsidiaries have not been provided for as the Company plans to indefinitely reinvest these amounts.The cumulative undistributed foreign earnings were not material as of December 31, 2020.
The COVID-19 pandemic has a global reach, and many countries are introducing measures thatprovide relief to taxpayers in a variety of ways. On March 27, 2020, President Trump signed theCoronavirus Aid, Relief and Economic Security Act (the “CARES Act”) into law to support businessesduring the COVID-19 pandemic, which included deferment of the employer portion of certain payrolltaxes, refundable payroll tax credits, and technical amendments to tax depreciation methods forqualified improvement property. Under ASC 740, entities are required to recognize the financialstatement effects of new tax legislation upon enactment, which in the U.S. federal jurisdiction is thedate the President signs the Bill into law. Accordingly, the enactment requires the recognition of thefinancial statement impacts of the new federal income tax law in the period that includes March 27,2020. The CARES Act did not have a material impact on the Company’s income tax provision for theyear ended December 31, 2020.
F-37

THE VITA COCO COMPANY, INC. AND SUBSIDIARIESNOTES TO CONSOLIDATED FINANCIAL STATEMENTS
FOR THE YEARS ENDED DECEMBER 31, 2020 AND 2019(Amounts in thousands)
17. Earnings Per Share
Basic and diluted earnings per share is calculated as follows:
Year Ended December 31,
2020 2019
Numerator:
Net income attributable to AMI . . . . . . . . . . . . . . . . . . . . . . . . . . . . . . . . . . . $ 32,660 $ 9,417Denominator:Weighted-average number of common shares used in earnings per
share—basic . . . . . . . . . . . . . . . . . . . . . . . . . . . . . . . . . . . . . . . . . . . . . . . . 58,501,170 56,968,730Effect of conversion of stock options . . . . . . . . . . . . . . . . . . . . . . . . . . . 109,655 183,820
Weighted-average number of common shares used in earnings pershare—diluted . . . . . . . . . . . . . . . . . . . . . . . . . . . . . . . . . . . . . . . . . . . . . . . 58,610,825 57,152,550
Earnings per share—basic . . . . . . . . . . . . . . . . . . . . . . . . . . . . . . . . . . . . . . . $ 0.56 $ 0.17
Earnings per share—diluted . . . . . . . . . . . . . . . . . . . . . . . . . . . . . . . . . . . . . $ 0.56 $ 0.16
The vested service warrants are exercisable for little consideration and all necessary conditionshave been satisfied. Accordingly, the calculation of weighted average common shares outstandingincludes vested service warrants, exercisable for a value of $0.000022, which consisted of 4,550 and123,760 weighted number of service warrants as of December 31, 2020 and 2019, respectively.
The exit warrants, which expire upon a liquidity event and only vest when proceeds from aliquidity event provide an annual internal rate of return of less than 30%, were not considered in thebasic and diluted earnings per share, as the contingency of a liquidity event has not occurred duringthe years ended December 31, 2020 and 2019.
The following potentially dilutive securities, prior to the use of the treasury stock method, havebeen excluded from the computation of diluted weighted-average number of common sharesoutstanding, as they would be anti-dilutive:
December 31,
2020 2019
Options to purchase common stock . . . . . . . . . . . . . . . . . . . . . . . . . . . . . . . . . . . 3,719,625 4,884,880
18. Employee Benefit Plan
Employees of the Company may participate in a defined contribution plan which qualifies underSection 401(k) of the Internal Revenue Code. Participating employees may contribute into a traditionalplan with pretax salary or into a Roth plan with after tax salary up to statutory limits. The Companymatches contributions up to 3% of each employee’s earnings, which vest over 2 years. Matchingcontributions were $372 and $329 for the years ended December 31, 2020 and 2019, respectively.
F-38

THE VITA COCO COMPANY, INC. AND SUBSIDIARIESNOTES TO CONSOLIDATED FINANCIAL STATEMENTS
FOR THE YEARS ENDED DECEMBER 31, 2020 AND 2019(Amounts in thousands)
19. Segment Reporting
The Company has two operating and reportable segments:
• Americas—The Americas segment is comprised primarily of US and Canada and derives itsrevenues from the marketing and distribution of various coconut water and non-coconut waterproducts (e.g., oil and milk). AMI’s Guayusa leaf products (Runa) and aluminum bottle cannedwater (Ever & Ever) are marketed only in the Americas segment.
• International—The International segment is comprised primarily of Europe, Middle East, andAsia Pacific, which includes the Company’s procurement arm, and derives its revenues fromthe marketing and distribution of various coconut water and non-coconut water products.
The Company’s Co-CEOs are the chief operating decision makers and evaluate segmentperformance primarily based on net sales and gross profit. All intercompany transactions between thesegments have been eliminated.
Information about the Company’s operations by operating segment as of and for the years endedDecember 31, 2020 and 2019 is as follows:
December 31, 2020
Americas International Consolidated
Net sales . . . . . . . . . . . . . . . . . . . . . . . . . . . . . . . . . . . . . . . . . . . . . . $262,899 $47,745 $310,644Gross profit . . . . . . . . . . . . . . . . . . . . . . . . . . . . . . . . . . . . . . . . . . . . 90,256 14,602 104,858Total segment assets . . . . . . . . . . . . . . . . . . . . . . . . . . . . . . . . . . . 139,452 44,409 183,861
December 31, 2019
Americas International Consolidated
Net sales . . . . . . . . . . . . . . . . . . . . . . . . . . . . . . . . . . . . . . . . . . . . . . $237,415 $46,534 $283,949Gross profit . . . . . . . . . . . . . . . . . . . . . . . . . . . . . . . . . . . . . . . . . . . . 80,718 12,270 92,988Total segment assets . . . . . . . . . . . . . . . . . . . . . . . . . . . . . . . . . . . 123,296 22,801 146,097
Reconciliation 2020 2019
Total gross profit . . . . . . . . . . . . . . . . . . . . . . . . . . . . . . . . . . . . . . . . . . . . . . . . . . . . . $104,858 $92,988Less:
Selling, general and administrative expenses . . . . . . . . . . . . . . . . . . . . . . 74,401 78,917Change in fair value of contingent consideration . . . . . . . . . . . . . . . . . . . . (16,400) 700
Income from operations . . . . . . . . . . . . . . . . . . . . . . . . . . . . . . . . . . . . . . . . . . . 46,857 13,371Less:
Unrealized loss on derivative instruments . . . . . . . . . . . . . . . . . . . . . . . . . 4,718 1,233Foreign currency/(loss) . . . . . . . . . . . . . . . . . . . . . . . . . . . . . . . . . . . . . . . . (1,848) (201)Interest income . . . . . . . . . . . . . . . . . . . . . . . . . . . . . . . . . . . . . . . . . . . . . . . (404) (225)Interest expense . . . . . . . . . . . . . . . . . . . . . . . . . . . . . . . . . . . . . . . . . . . . . . 791 1,163
Net income before provision for income taxes . . . . . . . . . . . . . . . . . . . . . . . . . 43,600 11,401
F-39

THE VITA COCO COMPANY, INC. AND SUBSIDIARIESNOTES TO CONSOLIDATED FINANCIAL STATEMENTS
FOR THE YEARS ENDED DECEMBER 31, 2020 AND 2019(Amounts in thousands)
Geographic Data:
The following table provides information related to the Company’s net revenues by country, whichis presented on the basis of the location that revenue from customers is recorded:
Year Ended December 31, 2020 2019
United States . . . . . . . . . . . . . . . . . . . . . . . . . . . . . . . . . . . . . . . . . . . . . . . . . . . . . . . $262,899 $237,415All other countries(1) . . . . . . . . . . . . . . . . . . . . . . . . . . . . . . . . . . . . . . . . . . . . . . . . . 47,745 46,534
Net sales . . . . . . . . . . . . . . . . . . . . . . . . . . . . . . . . . . . . . . . . . . . . . . . . . . . . . . . . . . $310,644 $283,949
(1) No individual country is greater than 10% of total net sales for the years ended December 31,2020 and 2019.
The following table provides information related to the Company’s property and equipment, net bycountry:
Year Ended December 31, 2020 2019
United States . . . . . . . . . . . . . . . . . . . . . . . . . . . . . . . . . . . . . . . . . . . . . . . . . . . . . . . . . . . $1,186 $1,457Ecuador . . . . . . . . . . . . . . . . . . . . . . . . . . . . . . . . . . . . . . . . . . . . . . . . . . . . . . . . . . . . . . . 953 956Singapore . . . . . . . . . . . . . . . . . . . . . . . . . . . . . . . . . . . . . . . . . . . . . . . . . . . . . . . . . . . . . . 445 683All other countries(1) . . . . . . . . . . . . . . . . . . . . . . . . . . . . . . . . . . . . . . . . . . . . . . . . . . . . . 296 303
Property and equipment, net . . . . . . . . . . . . . . . . . . . . . . . . . . . . . . . . . . . . . . . . . . . . . . $2,880 $3,399
(1) No individual country is greater than 10% of total property and equipment, net as ofDecember 31, 2020 and 2019.
20. Related-Party Transactions
Management Fees—The Company is subject to an arrangement with one of its stockholders foras long as such stockholder holds at least 5% of the Company’s capital stock. Pursuant to the terms ofthe amended arrangement, the Company is required to make fixed annual management fee paymentsof $281.
Loan to Employee—On September 18, 2019 the Company extended a five year promissory noteof $17,700 to its newly appointed President, in order for him to buy 1,739,010 shares of The Vita CocoCompany, Inc.’s common stock in conjunction with his employment agreement. The interest on thenote accrues annually at a rate of 1.78% with principal balance due at maturity. The purchase of theAMI shares occurred simultaneously with the commencement of the loan, as a result no funds wereactually disbursed by AMI. The purchased AMI shares are pledged as collateral to the loan until fullrepayment of the principal balance. On May 18, 2020, the Company amended the interest rate on thenote to 0.58%.
Distribution Agreement with Shareholder – On October 1, 2019 the Company entered into adistribution agreement with one of its stockholders, which currently extends through December 31,2021. The distribution agreement grants the stockholder the right to sell, resell and distributedesignated products supplied by the Company within a specified territory. The amount of revenue
F-40

THE VITA COCO COMPANY, INC. AND SUBSIDIARIESNOTES TO CONSOLIDATED FINANCIAL STATEMENTS
FOR THE YEARS ENDED DECEMBER 31, 2020 AND 2019(Amounts in thousands)
recognized related to this distribution agreement was $5,294 and $7,155 for the years endedDecember 31, 2020 and 2019, respectively. The amounts due from the stockholder in AccountsReceivable, net were $575 and $139 as of December 31, 2020 and 2019, respectively. Related to thisdistribution arrangement, the Company and the stockholder have a service agreement where theCompany shares in the compensation costs of the stockholder’s employee managing the Chinamarket. The Company recorded $132 and $46 for the years ended December 31, 2020 and 2019,respectively, in selling, general, and administrative expense for this service agreement.
21. Subsequent Events
The Company evaluated its consolidated financial statements for subsequent events throughJuly 16, 2021, the date the consolidated financial statements were available to be issued.
In January 2021, the Company entered into a Stock Purchase Agreement with RW VC S.a.r.l, f/k/a Vita Coco S.a.r.l (the “Seller”). The Company repurchased 5,192,005 shares of its own commonstock from the Seller at a purchase price of $9.63 per share, or an aggregate purchase price ofapproximately $50,000.
In May 2021, the Company amended its 2020 Credit Facility with Wells Fargo to (i) increase theavailability of its committed borrowings on the 2020 Credit Facility to $60,000 from $50,000, (ii) extendthe maturity date to May 21, 2026, and (iii) adjusted the spread on the LIBOR-based loans to a rangeof 1.00% to 1.75% depending on debt leverage.
In addition, in May 2021, the Company also entered into a Term Commitment Note with WellsFargo (“2021 Term Loan”) pursuant to the terms of the Credit Agreement entered into in connectionwith the 2020 Credit Facility. The 2021 Term Loan provides the Company with borrowings of $30,000.The Company bears interest on the 2021 Term Loan at the same rate as the 2020 Credit Facility. TheCompany is required to repay the principal on the 2021 Term Loan in quarterly installments,commencing on October 1, 2021 through maturity date of May 21, 2026.
On October 11, 2021, the Company filed a Certificate of Amendment to its Amended andRestated Certificate of Incorporation, as amended, with the Secretary of State of the State ofDelaware, pursuant to which, the Company effected a 455-for-1 forward stock split (the “Stock Split”) ofthe Company’s authorized, issued and outstanding common stock, and increased the authorized shareof our common stock to 500,000,000 shares. The Stock Split was approved by the Company’s Boardof Directors on October 11, 2021. All share amounts and per share data presented in theaccompanying Consolidated Financial Statements have been retrospectively adjusted to reflect theforward stock split for all periods presented.
******
F-41

THE VITA COCO COMPANY, INC. AND SUBSIDIARIESCONDENSED CONSOLIDATED BALANCE SHEETS (UNAUDITED)
(Amounts in thousands, except share data)
June 30,2021
December 31,2020
AssetsCurrent assets:
Cash and cash equivalents . . . . . . . . . . . . . . . . . . . . . . . . . . . . . . . . . . . . . . $ 19,488 $ 72,181Accounts receivable, net of allowance of $1,233 at June 30, 2021, and
$1,211 at December 31, 2020 . . . . . . . . . . . . . . . . . . . . . . . . . . . . . . . . . 62,343 30,504Inventory . . . . . . . . . . . . . . . . . . . . . . . . . . . . . . . . . . . . . . . . . . . . . . . . . . . . . 46,621 31,967Supplier advances . . . . . . . . . . . . . . . . . . . . . . . . . . . . . . . . . . . . . . . . . . . . . 987 1,190Derivative assets . . . . . . . . . . . . . . . . . . . . . . . . . . . . . . . . . . . . . . . . . . . . . . — 200Prepaid expenses and other current assets . . . . . . . . . . . . . . . . . . . . . . . . 22,030 23,105
Total current assets . . . . . . . . . . . . . . . . . . . . . . . . . . . . . . . . . . . . . . . . 151,469 159,147Property and equipment, net . . . . . . . . . . . . . . . . . . . . . . . . . . . . . . . . . . . . . . . . 2,484 2,880Goodwill . . . . . . . . . . . . . . . . . . . . . . . . . . . . . . . . . . . . . . . . . . . . . . . . . . . . . . . . . 7,791 7,791Intangible assets, net . . . . . . . . . . . . . . . . . . . . . . . . . . . . . . . . . . . . . . . . . . . . . . 8,544 9,154Supplier advances . . . . . . . . . . . . . . . . . . . . . . . . . . . . . . . . . . . . . . . . . . . . . . . . . 2,925 2,925Other assets . . . . . . . . . . . . . . . . . . . . . . . . . . . . . . . . . . . . . . . . . . . . . . . . . . . . . 1,936 1,964
Total assets . . . . . . . . . . . . . . . . . . . . . . . . . . . . . . . . . . . . . . . . . . . . . . $175,149 $183,861
Liabilities and Stockholders’ EquityCurrent liabilities:
Accounts payable . . . . . . . . . . . . . . . . . . . . . . . . . . . . . . . . . . . . . . . . . . . . . $ 24,139 $ 15,837Accrued expenses . . . . . . . . . . . . . . . . . . . . . . . . . . . . . . . . . . . . . . . . . . . . . 47,341 34,482Notes payable, current . . . . . . . . . . . . . . . . . . . . . . . . . . . . . . . . . . . . . . . . . 3,244 22Derivative liabilities . . . . . . . . . . . . . . . . . . . . . . . . . . . . . . . . . . . . . . . . . . . . 1,949 5,364
Total current liabilities . . . . . . . . . . . . . . . . . . . . . . . . . . . . . . . . . . . . . . 76,673 55,705Credit facility . . . . . . . . . . . . . . . . . . . . . . . . . . . . . . . . . . . . . . . . . . . . . . . . . . . . . 8,000 25,000Notes payable . . . . . . . . . . . . . . . . . . . . . . . . . . . . . . . . . . . . . . . . . . . . . . . . . . . . 26,840 34Deferred tax liability . . . . . . . . . . . . . . . . . . . . . . . . . . . . . . . . . . . . . . . . . . . . . . . . 347 342Other long-term liabilities . . . . . . . . . . . . . . . . . . . . . . . . . . . . . . . . . . . . . . . . . . . 275 481
Total liabilities . . . . . . . . . . . . . . . . . . . . . . . . . . . . . . . . . . . . . . . . . . . . . 112,135 81,562Commitments and contingencies (Note 7)Stockholders’ equity:Common stock, $0.01 par value; 455,000,000 shares authorized; 59,202,325
and 59,200,050 shares issued at June 30, 2021 and December 31, 2020,respectively 52,996,125 and 58,185,855 shares outstanding at June 30,2021 and December 31, 2020, respectively . . . . . . . . . . . . . . . . . . . . . . . . . . 592 592
Additional paid-in capital . . . . . . . . . . . . . . . . . . . . . . . . . . . . . . . . . . . . . . . . . . . . 101,880 100,849Loan to stockholder . . . . . . . . . . . . . . . . . . . . . . . . . . . . . . . . . . . . . . . . . . . . . . . . (17,751) (17,700)Retained earnings . . . . . . . . . . . . . . . . . . . . . . . . . . . . . . . . . . . . . . . . . . . . . . . . 37,796 28,354Accumulated other comprehensive loss . . . . . . . . . . . . . . . . . . . . . . . . . . . . . . . (637) (949)Treasury stock, 6,206,200 shares at cost as of June 30, 2021, and 1,014,195
shares at cost as of December 31, 2020 . . . . . . . . . . . . . . . . . . . . . . . . . . . . . (58,928) (8,925)
Total stockholders’ equity attributable to AMI . . . . . . . . . . . . . . . . . . . 62,952 102,221Noncontrolling interests . . . . . . . . . . . . . . . . . . . . . . . . . . . . . . . . . . . . . . . . . . . . 62 78
Total stockholders’ equity . . . . . . . . . . . . . . . . . . . . . . . . . . . . . . . . . . . 63,014 102,299
Total liabilities and stockholders’ equity . . . . . . . . . . . . . . . . . . . . . . . . $175,149 $183,861
See accompanying notes to the condensed consolidated financial statements.
F-42

THE VITA COCO COMPANY, INC. AND SUBSIDIARIESCONDENSED CONSOLIDATED STATEMENTS OF OPERATIONS (UNAUDITED)
(Amounts in thousands, except for share and per share data)
Six Months Ended June 30,
2021 2020
Net sales . . . . . . . . . . . . . . . . . . . . . . . . . . . . . . . . . . . . . . . . . . . . . . . . . . . . . $ 177,260 $ 153,806Cost of goods sold . . . . . . . . . . . . . . . . . . . . . . . . . . . . . . . . . . . . . . . . . . . . . 124,200 100,872
Gross profit . . . . . . . . . . . . . . . . . . . . . . . . . . . . . . . . . . . . . . . . . . . 53,060 52,934
Operating expensesSelling, general and administrative . . . . . . . . . . . . . . . . . . . . . . . . . . . . 41,222 36,401
Income from operations . . . . . . . . . . . . . . . . . . . . . . . . . . . . . . . . . . . . . . . . . 11,838 16,533
Other income (expense)Unrealized gain/(loss) on derivative instruments . . . . . . . . . . . . . . . . . 3,214 (7,396)Foreign currency gain/(loss) . . . . . . . . . . . . . . . . . . . . . . . . . . . . . . . . . . (1,530) 362Interest income . . . . . . . . . . . . . . . . . . . . . . . . . . . . . . . . . . . . . . . . . . . . 73 183Interest expense . . . . . . . . . . . . . . . . . . . . . . . . . . . . . . . . . . . . . . . . . . . (192) (752)
Total other expense . . . . . . . . . . . . . . . . . . . . . . . . . . . . . . . . . . . . . 1,565 (7,603)
Income before income taxes . . . . . . . . . . . . . . . . . . . . . . . . . . . . . . . . . . . . . 13,403 8,930Income tax expense . . . . . . . . . . . . . . . . . . . . . . . . . . . . . . . . . . . . . . . . . . . . (3,981) (2,352)
Net income . . . . . . . . . . . . . . . . . . . . . . . . . . . . . . . . . . . . . . . . . . . . . . . . . . . $ 9,422 $ 6,578Net income/(loss) attributable to noncontrolling interest . . . . . . . . . . . (20) 11
Net income attributable to AMI . . . . . . . . . . . . . . . . . . . . . . . . . . . . . . . . . . . $ 9,442 $ 6,567Net income attributable to AMI per common share
Basic . . . . . . . . . . . . . . . . . . . . . . . . . . . . . . . . . . . . . . . . . . . . . . . . . . . . $ 0.18 $ 0.11
Diluted . . . . . . . . . . . . . . . . . . . . . . . . . . . . . . . . . . . . . . . . . . . . . . . . . . . $ 0.18 $ 0.11
Weighted-average number of common shares outstandingBasic . . . . . . . . . . . . . . . . . . . . . . . . . . . . . . . . . . . . . . . . . . . . . . . . . . . . 53,398,800 58,602,180
Diluted . . . . . . . . . . . . . . . . . . . . . . . . . . . . . . . . . . . . . . . . . . . . . . . . . . . 53,842,425 58,736,860
See accompanying notes to the condensed consolidated financial statements.
F-43

THE VITA COCO COMPANY, INC. AND SUBSIDIARIESCONDENSED CONSOLIDATED STATEMENTS OF COMPREHENSIVE INCOME
(UNAUDITED)(Amounts in thousands)
Six Months Ended June 30,
2021 2020
Net income . . . . . . . . . . . . . . . . . . . . . . . . . . . . . . . . . . . . . . . . . . . . . . . . . . . . . . . 9,422 6,578Other comprehensive income:
Foreign currency translation adjustment . . . . . . . . . . . . . . . . . . . . . . . . . . . 316 (845)
Total comprehensive income including noncontrolling interest . . . . . . . . . . . . . 9,738 5,733Net income (loss) attributable to noncontrolling interest . . . . . . . . . . . . . . . (20) 11Foreign currency translation adjustment attributable to noncontrolling
interest . . . . . . . . . . . . . . . . . . . . . . . . . . . . . . . . . . . . . . . . . . . . . . . . . . . . 4 2
Total comprehensive income (loss) attributable to noncontrolling interest . . . . (16) 13
Total comprehensive income attributable to AMI . . . . . . . . . . . . . . . . . . . . . . . . $9,754 $5,720
See accompanying notes to the condensed consolidated financial statements
F-44

TH
EV
ITA
CO
CO
CO
MP
AN
Y,I
NC
.AN
DS
UB
SID
IAR
IES
CO
ND
EN
SE
DC
ON
SO
LID
AT
ED
ST
AT
EM
EN
TS
OF
NO
N-C
ON
TR
OL
LIN
GIN
TE
RE
ST
SA
ND
ST
OC
KH
OL
DE
RS
’EQ
UIT
Y(U
NA
UD
ITE
D)
(Am
ou
nts
inth
ou
san
ds)
Co
mm
on
Sto
ck
Co
mm
on
Sto
ckw
ith
Exi
tW
arra
nts
To
talC
om
mo
nS
tock
Ad
dit
ion
alP
aid
-In
Cap
ital
Lo
anto
Sh
areh
old
er
Ret
ain
edE
arn
ing
s(A
ccu
mu
late
dD
efic
it)
Acc
um
ula
ted
Oth
erC
om
pre
hen
sive
Inco
me
/(L
oss
)
Tre
asu
ryS
tock
To
tal
Sto
ckh
old
ers’
Eq
uit
yA
ttri
bu
tab
leto
AM
I
No
n-
con
tro
llin
gIn
tere
stin
Su
bsi
dia
ry
To
tal
Sto
ckh
old
ers’
Eq
uit
yS
har
es$
Am
ou
nt
Sh
ares
$A
mo
un
tS
har
es$
Am
ou
nt
Sh
ares
Am
ou
nt
Bal
ance
atD
ecem
ber
31,
2019
....
....
50,7
93,4
70$5
088,
113,
105
$81
58,9
06,5
75$5
89$
98,4
50(1
7,70
0)$(
4,30
6)$(
1,29
5)21
1,57
5$(
1,98
5)$7
3,75
3$4
6$7
3,79
9
Net
inco
me
....
——
——
——
——
6,56
7—
——
6,56
711
6,57
8P
urch
ase
oftr
easu
ryst
ock
....
....
——
——
——
——
——
315,
770
(4,2
39)
(4,2
39)
—(4
,239
)Lo
anto
Sha
reho
lder
..—
——
——
——
(133
)—
——
—(1
33)
—(1
33)
Sto
ck-b
ased
com
pens
atio
nex
pens
e..
...
——
——
——
827
——
——
—82
7—
827
Exe
rcis
eof
stoc
kop
tions
....
..16
3,80
02
——
163,
800
282
2—
——
——
824
—82
4E
xerc
ise
ofse
rvic
ew
arra
nts
....
.11
6,02
51
——
116,
025
11
1F
orei
gncu
rren
cytr
ansl
atio
nad
just
men
t..
.—
——
——
——
——
(847
)—
—(8
47)
2(8
45)
Bal
ance
atJu
ne
30,
2020
....
....
51,0
73,2
95$5
118,
113,
105
$81
59,1
86,4
00$
592
$10
0,09
9$
(17,
833)
$2,
261
$(2
,142
)52
7,34
5$
(6,2
24)
$76
,753
$59
$76
,812
F-45

TH
EV
ITA
CO
CO
CO
MP
AN
Y,I
NC
.AN
DS
UB
SID
IAR
IES
CO
ND
EN
SE
DC
ON
SO
LID
AT
ED
ST
AT
EM
EN
TS
OF
NO
N-C
ON
TR
OL
LIN
GIN
TE
RE
ST
SA
ND
ST
OC
KH
OL
DE
RS
’EQ
UIT
Y(C
ON
TIN
UE
D)
(UN
AU
DIT
ED
)(A
mo
un
tsin
tho
usa
nd
s)
Co
mm
on
Sto
ck
Co
mm
on
Sto
ckw
ith
Exi
tW
arra
nts
To
talC
om
mo
nS
tock
Ad
dit
ion
alP
aid
-In
Cap
ital
Lo
anto
Sh
areh
old
er
Ret
ain
edE
arn
ing
s(A
ccu
mu
late
dD
efic
it)
Acc
um
ula
ted
Oth
erC
om
pre
hen
sive
Inco
me
/(L
oss
)
Tre
asu
ryS
tock
To
tal
Sto
ckh
old
ers’
Eq
uit
yA
ttri
bu
tab
leto
AM
I
No
n-
con
tro
llin
gIn
tere
stin
Su
bsi
dia
ry
To
tal
Sto
ckh
old
ers’
Eq
uit
yS
har
es$
Am
ou
nt
Sh
ares
$A
mo
un
tS
har
es$
Am
ou
nt
Sh
ares
Am
ou
nt
Bal
ance
atD
ecem
ber
31,
2020
....
....
....
51,0
86,9
45$5
118,
113,
105
$81
59,2
00,0
50$5
92$1
00,8
49(1
7,70
0)$2
8,35
4$(
949)
1,01
4,19
5$
(8,9
25)
$102
,221
$78
$102
,299
Net
inco
me
....
....
——
——
——
——
9,44
2—
——
9,44
2(2
0)9,
422
Pur
chas
eof
trea
sury
stoc
k..
....
....
..—
——
——
——
——
—5,
192,
005
(50,
003)
(50,
003)
—(5
0,00
3)Lo
anto
Sha
reho
lder
....
..—
——
——
——
(51)
——
——
(51)
—(5
1)S
tock
-bas
edco
mpe
nsat
ion
expe
nse
....
....
.—
——
——
—1,
012
——
——
—1,
012
—1,
012
Exe
rcis
eof
stoc
kop
tions
....
....
..2,
275
——
—2,
275
—19
——
——
—19
—19
For
eign
curr
ency
tran
slat
ion
adju
stm
ent
....
...
——
——
——
——
—31
2—
—31
24
316
Bal
ance
atJu
ne
30,
2021
....
....
....
51,0
89,2
20$5
118,
113,
105
$81
59,2
02,3
25$5
92$1
01,8
80$(
17,7
51)
$37,
796
$(63
7)6,
206,
200
$(58
,928
)$
62,9
52$
62$
63,0
14
See
acco
mpa
nyin
gno
tes
toth
eco
nden
sed
cons
olid
ated
finan
cial
stat
emen
ts.
F-46

THE VITA COCO COMPANY, INC. AND SUBSIDIARIESCONDENSED CONSOLIDATED STATEMENTS OF CASH FLOWS (UNAUDITED)
(Amounts in thousands)
Six MonthsEnded June 30,
2021 2020
Cash flows from operating activities:Net income . . . . . . . . . . . . . . . . . . . . . . . . . . . . . . . . . . . . . . . . . . . . . . . . . . . . . 9,422 6,578Adjustments to reconcile net income to net cash provided by operating
activities:Depreciation and amortization . . . . . . . . . . . . . . . . . . . . . . . . . . . . . . . . . 1,044 1,028(Gain)/Loss on disposal of equipment . . . . . . . . . . . . . . . . . . . . . . . . . . . 42 (14)Bad debt expense . . . . . . . . . . . . . . . . . . . . . . . . . . . . . . . . . . . . . . . . . . . 66 38Unrealized (gain)/loss on derivative instruments . . . . . . . . . . . . . . . . . . . (3,214) 7,396Stock-based compensation . . . . . . . . . . . . . . . . . . . . . . . . . . . . . . . . . . . . 1,012 827Impairment of intangible assets . . . . . . . . . . . . . . . . . . . . . . . . . . . . . . . . — 90Deferred tax expense . . . . . . . . . . . . . . . . . . . . . . . . . . . . . . . . . . . . . . . . 5 —
Changes in operating assets and liabilities:Accounts receivable . . . . . . . . . . . . . . . . . . . . . . . . . . . . . . . . . . . . . . (31,930) (24,512)Inventory . . . . . . . . . . . . . . . . . . . . . . . . . . . . . . . . . . . . . . . . . . . . . . . (14,639) 9,185Prepaid expenses and other assets . . . . . . . . . . . . . . . . . . . . . . . . . 1,245 (4,361)Accounts payable, accrued expenses, and other long-term
liabilities . . . . . . . . . . . . . . . . . . . . . . . . . . . . . . . . . . . . . . . . . . . . . . 20,968 17,616Net advances to suppliers . . . . . . . . . . . . . . . . . . . . . . . . . . . . . . . . . 207 (3,250)
Net cash provided by (used in) operating activities . . . . . . . . . (15,772) 10,621
Cash flows from investing activities:Cash paid for property and equipment . . . . . . . . . . . . . . . . . . . . . . . . . . . . . . . (84) (173)Proceeds from sale of property and equipment . . . . . . . . . . . . . . . . . . . . . . . — 14
Net cash (used in) investing activities . . . . . . . . . . . . . . . . . . . . (84) (159)
Cash flows from financing activities:Proceeds from exercise of stock options/warrants . . . . . . . . . . . . . . . . . . . . . 19 825Borrowings on credit facility . . . . . . . . . . . . . . . . . . . . . . . . . . . . . . . . . . . . . . . 13,000 15,952Repayments of borrowings on credit facility . . . . . . . . . . . . . . . . . . . . . . . . . . (30,000) (15,952)Cash received (paid) on notes payable . . . . . . . . . . . . . . . . . . . . . . . . . . . . . . 30,029 (16,885)Cash paid to acquire treasury stock . . . . . . . . . . . . . . . . . . . . . . . . . . . . . . . . . (50,003) (4,239)
Net cash used in financing activities . . . . . . . . . . . . . . . . . . . . . (36,955) (20,299)
Effects of exchange rate changes on cash and cash equivalents . . . . . . . . . . . . . 118 (212)
Net decrease in cash and cash equivalents . . . . . . . . . . . . . . . . . . . . . . . . . . . . . . (52,693) (10,049)Cash and cash equivalents at beginning of year . . . . . . . . . . . . . . . . . . . . . . . . . . 72,181 36,740
Cash and cash equivalents at end of the year . . . . . . . . . . . . . . . . . . . . . . . . . . . . $ 19,488 $ 26,691
Supplemental disclosures of cash flow information:Cash paid for income taxes . . . . . . . . . . . . . . . . . . . . . . . . . . . . . . . . . . . . . . . . . . . $ 977 $ 485Cash paid for interest . . . . . . . . . . . . . . . . . . . . . . . . . . . . . . . . . . . . . . . . . . . . . . . . $ 88 $ 751
See accompanying notes to the condensed consolidated financial statements.
F-47
THE VITA COCO COMPANY, INC. AND SUBSIDIARIESNOTES TO CONDENSED CONSOLIDATED FINANCIAL STATEMENTS (UNAUDITED)
(Amounts in thousands, except share and per share amounts)
1. NATURE OF BUSINESS AND BASIS OF PRESENTATION
The Vita Coco Company, Inc. and subsidiaries (formerly known as All Market Inc.) (the“Company”) develops, markets, and distributes various coconut water products under the brand name,Vita Coco and for Retailers own brands, predominantly in the United States. Other products includecoconut oil, coconut milk, coconut as a commodity, natural energy drink (under the brand name, Runa)and water (under the brand name, Ever & Ever).
The Company was incorporated in Delaware January 17, 2007. In 2018, the Company purchasedcertain assets and liabilities of Runa, which is marketed and distributed primarily in the United States.
The Company has nine wholly-owned subsidiaries including four wholly-owned Asian subsidiariesestablished between fiscal 2012 and 2015, one North American subsidiary established in 2015, as wellas majority ownership in All Market Europe, Ltd. (AME) in the United Kingdom. AME was established infiscal 2009 and has 100% ownership in two European subsidiaries established in 2015. Thenoncontrolling interest in AME represents minority stockholders’ proportionate share (1.3%) of theequity in AME. The noncontrolling interest is presented in the equity section of the Company’scondensed consolidated balance sheets. One of the wholly-owned Asian subsidiaries, All MarketSingapore Pte Ltd (AMS), has 100% ownership in one subsidiary, established in 2018 in Ecuador.
Stock Split and Authorized Shares
On October 11, 2021, the Company’s Board of Directors and stockholders approved an amendedand restated certificate of incorporation of the Company effecting a 455-for-1 stock split of theCompany’s issued and outstanding shares of common stock, and an increase to the authorized sharesof our common stock to 500,000,000 shares. The split was effected on October 11, 2021 and withoutany change in the par value per share. All information related to the Company’s common stock andstock awards has been retrospectively adjusted to give effect to the 455-for-1 stock split, without anychange in the par value per share.
Impact of the Covid-19 Pandemic
On March 11, 2020, the World Health Organization declared the recent novel coronavirus(“COVID-19”) outbreak a pandemic. In response to the outbreak many jurisdictions, including those inwhich the Company has locations, have implemented measures to combat the outbreak, such as travelrestrictions and shelter in place orders. The global spread and unprecedented impact of COVID-19continues to create significant volatility, uncertainty and economic disruption.
The COVID-19 pandemic has caused general business disruption worldwide beginning inJanuary 2020. The full extent to which the COVID-19 pandemic will directly or indirectly impact theCompany’s cash flow, business, financial condition, results of operations and prospects will depend onfuture developments, including the duration, spread and intensity of the pandemic (including anyresurgences), impact of the new COVID-19 variants and the rollout of COVID-19 vaccines, and thelevel of social and economic restrictions imposed in the United States and abroad in an effort to curbthe spread of the virus, all of which are uncertain and difficult to predict considering the rapidly evolvinglandscape. The Company has experienced some impacts on inventory availability and deliverycapacity since the outbreak which have impacted, at times, the Company’s ability to fully service itscustomers, including temporary facility shutdowns, local transportation interruptions, and general
F-48

THE VITA COCO COMPANY, INC. AND SUBSIDIARIESNOTES TO CONDENSED CONSOLIDATED FINANCIAL STATEMENTS (UNAUDITED)
(Amounts in thousands, except share and per share amounts)
pressure on global shipping lines. The Company has taken measures to bolster key aspects of itssupply chain and the Company continues to work with its supply chain partners to try to ensure itsability to service its customers. The Company has also seen significant cost inflation to global shippingcosts and some inflationary pressures on other cost elements, only some of which have been coveredby pricing actions to date. The Company is continuing to monitor the situation carefully to understandany future potential impact on its people and business. The Company is taking all necessary steps toprotect its people and mitigate any risk to its business. As a result, it is not currently possible toascertain the overall impact of COVID-19 on the Company’s business, results of operations, financialcondition or liquidity. Future events and effects related to COVID-19 cannot be determined withprecision and actual results could significantly differ from estimates or forecasts.
Unaudited interim financial information
The Company’s condensed consolidated interim financial statements are prepared in accordancewith accounting principles generally accepted in the United States of America (“U.S. GAAP”) andArticle 10 of the Securities and Exchange Commission’s, Regulation S-X. As permitted under thoserules, certain footnotes or other financial information that are normally required by U.S. GAAP, can becondensed or omitted. In the opinion of the Company, the accompanying unaudited condensedconsolidated financial statements contain all adjustments, consisting of only normal recurringadjustments, necessary for a fair presentation of the Company’s financial information for the interimperiod presented. These interim results are not necessarily indicative of the results to be expected forthe year ending December 31, 2021 or for any other interim period or for any other future year. Thecondensed consolidated balance sheet as of June 30, 2021 is unaudited and should be read inconjunction with the audited consolidated financial statements and the related notes thereto for thefiscal year ended December 31, 2020.
During the six months ended June 30, 2021, there were no significant changes to the Company’ssignificant accounting policies as described in the Company’s audited consolidated financial statementas of and for the year ended December 31, 2020.
2. SUMMARY OF SIGNIFICANT ACCOUNTING POLICIES
Basis of Presentation
The accompanying condensed consolidated financial statements are presented in accordancewith accounting principles generally accepted in the United States of America (“U.S. GAAP”).
Principles of Consolidation
The condensed consolidated financial statements include all the accounts of the wholly ownedsubsidiaries. All intercompany accounts and transactions have been eliminated in consolidation; thenoncontrolling interest in consolidated subsidiaries presented in the accompanying condensedconsolidated financial statements represents the portion of AME stockholders’ equity, which is notdirectly owned by the Company.
Use of Estimates
Preparation of condensed consolidated financial statements in conformity with U.S. GAAPrequires management to make estimates and assumptions that affect the reported amounts of assetsand liabilities and disclosure of contingent assets and liabilities at the date of the condensedconsolidated financial statements and the reported amounts of revenues and expenses during the
F-49

THE VITA COCO COMPANY, INC. AND SUBSIDIARIESNOTES TO CONDENSED CONSOLIDATED FINANCIAL STATEMENTS (UNAUDITED)
(Amounts in thousands, except share and per share amounts)
reporting period. Management considers many factors in selecting appropriate financial accountingpolicies and controls in developing the estimates and assumptions that are used in the preparation ofthese condensed consolidated financial statements. Management must apply significant judgment inthis process. In addition, other factors may affect estimates, including expected business andoperational changes, sensitivity and volatility associated with the assumptions used in developingestimates, and whether historical trends are expected to be representative of future trends. Theestimation process often may yield a range of reasonable estimates of the ultimate future outcomes,and management must select an amount that falls within that range of reasonable estimates. The mostsignificant estimates in the condensed consolidated financial statements relate to share-basedcompensation, assessing long-lived assets for impairment, estimating the net realizable value ofinventories, the determination of accounts receivables reserve, assessing goodwill for impairment, thedetermination of the value of trade promotions and assessing the realizability of deferred income taxes.Actual results could differ from those estimates.
Deferred Offering Costs
The Company capitalizes certain legal, professional accounting and other third-party fees that aredirectly associated with in-process equity financings as deferred offering costs until such financings areconsummated. After consummation of an equity financing, these costs are recorded in stockholders’equity as a reduction of additional paid-in capital generated as a result of the offering. If an in-processequity financing is abandoned, the deferred offering costs will be expensed immediately as a charge tooperating expenses in the condensed consolidated statements of operations. As of June 30, 2021,there was $715 of deferred offering costs capitalized and included in other current assets in thecondensed consolidated balance sheets. There were no deferred offering costs capitalized as ofDecember 31, 2020.
Concentration of Credit Risk
The Company’s cash and accounts receivable are subject to concentrations of credit risk. TheCompany’s cash balances are primarily on deposit with banks in the U.S. which are guaranteed by theFederal Deposit Insurance Corporation (FDIC) up to $250. At times, such cash may be in excess of theFDIC insurance limit. To minimize the risk, the Company’s policy is to maintain cash balances with highquality financial institutions and any excess cash above a certain minimum balance could be investedin overnight money market treasury deposits in widely diversified accounts. Substantially all of theCompany’s customers are either wholesalers or retailers of beverages. A material default in payment,a material reduction in purchase from these or any large customers, or the loss of a large customer orcustomer groups could have a material adverse impact on the Company’s financial condition, results ofoperations, and liquidity. The Company is exposed to concentration of credit risk from its majorcustomers for which two customers represented 54% and 55% of total net sales for the six monthsended June 30, 2021 and 2020, respectively. In addition, the two customers also accounted for 41%and 38% of total accounts receivable as of June 30, 2021 and December 31, 2020, respectively. TheCompany has not experienced credit issues with these customers.
Recently Adopted Accounting Pronouncements
In August 2018, the FASB issued ASU 2018-15, Intangibles—Goodwill and Other—Internal-UseSoftware (Subtopic 350-40). The update is associated with customer’s accounting for implementationcosts incurred in a cloud computing arrangement that is a service contract. The standard aligns therequirements for capitalizing implementation costs incurred in a hosting arrangement that is a service
F-50

THE VITA COCO COMPANY, INC. AND SUBSIDIARIESNOTES TO CONDENSED CONSOLIDATED FINANCIAL STATEMENTS (UNAUDITED)
(Amounts in thousands, except share and per share amounts)
contract with the requirements for capitalizing implementation costs incurred to develop or obtaininternal-use software. The amendments in this update require that a customer in a hostingarrangement that is a service contract follow the guidance in Subtopic 350-40 to determine whichimplementation costs should be capitalized as an asset and which costs should be expensed andstates that any capitalized implementation costs should be expensed over the term of the hostingarrangement. The guidance is effective for the Company for fiscal years beginning after December 15,2020, and interim periods within annual periods beginning after December 15, 2021. The Companyadopted the guidance in this amendment using a prospective approach effective January 1, 2021 forthe December 31, 2021 fiscal year. The Company is currently evaluating the update to determine theimpact of adoption on the annual consolidated financial statements. The impact to the six monthsended June 30, 2021 was not material.
Recently Issued Accounting Pronouncements
As a company with less than $1.07 billion of revenue during the last fiscal year, the Companyqualifies as an “emerging growth company”, as defined in the Jumpstart Our Business Startups Act.This classification allows the Company to delay adoption of new or revised accountingpronouncements applicable to public companies until such pronouncements are made applicable toprivate companies. The Company has elected to use the adoption dates applicable to privatecompanies. As a result, the Company’s financial statements may not be comparable to the financialstatements of issuers who are required to comply with the effective date for new or revised accountingstandards that are applicable to public companies.
3. REVENUE RECOGNITION
Revenues are accounted for in accordance with ASC 606. The Company disaggregates revenueinto the following product categories:
• Vita Coco Coconut Water—This product category consists of all branded coconut waterproduct offerings under the Vita Coco labels, where the majority ingredient is coconut water.For these products, control is transferred upon customer receipt, at which point the Companyrecognizes the transaction price for the product as revenue.
• Private Label—This product category consists of all private label product offerings, whichincludes coconut water and oil. The Company determined the production and distribution ofprivate label products represents a distinct performance obligation. Since there is no alternativeuse for these products and the Company has the right to payment for performance completedto date, the Company recognizes the revenue for the production of these private label productsover time as the production for open purchase orders occurs, which may be prior to anyshipment.
Other—This product category consists of all other products, which includes Runa, Ever & Everand PWR LIFT product offerings, Vita Coco product extensions beyond coconut water, such asVita Coco Sparkling, coconut milk products, and other revenue transactions (e.g., bulk productsales). For these products, control is transferred upon customer receipt, at which point theCompany recognizes the transaction price for the product as revenue.
The Company excludes from revenues all taxes assessed by a governmental authority that areimposed on the sale of its products and collected from customers.
F-51
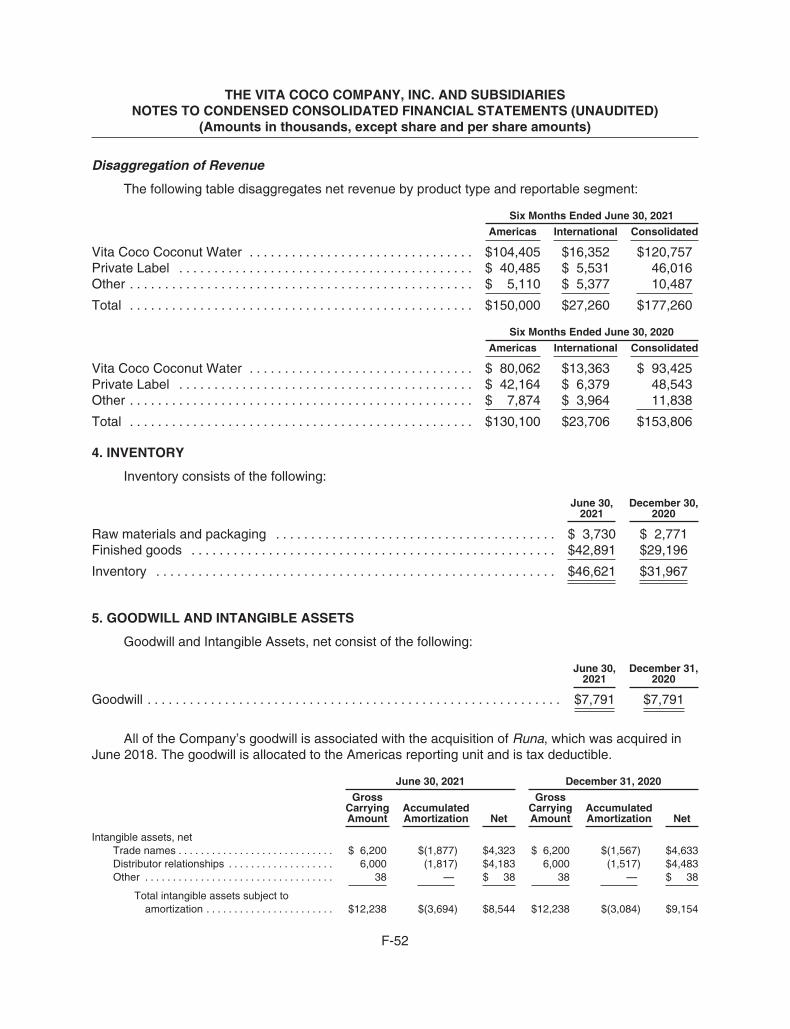
THE VITA COCO COMPANY, INC. AND SUBSIDIARIESNOTES TO CONDENSED CONSOLIDATED FINANCIAL STATEMENTS (UNAUDITED)
(Amounts in thousands, except share and per share amounts)
Disaggregation of Revenue
The following table disaggregates net revenue by product type and reportable segment:
Six Months Ended June 30, 2021
Americas International Consolidated
Vita Coco Coconut Water . . . . . . . . . . . . . . . . . . . . . . . . . . . . . . . . $104,405 $16,352 $120,757Private Label . . . . . . . . . . . . . . . . . . . . . . . . . . . . . . . . . . . . . . . . . . $ 40,485 $ 5,531 46,016Other . . . . . . . . . . . . . . . . . . . . . . . . . . . . . . . . . . . . . . . . . . . . . . . . . $ 5,110 $ 5,377 10,487
Total . . . . . . . . . . . . . . . . . . . . . . . . . . . . . . . . . . . . . . . . . . . . . . . . . $150,000 $27,260 $177,260
Six Months Ended June 30, 2020
Americas International Consolidated
Vita Coco Coconut Water . . . . . . . . . . . . . . . . . . . . . . . . . . . . . . . . $ 80,062 $13,363 $ 93,425Private Label . . . . . . . . . . . . . . . . . . . . . . . . . . . . . . . . . . . . . . . . . . $ 42,164 $ 6,379 48,543Other . . . . . . . . . . . . . . . . . . . . . . . . . . . . . . . . . . . . . . . . . . . . . . . . . $ 7,874 $ 3,964 11,838
Total . . . . . . . . . . . . . . . . . . . . . . . . . . . . . . . . . . . . . . . . . . . . . . . . . $130,100 $23,706 $153,806
4. INVENTORY
Inventory consists of the following:
June 30,2021
December 30,2020
Raw materials and packaging . . . . . . . . . . . . . . . . . . . . . . . . . . . . . . . . . . . . . . . . $ 3,730 $ 2,771Finished goods . . . . . . . . . . . . . . . . . . . . . . . . . . . . . . . . . . . . . . . . . . . . . . . . . . . . $42,891 $29,196
Inventory . . . . . . . . . . . . . . . . . . . . . . . . . . . . . . . . . . . . . . . . . . . . . . . . . . . . . . . . . $46,621 $31,967
5. GOODWILL AND INTANGIBLE ASSETS
Goodwill and Intangible Assets, net consist of the following:
June 30,2021
December 31,2020
Goodwill . . . . . . . . . . . . . . . . . . . . . . . . . . . . . . . . . . . . . . . . . . . . . . . . . . . . . . . . . . . $7,791 $7,791
All of the Company’s goodwill is associated with the acquisition of Runa, which was acquired inJune 2018. The goodwill is allocated to the Americas reporting unit and is tax deductible.
June 30, 2021 December 31, 2020
GrossCarryingAmount
AccumulatedAmortization Net
GrossCarryingAmount
AccumulatedAmortization Net
Intangible assets, netTrade names . . . . . . . . . . . . . . . . . . . . . . . . . . . . $ 6,200 $(1,877) $4,323 $ 6,200 $(1,567) $4,633Distributor relationships . . . . . . . . . . . . . . . . . . . 6,000 (1,817) $4,183 6,000 (1,517) $4,483Other . . . . . . . . . . . . . . . . . . . . . . . . . . . . . . . . . . 38 — $ 38 38 — $ 38
Total intangible assets subject toamortization . . . . . . . . . . . . . . . . . . . . . . . $12,238 $(3,694) $8,544 $12,238 $(3,084) $9,154
F-52

THE VITA COCO COMPANY, INC. AND SUBSIDIARIESNOTES TO CONDENSED CONSOLIDATED FINANCIAL STATEMENTS (UNAUDITED)
(Amounts in thousands, except share and per share amounts)
All the intangible assets, net as of June 30, 2021 and December 31, 2020 were associated withthe acquisition of Runa, which was acquired in June 2018.
Amortization expense of $610 for the six months ended June 30, 2021 and 2020 were included inselling, general and administrative expenses on the condensed consolidated statements of operations.
As of June 30, 2020, the estimated future expense for amortizable intangible assets is as follows:
Year ending December 31,2021 (excluding the six months ended June 30, 2021) . . . . . . . . . . . . . . . . . . . . . . . . . . . . . . . . . $ 6142022 . . . . . . . . . . . . . . . . . . . . . . . . . . . . . . . . . . . . . . . . . . . . . . . . . . . . . . . . . . . . . . . . . . . . . . . . . . 1,2242023 . . . . . . . . . . . . . . . . . . . . . . . . . . . . . . . . . . . . . . . . . . . . . . . . . . . . . . . . . . . . . . . . . . . . . . . . . . 1,2242024 . . . . . . . . . . . . . . . . . . . . . . . . . . . . . . . . . . . . . . . . . . . . . . . . . . . . . . . . . . . . . . . . . . . . . . . . . . 1,2242025 . . . . . . . . . . . . . . . . . . . . . . . . . . . . . . . . . . . . . . . . . . . . . . . . . . . . . . . . . . . . . . . . . . . . . . . . . . 1,224Thereafter . . . . . . . . . . . . . . . . . . . . . . . . . . . . . . . . . . . . . . . . . . . . . . . . . . . . . . . . . . . . . . . . . . . . . 3,034
$8,544
6. DEBT
The table below details the outstanding balances on the Company’s credit facility and notespayable as of June 30, 2021 and December 31, 2020:
June 30,2021
December 31,2020
2020 Credit facility . . . . . . . . . . . . . . . . . . . . . . . . . . . . . . . . . . . . . . . . . . . . . . . . . . $ 8,000 $25,000
Notes payable2021 Term Loan . . . . . . . . . . . . . . . . . . . . . . . . . . . . . . . . . . . . . . . . . . . . . . . . $30,000 $ —Vehicle loans . . . . . . . . . . . . . . . . . . . . . . . . . . . . . . . . . . . . . . . . . . . . . . . . . . 84 56
$30,084 $ 56
Current . . . . . . . . . . . . . . . . . . . . . . . . . . . . . . . . . . . . . . . . . . . . . . . . . . . . . . . 3,244 22
Non-current . . . . . . . . . . . . . . . . . . . . . . . . . . . . . . . . . . . . . . . . . . . . . . . . . . . $26,840 34
2020 Credit Facility
In May 2020, the Company entered into a five-year credit facility (“2020 Credit Facility”) withWells Fargo consisting of a revolving line of credit. The 2020 Credit Facility was further amended inMay 2021 and currently provides committed borrowings of $60 million. Borrowings on the 2020 CreditFacility bear interest at rates based on either London InterBank Offered Rate (LIBOR) or a specifiedbase rate, as selected periodically by the Company. The LIBOR-based loans bear interest at LIBORplus a spread ranging from 1.00% to 1.75% per annum, with the spread in each case being based onthe Company’s leverage ratio (as defined in the credit agreement). In addition, the Company is subjectto an unused commitment fee ranging from 0.05% and 0.15% on the unused amount of the line ofcredit, with the rate being based on the Company’s leverage ratio (as defined in the credit agreement).The maturity date on the 2020 Credit Facility is May 21, 2026.
F-53
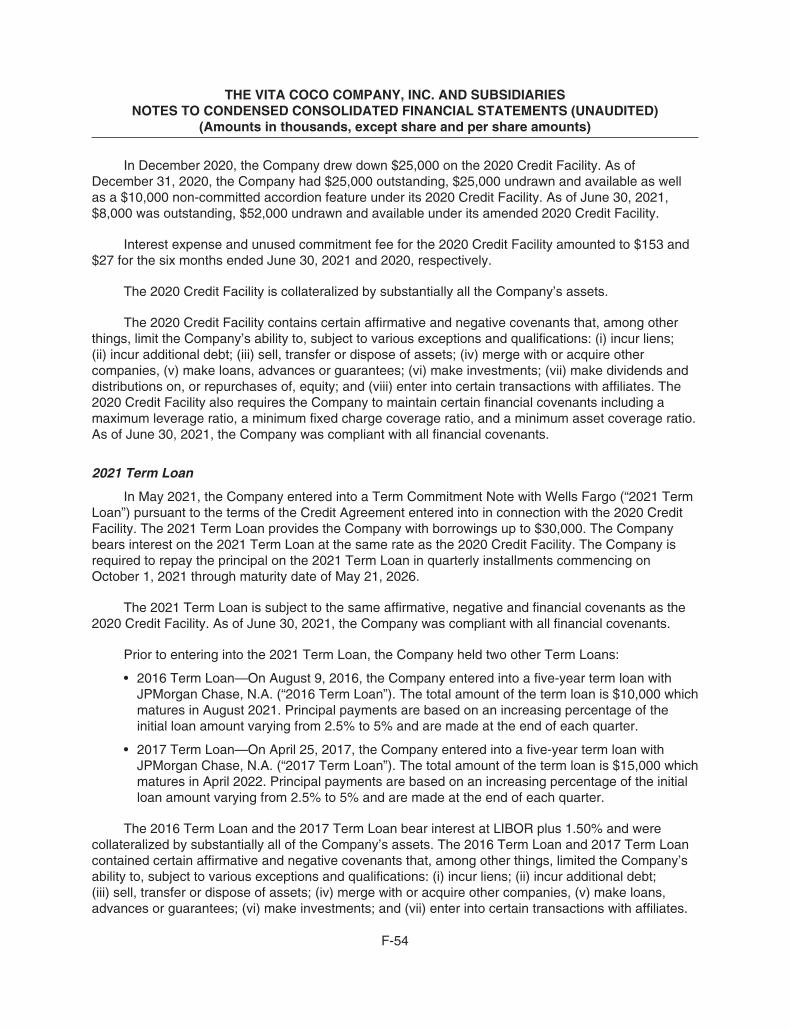
THE VITA COCO COMPANY, INC. AND SUBSIDIARIESNOTES TO CONDENSED CONSOLIDATED FINANCIAL STATEMENTS (UNAUDITED)
(Amounts in thousands, except share and per share amounts)
In December 2020, the Company drew down $25,000 on the 2020 Credit Facility. As ofDecember 31, 2020, the Company had $25,000 outstanding, $25,000 undrawn and available as wellas a $10,000 non-committed accordion feature under its 2020 Credit Facility. As of June 30, 2021,$8,000 was outstanding, $52,000 undrawn and available under its amended 2020 Credit Facility.
Interest expense and unused commitment fee for the 2020 Credit Facility amounted to $153 and$27 for the six months ended June 30, 2021 and 2020, respectively.
The 2020 Credit Facility is collateralized by substantially all the Company’s assets.
The 2020 Credit Facility contains certain affirmative and negative covenants that, among otherthings, limit the Company’s ability to, subject to various exceptions and qualifications: (i) incur liens;(ii) incur additional debt; (iii) sell, transfer or dispose of assets; (iv) merge with or acquire othercompanies, (v) make loans, advances or guarantees; (vi) make investments; (vii) make dividends anddistributions on, or repurchases of, equity; and (viii) enter into certain transactions with affiliates. The2020 Credit Facility also requires the Company to maintain certain financial covenants including amaximum leverage ratio, a minimum fixed charge coverage ratio, and a minimum asset coverage ratio.As of June 30, 2021, the Company was compliant with all financial covenants.
2021 Term Loan
In May 2021, the Company entered into a Term Commitment Note with Wells Fargo (“2021 TermLoan”) pursuant to the terms of the Credit Agreement entered into in connection with the 2020 CreditFacility. The 2021 Term Loan provides the Company with borrowings up to $30,000. The Companybears interest on the 2021 Term Loan at the same rate as the 2020 Credit Facility. The Company isrequired to repay the principal on the 2021 Term Loan in quarterly installments commencing onOctober 1, 2021 through maturity date of May 21, 2026.
The 2021 Term Loan is subject to the same affirmative, negative and financial covenants as the2020 Credit Facility. As of June 30, 2021, the Company was compliant with all financial covenants.
Prior to entering into the 2021 Term Loan, the Company held two other Term Loans:
• 2016 Term Loan—On August 9, 2016, the Company entered into a five-year term loan withJPMorgan Chase, N.A. (“2016 Term Loan”). The total amount of the term loan is $10,000 whichmatures in August 2021. Principal payments are based on an increasing percentage of theinitial loan amount varying from 2.5% to 5% and are made at the end of each quarter.
• 2017 Term Loan—On April 25, 2017, the Company entered into a five-year term loan withJPMorgan Chase, N.A. (“2017 Term Loan”). The total amount of the term loan is $15,000 whichmatures in April 2022. Principal payments are based on an increasing percentage of the initialloan amount varying from 2.5% to 5% and are made at the end of each quarter.
The 2016 Term Loan and the 2017 Term Loan bear interest at LIBOR plus 1.50% and werecollateralized by substantially all of the Company’s assets. The 2016 Term Loan and 2017 Term Loancontained certain affirmative and negative covenants that, among other things, limited the Company’sability to, subject to various exceptions and qualifications: (i) incur liens; (ii) incur additional debt;(iii) sell, transfer or dispose of assets; (iv) merge with or acquire other companies, (v) make loans,advances or guarantees; (vi) make investments; and (vii) enter into certain transactions with affiliates.
F-54

THE VITA COCO COMPANY, INC. AND SUBSIDIARIESNOTES TO CONDENSED CONSOLIDATED FINANCIAL STATEMENTS (UNAUDITED)
(Amounts in thousands, except share and per share amounts)
The Term Loan and Term Loan 2017 also required the Company to maintain certain financialcovenants including a maximum leverage ratio and a minimum fixed charge coverage ratio.
In May 2020, the Company paid off its 2016 Term Loan and the 2017 Term Loan in connectionwith entering into the 2020 Credit Facility.
Interest expense related to the 2016 Term Loan and 2017 Term Loan amounted to $188 for thesix months ended June 30, 2020.
Vehicle Loans
The Company periodically enters into vehicle loans. Interest rate on these vehicle loans rangefrom 4.56% to 5.68%. The Company is required to make principal payments of $2 on a monthly basis.
Aggregate principal payments on the notes payable for the next five years are as follows:
2021, six months remaining . . . . . . . . . . . . . . . . . . . . . . . . . . . . . . . . . . . . . . . . . . . . . . . . . . . . . . . 2,1582022 . . . . . . . . . . . . . . . . . . . . . . . . . . . . . . . . . . . . . . . . . . . . . . . . . . . . . . . . . . . . . . . . . . . . . . . . . . 4,3132023 . . . . . . . . . . . . . . . . . . . . . . . . . . . . . . . . . . . . . . . . . . . . . . . . . . . . . . . . . . . . . . . . . . . . . . . . . . 4,3072024 . . . . . . . . . . . . . . . . . . . . . . . . . . . . . . . . . . . . . . . . . . . . . . . . . . . . . . . . . . . . . . . . . . . . . . . . . . 4,2972025 . . . . . . . . . . . . . . . . . . . . . . . . . . . . . . . . . . . . . . . . . . . . . . . . . . . . . . . . . . . . . . . . . . . . . . . . . . 4,295Thereafter . . . . . . . . . . . . . . . . . . . . . . . . . . . . . . . . . . . . . . . . . . . . . . . . . . . . . . . . . . . . . . . . . . . . . 10,714
Total notes payable . . . . . . . . . . 30,084
7. COMMITMENTS AND CONTINGENCIES
Operating Leases—The aggregate minimum commitments for renting the office spaces undernon-cancellable operating leases as of June 30, 2021 are as follows:
Years Ending December 31,2021, six months remaining . . . . . . . . . . . . . . . . . . . . . . . . . . . . . . . . . . . . . . . . . . . . . . . . . . . . . . . $ 5732022 . . . . . . . . . . . . . . . . . . . . . . . . . . . . . . . . . . . . . . . . . . . . . . . . . . . . . . . . . . . . . . . . . . . . . . . . . . 1,0782023 . . . . . . . . . . . . . . . . . . . . . . . . . . . . . . . . . . . . . . . . . . . . . . . . . . . . . . . . . . . . . . . . . . . . . . . . . . 2192024 . . . . . . . . . . . . . . . . . . . . . . . . . . . . . . . . . . . . . . . . . . . . . . . . . . . . . . . . . . . . . . . . . . . . . . . . . . 1472025 . . . . . . . . . . . . . . . . . . . . . . . . . . . . . . . . . . . . . . . . . . . . . . . . . . . . . . . . . . . . . . . . . . . . . . . . . . 48
$2,065
Rent expense on the leases included above amounted to $556 and $557 for the six monthsended June 30, 2021 and 2020, respectively, and is recorded within selling, general and administrativeexpenses in the accompanying condensed consolidated statements of operations.
Contingencies:
Litigation—The Company may engage in various litigation in the ordinary course of business.The Company intends to vigorously defend itself in such matters and management, based upon theadvice of legal counsel, is of the opinion that the resolution of these matters will not have a materialeffect on the condensed consolidated financial statements. For the cases for which management
F-55
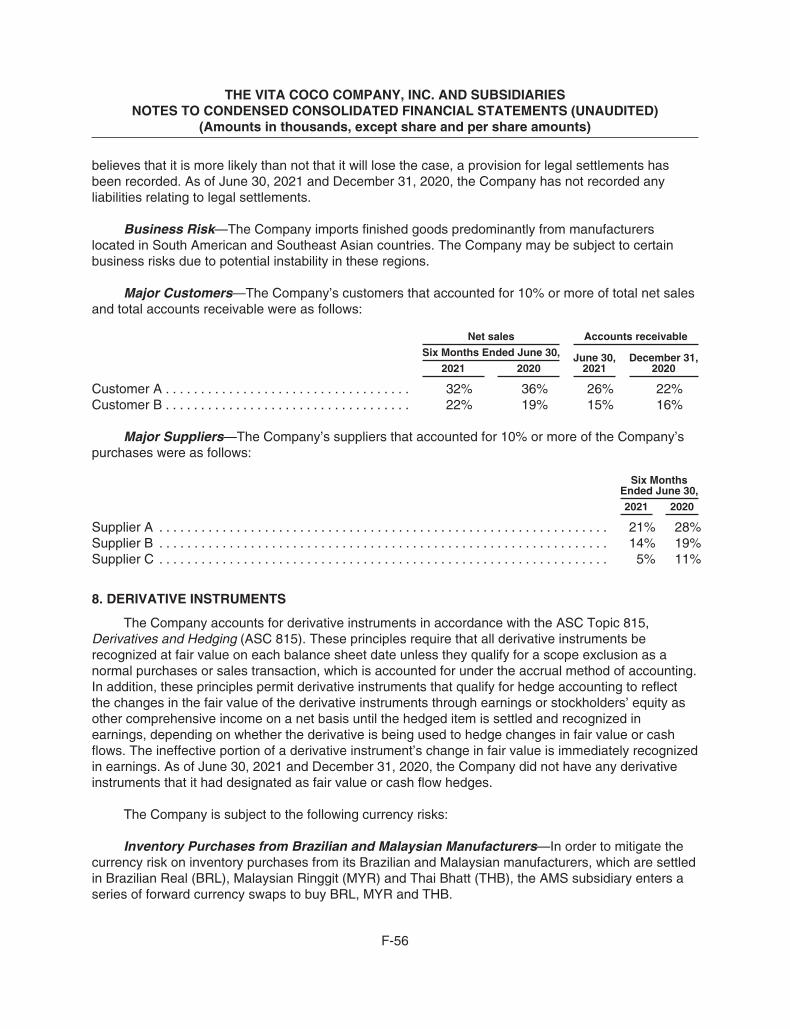
THE VITA COCO COMPANY, INC. AND SUBSIDIARIESNOTES TO CONDENSED CONSOLIDATED FINANCIAL STATEMENTS (UNAUDITED)
(Amounts in thousands, except share and per share amounts)
believes that it is more likely than not that it will lose the case, a provision for legal settlements hasbeen recorded. As of June 30, 2021 and December 31, 2020, the Company has not recorded anyliabilities relating to legal settlements.
Business Risk—The Company imports finished goods predominantly from manufacturerslocated in South American and Southeast Asian countries. The Company may be subject to certainbusiness risks due to potential instability in these regions.
Major Customers—The Company’s customers that accounted for 10% or more of total net salesand total accounts receivable were as follows:
Net sales Accounts receivable
Six Months Ended June 30, June 30,2021
December 31,20202021 2020
Customer A . . . . . . . . . . . . . . . . . . . . . . . . . . . . . . . . . . . 32% 36% 26% 22%Customer B . . . . . . . . . . . . . . . . . . . . . . . . . . . . . . . . . . . 22% 19% 15% 16%
Major Suppliers—The Company’s suppliers that accounted for 10% or more of the Company’spurchases were as follows:
Six MonthsEnded June 30,
2021 2020
Supplier A . . . . . . . . . . . . . . . . . . . . . . . . . . . . . . . . . . . . . . . . . . . . . . . . . . . . . . . . . . . . . . . . 21% 28%Supplier B . . . . . . . . . . . . . . . . . . . . . . . . . . . . . . . . . . . . . . . . . . . . . . . . . . . . . . . . . . . . . . . . 14% 19%Supplier C . . . . . . . . . . . . . . . . . . . . . . . . . . . . . . . . . . . . . . . . . . . . . . . . . . . . . . . . . . . . . . . . 5% 11%
8. DERIVATIVE INSTRUMENTS
The Company accounts for derivative instruments in accordance with the ASC Topic 815,Derivatives and Hedging (ASC 815). These principles require that all derivative instruments berecognized at fair value on each balance sheet date unless they qualify for a scope exclusion as anormal purchases or sales transaction, which is accounted for under the accrual method of accounting.In addition, these principles permit derivative instruments that qualify for hedge accounting to reflectthe changes in the fair value of the derivative instruments through earnings or stockholders’ equity asother comprehensive income on a net basis until the hedged item is settled and recognized inearnings, depending on whether the derivative is being used to hedge changes in fair value or cashflows. The ineffective portion of a derivative instrument’s change in fair value is immediately recognizedin earnings. As of June 30, 2021 and December 31, 2020, the Company did not have any derivativeinstruments that it had designated as fair value or cash flow hedges.
The Company is subject to the following currency risks:
Inventory Purchases from Brazilian and Malaysian Manufacturers—In order to mitigate thecurrency risk on inventory purchases from its Brazilian and Malaysian manufacturers, which are settledin Brazilian Real (BRL), Malaysian Ringgit (MYR) and Thai Bhatt (THB), the AMS subsidiary enters aseries of forward currency swaps to buy BRL, MYR and THB.
F-56

THE VITA COCO COMPANY, INC. AND SUBSIDIARIESNOTES TO CONDENSED CONSOLIDATED FINANCIAL STATEMENTS (UNAUDITED)
(Amounts in thousands, except share and per share amounts)
Intercompany Transactions Between AME and AMS—In order to mitigate the currency risk onintercompany transactions between AME and AMS, AMS enters into foreign currency swaps to buy/sellBritish Pounds (GBP).
Intercompany Transactions with Canadian Customer and Vendors—In order to mitigate thecurrency risk on transactions with Canadian customer and vendors, AMI enters into foreign currencyswaps to sell Canadian Dollars (CAD).
The Company was also subject to interest rate risk on its variable interest rate over the TermLoan 2017. On October 29, 2018 the Company entered into a swap agreement (ISDA) with JPMorganChase, N.A. to hedge part of its variable interest rate over the Term Loan 2017 listed in Note 6. TheCompany terminated the swap agreement in May 2020, in connection with the repayment of theoutstanding Term Loan 2017 balance. The Company recorded $512 interest expense for the sixmonths ended June 30, 2020 related to this swap agreement.
The notional amount and fair value of all outstanding derivative instruments in the condensedconsolidated balance sheets consist of the following at:
June 30, 2021
Derivatives not designated ashedging instruments under
ASC 815-20NotionalAmount Fair Value Balance Sheet Location
LiabilitiesForeign currency exchange contracts
Receive THB/sell USD . . . . . . . . . . . . . . . . . . . . . . $13,050 $(558) Derivative liabilitiesReceive BRL/sell USD . . . . . . . . . . . . . . . . . . . . . . $34,902 $(407) Derivative liabilitiesReceive USD/pay GBP . . . . . . . . . . . . . . . . . . . . . . 16,466 (594) Derivative liabilitiesReceive USD/pay CAD . . . . . . . . . . . . . . . . . . . . . . 8,000 (390) Derivative liabilities
December 31, 2020
Derivatives not designated ashedging instruments under
ASC 815-20NotionalAmount Fair Value Balance Sheet Location
AssetsForeign currency exchange contracts
Receive THB/sell USD . . . . . . . . . . . . . . . . . . . . . . $ 8,730 $ 200 Derivative assetsLiabilities
Foreign currency exchange contractsReceive BRL/sell USD . . . . . . . . . . . . . . . . . . . . . . $29,329 $(3,817) Derivative liabilitiesReceive USD/pay GBP . . . . . . . . . . . . . . . . . . . . . . 15,298 (1,120) Derivative liabilitiesReceive USD/pay CAD . . . . . . . . . . . . . . . . . . . . . . 9,006 (427) Derivative liabilities
F-57

THE VITA COCO COMPANY, INC. AND SUBSIDIARIESNOTES TO CONDENSED CONSOLIDATED FINANCIAL STATEMENTS (UNAUDITED)
(Amounts in thousands, except share and per share amounts)
The amount of realized and unrealized gains and losses and condensed consolidated statementsof operations and comprehensive income location of the derivative instruments for the six monthsended June 30, 2021 and 2020 are as follows:
Six Months Ended June 30,
2021 2020
Unrealized gain/(loss) on derivativeinstruments . . . . . . . . . . . . . . . . . . . . . . . . . $ 3,214 $ (7,396)
Location . . . . . . . . . . . . . . . . . . . . . . . . . . . . . . . Unrealized gain/(loss) onderivative instruments
Unrealized gain/(loss) onderivative instruments
Foreign currency gain / (loss) . . . . . . . . . . . . $ (1,530) $ 362
Location . . . . . . . . . . . . . . . . . . . . . . . . . . . . . . . Foreign currencygain/(loss)
Foreign currencygain/(loss)
The Company applies recurring fair value measurements to its derivative instruments inaccordance with ASC Topic 820, Fair Value Measurements (ASC 820). In determining fair value, theCompany used a market approach and incorporates the assumptions that market participants woulduse in pricing the asset or liability, including assumptions about risk and/or the risks inherent in theinputs to the valuation technique. These inputs can be readily observable, market corroborated, orgenerally unobservable internally developed inputs.
9. FAIR VALUE MEASUREMENTS
ASC 820 provides a framework for measuring fair value and requires expanded disclosuresregarding fair value measurements. ASC 820 defines fair value as the price that would be received tosell an asset or paid to transfer a liability in an orderly transaction between market participants at themeasurement date. ASC 820 also establishes a fair value hierarchy which requires an entity tomaximize the use of observable inputs and minimize the use of unobservable inputs. Based uponobservability of the inputs used in valuation techniques, the Company’s assets and liabilities areclassified as follows:
Level 1—Quoted market prices in active markets for identical assets or liabilities.
Level 2—Observable inputs other than Level 1 prices, such as quoted prices for similar assets orliabilities, quoted market prices in markets that are not active; or other inputs that are observable orcan be corroborated by observable market data.
Level 3—Unobservable inputs that are supported by little or no market activity and that aresignificant to the fair value of the assets or liabilities. This includes internally developed models andmethodologies utilizing significant unobservable inputs.
Forward Currency Swap Contracts—The Company’s valuation methodology for forwardcurrency swap contracts is based upon third-party institution data.
Contingent Consideration Liability—The Company utilized a probability weighted scenario-based model to determine the fair value of the contingent consideration.
F-58

THE VITA COCO COMPANY, INC. AND SUBSIDIARIESNOTES TO CONDENSED CONSOLIDATED FINANCIAL STATEMENTS (UNAUDITED)
(Amounts in thousands, except share and per share amounts)
The Company’s fair value hierarchy for those assets (liabilities) measured at fair value on arecurring basis at June 30, 2021 and December 31, 2020, is as follows:
Level 1 Level 2 Level 3 Total
Forward CurrencySwaps/Contracts
Contingentconsideration liability
June 30, 2021 . . . . . . . . . . . . . . . . . . . . . . . . . . $— $(1,949) $— $(1,949)
December 31, 2020 . . . . . . . . . . . . . . . . . . . . . $— $(5,164) $— $(5,164)
In connection with the Company’s acquisition of Runa, the Company was obligated to paycontingent payments to Runa’s former shareholders only if a certain revenue growth rate is achieved.Assuming the revenue growth is achieved, the former shareholders could elect for payment to becalculated based on quarterly data available between December 2021 and December 2022, as follows:49% of the product of (a) the net revenue for the trailing 12 calendar months and (b) a specifiedmultiple, which is contingent on the revenue growth achieved since December 31, 2017. Per theacquisition agreement, the contingent payment cannot exceed $51,500. If a certain revenue growthrate is not achieved, the Company is not required to pay any contingent payment. The Company doesnot believe that the Runa business will achieve the growth targets required and thus expect that thecontingent consideration will be zero at December 2022.
The fair value of contingent consideration of $15,700 determined on the acquisition date in 2018was initially recognized as a liability and then subsequently remeasured to fair value at each reportingdate with changes in fair value recognized as a component of operating expenses in the accompanyingcondensed consolidated statements of operations.
The contingent consideration liability related to the acquisition of Runa LLC was considered aLevel 3 liability, as the fair value was determined based on significant inputs not observable in themarket, and recorded within other long-term liabilities in the accompanying condensed consolidatedbalance sheets. The Company estimated the fair value of the contingent consideration liability basedon a probability-weighted present value of various future cash payment outcomes. The techniqueconsidered the following unobservable inputs as of each valuation date:
• The probability and timing of achieving the specified milestones,
• Revenue performance expectations, and
• Market-based discount rates
Based on updated revenue performance expectations during the earn-out period for Runa LLC,the Company remeasured the contingent consideration as $16,400 as of June 30, 2020 andsubsequently to zero at June 30, 2021 and at December 31, 2020.
The following table presents the change in contingent consideration liability during the six monthsended June 30, 2021 and 2020:
2021 2020
Balance at January 1, . . . . . . . . . . . . . . . . . . . . . . . . . . . . . . . . . . . . . . . . . . . . . . . . . . . . $— $(16,400)Change in fair value of contingent consideration . . . . . . . . . . . . . . . . . . . . . . . . . . . . . . . — —
Balance at June 30, . . . . . . . . . . . . . . . . . . . . . . . . . . . . . . . . . . . . . . . . . . . . . . . . . . . . . $— $(16,400)
There were no transfers between any levels of the fair value hierarchy for any of the Company’sfair value measurements.
F-59

THE VITA COCO COMPANY, INC. AND SUBSIDIARIESNOTES TO CONDENSED CONSOLIDATED FINANCIAL STATEMENTS (UNAUDITED)
(Amounts in thousands, except share and per share amounts)
10. STOCKHOLDERS’ EQUITY
Common and Treasury Stock—Each share of common stock entitles its holder to one vote onmatters required to be voted on by the stockholders of the Company and to receive dividends, whenand if declared by the Company’s Board of Directors.
As of June 30, 2021 and December 31, 2020, the Company held 6,206,200 and 1,014,195shares, respectively, in treasury stock and had 4,171,895 and 3,883,425 shares, respectively, ofcommon stock reserved for issuance upon the conversion of outstanding warrants and stock options.In January 2021, the Company entered into a Stock Purchase Agreement with RW VC S.a.r.l, f/k/ aVita Coco S.a.r.l (the “Seller”). The Company repurchased 5,192,005 (11,411 prior to the stock split)shares of its own common stock from the Seller at a purchase price of $9.63 ($4,382 prior to stocksplit) per share, or an aggregate purchase price of approximately $50,000. The purchase price pershare approximated the most recent third-party common stock valuation prepared in conjunction withthe accounting of stock-based compensation discussed within this Note.
Warrants—The following table summarizes warrant activity for the six months ended June 30,2021:
ExitWarrants
(a)
ServiceWarrants
(b)Total
Warrants
Weighted-Average
Exercise Price
Weighted-Average
RemainingContractual Term
(in Years)
Outstanding—December 31, 2020 . . . . . 28,665 — 28,665 $0.000022 0.75Granted . . . . . . . . . . . . . . . . . . . . . . . . . . . — — — — —Exercised . . . . . . . . . . . . . . . . . . . . . . . . . — — — — —Expired . . . . . . . . . . . . . . . . . . . . . . . . . . . — — — — —
Outstanding—June 30, 2021 . . . . . . . . . . 28,665 — 28,665 $0.000022 0.25
Exercisable—June 30, 2021 . . . . . . . . . . — — — — —
(a) As of June 30, 2021 and December 31, 2020, the Company has exit warrants to purchase28,665 shares of common stock at a weighted-average exercise price of $0.000033 per shareoutstanding to certain investors. These exit warrants, expire upon the earlier of 10 years from thedate of grant or the occurrence of a liquidity event, as defined in the warrant agreements. Thewarrants, which were issued in connection with the sale of common stock, only vest whenproceeds from a liquidity event provide an annual internal rate of return of less than 30%.
(b) As of June 30, 2021 and December 31, 2020, the Company did not have any warrantsoutstanding to individuals for the performance of certain marketing services.
Stock Options—The stockholders of the Company approved the adoption of the Company’s2014 Stock Option and Restricted Stock Plan (the “Stock Option Plan”). The Stock Option Plan allowedfor a maximum of 8% of the sum of the Available Equity defined as the sum of (i) the total thenoutstanding shares of common shares and (ii) all available stock option (i.e., granted and outstandingstock options and stock options not yet granted). Under the terms of the Stock Option Plan, theCompany may grant employees, directors, and consultants stock options and restricted stock awardsand has the authority to establish the specific terms of each award, including exercise price, expiration,and vesting. Generally, stock options issued pursuant to the Stock Option Plan must contain exerciseprices no less than the fair value of the Company’s common stock on the date of grant and have a
F-60

THE VITA COCO COMPANY, INC. AND SUBSIDIARIESNOTES TO CONDENSED CONSOLIDATED FINANCIAL STATEMENTS (UNAUDITED)
(Amounts in thousands, except share and per share amounts)
ten-year contractual term. As of June 30, 2021 and December 31, 2020, there were 582,400 and545,545 shares, respectively, of common stock reserved for future issuance pursuant to the StockOption Plan. All shares awarded due to exercise of stock options are newly issued.
The Company recognized stock-based compensation expense of $1,012 and $827 for the sixmonths ended June 30, 2021 and 2020, respectively, in selling, general, and administrative expenses.
Awards with Service-based Vesting Conditions
Most of stock option awards granted under the Stock Option Plan vest based on the continuousservice. Generally, 50% of the stock options granted vest over the two years and 50% of the stockoptions granted vest over the four years. The following table summarizes the service-based stockoption activity during the six months ended June 30, 2021:
Number ofShares
WeightedAverage
Exercise Price
WeightedAverage
RemainingContractual Life
(in years)
AggregateIntrinsic Value(in thousands)
Outstanding—December 31, 2020 . . . . . . . . . 3,206,840 $10.05Granted . . . . . . . . . . . . . . . . . . . . . . . . . . . . . . . 293,475 10.18Exercised . . . . . . . . . . . . . . . . . . . . . . . . . . . . . 2,275 6.74Forfeited or expired . . . . . . . . . . . . . . . . . . . . . 220,675 10.78
Outstanding—June 30, 2021 . . . . . . . . . . . . . 3,281,460 10.01 8.0 717
Exercisable—June 30, 2021 . . . . . . . . . . . . . . 1,819,545 $ 9.88 7.4 717
The weighted average grant-date fair value of the service-based stock option awards grantedduring the six months ended June 30, 2021 and 2020 was $3.65 per option and $3.54 per option,respectively. The aggregate intrinsic value of service-based stock options exercised was $5 and $102for the six months ended June 30, 2021 and 2020, respectively. The aggregate intrinsic value of stockoptions is calculated as the difference between the exercise price of the stock options and the fairvalue of the Company’s common stock for all stock options that had exercise prices lower than the fairvalue of the Company’s common stock.
The fair value of the service-based stock options granted during the six months ended June 30,2021 and 2020 pursuant to the Stock Option Plan was estimated on the grant date using the Black-Scholes option-pricing model. The weighted average assumptions used in the Black-Scholes option-pricing model were as follows:
June 30,2021
June 30,2020
Weighted average expected term . . . . . . . . . . . . . . . . . . . . . . . . . . . . . . . . . . . . . . . . . . 6.5 5.6Weighted average expected volatility . . . . . . . . . . . . . . . . . . . . . . . . . . . . . . . . . . . . . . . 38% 40%Weighted average risk-free interest rate . . . . . . . . . . . . . . . . . . . . . . . . . . . . . . . . . . . . . 0.76% 0.45%Weighted average expected dividend yield . . . . . . . . . . . . . . . . . . . . . . . . . . . . . . . . . . 0% 0%
Expected Term: Represents the period that the stock-based awards are expected to beoutstanding based on a contractual term and service conditions specified for the awards. TheCompany estimated the expected term of the options with service conditions in accordance with the
F-61

THE VITA COCO COMPANY, INC. AND SUBSIDIARIESNOTES TO CONDENSED CONSOLIDATED FINANCIAL STATEMENTS (UNAUDITED)
(Amounts in thousands, except share and per share amounts)
“simplified” method as defined in ASC 718, which enables the use of a practical expedient for “plainvanilla” share options.
Expected Volatility: The Company has historically been a private company and lackscompany-specific historical and implied volatility information for its stock. Therefore, the Companyestimated volatility for option grants by evaluating the average historical volatility of a peer group ofcompanies for the period immediately preceding the option grant for a term that is approximately equalto the expected term of the options.
Risk-free Interest Rate: The risk-free interest rate was based on the yield, as of the optionvaluation date, by reference to the U.S. Treasury yield curve in effect at the time of the grant or themodification of the award for time periods equal to the expected term of the award.
Dividend Yield—The Company does not anticipate declaring a dividend over the expected term.As such, the dividend yield has been estimated to be zero.
Fair Value of Common Stock—Because there has been no public market for the Company’scommon stock, the board of directors has determined the estimated fair value of the common stock atthe time of grant of options by considering valuations performed by an independent third-partyvaluation specialist, which considers a number of objective and subjective factors including valuationsof comparable companies, operating and financial performance, the lack of liquidity of capital stock, thelikelihood of achieving an initial public offering and general and industry specific economic outlook.These third-party valuations were performed in accordance with the guidance outlined in the AmericanInstitute of Certified Public Accountants’ Accounting and Valuation Guide, Valuation of Privately-Held-Company Equity Securities Issued as Compensation. The third-party common stock valuations wereprepared using a combination of the income approach and market approach.
As of June 30, 2021, there was $3,216 of total unrecognized compensation cost related tounvested service-based stock options, which is expected to be recognized over a weighted-averageservice period of 2.5 years.
Awards with Performance and Market-based Vesting Conditions
During the six months ended June 30, 2021, the Company awarded options to purchase 470shares of common stock of the Company containing a performance-based vesting conditions, subjectto achievement of various performance goals by the end of 2021, including revenue and AdjustedEBITDA targets.
During the year ended December 31, 2020, the Company awarded options to purchase 68,250shares of common stock of the Company containing a performance-based vesting conditions, subjectto achievement of various performance goals by the end of 2025, including revenue and gross margintargets. In addition, during the year ended December 31, 2019, the Company awarded options topurchase 579,670 shares of common stock of the Company containing performance and marketvesting conditions, such as option vesting upon occurrence of an initial public offering (“IPO”) or otherqualifying liquidity event and upon achieving predetermined equity value of the Company at a time ofthe IPO or other qualifying liquidity event.
F-62

THE VITA COCO COMPANY, INC. AND SUBSIDIARIESNOTES TO CONDENSED CONSOLIDATED FINANCIAL STATEMENTS (UNAUDITED)
(Amounts in thousands, except share and per share amounts)
The following table summarizes the performance and market-based stock option activity duringthe six months ended June 30, 2021:
Number ofShares
WeightedAverage
Exercise Price
WeightedAverage
RemainingContractual Life
(in years)
AggregateIntrinsic Value(in thousands)
Outstanding—December 31, 2020 . . . . . . . . . . 647,920 $10.18Granted . . . . . . . . . . . . . . . . . . . . . . . . . . . . . . . 213,850 10.18Exercised . . . . . . . . . . . . . . . . . . . . . . . . . . . . . . — —Forfeited or expired . . . . . . . . . . . . . . . . . . . . . . — —
Outstanding—June 30, 2021 . . . . . . . . . . . . . . 861,770 $10.18 8.6 —
None of the stock options included in the table above are exercisable at June 30, 2021.
The fair value of the awards with performance-based vesting condition was estimated using theBlack-Scholes option-pricing model used for the Company’s service-based stock options and assumedthat performance goals will be achieved. If such performance conditions are not met, no compensationcost is recognized and any recognized compensation cost is reversed. The weighted average grant-date fair value of the stock options with performance-based vesting condition granted during the sixmonths ended June 30, 2021 and 2020 was $2.62 and $4.56 per option, respectively.
As of June 30, 2021, the unrecognized stock-based compensation cost related to the stockoptions for which performance-based vesting conditions are probable of being achieved was $884,expected to be recognized over the period of approximately 3.7 years. As of June 30, 2021, totalunrecognized compensation cost related to the unvested 1,274 stock option awards containingperformance and market vesting conditions was $1,225, which will be recognized when attainment ofthe performance and market vesting conditions becomes probable.
11. INCOME TAXES
For the six months ended June 30, 2021 and 2020, the Company recorded $3,981 and $2,352,respectively, in income tax expense in its condensed consolidated statements of operations.
In assessing the recoverability of its deferred tax assets, the Company continually evaluates allavailable positive and negative evidence to assess the amount of deferred tax assets for which it ismore likely than not to realize a benefit. For any deferred tax asset in excess of the amount for which itis more likely than not that the Company will realize a benefit, the Company establishes a valuationallowance.
As of June 30, 2021 and December 31, 2020, there were no liabilities for income taxuncertainties. The Company is subject to income tax examinations by IRS and various state andlocation jurisdictions for the open tax years between December 31, 2017 to December 31, 2020.
F-63

THE VITA COCO COMPANY, INC. AND SUBSIDIARIESNOTES TO CONDENSED CONSOLIDATED FINANCIAL STATEMENTS (UNAUDITED)
(Amounts in thousands, except share and per share amounts)
12. EARNINGS PER SHARE
Basic and diluted earnings per share were calculated as follows:
Six Months Ended June 30,2021 2020
Numerator (in thousands):Net income attributable to AMI . . . . . . . . . . . . . . . . . . . . . . . . . . . . . . . . . . . $ 9,442 $ 6,567Denominator:Weighted-average number of common shares used in earnings per
share—basic . . . . . . . . . . . . . . . . . . . . . . . . . . . . . . . . . . . . . . . . . . . . . . . . 53,398,800 58,602,180Effect of conversion of stock options . . . . . . . . . . . . . . . . . . . . . . . . . . . 443,626 134,680
Weighted-average number of common shares used in earnings pershare—diluted . . . . . . . . . . . . . . . . . . . . . . . . . . . . . . . . . . . . . . . . . . . . . . . 53,842,425 58,736,860
Earnings per share—basic . . . . . . . . . . . . . . . . . . . . . . . . . . . . . . . . . . . . . . . $ 0.18 $ 0.11
Earnings per share—diluted . . . . . . . . . . . . . . . . . . . . . . . . . . . . . . . . . . . . . $ 0.18 $ 0.11
The vested service warrants are exercisable for little consideration and all necessary conditionshave been satisfied. Accordingly, the calculation of weighted average common shares outstandingincludes vested service warrants, exercisable for a value of $0.000022, which consisted of zero and9,100 weighted average service warrants as of June 30, 2021 and 2020, respectively.
The exit warrants, which expire upon a liquidity event and only vest when proceeds from aliquidity event provide an annual internal rate of return of less than 30%, were not considered in thebasic and diluted earnings per share, as the contingency of a liquidity event has not occurred duringthe six months ended June 30, 2021 and 2020.
The following potentially dilutive securities, prior to the use of the treasury stock method, havebeen excluded from the computation of diluted weighted-average number of common sharesoutstanding, as they would be anti-dilutive:
June 30,
2021 2020
Options to purchase common stock . . . . . . . . . . . . . . . . . . . . . . . . . . . . . . . . . . . 1,669,395 3,392,935
13. SEGMENT REPORTING
The Company has two operating and reportable segments:
• Americas—The Americas segment is comprised primarily of US and Canada and derives itsrevenues from the marketing and distribution of various coconut water and non-coconut waterproducts (e.g., oil and milk). AMI’s Guayusa leaf products (Runa) and aluminum bottle cannedwater (Ever and Ever) are marketed only in the Americas segment.
• International—The International segment is comprised primarily of Europe, Middle East, andAsia Pacific, which includes the Company’s procurement arm and derives its revenues from themarketing and distribution of various coconut water and non-coconut water products.
F-64
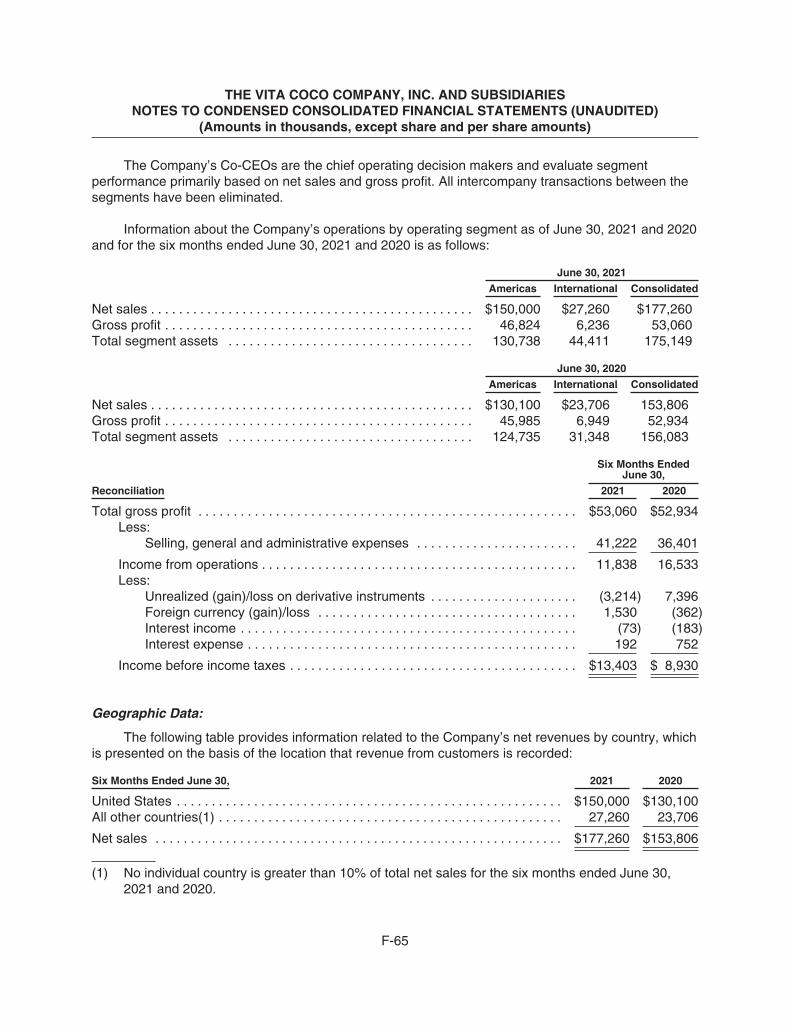
THE VITA COCO COMPANY, INC. AND SUBSIDIARIESNOTES TO CONDENSED CONSOLIDATED FINANCIAL STATEMENTS (UNAUDITED)
(Amounts in thousands, except share and per share amounts)
The Company’s Co-CEOs are the chief operating decision makers and evaluate segmentperformance primarily based on net sales and gross profit. All intercompany transactions between thesegments have been eliminated.
Information about the Company’s operations by operating segment as of June 30, 2021 and 2020and for the six months ended June 30, 2021 and 2020 is as follows:
June 30, 2021
Americas International Consolidated
Net sales . . . . . . . . . . . . . . . . . . . . . . . . . . . . . . . . . . . . . . . . . . . . . . $150,000 $27,260 $177,260Gross profit . . . . . . . . . . . . . . . . . . . . . . . . . . . . . . . . . . . . . . . . . . . . 46,824 6,236 53,060Total segment assets . . . . . . . . . . . . . . . . . . . . . . . . . . . . . . . . . . . 130,738 44,411 175,149
June 30, 2020
Americas International Consolidated
Net sales . . . . . . . . . . . . . . . . . . . . . . . . . . . . . . . . . . . . . . . . . . . . . . $130,100 $23,706 153,806Gross profit . . . . . . . . . . . . . . . . . . . . . . . . . . . . . . . . . . . . . . . . . . . . 45,985 6,949 52,934Total segment assets . . . . . . . . . . . . . . . . . . . . . . . . . . . . . . . . . . . 124,735 31,348 156,083
Six Months EndedJune 30,
Reconciliation 2021 2020
Total gross profit . . . . . . . . . . . . . . . . . . . . . . . . . . . . . . . . . . . . . . . . . . . . . . . . . . . . . . $53,060 $52,934Less:
Selling, general and administrative expenses . . . . . . . . . . . . . . . . . . . . . . . 41,222 36,401
Income from operations . . . . . . . . . . . . . . . . . . . . . . . . . . . . . . . . . . . . . . . . . . . . . 11,838 16,533Less:
Unrealized (gain)/loss on derivative instruments . . . . . . . . . . . . . . . . . . . . . (3,214) 7,396Foreign currency (gain)/loss . . . . . . . . . . . . . . . . . . . . . . . . . . . . . . . . . . . . . 1,530 (362)Interest income . . . . . . . . . . . . . . . . . . . . . . . . . . . . . . . . . . . . . . . . . . . . . . . . (73) (183)Interest expense . . . . . . . . . . . . . . . . . . . . . . . . . . . . . . . . . . . . . . . . . . . . . . . 192 752
Income before income taxes . . . . . . . . . . . . . . . . . . . . . . . . . . . . . . . . . . . . . . . . . $13,403 $ 8,930
Geographic Data:
The following table provides information related to the Company’s net revenues by country, whichis presented on the basis of the location that revenue from customers is recorded:
Six Months Ended June 30, 2021 2020
United States . . . . . . . . . . . . . . . . . . . . . . . . . . . . . . . . . . . . . . . . . . . . . . . . . . . . . . . $150,000 $130,100All other countries(1) . . . . . . . . . . . . . . . . . . . . . . . . . . . . . . . . . . . . . . . . . . . . . . . . . 27,260 23,706
Net sales . . . . . . . . . . . . . . . . . . . . . . . . . . . . . . . . . . . . . . . . . . . . . . . . . . . . . . . . . . $177,260 $153,806
(1) No individual country is greater than 10% of total net sales for the six months ended June 30,2021 and 2020.
F-65

THE VITA COCO COMPANY, INC. AND SUBSIDIARIESNOTES TO CONDENSED CONSOLIDATED FINANCIAL STATEMENTS (UNAUDITED)
(Amounts in thousands, except share and per share amounts)
The following table provides information related to the Company’s property and equipment, net bycountry:
June 30,2021
December 31,2020
United States . . . . . . . . . . . . . . . . . . . . . . . . . . . . . . . . . . . . . . . . . . . . . . . . . . . . . . . $1,029 $1,186Ecuador . . . . . . . . . . . . . . . . . . . . . . . . . . . . . . . . . . . . . . . . . . . . . . . . . . . . . . . . . . . 910 953Singapore . . . . . . . . . . . . . . . . . . . . . . . . . . . . . . . . . . . . . . . . . . . . . . . . . . . . . . . . . 341 445All other countries(1) . . . . . . . . . . . . . . . . . . . . . . . . . . . . . . . . . . . . . . . . . . . . . . . . . 204 296
Property and equipment, net . . . . . . . . . . . . . . . . . . . . . . . . . . . . . . . . . . . . . . . . . . $2,484 $2,880
(1) No individual country is greater than 10% of total property and equipment, net as of June 30,2021 and December 31, 2020.
14. RELATED-PARTY TRANSACTIONS
Management Fees—The Company is subject to an arrangement with one of its stockholders foras long as such stockholder holds at least 5% of the Company’s capital stock. Pursuant to the terms ofthe amended arrangement, the Company is required to make fixed annual management fee paymentsof $281.
Loan to Employee—On September 18, 2019 the Company extended a five year promissory noteof $17,700 to its newly appointed President, in order for him to buy 1,739,010 shares of The Vita CocoCompany, Inc.’s common stock in conjunction with his employment agreement. The interest on the noteaccrues annually at a rate of 1.78% with principal balance due at maturity. The purchase of the AMIshares occurred simultaneously with the commencement of the loan, as a result no funds were actuallydisbursed by AMI. The purchased AMI shares are pledged as collateral to the loan until full repayment ofthe principal balance. On May 18, 2020, the Company amended the interest rate on the note to 0.58%.
Distribution Agreement with Shareholder—On October 1, 2019 the Company entered into adistribution agreement with one of its stockholders, which currently extends through December 31,2021. The distribution agreement grants the stockholder the right to sell, resell and distributedesignated products supplied by the Company within a specified territory. The amount of revenuerecognized related to this distribution agreement was $3,309 and $2,585 for the six months endedJune 30, 2021 and 2020, respectively. The amounts due from the stockholder in Accounts Receivable,net were $872 and $575 as of June 30, 2021 and December 31, 2020, respectively. Related to thisdistribution arrangement, the Company and the stockholder have a service agreement where theCompany shares in the compensation costs of the stockholder’s employee managing the Chinamarket. The Company recorded $80 and $57 for the six months ended June 30, 2021 and 2020,respectively, in selling, general, and administrative expense for this service agreement.
F-66

THE VITA COCO COMPANY, INC. AND SUBSIDIARIESNOTES TO CONDENSED CONSOLIDATED FINANCIAL STATEMENTS (UNAUDITED)
(Amounts in thousands, except share and per share amounts)
15. SUBSEQUENT EVENTS
On August 17, 2021, the Company repurchased AME shares from certain minority stockholders.As a result, the noncontrolling interest in AME representing minority stockholders’ proportionate shareof the equity in AME was reduced from 1.3% to 0.71%.
The Company evaluated its condensed consolidated financial statements for subsequent eventsthrough August 31, 2021, the date the condensed consolidated financial statements were originallyavailable to be issued and through September 27, 2021, the date the condensed consolidated financialstatements were available to be reissued.
Effective as of September 9, 2021, the name of the Company was changed from All Market Inc.to The Vita Coco Company, Inc.
On September 16, 2021, Martin Roper, the co-CEO of the Company, repaid the outstandingprincipal balance and accrued interest on the promissory note described in Note 14 of the condensedconsolidated financial statements.
On October 11, 2021, the Company filed a Certificate of Amendment to its Amended andRestated Certificate of Incorporation, as amended, with the Secretary of State of the State ofDelaware, pursuant to which, the Company effected a 455-for-1 forward stock split (the “Stock Split”) ofthe Company’s authorized, issued and outstanding common stock, and increased the authorized shareof our common stock to 500,000,000 shares. The Stock Split was approved by the Company’s Boardof Directors on October 11, 2021. All share amounts and per share data presented in theaccompanying Condensed Consolidated Financial Statements have been retrospectively adjusted toreflect the forward stock split for all periods presented.
On October 11, 2021, the Company’s Board of Directors approved a new bonus agreement withthe co-CEO, Mike Kirban, that will replace and supersede existing agreements. In the event an initialpublic offering is consummated on or prior to June 30, 2021, (i) each of Verlinvest, and RW VC S.a.r.l.(the “Bonus Stockholders”) shall pay Mr. Kirban a bonus equal to 1.4% of the total cash considerationreceived by the Bonus Stockholders through the sale by the Bonus Stockholders of the Company’ssecurities pursuant to the IPO, as of the closing date of the IPO (the “Bonus Stockholders Proceeds”);and (ii) the Company shall pay Mr. Kirban a bonus equal to 1.4% of the total cash considerationreceived by the Company through the sale of the Company’s securities pursuant to the IPO, as of theclosing date of the IPO (the “Company Proceeds”). The forms of payment will be (i) for the BonusStockholders’ portion, cash equal to 1.4% of the Bonus Stockholders Proceeds to be made on theclosing date of the IPO; and (ii) for the Company’s portion, a number of restricted stock units pursuantto the 2021 Plan that is equal to the ratio of (x) an amount equal to 1.4% of the Company IPOProceeds to (y) the fair market value per share of the Company’s common stock on the date of grant,which shall vest in full on the six (6) month anniversary of the date of grant subject to Mr. Kirban’scontinued employment with the Company through such vesting date.
Concurrent with, and subject to, the consummation of an initial public offering, entities affiliatedwith a significant customer have agreed to purchase $20 million of shares of common stock, at a priceper share equal to the initial public offering price per share at which our common stock is sold to thepublic, from Verlinvest Beverages SA, an existing stockholder, in a private placement. The Companywill not receive any proceeds from the private placement. In addition, this customer will also receive $3million of shares of restricted common stock, at a price per share equal to the initial public offeringprice per share, in exchange for an amendment to extend the distributor agreement term to June 10,2026. This customer would become a related party of the Company as a result of these transactions.
******
F-67

11,500,000 Shares
Shares of Common Stock
, 2021
Prospectus
Goldman Sachs & Co.LLC
BofA Securities Credit Suisse Evercore ISI
Wells Fargo Securities GuggenheimSecurities
Piper Sandler William Blair