Embed Size (px)
Citation preview

L 91403
_j
1111111111111111111 ,_ NZ~A NEW ZEALAND Q UALIFICATIONS AUTHORITY MANA TOHU MATAURANGA 0 AOTEAROA
Level 3 Economics, 2013
SUPERVISOR'S USE ONLY
91403 Demonstrate understanding of macro-economic influences on the New Zealand economy
Achievement
Demonstrate understanding of macro-economic influences on the New Zealand economy.
9.30 am Monday 18 November 2013 Credits: Six
Achievement with Merit Achievement with Excellence
Demonstrate in-depth understanding of Demonstrate comprehensive macro-economic influences on the New understanding of macro-economic Zealand economy. influences on the New Zealand
economy.
Check that the National Student Number (NSN) on your admission slip is the same as the number at the top of this page.
You should attempt ALL the questions in this booklet.
If you need more space for any answer, use the page(s) provided at the back of this booklet and clearly number the question.
Check that this booklet has pages 2-12 in the correct order and that none of these pages is blank.
YOU MUST HAND THIS BOOKLET TO THE SUPERVISOR AT THE END OF THE EXAMINATION.
© New Zealand Qualifications Authority, 2013. All rights reserved.
Low Achievement
TOTAL 9 ASSESSOR'S USE ONLY
No part of this publication may be reproduced by any means without the prior permission of the New Zealand Qualifications Authority.

2
You are advised to spend one hour answering the questions in this booklet.
QUESTION ONE: THE INFLUENCE OF TRADE POLICIES ON THE NEW ZEALAND ECONOMY
New Zealand records big December trade surplus
In the December 2012 quarter, New Zealand recorded its biggest December trade surplus since 1991, as imports- particularly of aircraft- fell more sharply than exports.
The trade surplus was $486 million in December, equal to 12% of exports- roughly 10 times the average surplus of $49m for December in the previous five years, Statistics New Zealand said. Source (adapted): www.3news.eo.nz/NZ-records-big-December-trade-surplus/tabid/421/article!D/284802/ Default.aspx
Government policies designed to encourage a balanced current account could include signing free-trade agreements, and intervening in the foreign exchange market, so that the exchange rate is favourable to a trade surplus.
These policies will also affect employment in the New Zealand economy.
Graph One - Foreign exchange policy
Price level (PL)
(a) (i) On Graph One above, illustrate the influence that an exchange rate favourable to a trade surplus would have on the macro-economy.
In your answer:
label the curves
label any curve shifts
identify the equilibrium points
Economics 91403,2013
ASSESSO.J USE ONLY I

SSOR'~ ONL'(!
3
(ii) Explain the impact of an exchange rate favourable to a trade surplus on employment, by referring to the changes you made to Graph One.
~ t ~ ~V\~e_ r-OLl-£. . fvtllol4ta.bl-e $~~~t~~s . Clirve. to ... J~ ,~~~\ . • .1~ .. 13ecctlll~. ".F!<C~~
1'0\il.- · \V\O/lect5t.. Ywot'-\~19. lAfoe m9f€ .. (;he,~ ·.fo ~.
rrodw:Q. .~ Hs. . ('('e)~ .. R fC! ~>mb~ ( lvx.H~a5e .... ~~ exp:>t+
. fec;elpt?). ~ .1kr-e4bre .. tM rut-put f!f\.orCR:>esr
.~. -f\r\,s £-~i> Dl'\ fM ·~ ~by;~'f . ~ cleae.c\)'€_ ctS f~tc:e~s vvo.-:e-o{ W101£.. wDrkef's .
. So tlrL -eMrlo~k pes! tiveJv arikd::> bt· .. ··)· ·1k . ~\.'Olf\5~ t Olk.- fqyo qrOtb/t' J<'> 01 -fr.c<0-e surplt~.
j Question One (b) is on page 4 ~
Economics 91403, 2013
ASSESSOR'S USE ONLY,

4
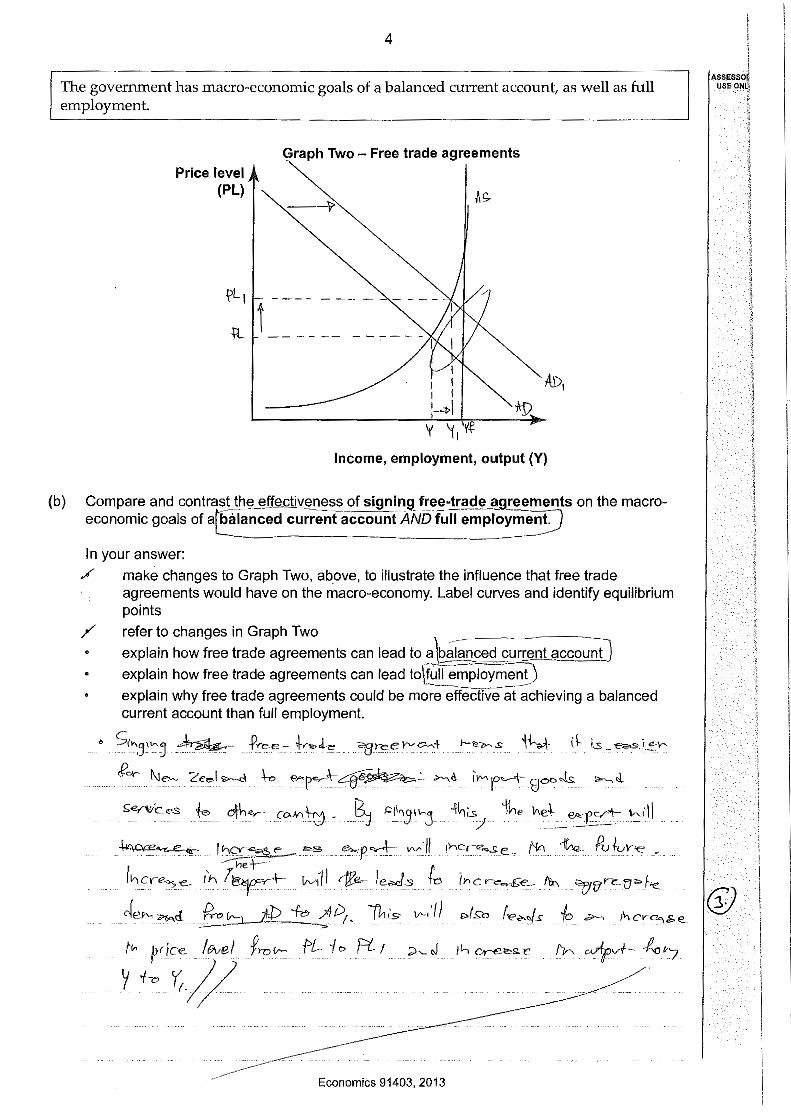
The government has macro-economic goals of a balanced current account, as well as full employment.
Graph Two- Free trade agreements Price level
(PL) I; -:"'i
t\Yt Income, employment, output (Y)
(b) Compare and contrast the effectiveness of signing free-trade agreements on the macroeconomic goals of a balanced current account AND full employment.
In your answer:
make changes to Graph Two, above, to illustrate the influence that free trade agreements would have on the macro-economy. Label curves and identify equilibrium points
• refer to changes in Graph Two
explain how free trade agreements can lead to a balanced current account
explain how free trade agreements can lead to full employment
explain why free trade agreements could be more effective at achieving a balanced current account than full employment.
'· 'Fr6t ±rt:AOii . 0\)t<?e-m-ent ~h:}'\~ / A 12 Go~~ ~if>~-··· ·H-e -~- bemvt.S-e ...... vvh.e~ FIA DWAt.S. N?
•
prodvtAs .fro m . . (J>v.e·t:se~,
;~ ~;'u • ~DX Jn
&;{lctVU:ed cu•r'€n t <>-«~l+
3 I :s . . 1 ~::v-.~\1'-ce .. .,[:! \ .. ~·~
f TIt ~ r<Ci'€-V\~S .,._re
<YUdpu--b " lh~ , . ~;ti.Sc fk-1'\ ... l6i'l._. e¥npl~f?'E!hf
tl--tt-eib.lt( ,\"-c&1Jil.t ... \nU<e~e5. /J Economics 91403, 2013~
'
·f-m.-s/'en.
/hDl<(: .
I ASSESSOR!
USEONL'{ (


6
QUESTION TWO: THE INFLUENCE OF GOVERNMENT POLICIES ON GROWTH AND INFLATION
In recent years suggestions for government policies to stimulate economic growth, while maintaining price stability in the New Zealand economy have included making Research and Development (R&D) attractive to business, removing regulations to improve productivity and investment, and reducing government spending.
Source (adapted): www.scoop.co.nz/stories/P01011/S00043/nz-needs-world-leading-pro-growth-policies.htm
Complete (a) to (c) to compare and contrast the influence that different government policies have on economic growth and inflation.
Graph Three-Removing regulations to improve productivi-;;ty:,__ ___
Price level (PL)
Income, employment, output (Y)
(a) (i) On Graph Three above illustrate the influence that removing regulations to improve productivity has on the macro-economy.
In your answer:
label the curves
• label any curve shifts
identify the new equilibrium.
(ii) Explain the changes you made to Graph Three.
Economics 91403, 2013

Price level (PL)
7
Graph FourReducing government spending
I
: I f'<;D '
\',_ y, '\\ Income, employment, output (Y)
(b) (i) On Graph Four, illustrate the influence that reducing government spending has on the macro-economy.
In your answer:
• label the curves label any curve shifts identify the new equilibrium.
(ii) Explain the changes you made to Graph Four.
ASSESSOR'S USE ONLY
R~dY\j (J&~etnffitl\t s.rew:n3 ~) as
Prcot\,t(;ei!S . C\1{ . m . less . fro ~wa? @) ·+1-..t . pl'od<-tct... Ot;tt pet~ ol~~ . ct\S . AS ~CftQ5<€J, t\-e.A UV\-evrtfLeijll"atJ+ ~crmses/, no .lcn.:r-e.;r n.e«JJ
\M~, so j~ MoJTY1t cJBc~5 r Prt'c{. /~veL 0
I"DS. iMaECG-ed·u;·} c-~s . ~ ?Joo cis.. . .~ 5£11/'C.e s ..
G\1 e_ Mqy{ce , /
/
Economics 91403, 2013
8
The government's task of managing the economy is made difficult by the challenge of achieving both economic growth along with maintaining price stability.
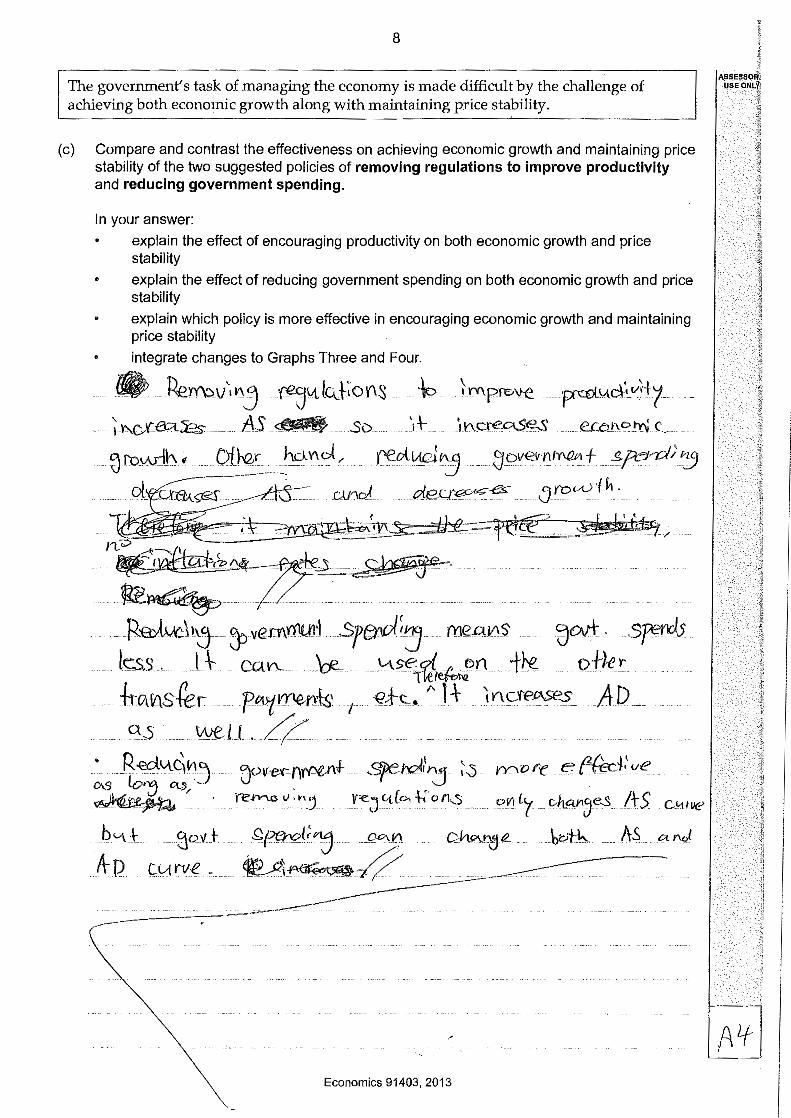
(c) Compare and contrast the effectiveness on achieving economic growth and maintaining price stability of the two suggested policies of removing regulations to improve productivity and reducing government spending.
In your answer:
explain the effect of encouraging productivity on both economic growth and price stability
• explain the effect of reducing government spending on both economic growth and price stability
• explain which policy is more effective in encouraging economic growth and maintaining price stability
integrate changes to Graphs Three and Four .
• Jkn'bv'·~ __
S:S
• R-eci"'.c)~5 DIS lo·~ 0<..5,-
~
JOVe.r()ri~J1t S}lef'Q</'1'0 ~0 __ 1')0Qf't: ef{~J.'ve;. _
n:-~"Y"I.C" '".:t f-EJ({("" -h' on_s ____ e>V\ Ly ___ ob.qY!(}e_s _/rS C<-t>ve
b'-'\J
A-p _ 5o.v + _ _ .f;(~l; J P0J0. _ 0h0.'"(l.e. _ be-Ak AS et rv,l
C0rtN2' ___ 4E-A~·~· /':.._._------__.----;;_-~~-~
Economics 91403, 2013
.A If '

9
QUESTION THREE: MACRO-ECONOMIC INFLUENCES
NZ employment growth and real GOP growth 6.0
* ..c: 2.0
~ \!) 0.0
-2.0
-4.0 --Sep. 2000
Sep. 2002
Sep. 2004
Sep. 2006
Sep. 2008
.,.~""" HLFS employment growth .....,.. Real GDP growth
Sep. 2010
Sep. 2012
Source (adapted): www.rbnz.govt.nz/statistics/econind/
Complete (a) to (c), to discuss the impacts that the business cycle and macro-economic influences have on growth and employment.
(a) (i) From the resource above, identify a time period when the New Zealand economy could have experienced increased consumption.
;ffvfl_ septeh'\~:o' -~~ Cci':SC<mf'b'on~ _i'\ILcr-c:c•s-_eql_fz,_
Septem 1-:rer ~r,l . . __ _
(ii) Explain the impact that increased consumption has on Real GOP growth and employment. Refer to the business cycle model in your answer.
(@_,
® [V\CI"E0St: _ o{' CP. n sc.{trzp{/on }nef-f'qS'I::".J
~·rB:Ictk? clem:i!~· lrcr:E?:4e. ;':) AD e~ ·~~J---------~'
' '<'· se.s J,:; ,A ~±r-u+s , r" ~L~~t(\cfeqU'€Q
w~ Jlt-Q -~ -~ $( . fl-iV\
0t. 1· I f/\c V C t "' o-_ u·h-. ___ ( __ f_:s __ .·._ \vt 0~ ses s wei • c e-~ e ·r=
cf.es:.~.eci'e<AJBS i.{V\s::Mp!oyrhkl11ts" cts _. tl"<>re u;c..,.-K.er;
Y\~eo{:eOl ·Z/
I Question Three (b) is on page 10 ~
Economics 91403, 2013
ASSESS( USEO~

10
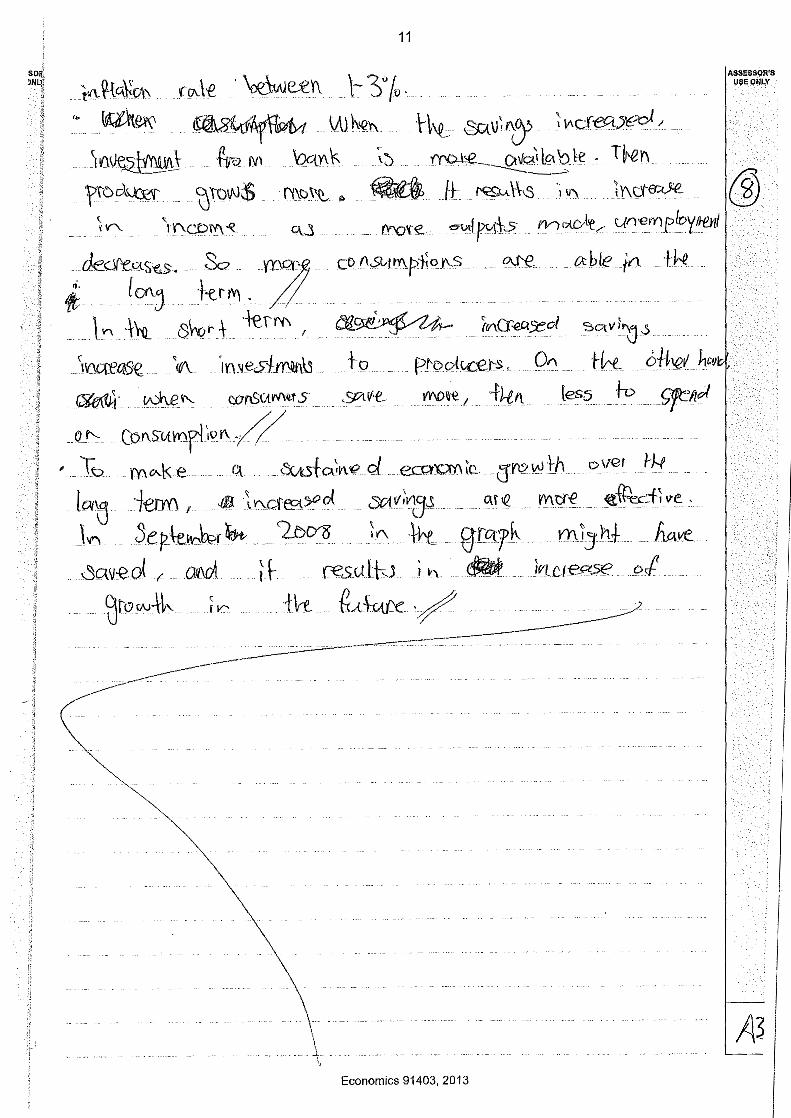
(b) Define what savings is, and explain the short-term impact that increased levels of savings has on Real GDP growth and employment.
Refer to the business cycle model in your answer.
~ .SC\.\/;"j Is . a;'\, l\<:lV\S€~olo\. .. yed ov . f'V< • . (YY:.>".e'l
.. I" \-o .fk. ~1'\k. ,l.f SAvif-85 ~V\Clc€0S.ed / . (P'M..· .. ~~r
.3f>Bi'bl le.s5 on . cern~~· .... ~. _ }k11 /tP ---------..
ctecr8?l~s. Th(L~~xe, Be.vtl GzPP _de~:re:>..?"es t<s lfCJ/.f<t'f
·-------------ol.-e.~c-~.se 5 , VMivlf> lo"l rrtr"f 1M creClS'c:s- ,. Th\s 11\;f:l ~d
kvc om.lfv@ }~ 5<!'i<ml>e. ;;><:;<)]_ 7""' r ~ ReG\ l ~ D P ClJ'\d e!r\.f>[o~lf{Wl t \) \"'Wtk C>J~c Jr" bci9v.2_D f)
The macro-economic influences of consumption, savings, and investment should not be viewed as independent, with all three having an influence on each other. The right balance between the three can help ensure sustained economic growth over the long term.
(c) Compare and contrast the effectiveness of encouraging consumption or encouraging savings as a way to achieving sustained economic growth in the New Zealand economy.
In your answer:
• explain ONE positive and ONE negative impact of increased consumption on the macro-economy
• explain the link between savings and investment
• explain ONE positive and ONE negative impact of increased savings on the macroeconomy
explain which is more likely to lead to sustained economic growth - increased consumption, or increased savings
refer to the business cycle model in your explanation.
lnc~e. ~"' ~.. L' '1 ' LD . . ... . "'-'<./ ~ Wm p·n o Y\ w d II'\ Qet:I..SL-'1j; I' ·
when. · - ft n ~ rcJ'ee~SeS 1 more · · O(A:tpe:tb Q1_\"e · ·· /Yl~ '
tJ...en lAJ'\. e.IVI flo~ IY'\enf . .. Qk:'.dt>A.Se.S ,So . r.l:~
~ ~TE~'lb "'~ / n. . Con~t v0 ho..Y\
~P> ~ lJ:-
11
t~~q\:'ol\ ((A\'€ . \,elwe£Y\ J- 3" /v · ,. ~ -~ Wh.g\'\ -~~- Cf:A\J;o/!j iV\cX~)~/
ASSESSOR'S USE ONLY
1vt~ ___ ·~ N1 'octn"' _ ~0 _ ~~k . T~Y\ f'o~ ZJtoiNS _ ·mCJ~, _ -~ It f<SM\\-.s ·iv\ ___ ·;\'\~ {§)
;V'- 'rf'CDI'I\~ C\,.'i __ rY'Q'fe ~p<-:i.tS I'Y]~,...-I_,{n-e«lpic>yllt!nl
;~'; +:~ • 4 c»f.>LJ"'~'c]'S ... "-"!. i>ble !<> lk
. -.. \V\. ·t\-Q. . sY-or t ·fe\1'1\ I ~ CV\Cf-eA~ol ';:;,otVI~s (II'}C{l?Ofi~ ··- . 'rV\. ·- ,1\'\vE<.>f~ . l-q . P~e>Ql.(,(;€J:S' On rk ... 9H-..ev h ~- __ ~~ _ _ c.:onS\itMU s ___ &/tift. __ l'l'\O~i'1 _ .fJ.ett less _·tv _c;yeflcA
.. a!'-:- . (pf\S:vti'Dyi ~0 i'\ « -. ' To I'Y\"'"Ke . C\.. _ ~h:;JVL9d _ eccn:::m\Cc (l'Y't21!.lth over r!-f
J91'5 ·+erm, _ 411 ~Y\.c'f-eg?"'ot __ 3Q!V;'Vl2)J C\f~ 1"1\l:f-t' ~~+~~e. J'{"\ _ Jq~f'Jbh>r~ ____ ~0'0 :"' ___ ·\-tt_ g-rc~~:rk _ mi1h± _ fw.ve.
~etv~d r ___ aMI _ 11 results iY\ - ~- __ Jrtu~.se ol_ ~lowtk, ___ l r {k _ ~--~- ·/-- _
-~_:___.---------
\ A3 --' --- - -1;--- - -
'• Economics 91403,2013

12
Q(AQ6{{DY\ 111\r() o.),
f
?Lt. ____ ..:. . ..:. ___ _
L~
/
Economics 91403, 2013
ASSESSoi{j
USE 0NLj~1
1.··
t
ij !i n !
!
I I I
I I I j
I I
I

Low Achieved
Question Score Commentary One N2 This candidate has received a N2 in this question because they:
a) Failed to shift AD, incorrect AS shift to right and explained impact on employment. (1)
b) Correctly shifted the AD curve but did not shift the AS curve. The AD shift is not explained correctly (2). The impact on employment (3) has been explained but lacks detail for merit.
Two A4 This candidate has received an A4 in this question because they: a) Correctly shifted the AS curve and explained the impact of improved
productivity on the AD/ AS model in brief terms (4). A detailed reason for the AS shift, more specific use of the model and explaining the impact on economic growth and/or inflation are needed for a merit answer.
b) Incorrectly shifted the AS curve and explained the incorrect shift (5). c) Provide no further explanations to support or extend a) and b).
Three A3 This candidate has received an A3 in this question because they: a) Briefly explained the impact of increased consumption on Real GDP
growth and employment but made an incorrect time period reference to the business cycle model (multi-line graph) in a) (i). (6)
b) Briefly explained the impact of increased saving on Real GDP growth and employment including a correct time period with reference to the business cycle model but did not define savings in economic terms (7).
c) Provided further brief explanations without reaching the detail required for a higher score (8).
Total: 09

L 91403
_j
1111111111111111111 ,_ NZ~A NEW ZEALAND Q UALIFICATIONS AUTHORITY MANA TOHU MATAURANGA 0 AOTEAROA
Level 3 Economics, 2013
SUPERVISOR'S USE ONLY
91403 Demonstrate understanding of macro-economic influences on the New Zealand economy
Achievement
Demonstrate understanding of macro-economic influences on the New Zealand economy.
9.30 am Monday 18 November 2013 Credits: Six
Achievement with Merit Achievement with Excellence
Demonstrate in-depth understanding of Demonstrate comprehensive macro-economic influences on the New understanding of macro-economic Zealand economy. influences on the New Zealand
economy.
Check that the National Student Number (NSN) on your admission slip is the same as the number at the top of this page.
You should attempt ALL the questions in this booklet.
If you need more space for any answer, use the page(s) provided at the back of this booklet and clearly number the question.
Check that this booklet has pages 2-12 in the correct order and that none of these pages is blank.
YOU MUST HAND THIS BOOKLET TO THE SUPERVISOR AT THE END OF THE EXAMINATION.
© New Zealand Qualifications Authority, 2013. All rights reserved.
High Achievement
TOTAL 12 ASSESSOR'S USE ONLY
No part of this publication may be reproduced by any means without the prior permission of the New Zealand Qualifications Authority.

2
You are advised to spend one hour answering the questions in this booklet.
QUESTION ONE: THE INFLUENCE OF TRADE POLICIES ON THE NEW ZEALAND ECONOMY
New Zealand records big December trade surplus
In the December 2012 quarter, New Zealand recorded its biggest December trade surplus since 1991, as imports- particularly of aircraft- fell more sharply than exports.
The trade surplus was $486 million in December, equal to 12% of exports- roughly 10 times the average surplus of $49m for December in the previous five years, Statistics New Zealand said. Source (adapted): www.3news.eo.nz/NZ-records-big-Decernber-trade-surplus/tabid/421/articleiD/284802/ Default.aspx
Government policies designed to encourage a balanced current account could include signing free-trade agreements, and intervening in the foreign exchange market, so that the exchange rate is favourable to a trade surplus. These policies will also affect employment in the New Zealand economy.
Graph One - Foreign exchange policy
Price level (PL)
~ . ~R 'y I ~"~
Income, employment, output (Y)
(a) (i) On Graph One above, illustrate the influence that an exchange rate favourable to a trade surplus would have on the macro-economy.
In your answer:
label the curves
label any curve shifts
• identify the equilibrium points
Economics 91403. 2013
' r]-
ASSESSoR~I' USEONI.Y,
l '

~SSESSOR', USE ONLY,·
(ii) Explain the impact of an exchange rate favourable to a trade surplus on employment, by referring to the changes you made to Graph One.
~e .<:UY1'{v.s; -f 'f e,.,pcrl- -1? t~oel- e~r--~----'!?-.\' A-P -4- t "( --.. t roclcl,•c--,
-r- 1 e"'ro, 'C)"'----t II Av, &-ch""""eJe v-""f-e. ..P.,.vo..o-v..ble +o "' -1,-.,..Je .S->rflv~ \>=cis to ~ [V'c,...""'""-e
\Y< e.-per+ ~I c\r, "''n ,.\c 0 I e..ds +, ""'~- tN-<"'=-:'-e l'v, re;\- .. -e-:->f'e-rt
;;c, e.-r--" h=. 1'-"'c~ e. ,..__, J lrv- per-t hs <lee~ e. \"' """"'"e.. ,,
re~"'»f'ov-+- },-..<\\ <::h;<f't-~~ "iJCd,.'"'\3""{-.,_J~~ouvv-e. ....
ASSESSOR USI;ONLY
\<.o"'"' AD ·to >1-t> 1~ l~"~e II-,_ ~8r"''O"'k .Jev-..-, .... .,J Is \~s {j) +o o-.- i""'e~se tvx Veoo-\ ~bf'. \r-"'""'- e- \lA_ re,..f cSJ>f' ~')/
le~s j ' ·-·I "' r. {.; .. -.. ~ ,~::v.·-·"'"·· · TO .;.-~ ,;._,Of<;,. :o,e 1""' e coV1 o '-· c 9V<'>"'-1""' ~1 v.ce 1 "'~ ~ -r..>
f'v'O'<"'"_ fJOClJs ~d .Se,Y/ceS ?V"'r/.J,(,_ lh ft,e_.. (lcv-M~, ~h~e...
rv-. fL.,,_. level &P w-lpul tr~·l/_ le~ to iW'I lhc_~"c rhpv<;cJ.-cii
::>£, ~~e- &-e. r-o-r---e__ clev-.~J- ~ )J<JJC>oi.s ~cl- S'evv1'ce>. ~ev,
r rocLcf-,'""'""' l'h c~s.e J ~ ;v,__, ,~., CV"~ e., (eve I ~ . lJ. ~jO.(~,.....,-t- Js heeded +"' p~ce ~o.re fJ0eds ""'"'.../. "'"""ic-es @
/Vj '/t,e /0 fv-re_ /
I Question One (b) is on page 4 ~
Economics 91403, 2013
4
The government has macro-economic goals of a balanced current account, as well as full employment.
(b)
Graph Two- Free trade agreements Price level
(PL)
j'LI
jL t ______ ------I
1 I 1 I
'-t-1 y '(I 'l'f
Income, employment, output (Y)
Compare and contrasl_tll~U~ff~!i~ of signing free-trad_l~__<!g.r:eements on the macroeconomic goals of a~alanced current account AND full employ~
In your answer:
/ make changes to Graph Two, above, to illustrate the influence that free trade agreements would have on the macro-economy. Label curves and identify equilibrium points
•
refer to changes in Graph Two
explain how free trade agreements can lead to a talanced current accou;tl
explain how free trade agreements can lead to~oyment) explain why free trade agreements could be more effective at achieving a balanced current account than full employment.
• S,·~,"'~ ~- i'cee- 4-,,.,J.,e "CCreer-"""+ . """""'s th,.t (\- Ls -~.i!:r
R- 1\J""' ?eel~ . to. -reA:-~ .r-,<~ ;""' F~ 8""" J.s: ~ <L
l:e,rwC....s {e ofh"r- CC>v\'\~ _ .. ~ 1011"3'"'j -i~;.sf 'line he~ ~C/'~ ~~~~ .
-+<ooce."'e" r~=s _ """P~ VV'II ,~-,c,-'<,.s:e_ r'¥1 ~. ~fu.re _ he+-- r
rV.,cy-e"S"'- ,~-, 7~+- l.-v1-n ~./e,.,,s -h, il'lcre...-.&e.- fix, '7/fJ'~fJ"'he
de"" ~cl' f?-o fr-J t.D -f,;, A V1, lhts 1r-.' f) ~
r>IS:O f-ec-../s. fo .;>-., 1io c:v""'""E'.
I"" pric-e /wei -Rvv- f'L'io PLi ;;;,-._J 1i-, Ore"'"-"' f'rr-.
Y f-c>'fr.~ ............. .
~vi-- 1-o."'-J
..................... ~ ~ ....
Economics 91403, 2013

5
/n ne-1-: e.-rov-<1- w.,,'cJ,
cl., ~"'hd.. . / 1'1 ~s e ,,, ,1-J) ~- A-bc ~Ac'/lle.o.-4.3 1e .. ~. •"c~<?, _
(n oJ!-pul level Jro fA, Y +o Y!, S'r'vy-e fh<re ~ Vv<Y<?
fev-{f'ods ,.....,d SerVJt-e7 iiJe •. lev-el +r,jtJJ.cf,'c-.._, ~1/1
cfe,.,_ ,.-..., d
AS_SE;SSOR'S USEON.LY
I'M p~di ,__._,_ "', '/! /ecxjs {-o. ~~ r0C~ct"c--..JI<cVJ"-.:;;.ea.VV'"'!PCl!J(c:Jns'4 t (f) lecave>e ·":are . /'"'"'?,(e..
--~
-~ fJL~o~s. _____ ~c.~ S-eyv,'ces fkf-- heed
f!o,--. """' ,hc~.&e. /IU"-b<?.--···· . 1> l'~s ~II I e,..h . {~
.fo pr:boLce_)\'«~e- '"'~II '""fb
• free-- t.r-l -e. ~l'ee-vce""+ .. <>ve. fv.cre- e..f&c!-ive ,.f-.<'>chi<"Ve ,J,.,,/;,-,c--«zct
cvrr--,·t-- =o ~<+-- ikn -10/l ~""'p/:J ~t- he~ e. ;-f- t's "" t ~ . heCe>'.so~ fet fhe level ~ pr,Jvc...hc-v. ~,( +fo-e_ /'Pve/ ~
. e"'ple3 ~-+- HI/ I'Mc v-~.s e_, l;u+- if- -~ v._dl J..,-(2;"' ;.f..c!J h<>Ve ""· pcos r've.. = f~ c 1- . CM he .f. ..,,.,,.,.+- 1/c h roJt kr '!/ 11-tfJf'CA/e
#,e CJ-v-r-g,<(-- =eco~t-:.~
Economics 91403, 2013

6
QUESTION TWO: THE INFLUENCE OF GOVERNMENT POLICIES ON GROWTH AND INFLATION
In recent years suggestions for government policies to stimulate economic growth, while maintaining price stability in the New Zealand economy have included making Research and Development (R&D) attractive to business, removing regulations to improve productivity and investment, and reducing government spending. . . Source (adapted): www.scoop.co.nz/stories/P01011/S00043/nz-needs-world-leading-pro-growth-policies.htm
Complete (a) to (c) to compare and contrast the influence that different government policies have on economic growth and inflation.
(a) (i)
Graph Three-Removing regulations to improve productivity
Price level (PL)
y 'l, Income, employment, output (Y)
On Graph Three above illustrate the influence that removing regulations to improve productivity has on the macro-economy.
In your answer:
label the curves
• label any curve shifts
identify the new equilibrium.
(ii) Explain the changes you made to Graph Three.
~r,ov''"':5 ~u1,..\-; ,_, ~o '""Prove f,-,clvd;v i ~ b """' -r~ \o-> ~ 'fhe eov~~i • s\'"'-Ce '\t,e, 30V'"'rY\ \"-~'1- V'·i\1 CV\c
. f,.,.L.d.;v; bJ I fh.ls 1-v- \1 ld.s io "-I-, ~~~',.,
\~e ;>-, 'OlJt)'«"-5-"''~e JetA-<,..,.-<1 ~"" ~·· /)
Economics 91403, 2013
I ' L--
AssEssoRl' USEONL~
l
(t

IS OR\ ONLy
Price level (PL)
7
Graph FourReducing government spending
Yr Income, employment, output (Y)
(b) (i) On Graph Four, illustrate the influence that reducing government spending has on the macro-economy.
In your answer: • label the curves
label any curve shifts • identify the new equilibrium.
(ii) Explain the changes you made to Graph Four.
f:'eLc,·;j S""&-V;"'-<>"'-·t- .cp ,_J,.,5 i's p~ o{. o. c~~+-i 0'-> >j
!=lsc~\ F"'''(;J. ~e.Lce.. 8ovcrV\v-.-~. ~..,-vci,'\B v-..-e-,o..."' ~+-
ther-e- is ~ "'" \Yweo'\-v-..,..._.,1 bd T~e tJ~nr, r---"""T vhi~
~tv<fl ,.,.J.s -to ""' de('\'<>.~,..,__ I""' "'EJCI rev .,.-fe. de"",...-. cL .Ro '""'" /H) to ni:> I • \!A ,·s i's I .,.,.Jg 4e .;::,. . J Q c y-~ e""----'""'.J..-c-Jr <) t-
.a., ._.., Y ~cJ ~ 1 """'d de C're-s>;>~. ~~-~n·ce /eve/ f..ro"'"'
!L Jc pc,. ~/'=-·. ·------------------~~~__....---___..-
Economics 91403, 2013
ASSESSOR'S USE ONLY

8
The government's task of managing the economy is made difficult by the challenge of achieving both economic growth along with maintaining price stability. ·
(c) Compare and contrast the effectiveness on achieving economic growth and maintaining price · stability of the two suggested policies of removing regulations to improve productivity and reducing government spending.
In your answer:
• explain the effect of encouraging productivity on both economic growth and price stability
explain the effect of reducing government spending on both economic growth and price stability
• explain which policy is more effective in encouraging economic growth and maintaining price stability
integrate changes to Graphs Three and Four.
• ?"'cov0'TJ''-:3 pv<><Lc1ici *0 ~-c;ll le.,.o! s. ,j_o ~ l"'cre.o.-,.e \>, ba+t-,
ecoV\<>"-{<:0: 0""~ ~d 'f''jce . \1-'v'.v\ ~. -1-h~ _,__,·I\ 4,'":: ... 1"-<>re.
1i1ves+~+_-- 8~dn--g so .. o/h<'c pr<ldvcfivi!J "'c/1 llocr'"'-'Se. '(/lo,~ ""-"//
I
{e,Js ,/a ,...., ih~&e.- (1-, v"""'( GDP "'-~l'oh to..'// !">t ~e ~ eceno,.._,'c_ I· SJ>;,c;,;:,·~ ?~ . . . . . . .. .. ······ ........ . - . .. . .
rovAiJ. ~~ IMCC~3e Cle.J_s__lo dei"'~cL puf{l'l~fi<:.~
• /2edvcf":J governr,,g-•"f--- sr~dt!J _ ~11 f%d .> l-·o i}. ~CY"e""'""-c (in, be f-0 ® I£C'""Vjorvfc '#n>&.Jf, ,.._,Jpn'c-e._ 1-evv(. &e;;v,se 1£,"'-r?o- P"'e -"'" J"'-"""'~'e.
·- .. -- ··- ... -· I .·
.. fh1J?J ou~u"t level wf",'d> )e,As lo ... ~ ckcv%;e lfrl I!"C'bfl"'"'"','c gn>-4h .
. 7h,:s ~f le..J.s ft, _';>_ Jvcc_~;-ec- rv, price /GVd ~cJ ,:-, PI ch' A-<.
• fllcovv-~() -e f(() eM: {-,VI ~ IA/'Yl . bo hO,e e...P{Jee-h've.. fh__, re..Jvc'<!.
ftre ga/<':'Mr"<V'-r Sf"6"-,dn:::; _. becov.;-e,. be>/h econo Joo..-,t. 27"' ~
... '?hd pn'ce fe-ej w<1/ be rk""'-se. lt,,:s v..<'// .-be 1--</e.
e~cf-ive. l'ln £Vl('DVY"';;,fjt':J g'C0'10f/'-'<'C 90~ _,_.,J. ~'v,f_;,fhi'::J
frl~e sf~b,;l; !J .} ..... .. . .
Economics 91403, 2013

OR
"'
9
QUESTION THREE: MACRO-ECONOMIC INFLUENCES
6.0
4.0
'* 2.0 fj 3: e 0.0 \!!
·2.0
-4.0
NZ employment growth and real GOP growth
Sep. 2000
Sep. 2002
Sep. 2004
Sep. 2006
Sep. 2008
~"'"- HLFS employment growth ..,._Real GDP growth
Sep. 2010
Sep. 2012
Source (adapted): www.rbnz.govt.nz/statistics/econind/
Complete (a) to (c), to discuss the impacts that the business cycle and macro-economic influences have on growth and employment.
(a) (i) From the resource above, identify a time period when the New Zealand economy could have experienced increased consumption.
'"'""""" 2.-<50 2.,_ ·h £00 6 ;/ ~ ~cc=~~-~--~- - c/ ·-··· o-~ ----- ------- ·
(ii) Explain the impact that increased consumption has on Real GDP growth and employment. Refer to the business cycle model in your answer.
\""""-<C- !"' oov.ou'J-1-io'-' _ Vc-e~s ~ ... +---1-h-e.r-e.- ~ ~ere. <l e~d
O"l ~~'ce :;,, . S:r•,ce- tloe.-~:I!J~(j deM-_~d
_i'hCr<ta:se..1 ~~~§~#-;;C\ft~---" ~II 5J, ce.. 1ke7r<5J.~vT:b£r~~-"
f--;cre_ &&ads """d ,Se-rvice.J. ENelkb\e h fhe .e.Q_Or-orvJ· [ncre~.se In v--esl
\Ybp ~ f',e'V"--.s ~+ li-.er-e 1> s-, i"'-'pv-eve~e-n+- il'l <>C'ono ""-1'c (3"'JNth.
""" \,.,cres-'e lV\ pr<>cl-d.;";'J- 'i'<O "-"Cr-e-~ods s-,d &e,v,1 '\-loe Oe;-,~d. More. J>rvJ-c.·hv;tJ Lvi/1 1-J.s _ {.., ~~
I Question Three (b) is on page 10 II>- I
Economics 91403, 2013
ASSf;SSOR'S USE ONl-Y

10
(b) Define what savings is, and explain the short-term impact that increased levels of savings has on Real GOP growth and employment.
Refer to the business cycle model in your answer.
~-o>v''-'3 is ~~ h-t-ihe.--co"'>ouv-.-"C~ ""o'\- .Q~<l,_ D-1 8~ """"d &evvices. /h~g, ~1"\ /~/ ~"'"""''"'j "'-:e.,..__,s 'fi.,f -~h""'-
irv•/1 be ~ dec...._,s e ov-, ~ C(/C-.& ~-"7:: .sp -6"-:'ct.':J , 1/, •'.s "'-' i // I~ <k>
,. ,J,<Y~ ,_ 1V, cJ,kM;v-..,d, l'i3v !his h,·// .;).!Co le,J..s io <> Jec<~e_ ,-.., ..... . ...... f. .. ...... ... .... . .. ..... .. . .
('e:>o~~J .<>/.so Jecv-~-e.. /"-, eco,..,o'"'-lc EfCO""'h b-e""-'"'"" ~-!-,~.,_
~Ye- less ~cl~"';J 1'0. ~e-Co0'!J. fhe 'fVt>cl.c'h'vi '!:J heeds {:o
cfecy:-a, ~ . .:;.s. -fM<f.cv-e <'>'C /ocy .. ivvch Qo~ds ?'-1cL S-ovv1ce.s ~~ b-b(e.
/h fhe Ccvl-ff:y.. ?hce. pre>cL-cfiv•!J decv-·ess<y fe,Ls '-"•'// C-e.A.s fa IP
d<>cr~e .. 1'2 ~~+- Jec,__.• e. fe.ss E'!_"ple- -;;r-Q.._ he;sd.ed- te
P'"dvc e. less f}'>ods ~ SeYVJ'c.,." it,""-7 b-e~~
The macro-economic influences of consumption, savings, and inv:stment should not be viewed as independent, with all three having an influence on each other. The right balance between the three can help ensure sustained economic growth over the long term.
(c)
In your answer:
•
•
•
•
explain ONE positive and ONE negative impact of increased consumption on the macro-economy
explain the link between savings and investment
explain ONE positive and ONE negative impact of increased savings on the macroeconomy
explain which is more likely to lead to sustained economic growth - increased consumption, or increased savings
refer to the business cycle model in your explanation .
/he,.....~ e. 1"'1 CGV<&v""'f'+i "'1\ "'-"II I bAs to ,_.. i"~e- \'1-, }Mc-e_~J
'-"~io\;, \S V\oi- if"d I~ \fls -b l-,13 ~, J- uko ~<>ve.- ::>- l""'sil-;ve
e~ec-\ <>S. 11- "'-•'II . \'>,t~e-
Economics 91403, 2013
@

ESSOR1 E ONLY~
'
11
• \o\' people ~
h-teh _ \vo4er-e.d
"'"""'"' ":J ~ere) (\- i<s po.ss;b\.,. _ ~~--- It Is
Y-&+e , lhts NB~ i- \ ,.J -Ia d "' in "' t- +-b:: ~e ~'h~:e:: 16~;;_~~
• ~V\Dre~£_~ .. ln~~c; ._..;(( le,d s -4-e su,-(.,_'..,ed e.=Y\0 ""-ic arowl"fi_ ---··-·· ______ /
- (hev-~ e. [h '""'SV "/"f-lo--. _ f--~s -lk,. ·\ -/r,e Soc..[eb _ .O>r"" ')"_~_d_
;,. kof-~ V'-o<A0,") 0'1 3""'J_g P-J d Service.!> J'),
wi'/ f ( e ,d s 4 ""' r>-. ere "'-.S e f'l ve-., I (3'D.p +I.e.. 11>/e/ ol'-- ecoho<-,'c_ rookh -~---- -- ---··
9 . .. '--- ...
\
Economics 91403, 2013
The.. Eco no~ . -,h •' s
r,J..,;~ e>-Lso . JVJO·-e-,.., e_ .
I
I
I
ASSESSOR'S USE ONLY

QUESTION NUMBER
3
<>d i)
12
Extra space if required.
Write the question number(s) if applicable.
Economics 91403, 2013
ASSESSOR'S USE ONLY

High Achieved
Question Score Commentary One A4 This candidate has received an A4 in this question because they:
a) Failed to shift AS left, correct AD shift, explained why the AD curve shifted (1) and the impact on employment. (2)
b) Correctly shifted the AD curve but did not shift the AS curve. The AD shift (3) has been explained but lacks detail for merit (required). The impacts on the current account (4) and employment (5) have been explained in detail.
Two A4 This candidate has received an A4 in this question because they: a) Incorrectly shifted the AD curve (6). b) Correctly shifted the AD curve and explained the impact of decreased
government spending on AD (7). Not in-depth. c) Provided further explanations of the incorrect curve shift from a) and has
not provided an in-depth reason why the decrease in government spending has caused the AD curve to decrease. (8)
Three A4 This candidate has received an A4 in this question because they: a) Explained the impact of increased consumption on Real GDP growth in
some detail but didn't specifically explain the impact on Aggregate Demand. (9)
b) Explained the impact of increased saving on Real GDP growth in some detail but didn't specifically explain the impact on Aggregate Demand. (10)
c) Provided no further relevant points. Total: 12