Embed Size (px)
Citation preview
33
Indonesia―11
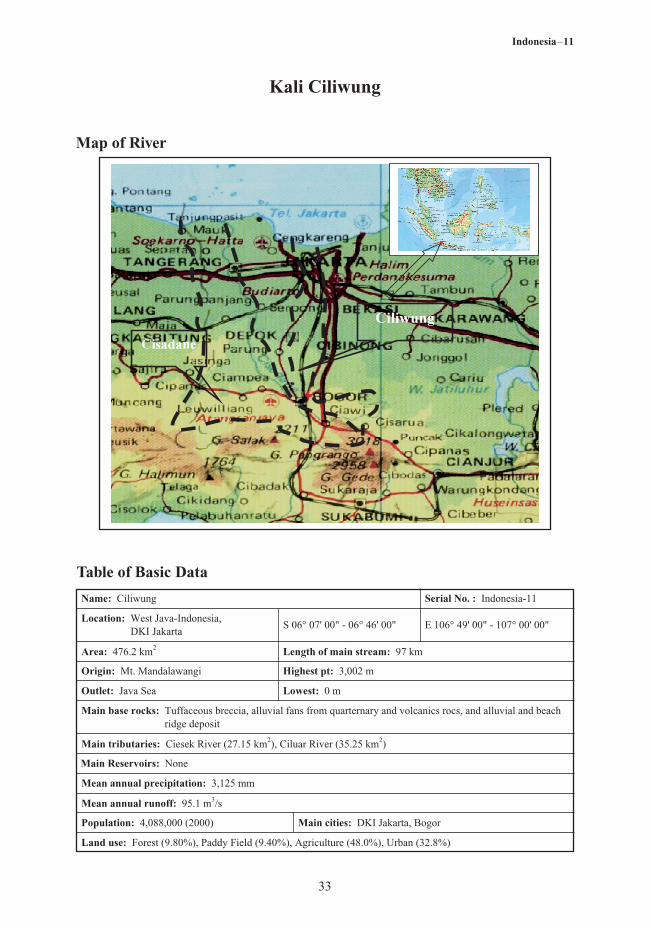
Kali Ciliwung
Map of River
Table of Basic Data
Serial No. : Indonesia-11
Location: West Java-Indonesia, DKI Jakarta
Area: 476.2 km2
Origin: Mt. Mandalawangi
Outlet: Java Sea
Main base rocks: Tuffaceous breccia, alluvial fans from quarternary and volcanics rocs, and alluvial and beachridge deposit
Main tributaries: Ciesek River (27.15 km2), Ciluar River (35.25 km2)
Mean annual precipitation: 3,125 mm
Mean annual runoff: 95.1 m3/s
Population: 4,088,000 (2000)
Land use: Forest (9.80%), Paddy Field (9.40%), Agriculture (48.0%), Urban (32.8%)
E 106° 49' 00" - 107° 00' 00"
Length of main stream: 97 km
Highest pt: 3,002 m
Lowest: 0 m
S 06° 07' 00" - 06° 46' 00"
Main cities: DKI Jakarta, Bogor
Name: Ciliwung
Main Reservoirs: None
34
Indonesia―11
1. General Description
Ciliwung river is 97 km long, has a catchment area of 476 km2, and is located in the western region ofJava where it flows through two provinces, West Java and the special region of Jakarta. The Ciliwungriver has its source at Mt. Mandala Wangi in Kabupaten Bogor with the highest peak at 3,002 m Theriver flows in a northern direction passing several active volcanoes, Mt. Salak (2,211 m), Mt. Kendeng(1,364 m), and Mt. Halimun (1,929 m), crosses two main cities Bogor and Jakarta before finallyflowing into the Java Sea. The main tributaries are located in the upper catchment and are the Ciesekand Ciluar with respective lengths 9.7 km and 21.0 km and catchment areas of 27.15 km2 and 35.25km2.
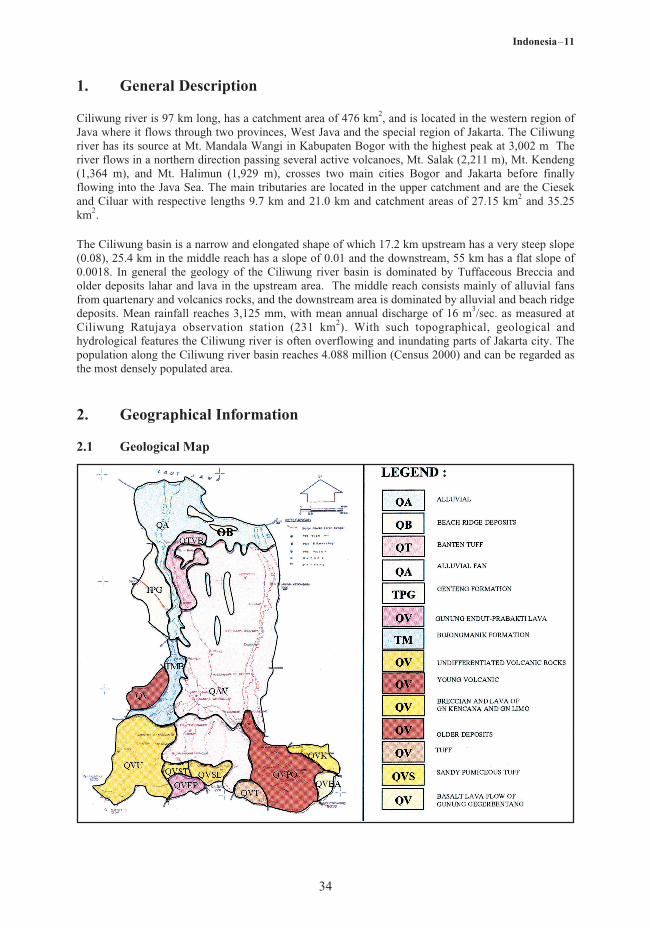
The Ciliwung basin is a narrow and elongated shape of which 17.2 km upstream has a very steep slope(0.08), 25.4 km in the middle reach has a slope of 0.01 and the downstream, 55 km has a flat slope of0.0018. In general the geology of the Ciliwung river basin is dominated by Tuffaceous Breccia andolder deposits lahar and lava in the upstream area. The middle reach consists mainly of alluvial fansfrom quartenary and volcanics rocks, and the downstream area is dominated by alluvial and beach ridgedeposits. Mean rainfall reaches 3,125 mm, with mean annual discharge of 16 m3/sec. as measured atCiliwung Ratujaya observation station (231 km2). With such topographical, geological andhydrological features the Ciliwung river is often overflowing and inundating parts of Jakarta city. Thepopulation along the Ciliwung river basin reaches 4.088 million (Census 2000) and can be regarded asthe most densely populated area.
2. Geographical Information
2.1 Geological Map

35
Indonesia―11
No.
1
Name of river
Ciliwung(Main River)
Length (km)Catchment area
(km2)
97.00476.20
Highest peak (m)lowest point (m)
30020
CitiesPopulation(Million)*
Bogor (1.419)
DKI (2.433)
Land use(%)
F (9.80)P (9.40)A (48.0)U (32.8)
2Ciesek
(Tributary)9.7027.15
1334495
3Ciapus
(Tributary)21.0035.25
300119
F: Forest; P: Paddy field; A: Agriculture (vegetable field, grass field); U: Urban (Census 2000)
2.2 Land Use Map
2.3 Characteristics of River and Main Tributaries

36
Indonesia―11
2.4. Longitudinal Frofiles
3. Climatological Information
3.1 Annual Isohyetal Map and Observation Stations

37
Indonesia―11
No.
1.
2.
3. Jakarta Obs.
Cibinong
Cipanas
Station
07
125
1,100
Elevation(m)
S 06° 10' 00"E 106° 49' 00"
S 06° 28' 00"E 106° 53' 00"
S 06° 44' 00"E 106° 59' 00"
Location
1971 - 1989
1971 - 1989
1972 - 1979
Observationperiod
2,105.9
2,862.63
1,125.39
Mean annualprecipitation
(mm)
RH, T, R, DS
RH, T, R, DS
RH, T, R, DS
Obsevationitem1)
3.2 List of Meteorological Observation Stations
RH: Relative Humadity, T: Temperature, R: Rainfall, DS: Duration of Sunshine
ObservationStation
Jan Feb Mar Apr May Jun Jul Aug Sep Oct Nov Dec AnnualPeriod forthe mean
19.6 19.9 20.2 21.2 21.3 20.5 20.3 20.5 20.8 21.3 21.2 20.6 71.0 1973 - 1989
441.3 324.3 470.1 289.5 284.2 136.2 105.2 106.3 296.3 261.1 259.2 227.0 1,125.4 1971 - 1979
87 87 85 83 83 79 80 78 78 79 80 79 191 1971 - 1989
12 14 33 49 52 - 59 47 53 35 22 27 - 1971 - 1989
Temperature(°C)
Precipitation(mm)
Relative Humidity (%)
Duration ofSunshine (%)
3.3 Monthly Climate Data
Station: Cipanas
Station: Cibinong
ObservationStation
Jan Feb Mar Apr May Jun Jul Aug Sep Oct Nov Dec AnnualPeriod forthe mean
25.4 25.5 25.9 26.2 26.3 26.2 25.9 26.1 26.3 26.5 26.3 25.9 26.0 1971 - 1989
353.9 337.0 377.3 359.8 309.7 191.7 165.5 171.9 189.3 290.1 299.4 391.0 286.4 1971 - 1989
86 86 84 84 83 81 80 77 76 78 80 83 82 1971 - 1989
37 50 57 67 72 71 79 80 76 71 59 51 64 1971 - 1989
Temperature(°C)
Precipitation(mm)
Relative Humidity (%)
Duration ofSunshine (%)
Station: Jakarta Obs
ObservationStation
Jan Feb Mar Apr May Jun Jul Aug Sep Oct Nov Dec AnnualPeriod forthe mean
26.2 26.5 26.9 27.6 27.6 27.4 27.3 27.4 27.5 27.6 27.5 26.8 27.2 1971 - 1989
404.6 289.3 234.0 111.8 131.2 115.4 57.8 58.5 78.6 112.1 229.4 283.3 1,825.9 1971 - 1989
82 81 80 76 76 74 72 70 69 72 75 78 76 1971 - 1989
37 43 50 61 61 61 66 69 65 61 50 45 56 1971 - 1989
Temperature(°C)
Precipitation(mm)
Relative Humidity (%)
Duration ofSunshine (%)
38
Indonesia―11
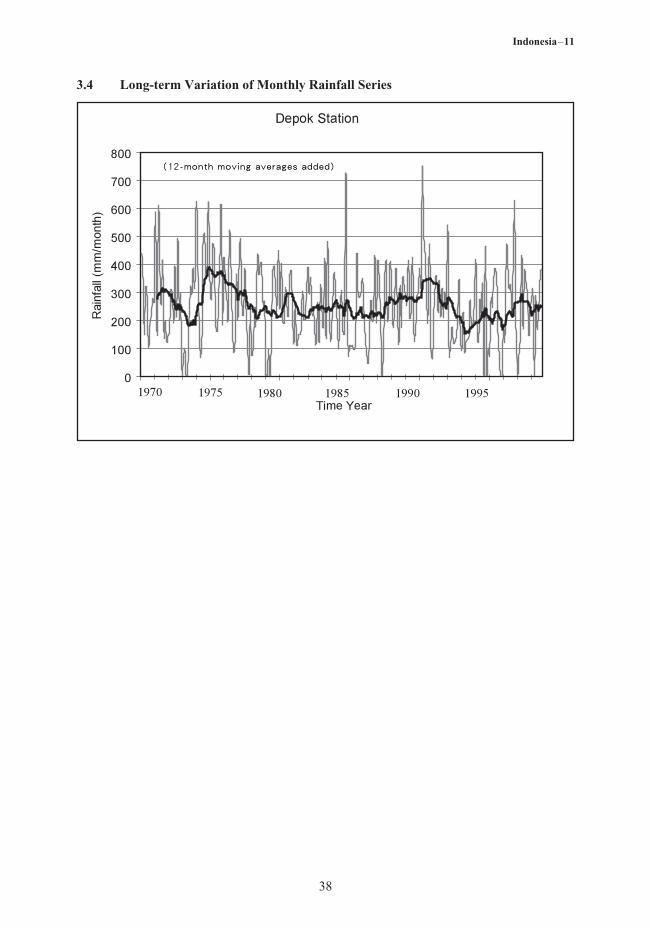
3.4 Long-term Variation of Monthly Rainfall Series

39
Indonesia―11
4. Hydrological Information
4.1 Map of Streamflow Observation Stations
K. Ciliwung-Kebon Baru
K. Ciliwung-Sugutamu
K. Ciliwung-KP. Kelapa
K. Ciliwung-CiawiK. Ciesek-Palumbon
Cisadane-Batubelah
Cisadane-Cikomunong
Cisadane river
Ciliw
ung river
Ciomas
Cilemen
No.
1. Katulampa
Station
S 06° 36' 07"E 106° 47' 38"
Location
158.0
Catchment area(km2)
1993 - 2001
Obsevationperiod
Q (d)
Obsevation item1)
(frequency)
2. Ratu JayaS 06° 19' 50"E 106° 50' 13"
231.0 1991 - 2001 Q (d)
3. Kp. KelapaS 06° 27' 22"E 106° 48' 12"
211.0 1988 - 2001 Q (d)
4. SugutamuS 06° 26' 20"E 106° 44' 00"
266.6 1992 - 2001 Q (d)
4.2 List of Hydrological Observation Stations

40
Indonesia―11
No.
1. 6.14 37.2 14.11 1.90 3.886 23.544 1993 - 2000
2. 11.22 105 34.50 5.35 4.857 45.454 1993 - 2000
3. 10.3 32.3 18.2 3.70 4.881 15.308 1992 - 2000
4. 23.95 80.5 39.05 14.02 8.983 30.195 1992 - 2000
-Q2)
(m3/s)Qmax3)
(m3/s)
-Qmax4)
(m3/s)
-Qmin5)
(m3/s)
-Qmax/A(m3/s/100km2)
Qmax/A(m3/s/100km2)
Period ofstatistics
1) Q: discharge; d: daily measurement; 2) Mean annual discharge; 3) Maximum discharge; 4) Mean maximum discharge; 5) Mean minimum discharge.
4.3 Long-term Variation of Monthly Discharge Series
4.4 Annual Pattern of Discharge

41
Indonesia―11
4.5 Unique Hydrological Features
As explained in the general description, the Ciliwung river basin has a long and narrow shape withsteep slopes in the upstream and middle reaches. Rainfall is very high and the recharge area is verysmall because of the densly populated and settled areas downstream. The relatively short duration ofrainfall in the upper areas of the river basin and local inflows downstream cause floods and inundationof the Jakarta area. This condition is aggravated when floods occur during a full moon when the oceantides are highest. To avoid inundation of the city area, a flood channel to direct flows to the west isbeing built and called “Banjir Kanal Barat”.
4.6 Annual Maximum and Minimum Discharge at Sugutamu (266.6 km2)
Year
1992 10.20 84.20 07 7.20
1993 - - - -
1994 05.11 73.45 07 7.15
1995 02.10 130.40 10 6.46
1996 02.10 58.5 08 3.31
1997 12.17 163.00 11 8.28
1998 - - - -
1999 03.13 93.00 08 15.14
2000 03.24 46.50 09 0.24
Maximum
Date Discharge1)
(m3/s)
Minimum
Month Discharge2)
(m3/s)
1), 2) Instantaneous observation by recording chart
4.7 Hyetographs and Hydrographs of Major Floods

42
Indonesia―11
5. Water Resources
5.1 General Description
The Ciliwung river basin with an area of 476 km2 covers only a very small percentage (0.363 %) of theentire Java region which is about 130,777 km2. Yet, because this river flows through the capital city ofthe Republic of Indonesia and often causes floods, special attention is given to flood control measures.Water resources of this river are used for agriculture activities upstream (water taken from Katulampadam), drinking water (a small amount), sanitation and water flushing. The barrage at Manggarai,located in the center of Jakarta, controls the water flow by directing it into the Banjir Kanal Barat andthus preventing floods during the rainy season. In the dry season water supply is only sufficient forsanitation and flushing purposes. Use of river water for agricultural purposes occurs mainly upstreamfrom a fixed weir at Katulampa.
5.2 Map of Water Resources System

43
Indonesia―11
Name of rivers
Ciliwung Banjir Kanal Barat 350 F
LocationMaximum capacity
(m3/s) Purpose1)
1) F: Flood control
1) A: Agriculture use F: Flood control W: Municipal water supply
Others
Name of River Facility Purpose1) Capacity (m3/s) Year of complection
Katulampa Weir A 4.9 1940
Manggarai Barrage F 350 1935
Bantarjati Weir A 0.03
PDAM Bogor Free Intake W 0.06
PDAM Cibinong Free Intake W 0.05
PDAM Citayam Free Intake W 0.06
PDAM Depok Free Intake W 0.03
Date Jul Aug Sep Oct Nov
pH 8.0 7.4 7.5 7.0 7.1
DO (mg/l) 7.0 6.4 8.7 7.0 7.0
COD (mg/l) 7.1 7.6 12 8.5 7.1
SS (mg/l) 10 22 52 28 36
Discharge (m3/sec) 0.1 3.46 3.46 4.5 1.22
5.4 Water Quality
River Water Quality at Ciliwung-Katulampa in 2003
6. Socio-cultural Characteristics
The Ciliwung River flows through two provinces, West Java and the Special Region of Jakarta. Twomain races dominate the region namely, the Sundanese (West Java) and Orang Betawi (Jakarta),therefore socio cultural characteristics differ from one area to the other.
In the Bogor area (Upper Ciliwung River) in the past were found two famous ancient kingdoms;Tarumanegara (4th-5th Century) with its great King Purnawarman and Padjajaran (15th-16th Century)with its King Sri Baduga. The existence of these Kingdoms is found from ancient inscriptions atCiaruteun (Tarumanagara) and Batutulis (Padjajaran).
Culture in the Bogor area is mainly Sundanese, such as can be observed from traditional dances, theKetuk Tilu or the Jaipongan which is modern, sensual and full of spirit. Specific Sundanese music canbe observed from the Degung, Calung, Angklung and Kecapi Suling.
5.3 List of Major Water Resources Facilities
Major Major Diversions and Canals

44
Indonesia―11
The upper part of the Ciliwung in the Jakarta region was once famous for a kingdom (Banten) withPangeran Jayakarta as King. The Yapong is a favourite dance in the area and Gambang Kromong aswell as Kroncong music can still be found at Tugu, north of Jakarta. Also famous is a humorous play,the Lenong, using a special Betawi dialect.
7. References, Data-books and Bibliography
Badan Pusat Statistik. 2001. Statistik Lingkungan Hidup Indonesia. Jakarta
INDEC & Associates Limited in Associated LAVALIN International Inc and NIPPON Koei Co., Ltd.May 1986. Vol. 1 Main Report. Cisadane River Basin Development Feasibility Study.
Nikken Consultants, Inc in Association with Nippon Koei Co., Ltd.1996. The Study on ComprehensiveRiver Water Management Plan in Jabotabek.
PT. Mettana.1998. Studi Potensi SDA dan Pemanfaatannya. Laporan Akhir. Proyek PKSA-CC.