Embed Size (px)
Citation preview

COPYRIGHT AND CITATION CONSIDERATIONS FOR THIS THESIS/ DISSERTATION
o Attribution — You must give appropriate credit, provide a link to the license, and indicate ifchanges were made. You may do so in any reasonable manner, but not in any way thatsuggests the licensor endorses you or your use.
o NonCommercial — You may not use the material for commercial purposes.
o ShareAlike — If you remix, transform, or build upon the material, you must distribute yourcontributions under the same license as the original.
How to cite this thesis
Surname, Initial(s). (2012) Title of the thesis or dissertation. PhD. (Chemistry)/ M.Sc. (Physics)/ M.A. (Philosophy)/M.Com. (Finance) etc. [Unpublished]: University of Johannesburg. Retrieved from: https://ujcontent.uj.ac.za/vital/access/manager/Index?site_name=Research%20Output (Accessed: Date).

Modelling Groundwater Monitoring for Rural Areas using Cloud
Computing
by
Mulunghisi Preference Mahwayi
A dissertation submitted in partial fulfilment of the degree:
MTech Electrical Engineering
in the
Department of Electrical and Electronic Engineering Technology
at the
Faculty of Engineering and Built Environment
University of Johannesburg
Supervisor: Prof. M.K. Joseph
29 September 2016
Johannesburg
South Africa

1
Declaration
I Mulunghisi Preference Mahwayi hereby declare that the dissertation titled “Modelling
Groundwater Monitoring for Rural Areas using Cloud Computing” submitted for MTech Electrical
Engineering at the University of Johannesburg is my original work. This dissertation has not been
previously submitted to another University or higher educational institution.
Signed ……………………………… Date……2016-09-29…...

2
List of publications
Mahwayi, M. P. & Joseph , M. K., 2016. Technologies for Groundwater Quality Monitoring in
Rural Areas, ICIDA'16, STH, UJ.
Acknowledgements
I am grateful to the Faculty committee for the opportunity given to enroll and do the research. We
are thankful to the Department of Water Affairs and Sanitation staff members for being available
and for their assistance with the data required for the study and also for the participation in
answering the questionnaires quickly and accurately. A special thank you to my supervisor Prof.
M.K. Joseph and for the guidance, advice and support throughout the study. I would also like to
thank the previous co-supervisor Prof. B. Twala for the support and guidance. I would like to thank
for the financial support provided by the National Research Foundation (NRF) for my MTech
studies.

3
Abstract
The study makes use of cloud computing for monitoring the quality of groundwater and electronic
sensors to detect physical and chemical characteristics of domestic water used in the rural areas,
Mpumalanga province. The data is made available via the database and then to the cloud. The
monitoring of water quality is important to humans because access to clean and potable water is
the greatest challenge experienced by rural residents in South Africa. The study determines the
physical and chemical constituents and highlights the key relevant substances to domestic water
quality and detects the level of contamination in the groundwater from the boreholes in
Mpumalanga province. By setting up an experiment based on secondary and primary data from the
boreholes used by the rural residents of Mpumalanga province, a cost-effective, scalable and
flexible model using cloud computing was developed. There were three phases of this study, first
to determine the constituents that highly contaminates the boreholes and it was carried out by
analysing the existing groundwater boreholes data (secondary data) provided by the Department of
Water and Sanitation (DWS) or by manually checking the properties using sensors (primary data)
and making this available in the database. The study used the cloud to monitor the quality of
groundwater. The second phase was to develop a cloud computing model for groundwater quality
monitoring in the rural areas. The third phase qualitative interviews were conducted to get more
insight on contamination of groundwater and this assisted in enhancing the developed model. The
contribution of the dissertation was towards providing a centralised solution for groundwater
monitoring to assist water consumers, water monitoring organisation (E.g.: Department of Water
Affairs and Sanitation) to be pro-actively informed concerning issues in the water supplied to the
rural residents. This will be a major contribution for the country in achieving the Sustainable
Development Goals and Millennium Development Goals by ensuring that safe drinking water is
supplied to the residents in rural areas. Our study showed that all the parameters from the actively
monitored boreholes located in the 18 Mpumalanga (South Africa) municipalities were within the

4
prescribed limits for no risk, as per the recommendation by the national guidelines for domestic
water use. The Emalahleni local municipality was the only municipality in terms of pH that was
below the prescribed limits. This research also indicates that in some municipalities, high
concentrations of Arsenic, Potassium, Manganese, Iron and Cadmium were within the prescribed
limits for the samples taken, despite the fact that the Fluoride, Nitrate concentrations, Chloride and
Magnesium in certain boreholes exceeded the prescribed limits. Due to the water shortages because
of the drought and contamination in the province, the reality is people will opt to use borehole water
due to the increase in contamination in groundwater hence the study monitored the groundwater
quality using the cloud and electronic sensors

5
Abbreviations and Acronyms
Abbreviation Meaning
DWS Department of Water and Sanitation
WHO World Health Organisation
WRC Water Research Commission
SANS South African National Standards
FEBE Faculty of Engineering and Built Environment
HSRC Human Sciences Research (South Africa)
SAAS Software as a Service
PAAS Platform as a Service
IAAS Infrastructure as a Service
ICOMMS Information for Community Oriented Municipal
Services
SMS Short Message Service
GSM Global System for Mobile
ADC Analogue to Digital Converter
WIFI Wireless Fidelity
DBLC Database Life Cycle
ERD Entity Relationship Diagram
RDBMS Relational Database Management System

6
Figures
Figure 2.1: Groundwater flow (Adapted from Lyle and Raymond 1988) ……………………….20
Figure 2.2: The conceptual reference model (Adapted from Mell & Grance 2011)………………23
Figure 2.3: Cloud Computing Usage (Adapted from Gartner 2009) …………………………….23
Figure 3.1: Schematic diagram for electronic sensors ……………………………………...........28
Figure 3.2: Methodology for Developing the Model …………………………………………….30
Figure 3.3: Cloud computing groundwater quality model ……………………………………….31
Figure 3.4: DBLC Database Life Cycle phases (Adapted from Rob et al. 2008)…………...........35
Figure 3.5: MVC software design pattern (Adapted from Bhatt et al. 2014) …………………….37
Figure 4.1: Water samples collection points for domestic water quality (Adapted from The
Department of Water Affairs and Forestry et al. 2003).……………………………………..........45
Figure 4.2: Count of active boreholes in Mpumalanga …………………………………………..48
Figure 4.3: Entity relationship diagram groundwater monitoring system.……………………..…52
Figure 4.4: Initial model for groundwater quality monitoring using cloud computing
……………………………………………………………………………………….…………...55
Figure 4.5: Final model for groundwater quality monitoring using cloud computing…………...56
Figure 4.6: Login screen……...………………………………………………………………......58
Figure 4.7: Search page……...…………………………………………………………………...58
Figure 4.8: Result view……………………………………………………………………..........59

7
Tables
Table 3.1: Substances of key relevance for domestic water quality use (Adapted from The
Department of Water Affairs et al. 2003) …………………………………………………........32
Table 3.2: South African standards for domestic water quality target water quality (Adapted from
DWS 1996) …………………………………………………………………………………......32
Table 3.3: Technology used to design the system ……………………………………………...37
Table 4.1: Groundwater data boreholes and locations.……………………………………........40
Table 4.2: Groundwater data monitored for domestic use
(Ca,Cl,Ec,F,K,Mg,NO3+NO2,Na,Temp,pH,As)…………………………………………………………..40
Table 4.3: Groundwater data monitored for domestic use (Cd, Fe, Mn, Zn) ….…………………..40
Table 4.4: South Africa standards for domestic water quality target water quality (Adapted from
Department of Water and Sanitation 1996) ………………………………………………….…41
Table 4.5: Details of electronic mail interviews ………………………………………………..42
Table 4.6: Substances of key relevance for domestic water quality use (Adapted from The
Department of Water Affairs and Forestry et al. 2003) ………………………………………...43
Table 4.7: Sampling period frequencies (Adapted from (The Department of Water Affairs and
Forestry et al. 2003) …………………………………………………………………………….45
Table 4.8: List and locations active boreholes in Mpumalanga ……………………………….47
Table 4.9: List of offline and online key substances monitored by the model ………………...49
Table 4.10: Hardness of water classified by Kunin (Adapted from DWS 1996) ………………49
Table 4.11: Physical and Chemical water quality results…………………………………….....50
Table 4.12: Pre-collected versus primary samples ……………………………………………..51
Table 4.13: The boreholes table.……………………………………………………………......52
Table 4.14: The municipality table.……………………………………………………………53
Table 4.15: The province table….……………………………………………………………...53
Table 4.16: The elements table.…………………………………………………………….......53
Table 4.17: The monitoring table.………………………………………………………….......54

8
Table of Contents
1 CHAPTER 1: INTRODUCTION ............................................................................... 12
1.1 Background review ......................................................................................................... 12
1.2 Aim of the research ......................................................................................................... 14
1.3 Problem statement .......................................................................................................... 15
1.4 Research questions.......................................................................................................... 15
1.5 Research objectives ........................................................................................................ 15
1.6 Issues and challenges ...................................................................................................... 15
1.6.1 Network and service availability ............................................................................. 16
1.6.2 Data migration between non-standard environments .............................................. 16
1.6.3 Endless resource ...................................................................................................... 16
1.6.4 Data security and privacy ........................................................................................ 16
1.7 Limitations of the study .................................................................................................. 17
1.8 Research methodology and design ................................................................................. 17
1.9 Ethical considerations ..................................................................................................... 17
1.10 Significance and Unique contributions ........................................................................... 18
1.11 Chapter summary ............................................................................................................ 18
2 CHAPTER 2: LITERATURE REVIEW ................................................................... 19
2.1 Introduction .................................................................................................................... 19
2.2 Groundwater ................................................................................................................... 19

9
2.3 Groundwater Flow .......................................................................................................... 19
2.4 Groundwater contamination sources .............................................................................. 21
2.5 Monitoring groundwater contamination ......................................................................... 21
2.6 Contaminated groundwater effects ................................................................................. 21
2.7 Treatment of contaminated groundwater ........................................................................ 22
2.8 Cloud computing ............................................................................................................ 22
2.9 Cloud computing usage .................................................................................................. 23
2.10 Related work ................................................................................................................... 24
2.11 Chapter summary ............................................................................................................ 24
3 CHAPTER 3: RESEARCH METHODOLOGY AND DESIGN ............................. 25
3.1 Introduction .................................................................................................................... 25
3.2 Study area ....................................................................................................................... 25
3.3 Research methodology and design ................................................................................. 25
3.4 Phase 1 ............................................................................................................................ 26
3.4.1 Data collection (secondary data) ............................................................................. 26
3.4.2 Advantages of using secondary data for this study ................................................. 26
3.4.3 Disadvantages of using pre-collected data for this study ........................................ 27
3.4.4 Sample and sampling techniques ............................................................................ 27
3.4.5 Data collection (primary data) ................................................................................ 28
3.5 Phase 2 ............................................................................................................................ 29
3.5.1 Identifying the research problem ............................................................................ 30
3.6 Procedure to develop the model ..................................................................................... 31

10
3.7 Phase 3 ............................................................................................................................ 33
3.7.1 Qualitative method .................................................................................................. 34
3.8 Database Life Cycle ........................................................................................................ 35
3.8.1 Database initial study .............................................................................................. 36
3.8.2 Database Design ...................................................................................................... 36
3.8.3 Implementation and loading .................................................................................... 36
3.8.4 Testing and evaluation ............................................................................................ 38
3.9 Study limitations ............................................................................................................. 38
3.10 Chapter summary ............................................................................................................ 38
4 CHAPTER 4: DATA ANALYSIS AND RESULTS .................................................. 39
4.1 Introduction .................................................................................................................... 39
4.2 Data analysis ................................................................................................................... 39
4.3 Qualitative interviews ..................................................................................................... 41
4.3.1 Primary Analysis: Electronic mail questionnaires .................................................. 41
4.3.2 Electronic mail questionnaires and responses ......................................................... 42
4.4 Quantitative Data ............................................................................................................ 47
4.4.1 Secondary data analysis .......................................................................................... 47
4.4.2 Analysis of water samples ....................................................................................... 48
4.4.3 Water hardness determination ................................................................................. 49
4.5 Results ............................................................................................................................ 50
4.5.1 Primary versus secondary data processing .............................................................. 51
4.6 Database life cycle phases output ................................................................................... 52

11
4.6.1 Initial study ............................................................................................................. 52
4.6.2 Database Design ...................................................................................................... 52
4.6.3 Implementation and loading .................................................................................... 52
4.6.4 Testing and evaluation ............................................................................................ 57
4.7 System outputs ................................................................................................................ 57
5 CHAPTER 5: FINDINGS AND DISCUSSION ......................................................... 60
5.1 Introduction .................................................................................................................... 60
5.2 Motivation use of cloud computing ................................................................................ 60
5.3 Conclusion ...................................................................................................................... 61
5.4 Future work ..................................................................................................................... 62
Annexure A: (PIC16F877A Source code) ................................................................................. 70
Annexure B: Procedure for traditional sampling ....................................................................... 73
Annexure C: Information required for data sheets ..................................................................... 77
Annexure E: System for groundwater quality monitoring ......................................................... 79

12
1 CHAPTER 1: INTRODUCTION
1.1 Background review
Domestic water quality is the greatest contributing factor to human health, an assurance of the water
quality safety is the foundation to the deterrence and control of diseases caused by contaminated
water. Studies have indicated that many people around the world are deprived of quality water.
Fifty percent of the world population were reportedly said to rely on groundwater for daily water
needs and forty-three percent of the remaining water is utilized for irrigation (UN-Water 2015). In
South Africa, there are approximately 51.77 million people (Statistics South Africa 2012) and from
this population, 52% live in the rural areas. It has been estimated that around 6 million do not have
access to safe sources of drinking water. The implication is the fact that a number of rural
communities rely on unprocessed groundwater and surface water for domestic and irrigation use.
In South Africa, groundwater contributes in the middle of 13 to 15 percent of the total available
water. The study determines constituents that highly contaminate the sources of groundwater for
domestic use in Mpumalanga province. The study uses cloud computing technology to develop a
model for analysing and monitoring the physical and chemical groundwater quality (primary data)
using electronic sensors. Present quality valuation methods are laboratory based, necessitating fresh
supplies of chemicals, trained staff and longer testing periods. By setting up the experiment, the
study developed a cost-effective, scalable and flexible model for groundwater quality assessment
monitoring using cloud computing and sensors to monitor the elements in groundwater in real-
time. Cloud computing is said to be a new business and evolving paradigm in the world of
computing (Rosenthal et al. 2010). Cloud computing well known as the “cloud”, is the technology
with the use of Internet and centralised remote servers hosted at the service provider premises. The
cloud computing enables individuals and companies to utilise software applications without the
worry of building their own hosting infrastructure and also have the ability to access information
hosted in the cloud by using any Internet enabled device which then allows efficient computing by

13
centralising processing power, bandwidth and data storage. Some well-known cloud computing
services are the social networking websites (E.g. LinkedIn, Instagram, Facebook, Twitter,
Myspace, etc.), Web-based email Gmail and documents or hosting services that are shared on the
Internet Dropbox and Google drive. A number of studies in the past 10 years have attempted to
define cloud computing based on different research conducted. There still is no standard definition
of cloud computing due to its complexity and broader coverage in terms of infrastructure and the
hosting of the software application. Mell & Grance (2011) defines “cloud computing as a
convenient model for on-demand shared pool of configurable networking resources for example
storage, software application and networks”. Boss G et al (2007) said “It is a pool of virtualized
computer resources”. Some of the benefits of cloud computing are to reduce the cost by allowing
customers to rent IT infrastructure instead of purchasing it, which therefore reduces the cost of
obtaining, supplying and supporting required computing power. Cloud computing bills customers
based on their usage of the service on a daily or monthly basis which further reduces costs. The
cloud is centralised, it enables users to access their cloud services using any web-enabled device
with Internet access irrespective of the location. The cloud from the consumer perspective is
scalable and flexible. This means that an organization can change and scale the level of cloud
service it is receiving and cloud softwares offered as building blocks. Consumers have the option
to select the software blocks they need and organizations can customize enterprise applications by
just selecting the software and services which are suitable for their business needs. Due to cloud
computing cost effectiveness, mobility, scalability and flexibility. The cloud computing model
framework was used (Chen et al. 2002) to model educational application taking the benefit of the
available cloud services which enables them to communicate with students and perform their day
to day operational duties over the Internet. One of the monitoring methods as an example is the
traditional monitoring borehole sampling method (Mpenyana-Montasti et al. 2012). A remote
water quality monitoring system using wireless sensors for prawn farming pond was developed

14
(Haron et al. 2009). In Bangladesh, Kamal et al (2000) developed a geographic information system
to detect areas with Arsenic contamination.
1.2 Aim of the research
The research aimed at investigating the use of cloud computing to develop a model to assist in
monitoring groundwater contamination, checking both physical and chemical characteristics in
water for domestic use in the rural communities of Mpumalanga province. Traditional monitoring
boreholes sampling methods were used (Mpenyana-Monyatsi et al. 2012) to collect groundwater
samples and this was done between September and November 2008 from a number of villages in
the rural communities of Mpumalanga province. Mpenyana-Monyatsi et al (2012) reported that the
water for domestic use in some rural areas is not fit for human consumption. The study showed that
the water had a high concentration of Magnesium, Calcium, Fluoride, Nitrate and high Turbidity
levels. The poor bacteriological characteristics can cause harm to the health of the consumers. The
distribution of groundwater directly to residents without any form of purification or testing may
lead to contaminated water being used by rural residents. The assurance of the delivery of good
quality water is required, with real-time capability to monitor levels of contamination. The cloud
computing technology is an excellent alternative for monitoring the quality of groundwater in
Mpumalanga province. The cloud is a cost-effective, mobile, scalable and flexible way of collecting
the water samples and delivering the water quality results as a service to consumers. The research
provides substantial benefits for public health, the economy, the environment and a major
contribution to the country in achieving the Sustainable Development Goals and Millennium
Development Goals by ensuring that safe drinking water is supplied to the residents in rural areas.
Monitoring groundwater quality is important for minimizing negative impacts to the environment
and it improves public health protection.

15
1.3 Problem statement
The Mpumalanga rural communities depend mostly on groundwater from the boreholes for
domestic and irrigation use. The Olifants River that runs from the Witbank passing the Kruger
National Park to the Mozambique Ocean, is said to be contaminated from mining effluent and raw
sewage. This results in the majority of the rural communities to depend on groundwater for
domestic and irrigation use. The study conducted (Mpenyana-Monyatsi et al. 2012) showed and
also revealed that the water is non-potable for a number of rural communities. Higher concentration
of Magnesium, Calcium, Fluoride, Nitrate, Turbidity levels was reported. The distribution of
groundwater directly to residents without any form of purification or testing has led to contaminated
water being used by rural residents. There is no groundwater quality monitoring model developed
using cloud computing in South Africa.
1.4 Research questions
How do we develop a model for groundwater quality monitoring in rural areas?
1.5 Research objectives
The main objective is to develop a cloud computing groundwater quality monitoring model for
rural areas in South Africa. The sub-objectives are:
To determine which physical and chemical constituents highly contaminate groundwater
in Mpumalanga province.
To monitor the quality of water in rural areas of Mpumalanga.
To develop a model for groundwater quality monitoring using cloud computing.
1.6 Issues and challenges
The decision to adapt cloud computing is tackled by several issues and challenges. Some of the
challenges can be resolved with careful planning and design. The following are some of the known
challenges with cloud computing implementations (Kuo 2011).

16
1.6.1 Network and service availability
The benefit of cloud computing can only be achieved with the availability of the cloud provider
service and adequate network bandwidth. Any service or network absence will disconnect the
consumers off their valuable data and applications.
1.6.2 Data migration between non-standard environments
Most cloud service providers use proprietary cloud-based applications. Those proprietary
applications are not interoperable which makes it very difficult for consumers to move their data
to another provider’s infrastructure or back to their in-house servers.
1.6.3 Endless resource
Meeting consumer resource requirement by providing them the ability of scaling resources up or
down is one of the most desired cloud computing advantages. This feature has to be carefully
implemented to prevent service failures due to insufficient resources. To prevent service failures
and control the continuous increase in the allocation of resources, scaling must be limited by agreed
on threshold or scaling rate.
1.6.4 Data security and privacy
Two important issues challenging cloud computing are associated with storing and securing
information. In cloud computing data has to travel between user’s devices and the cloud computing
service provider data centres, which will make it an easy target for hackers. Data security and
privacy must be guaranteed whether it is traveling or still kept in the cloud. Encryption algorithms
can be used ensuring data security in the cloud-based storage, but it is not very useful with cloud
applications because data has to be decrypted inside the cloud at some point. Cloud applications
can work on encrypted data without decrypting them but it would require more time and consume
more resources.

17
1.7 Limitations of the study
Any cloud computing design or implementation depends on network and service availability in the
areas of operation. Poor or limited broadband connectivity may pose serious problems in data
transportation from and to the receiving devices. HSRC (2011) reported that most of the South
African rural areas have limited broadband connectivity. This may be a limiting factor for the
research.
1.8 Research methodology and design
The study determines the physical and chemical constituents of key relevant to domestic water
quality and detects the level of contamination in groundwater in boreholes. The study proposes a
cost-effective, scalable and flexible model to monitor the water quality from the boreholes using
cloud computing. The research demonstrates the model by conducting three phases: First, the
determination of the constituents that highly contaminates the boreholes and it was carried out by
analysing the existing groundwater boreholes data (secondary data) provided by the Department of
Water and Sanitation (DWS) or by manually checking the characteristics using sensors (primary
data) and making this available in the database. The study used the cloud to monitor the quality of
groundwater. In the second phase, the study developed a cloud computing model that will assist to
analyse and monitor the physical and chemical characteristics of water supplied by the boreholes
for domestic water use. The third phase qualitative interviews were conducted to get more insight
on contamination of groundwater and this assisted in enhancing the developed model. The research
methodology chapter discusses the three phases in more detail.
1.9 Ethical considerations
All information regarding documents to be analysed and data collection, consents were distributed
seeking for permission to use the data. An ethical clearance was also submitted to the University
of Johannesburg FEBE ethics committee with the questionnaires used to interview the research
participants.

18
1.10 Significance and Unique contributions
Sufficient supply of clean and fresh water is a basic need for rural and urban areas. The research
has significance in constructing a more scalable, flexible model to monitor groundwater quality in
rural areas using cloud computing and electronic sensors, ensuring that communities are supplied
with good water quality for their daily needs. Other studies have used electronic sensors to monitor
physical and chemical characteristics in water, the literature review chapter 2 section 2.12 related
work discusses the studies in more detail. In this study electronic sensors were used detect
contamination constituents in groundwater from the boreholes, both physical and chemical
characteristics and the data is made available via the database and then to the cloud. The electronic
sensors enabled the physical and chemical characteristics to be monitored in real-time from the
cloud, giving authorised users access from any type of device with Internet access to view the
groundwater quality results of a particular borehole and its location in Mpumalanga. The study
developed a model for groundwater quality monitoring with the use of cloud computing and
electronic sensors technology.
1.11 Chapter summary
Domestic water quality remains the greatest contributing factor to human health. This chapter
discussed the research aim, problem statement, limitation of the study and research questions and
research objectives. Section 1.8 research method described the methods to answer the research
question and chapter 3 will discuss the methods in more detail. The following chapter discusses the
literature of the study.
19
2 CHAPTER 2: LITERATURE REVIEW
2.1 Introduction
The chapter reviews the study literature. The chapter begins by defining groundwater in section
2.2 and section 2.3 to 2.7 discuss the groundwater flow, the effects of contamination in
groundwater, monitoring methods of groundwater and methods available to treat contaminated
water. Section 2.8 provides the definition of cloud computing and section 2.9 shows the cloud
computing usage in different sectors. Section 2.10 concludes the chapter by reviewing related work
conducted by other experts.
2.2 Groundwater
Groundwater is precipitation of rain from the clouds that seeps into the recharge areas of the earth
surface. The earth recharge areas are regions of the earth surface where water can penetrate into
the ground. The volume of water entering the ground is determined by the ability of the rock or soil
type to absorb the water. The ability of rocks or soil to hold water from the earth surface is called
Porosity. Different soil types can absorb a certain percentage of surface water into the ground. Clay
soil is said to absorb up to 48 percent of water, gravel can absorb up to 25 percent, permeable rocks
can absorb water less than 1 percent and saturated sand can hold up to 20 percent of surface water.
Clay soil is well known to have particles creating friction and can excellently stop water
movements, regardless of the larger absorption ability (Lyle & Raymond 1988).
2.3 Groundwater Flow
The water from the rainfall entering the ground flows downwards until a point where the water
seals the penetration openings in the rocks or the soil. The water table is the highest level of the
penetration zone. The water table changes in pattern and the levels are controlled by the yearly
seasons and the volume of rainfall received. In spring it is normally higher and in summer it drops
due to less rainfall. The unsaturated zone is the region between the earth surface and the water

20
table. The zone cannot provide water for the boreholes, but can provide the roots of the plants with
moisture while the water passes through the zone. The underground level of permeable rock or
soil that harvests water is called the Aquifer (Lyle & Raymond 1988). The Aquifer harvests large
amounts of water when there are huge penetrations openings and harvests small amounts when
there are tiny opening in the rocks or the earth surface. The region that provides the boreholes with
water is called the contribution zone and some refer to it as the catchment areas. The area consists
of a large part of the recharge area of the aquifer. The boreholes pumping is influenced by the area
that superimposes cone of depression, this might extend further than the contribution zone. The
boreholes pumping induced recharge forces the groundwater to move towards the borehole that
will not regularly contribute groundwater to the borehole (Lyle & Raymond 1988). Figure 2.1
illustrates the entire process that occurs from the formation of the clouds and the resulting moisture
condenses into water droplets (rain).
Figure 2.1: Groundwater flow (Adapted from Lyle and Raymond 1988)
21
2.4 Groundwater contamination sources
Groundwater can become contaminated in many ways. Sources of groundwater contamination can
be humanitarian disasters, the disposal of mining polluted effluents, household products
(chemicals, oil, gasoline, road salts etc.) that may be mixed and carried with the water from the
earth surface into the ground. Animal faeces and fertilizers, overtime may come in contact with
sources of groundwater (boreholes) or be carried with the water that seeps through penetration areas
on the earth surface.
2.5 Monitoring groundwater contamination
The groundwater could be contaminated from a range of improper disposal as discussed in section
2.4. It can be challenging to identify the sources of contamination without some sort of monitoring
methods in place. Monitoring methods or systems to assist in identifying the sources of
contamination and also the monitoring of microbiological, chemical and physical properties are
required to facilitate the monitoring process. One of the monitoring method as an example is the
traditional monitoring borehole sampling method (Mpenyana-Monyatsi et al. 2012). Water samples
were collected directly from the boreholes using a sampling device or equipment and taken to the
laboratory for testing. Arsenic contamination was monitored using a GIS system with the aim to
assist water operators on deciding proper usage of the groundwater and ensuring residents are
supplied with good water quality (Kamal et al. 2000). Section 2.12 highlight related work
conducted by other studies to facilitate the monitoring of the groundwater.
2.6 Contaminated groundwater effects
Fifty percent of the world population rely on groundwater for domestic and irrigation use. Polluted
water has short and long term effects on human and animal’s health. Polluted water may also have
an effect on crop farming. In South Africa, the common water diseases resulting from polluted
water are, Billarzia, Malaria and Cholera.
22
2.7 Treatment of contaminated groundwater
The process called groundwater remediation is regarded as the only approach used to treat
groundwater. The method is said to include contaminated soil, contaminates transfer and the move
of groundwater to a place for the final treatment. The remediation process involves the removal of
contaminates or transforming the contaminants into harmless harvests. The groundwater is at times
pumped and treated by removing contaminants using techniques which include air stripping,
thermal desorption, extraction, containment, precipitation, soil washing and then pumped back to
the boreholes, storage tanks or into the ground.
2.8 Cloud computing
The cloud computing is a technology that enables individuals to host, operate and do business via
the Internet from anywhere in the world from their Internet web-enabled devices which include
smartphones, tablets, computers and other devices available in the market today that can connect
to the Internet. A number of studies in the past 10 years have attempted to define cloud computing
and there still is no accepted definition of cloud computing today due to its complexity and broader
coverage in terms of its offering. Mell & Grance (2011) defines “cloud computing as a convenient
model for on-demand shared pool of configurable networking resources for example storage,
software application and networks”. Boss G et al (2007) said “It is a pool of virtualized computer
resources”. Cloud computing is said to be a new business and evolving paradigm in the world of
computing (Rosenthal et al. 2010). Figure 2.2 adopted from (Mell & Grance 2011), shows three
cloud computing actors that are applicable to any cloud computing model which are cloud
consumer, cloud provider and cloud broker. The cloud consumer procures cloud services from the
cloud provider via a cloud broker that act as an intermediary between the consumer and the
provider. Cloud servicers available today are as follows, software as a service, Platform as a service
and Infrastructure as a service. The consumer also has deployment options to select from and they

23
are public cloud, private cloud, community cloud and hybrid cloud to address the target audience
and security requirements.
Figure 2.2: The conceptual reference model (Adapted from Mell & Grance 2011)
2.9 Cloud computing usage
Cloud computing is being used in different sectors e.g. Financial services, Telecommunications,
Manufacturing, Education and other sectors. A survey conducted in 2009 on the usage of cloud
computing revealed that cloud computing is being used more in the Financial and Business sectors
in comparison with other sectors. Figure 2.3 adapted from Gartner (2009), shows the results of the
survey.
Figure 2.3: Cloud computing usage (Adapted from Gartner 2009)

24
2.10 Related work
In Bangladesh, Kamal et al (2000) developed a geographic information system (GIS) to detect
areas with Arsenic contamination. A microcontroller based system was proposed (Jain et al.
2014) to detect chemical properties in groundwater using electronic sensors. Rivett et al (2013)
a research team (ICOMMS) at the University of Cape Town the Civil Engineering department,
developed a cell-phone application to improve the groundwater quality data collection in the
rural communities, South Africa. Haron et al (2009) developed a remote water quality monitoring
system using wireless sensors for prawn farming pond. The developed prototype system was
leveraging on wireless sensors in detecting the water quality and short message service (SMS)
technology in delivering an alert to the farmers upon detection of degradation of the water
quality. Three critical water quality parameters to prawn health were monitored which are pH,
temperature and dissolved oxygen. A cost-effective microcontroller based system was developed
(Fisher & Kebede 2010) to detect temperature and water status for crops. Investigation of the
use of satellite technology to predict aquifer vulnerability, locating and tracking groundwater
resources and depletion was conducted (Becker 2005). A River water pollution detection and
an alert system was developed (Markovic et al. 2009) for the prevention of water contamination.
A web-based water level detection system was developed (Reza & Tariq, 2010) to enable the
monitoring of water level via the Internet. Mahwayi and Joseph (2016) proposed technologies
for groundwater quality monitoring in rural areas. Above studies are all related to what this study
intends to answer.
2.11 Chapter summary
The study literature was discussed in this chapter. Groundwater and cloud computing was defined
and also highlights related work conducted by other studies in section 2.10. The next chapter,
chapter 3 discuss the study research methodology.

25
3 CHAPTER 3: RESEARCH METHODOLOGY AND DESIGN
3.1 Introduction
In this chapter the study overall research approach will be discussed. The chapter begins by
discussing the study research area in section 3.2. Section 3.3 provides the study research
methodology and design in more detail. Section 3.4 to 3.7 covers the procedure to develop the
model. Section 3.8 concludes the chapter by discussing the study limitations.
3.2 Study area
The study was conducted in Mpumalanga province. The province is located in the eastern part of
South Africa, bordering Swaziland and Mozambique. The province is a home to 4.04 million South
Africans. The rural communities in the province depend mostly on groundwater from the boreholes
for domestic and irrigation use. The alternative to the source of water in the province is the Olifants
river that runs from the Witbank passing through the Kruger National Park to the Mozambique
Ocean and the river is reportedly (Veelen and Dhemba 2011) said to be contaminated from mining
effluent and raw sewage. This leaves the groundwater from the boreholes as the primary source of
water in the province.
3.3 Research methodology and design
This study aims to answer the research question “How do we develop a model for groundwater
quality monitoring in rural areas?” and its sub-objectives which are, to determine which physical
and chemical characteristics highly contaminate groundwater in Mpumalanga province, to monitor
the quality of water in the rural areas of Mpumalanga and to develop a model for water quality
monitoring using cloud computing. The research was broken down into three phases and these are
discussed in 3.4, 3.5 and 3.6.

26
3.4 Phase 1
This phase determines the characteristics of constituents that highly contaminate the boreholes and
this task was carried out by analysing the existing groundwater boreholes data (secondary data)
provided by the Department of Water and Sanitation (DWS) and also by manually checking its
properties using electronic sensors (primary data) and making this available in the database and
then to the cloud. Section 3.4.5 will explain how the primary data was taken to the cloud.
3.4.1 Data collection (secondary data)
Secondary data is data that are collected by someone else for another purpose (Johnston 2014). In
South Africa, the Department of Water and Sanitation (DWS) is responsible for managing the "raw"
water quality data from the Resource Quality Information Services national monitoring
programmes for specific rivers, boreholes and dams. The secondary data collection for the study
was requested by email ([email protected]) from the DWS. The data provided was then
formatted and grouped based on the Entity-Relationship Diagram (ERD) illustrated in figure 4.3 to
better organise the data in a Relational Database Management System (RDBMS). MYSQL
database was used for the system model developed. The use of pre-collected data shortened the
data collection process and also the determination of which physical and chemical characteristics
highly contaminate groundwater in Mpumalanga province. Section 4.5 discuss the analysed results.
The quantitative research strategy was used and quantitatively to enhance the model.
3.4.2 Advantages of using secondary data for this study
Time and money was saved by using pre-collected groundwater samples.
Historical and present data made the study even better, giving more insight to the change
of measurable elements overtime and assisted in enhancing the model.
Formed a baseline variable to compare how accurate the groundwater model is.

27
Data verification and validation was not required as it was from a reliable source
(Department of Water and Sanitation).
3.4.3 Disadvantages of using pre-collected data for this study
The secondary data did not give the present reflection of the state of the groundwater
elements.
3.4.4 Sample and sampling techniques
The study used convenience sampling due to limitations in the use of pre-collected borehole
samples. Convenience sampling is a non-probability sampling technique where subjects are
selected because of their convenient accessibility and proximity to the researcher (Zikmund
1984). The samples were taken from the groundwater data supplied by the Department of Water
and Sanitation. The data was analysed and showed that the Mpumalanga province had 1117
boreholes. Out of the 1117 boreholes, 35 of the boreholes were actively monitored. The study
used the 35 boreholes sample size that is actively monitored, as these were the boreholes that the
rural residents from various municipalities in the province rely on as the main source of drinking
water. The sample remains viable since the 35 boreholes have been actively monitored since
1995 up until 2015 have given accurate results to address the objective of this study and to assist
in developing the model in phase 2. Further criteria for selecting the actively monitored sample
size was based on the following:
Regular water samples taken since 1995.
Data consistency over sampling periods.
Physical and chemical substances monitored.

28
3.4.5 Data collection (primary data)
The primary data was collected manually by checking the physical and chemical properties using
sensors and making this available in the database and then to the cloud. Primary data is original
data gathered for a specific research problem intended to be solved (Johnston 2014). In order to
accomplish this, the study adapted the proposed system (Jain et al. 2014) to monitor groundwater
quality with a microcontroller and electronic sensors. A microcontroller based system to sense the
water quality substances of key relevant to domestic water use obtained from the boreholes was
developed. Due to the limitation in availability of water sensors, the system that was developed
used a pH sensor (DFR analogue ph meter kit), Electrical conductivity (CS547A EC sensor) sensor
and a Temperature sensor (18B20 Digital Temp Sensor) to demonstrate the collection of primary
data from the borehole that was scheduled to execute every 5 minutes daily for 31 days. Figure 3.1
shows the schematic diagram of the groundwater quality monitoring system using electronic
sensors. The circuitry for the system was designed using Proteus software, a tool for virtual system
modelling and circuit simulation application.
Figure 3.1: Schematic diagram for electronic sensors

29
An 8bit high-performance microchip processor (PIC16F877A) with built-in support for analog to
digital (ADC) capability was used for the system. An LCD interface was added for displaying the
water quality measured values from the sensors and also the Global System for Mobile (GSM),
wireless fidelity (WIFI) modules and RS232 serial port interfaces. The various channels allowed
for the data to be transferred to external devices in different ways depending on what the destination
device supports e.g. Personal computer can receive data via RS232 cable, USB cable or IEEE
802.11 wireless standard. This implied that the source device must be capable of communicating
using any of the channels. The C program was written which was then loaded to the microcontroller
(PIC16F877A) for measuring pH, Electrical conductivity and Temperature in groundwater.
Annexure C illustrate the C program. The data measured by the sensors was transmitted to MYSQL
database using an RS232 cable which was connecting the system to the computer where MYSQL
database was installed. The local instance of MYSQL database synced data every 5 minutes with
the cloud MYSQL database instance to make the primary data available in the cloud. This allowed
the Java web application to query the data in the cloud and display it in form of tabular form and
graphs. In chapter 4 figure 4.4 and figure 4.5 illustrate the initial and final model for the study.
Section 4.7 discuss and shows the system outputs.
3.5 Phase 2
The study reviewed several models and systems developed discussed in literature (Kamal et al.
2000; Jain et al. 2014; Rivett et al. 2013; Haron et al. 2009; Fisher & Kebede 2010; Becker 2005;
Markovic et al. 2009; Reza & Tariq 2010; Mahwayi & Joseph 2016) to develop a cloud computing
model for groundwater quality monitoring in rural areas. The data taken to the cloud in phase 1
both secondary and primary, was monitored using the developed cloud computing model from the
cloud. In design science (Hevner 2004) “the research output is to produce a viable artifact in the
form of a construct, a model, a method, or an instantiation”. The artifact for the research was
produced in this phase and further enhanced in phase 3. The aim of the study included the design
of a groundwater monitoring model using the cloud computing technology. Figure 3.2 provides the

30
methodology that was followed to develop the cloud computing model. In chapter 4, section 4.6
the model implementation is illustrated.
Figure 3.2: Methodology for developing the model
3.5.1 Identifying the research problem
Mpenyana-Monyatsi et al (2012) revealed that groundwater for domestic use in some rural areas
of Mpumalanga province is not fit for human consumption. The study found that there is high
concentration of Magnesium, Calcium, Fluoride and Nitrate, Turbidity levels and especially poor
bacteriological characteristic of water source pose a serious threat to consumers. Serious
intervention procedures need to be put in place to monitor the quality of drinking water from the
boreholes used by the rural resident for domestic activities. The traditional monitoring sampling
techniques in place (Annexure B for details) may not reflect the current status of the groundwater.
Suggestively the use of cloud computing technology together with electronic sensors to collect
primary data can be used.
Identifying the problem: Research
question to be answered
Literature review
Identify the key elements to be
monitored derived from phase 1 and
phase 3
Phase 2: developing the model based
on findings from phase 1 and based
on similar models
Revising and developing final model
based on feedback from experts and
participants of the research

31
3.6 Procedure to develop the model
Weinhardt et al (2009) designed a cloud computing business model that will allow business to host
their application and data in the cloud. The study adapted the model to come up with a model for
groundwater quality monitoring in rural areas. Figure 3.3 depicts the framework of the cloud
computing groundwater quality model designed for the study. The model is classified under
Software as a Service cloud computing software distribution model. This makes the groundwater
monitoring data to be available to customers over the internet. Table 3.1 illustrate the key
substances monitored by the model for domestic water use. In table 3.2 is the list of substances and
the standard acceptable water target ranges for each substance is shown.
Figure 3.3: Cloud computing groundwater quality model

32
Table 3.1: Substances of key relevance for domestic water quality use (Adapted from The
Department of Water Affairs et al. 2003)
Table 3.2: South African standards for domestic water quality target water quality (Adapted from
DWS 1996)
Key substances Units Target water quality range
Microbiological quality
Faecal coliforms counts/100
mR 0
Total coliforms counts/100
mR 0 – 5
Physical quality
Electrical conductivity total dissolved mS/m 0 – 70
Ph pH units 6.0 - 9.0
Turbidity (NTU) 0 – 1
Chemical quality
Arsenic Fg/R 0 – 10
Cadmium µg/R 0 – 5
Calcium mg/R as Ca 0 – 32
Sodium mg/R 0 – 100
Chloride mg/R 0 – 100
Fluoride mg/R 0 - 1.0
Iron mg/R 0 - 0.1
Manganese mg/R 0 - 0.05

33
3.7 Phase 3
In this phase the developed model was enhanced by conducting qualitative interviews to get more
insight on contamination of groundwater. An online electronic mail questionnaires method was
used to understand the secondary data collection process used by the Department of Water and
Sanitation which include the frequency of data collection and trigger for the data collection as well
as the people who were involved during the data collection process. Section 3.7.1 highlights some
of the studies that used electronic mail questionnaires method to conduct qualitative interviews.
Questionnaires below were asked and ethical clearance was also submitted to the University of
Johannesburg FEBE ethics committee. Some of the questions used were adapted from (The
Department of Water Affairs and Forestry et al. 2003). Chapter 4 in section 4.3.2 presents the
interview responses.
1) Why do we need to collect a water sample?
2) What is meant by water quality?
3) What substances must be analysed to determine the water quality?
4) Why is it important to know how to collect water samples?
5) Where must water samples be collected?
6) How often is the chemistry data collected from different boreholes in Mpumalanga?
7) What is the difference between ground and surface water sources affect sampling?
8) What methods are used to collect the chemistry data and tools?
9) Who collects the chemistry data from the boreholes?
Total hardness mg/R 50 – 100
Magnesium mg/R as Mg 0 – 30
Nitrate/Nitrite mg/R N 0 – 6
Potassium mg/R 0 – 50
Zinc mg/R 0 – 3

34
10) Who validates the chemistry data before the data is published on the WMS database?
11) List of chemical characteristics of groundwater that water affair staff normally checks?
12) Which physical quality of groundwater is most important when it is for domestic use?
13) Is there Internet services/cloud services used for groundwater monitoring?
3.7.1 Qualitative method
An increase in the usage of qualitative research method in various studies have been seen in the
last 20 years. The usage has resulted in an observable shift in relation to studies that depend on in-
depth interviewing and observation in comparison with the usage of structured or questionnaires
interviewing. Challenges related to in-depth interviews and observation have been identified by
studies over the past decades which include time, cost and limited research sample size says (Taylor
& Bogdan 1998; Miles & Huberman 1994; Strauss & Corbin 1998; Patton 2002; Denzin & Lincoln
2005; Gubrium & Holstein 2002; Kvale 1996; Miles & Huberman 1994; Patton 2002; Strauss &
Corbin 1998; Taylor & Bogdan 1998). There are three recognised types of Internet based methods
to be used when one undergoes qualitative data collection and namely they are 1 virtual focus
groups, 2 online asynchronous and 3 synchronous interviews. The online interview method was
used for data collection of qualitative data collection and data analyses. Phase 3 of the study discuss
how this was carried out. The use of computer mediated case tools email was used as form of
communication between the interviewer and the interviewee. In contrast to the studies that used
asynchronous are summarised below with their findings. The electronic mail computer mediated
case tool was used (Foster 1994) with intentions to observe ways University lecturers conducted
curriculum planning and exploring benefits of the use of electronic mail interviewing. Potentials of
the use of electronic mail was investigated where (Murray 1996; Murray 1995) interviewed about
5 nurses to find out how and why they use computer mediated case tools such as electronic mail.
Electronic mail interviewing method was also used (Young et al. 1998) to interview 6 professionals
in the educational domain to find out how technology is used at the workplace, assisting in

35
formulating guidelines for researchers to effectively conduct electronic mall interviews. Viability
of electronic mail as a method for qualitative in-depth interviewing was investigated with prosthesis
users from number of countries (Sixsmith & Murray 1998). The 3rd and 4th year college scholars
were tasked (Curasi 2001) to compare the use of electronic mail versus face to face interviewing
methods. Sample size of 48 customers were interviewed using both methods, allowing them to
weigh the two methods. Internet user experience was examined interviewing a sample size of 17
women designers using the electronic mail method (Kennedy 2000). Electronic mail interviewing
method was used to examine influenced Internet literacy in lecture rooms (Karchmer 2001). Sixty
scholars were interviewed seeking information behaviour of social science faculty through the use
of electronic mail interviewing. Benefits of electronic mail method compared to the use of face to
face interviewing were examined to unpack challenges, benefits to better conduct effective
electronic mail interviews. In chapter 4 the results of the qualitative interviews are discussed for
this research.
3.8 Database Life Cycle
The database life cycle (DBLC) was used as a guideline to produce the artifact for the study. The
database life cycle (DBLC) has six phases and the phases are illustrated in figure 3.4. This section
discusses what was carried out in each phase of the DBLC.
Figure 3.4: DBLC Database Life Cycle phases (Adapted from Rob et al. 2008)

36
3.8.1 Database initial study
The work done in phase 1 of the research was the input to this phase. The objectives and actions
below were carried out.
Analyse the secondary and primary data
Define the data format, entities, structure, tables and the conversion methods to be used.
This was the input to phase 3 implementation and loading
Define data transportation mechanism to the cloud
3.8.2 Database Design
In this phase three stages of database design which are conceptual, logical and physical database
design were carried out. The RDBMS software used was MySQL database as discussed in phase
2. In the conceptual database design stage the actions carried out were data analysis and
requirements, entity relationship modelling and normalization, data verification and distributed
database. The logical design stage actioned the creation of the logical data model, validation of the
logical data using normalization, assigned and validated integrity constraints and reviewed the
logical data model. The physical database design stage focused on translating each relation
identified in the logical data model into tables and estimated the data storage that was required in
the cloud and also database security to be imposed after deployment.
3.8.3 Implementation and loading
In this phase the design specifications were translated into computer code and hardware. MYSQL
database was installed locally on a computer and the cloud server. After the installation of MYSQL
the database and tables were created. Secondary data was then loaded into the database tables. The
primary data from the microcontroller based system using electronic sensors developed in phase 1
was integrated to the database for samples to be loaded. The study also developed a Java web

37
application using the MVC design pattern. Table 3.3 summaries the technology that was used to
develop the Java web application. Chapter 4 section 4.7 discuss and shows the system outputs.
Table 3.3: Technology used to design the system
The Model View Controller (MVC) is a framework that separates an application into three main
components which are:
View: - all the output representation of information for the application which include
user’s, controls, charts or diagrams.
Controller: - accepts inputs and converts it into commands for the model or view
Model: - manages data, logic and roles of the application
Figure 3.5 illustrate the MVC software design pattern used to develop the Java web application for
users to view the monitoring results from the cloud.
Figure 3.5: MVC software design pattern (Adapted from Bhatt et al. 2014)
Development tool Eclipse IDE Kepler
Application server Tomcat 7
Programming language JavaEE
Database MySQL

38
The system deployment package for the Java web application was build using eclipse IDE which
produced a .war file type. The war file was deployed on tomcat server in the cloud. In the literature
section 2.8, discusses deployment options that a consumer can select from when deploying their
solution in the cloud. The system was deployed on a public cloud.
3.8.4 Testing and evaluation
In this phase unit, functional and end to end testing was conducted to determine if the application
meet the requirements. The unit testing was conducted to verify and validate the source code
correctness and the entity relationships amongst tables. The functional testing was performed to
verify the functional requirement of the system. The end to end testing verified the system
integration, to ensure that the data from the electronic sensors flows correctly to the cloud. The
public cloud was used to test the system.
3.9 Study limitations
Any cloud computing design or implementation depend on network and service availability in the
areas of operation. Poor or limited broadband connectivity may pose serious problems in data
transportation from and to the receiving devices. HSRC (2011) reported that most of the South
Africa rural areas have limited broadband connectivity. This may limit the accessibility of the
model from the areas that does not have broadband connectivity.
3.10 Chapter summary
In this chapter the methodology and design was discussed. The chapter also covered the three
phases of the research which include the sampling and sampling techniques, methods and the
procedure to develop the model. The next chapter, chapter 4 discuss the data analysis and results
of the research.

39
4 CHAPTER 4: DATA ANALYSIS AND RESULTS
4.1 Introduction
This chapter presents the data analysis and results of the study. The chapter begins by discussing
the data analysis in section 4.2. Section 4.3 discusses the qualitative analysis of interview data.
Section 4.4 discusses quantitative data analysis of the study. The results of the study are discussed
in section 4.5 and section 4.6 discusses the output of each phase of the database life cycle. Section
4.7 concludes the chapter by illustrating the system outputs.
4.2 Data analysis
During the research process challenges were faced when gathering the pre-collected data from the
Department of Water and Sanitations database for the research area Mpumalanga province that
prolonged the secondary data collection. Below are the challenges:
The Department of Water and Sanitation took time to respond to the data request for the
study.
The data provided indicated that only 35 boreholes were actively monitored out of 1117
uniquely identified boreholes, therefore this resulted in back and forward online
asynchronous emails and questionnaires being sent to DWS to understand why the data
that was provided had only 35 boreholes actively monitored out of the 1117 boreholes in
the province.
These challenges prolonged the data collection phase of the study. The delays of the pre-collected
data and also clarification as to why certain boreholes were not being actively monitored and the
inconsistency sampling period for some of them. It was critical to ensure that all the uncertainty
with the data had to be clarified first before the analysis phase could begin. Table 4.1, table 4.2 and
table 4.3 shows the secondary groundwater quality data provided by the Department of Water and
Sanitation. In table 4.8 the boreholes and their locations in Mpumalanga province are shown. Table
4.6 also shows the elements that are key substance to domestic water use that needs to be monitored.

40
Table 4.1: Groundwater data boreholes and locations
Table 4.2: Groundwater data monitored for domestic use (Ca, Cl, Ec, F, K, Mg, NO3+NO2, Na,
Temp, pH,As)
Table 4.3: Groundwater data monitored for domestic use (Cd, Fe, Mn, Zn)

41
Table 4.4 illustrate the South Africa standards for domestic water quality, indicating the parameters,
units and the accepted target water quality range for drinking water. The table assisted in the
analyses and data interpretation of the water quality from the boreholes in Mpumalanga province.
Table 4.4: South Africa standards for domestic water quality target water quality (Adapted from
Department of Water and Sanitation 1996)
Key substances Units Target water quality range
Microbiological quality
Faecal coliforms counts/100 Mr 0
Total coliforms counts/100 Mr 0 – 5
Physical quality
Electrical conductivity total dissolved mS/m 0 – 70
Ph pH units 6.0 - 9.0
Turbidity (NTU) 0 – 1
Chemical quality
Arsenic Fg/R 0 – 10
Cadmium µg/R 0 – 5
Calcium mg/R as Ca 0 – 32
Sodium mg/R 0 – 100
Chloride mg/R 0 – 100
Fluoride mg/R 0 - 1.0
Iron mg/R 0 - 0.1
Manganese mg/R 0 - 0.05
Total hardness mg/R 50 – 100
Magnesium mg/R as Mg 0 – 30
Nitrate/Nitrite mg/R N 0 – 6
Potassium mg/R 0 – 50
Zinc mg/R 0 – 3
4.3 Qualitative interviews
4.3.1 Primary Analysis: Electronic mail questionnaires
The online electronic mail (e-mail) interview was conducted with the Department of Water and
Sanitation. The Department of Water and Sanitation broadcast mailbox [email protected]
was used to distribute the questionnaires for the study. Table 4.5 summarises the details of the e-
mail interviews.
42
Table 4.5: Details of electronic mail interviews
N
um
ber
of
elec
tro
ni
c m
ail
pa
rtic
ipa
nts
Fo
cus
gro
up
Ele
ctro
ni
c m
ail
met
ho
d
Qu
esti
on
na
ire
Inte
rvie
w
per
iod
Nu
mb
er
of
elec
tro
ni
c m
ail
exch
an
ge
s Pa
rtic
ipa
tio
n
dro
po
ut
rate
s
20 DWS
staff
Invitation
posted to
GeoRequ
ests<Geo
requests
@dwa.go
v.za>
Single
electron
ic mail
follow
up.
1
month
All staff
members
replied
using the
broadcast
None
Twenty staff members from the Department of Water and Sanitation participated in the e-mail
interview and out of the twenty email participants, 86 percent of the study participants replied to
1-4 follow-up emails. The questionnaires for the study were all routed to the generic mailbox
[email protected] and participants replied using their work email address. Section 4.3.2
shows the questionnaires posted and responses from the staff members.
4.3.2 Electronic mail questionnaires and responses
1) Why do we need to collect a water sample?
Most water quality analyses cannot be done on site. Therefore, a representative volume
of water. Note: All participants gave the same answer.
2) What is meant by water quality?
Water quality is used to describe the microbiological, physical and chemical properties
of water that determines the fitness for use of a specific water source.
Microbiological quality: is the presence of organisms that cannot be individually seen
by the naked eye, which include protozoa, bacteria and viruses.

43
Physical quality: is the properties that may be determined by physical methods, such as
conductivity, pH and turbidity. Physical quality mainly affects the aesthetic quality of
water (taste, odour and appearance).
Chemical quality: is the nature and concentration of dissolved substances, such as
organic and inorganic chemicals including metal.
Note: All participants gave the same answer.
3) What substances must be analysed to determine the water quality?
A large number of substances are found in water. However, only a few commonly occur
in concentrations that cause adverse health, aesthetic or other problems of concern to
domestic users.
Note: 18 staff members interviewed referred the researcher to the recommendations put
forth (The Department of Water Affairs and Sanitation et al. 2000). Table 4.6 presents
the key substances relevance for domestic use that the staff refer to daily.

44
Table 4.6: Substances of key relevance for domestic water quality use (Adapted from The
Department of Water Affairs and Forestry et al. 2003)
4) Why is it important to know how to collect water samples?
Incorrect sampling procedures and methods will affect the accuracy and reliability of
analytical results and lead to misleading conclusions on the quality of the water supply.
It is also important to remember that, once a water sample is taken, the substances in
the sample may deteriorate or the sample may become contaminated before it reaches
the laboratory. The sampler can avoid this by knowing all the correct sampling
requirements and preservation methods beforehand.
Note: All participants gave the same answer.
5) Where must water samples be collected?

45
The actual sampling point in the system is determined by the objective of the sampling
programme, Annexure B for further explanation.
The source: - if the objective is to determine whether a water source is suitable for
domestic purpose, or what level of treatment is required
The outflow from the water treatment works: - if the objective is to determine
operational control and product quality.
A distribution system: - if the objective is to determine whether any changes in water
quality occur in the distribution system
A point of use: - to determine if the water is fit for use.
Note: All participants gave the same answer.
Figure 4.1: Water samples collection points for domestic water quality (Adapted from The
Department of Water Affairs and Forestry et al. 2003)
6) How often is the chemistry data collected from different boreholes in Mpumalanga?
As needed or as scheduled.
7) What is the difference between groundwater and surface water sources affect sampling?

46
The quality of surface water is more variable than the quality of groundwater.
Therefore, the surface water should be sampled more frequently. Table 4.7 shows the
differences.
Note: All participants referred me to recommended guideline published (The Department of
Water Affairs and Forestry et al. 2003).
Table 4.7: Sampling period frequencies (Adapted from (The Department of Water Affairs and
Forestry et al. 2003)
8) What methods are used to collect the chemistry data and tools?
Sample bottles with or without preservatives
Note: All participants gave the same answer.
9) Who collects the chemistry data from the boreholes?
The responsible regions scientists/technicians/auxiliary officers/municipalities/private.
Note: All participants gave the same answer.
10) Who validate the chemistry data before the data is published on the WMS database?
Laboratories.
Note: All participants gave the same answer.
11) List of chemical characteristics of groundwater that water affair staff normally checks?
Table 4.6 (The Department of Water Affairs and Forestry et al. 2003) illustrates the list
of chemical characteristics of groundwater that are applicable for domestic use checked
by the laboratories.

47
12) Which physical quality of groundwater is most important when it is for domestic use?
When it comes to domestic use/human consumption there is no less important
determinant. They are all important but should fall within certain prescribed limits. I
attach a copy of the 2011 SANS 241 for reference. There is no distinction between
surface and groundwater (SABS 2011).
Note: All participants referred me back to 2011 SANS 241 for reference.
13) Is there Internet services/cloud services used for groundwater monitoring?
Yes, the department does use Internet for information dissemination. You may refer the
National Integrated water information system (NIWIS) site on the departmental
website. I am not accustomed with cloud services.
Note: All participants gave the same answer.
4.4 Quantitative Data
4.4.1 Secondary data analysis
The data provided by the Department of Water and Sanitation showed that the Mpumalanga
province had 1117 boreholes and about 3.13% of the boreholes were actively monitored. The non-
monitored boreholes were said to have dried out and some are contaminated beyond treatment.
Table 4.8 shows the list and locations per municipality in Mpumalanga of the 34 actively monitored
boreholes and figure 4.2 present the relationship between municipalities and boreholes using a bar
graph. The study only analysed the 34 active boreholes using the developed cloud computing
model.
Table 4.8: List and locations active boreholes in Mpumalanga
MUNICIPALITIES NUMBER OF BOREHOLES
Albert Luthuli Local Municipality 3
Bushbuckridge Local Municipality 5
Emakhazeni Local Municipality 1

48
Emalahleni Local Municipality 5
Govan Mbeki Local Municipality 1
Lekwa Local Municipality 1
Mbombela Local Municipality 2
Mkhondo Local Municipality 2
Nkomazi Local Municipality 5
Steve Tshwete Local Municipality 3
Thaba Chweu Local Municipality 2
Thembisile Hani Local Municipality 2
Umjindi Local Municipality 1
Victor Khanye Local Municipality 1
Figure 4.2: Count of active boreholes in Mpumalanga
4.4.2 Analysis of water samples
This research only focused on the water quality key substances applicable for domestic use. The
term quality describes the water properties, determining its fitness for specific use. The analysis of
microbiological properties is normally collected and analysed at the laboratory, therefore only the
physical and chemical water qualities were analysed using the model developed. Two types of
analysis were conducted, the online analysis and offline analysis. The offline analysis is the analysis
that was conducted against the secondary data provided by the DWS while the online analysis

49
refers to the real-time analysis of data from the electronic sensors. Table 4.9 shows the offline key
substances and online substances. The pH and Electrical conductivity was analysed using the
offline and the online for the new data captured by the sensors. Apart from the online key
substances other key substances which include Chlorine, Fluoride, Nitrate, Turbidity, particles
count or total organic carbon (TOC) as an example can be also monitored online. Due to time and
availability of sensors from the manufactures the model demonstrated the real-time monitoring
with an Electrical conductivity, pH and Temperature sensors.
Table 4.9: List of offline and online key substances monitored by the model
4.4.3 Water hardness determination
The water hardness is a complex property of water and is governed by the concentration of Calcium,
Magnesium and other polyvalent cations. Below is the formula used to calculate this property. The
water hardness is expressed as mgCaCO3/R, the total hardness is calculated from the Calcium and
Magnesium concentrations as follows: Total hardness (mg CaCO3/R) = 2.497 x [mg Ca/R] + 4.118
x [mg Mg/R]. Table 4.10 illustrate the hardness of water classified by Kunin adapted from DWS
1996.
OFFLINE MONITORING ONLINE MONITORING
Zinc Temperature
Potassium Ph
Nitrate/Nitrite Electrical conductivity total dissolved
Magnesium
Total hardness
Manganese
Iron
Fluoride
Chloride
Sodium
Calcium
Cadmium
Arsenic
Turbidity
Ph

50
Table 4.10: Hardness of water classified by Kunin (Adapted from DWS 1996)
4.5 Results
The results of the analysis both the physical and chemical properties of key relevant to domestic
water from the boreholes in the Mpumalanga rural communities are summarised in table 4.11. The
developed cloud computing model was used to determine which physical and chemical constituents
highly contaminate groundwater in Mpumalanga province. The study showed that all the
parameters from the actively monitored boreholes located in the 18 Municipalities were within the
prescribed limits for no risk, as per the recommendation by the national guidelines for domestic
water use. The Emalahleni local municipality was the only municipality in terms of pH that was
below the prescribed limits with an average mean value of 4.63 pH. The average mean value for
other local municipality ranged between 7.3 and 8.4. The Electrical conductivity ranged from 4.92
to 264.92. An indication of a change in water was detected and this affect the taste of water in
Lekwa, Govan Mbeki, Bushbuckridge, Mkhondo, Steve Tshwete and Victor Khanye local
municipalities. This study also indicated that in some municipalities, high concentrations of
Arsenic, Potassium, Manganese, Iron and Cadmium were within the prescribed limits for the
samples taken, despite the fact that the Fluoride, Nitrate concentrations, Chloride and Magnesium
in certain boreholes exceeded the prescribed limit.
HARDNESS RANGE (MG CACO3/L) DESCRIPTION OF HARDNESS
0 – 50 Soft
50 -100 Moderately Soft
100 -150 Slightly hard
150 -200 Moderately Hard
200 -300 Hard
> 300 Very hard

51
Table 4.11: Physical and Chemical water quality results
4.5.1 Primary versus secondary data processing
Demonstration of real-time monitoring using electronic sensors and pre-collected data were
analysed using the cloud computing model developed. For real-time, three elements parameters
were analysed namely pH, Electrical conductivity and Temperature. The Emalahleni local
municipality water was used to do the comparison. The results were taken over month with daily
10 minute sampling intervals and then compared with the pre-collected water samples provided by
the Department of Water and Sanitation. Below table 4.12 shows the results comparison of the
parameters. The real-time analyses compared to the pre-collected samples were also within the
recommended limits for no risk in terms of the recommendations by the national guidelines for
domestic purposes, with the exclusion of the pH level with a mean value of 3.97 difference of 0.66
from the pre-collected data.
Table 4.12: Pre-collected versus primary samples
PRE-COLLECTED SAMPLES REAL-TIME SAMPLES
Municipality pH(mean) EC(mean) pH(mean) EC(mean)
Emalahleni Local
Municipality
4.63 33.75 3.97 33.75

52
4.6 Database life cycle phases output
4.6.1 Initial study
In the research methodology chapter section 3.8.1, the database initial phase is discussed. This
phase is the input to the proceeding phases of the database life cycle.
4.6.2 Database Design
In the conceptual database design, the following entities were defined to design the database entity
relationship diagram (Entities: Monitoring, Elements, Boreholes, Province and Municipalities).
Figure 4.2 illustrate the entity relationship diagram for the system.
Figure 4.3: Entity relationship diagram groundwater monitoring system
4.6.3 Implementation and loading
In this phase the secondary and primary data from phase 1 of the study was loaded to the database
tables, Boreholes (Table 4.13), Municipality (Table 4.14), Province (Table 4.15), Elements (Table
4.16) and Monitoring (Table 4.17). In this phase the developed system from phase 2 was deployed

53
into the public cloud. The output of the system is shown in section 4.7 that was captured during the
testing of the system.
Table 4.13: The boreholes table
Table 4.14: The municipality tables
Table 4.15: The province table
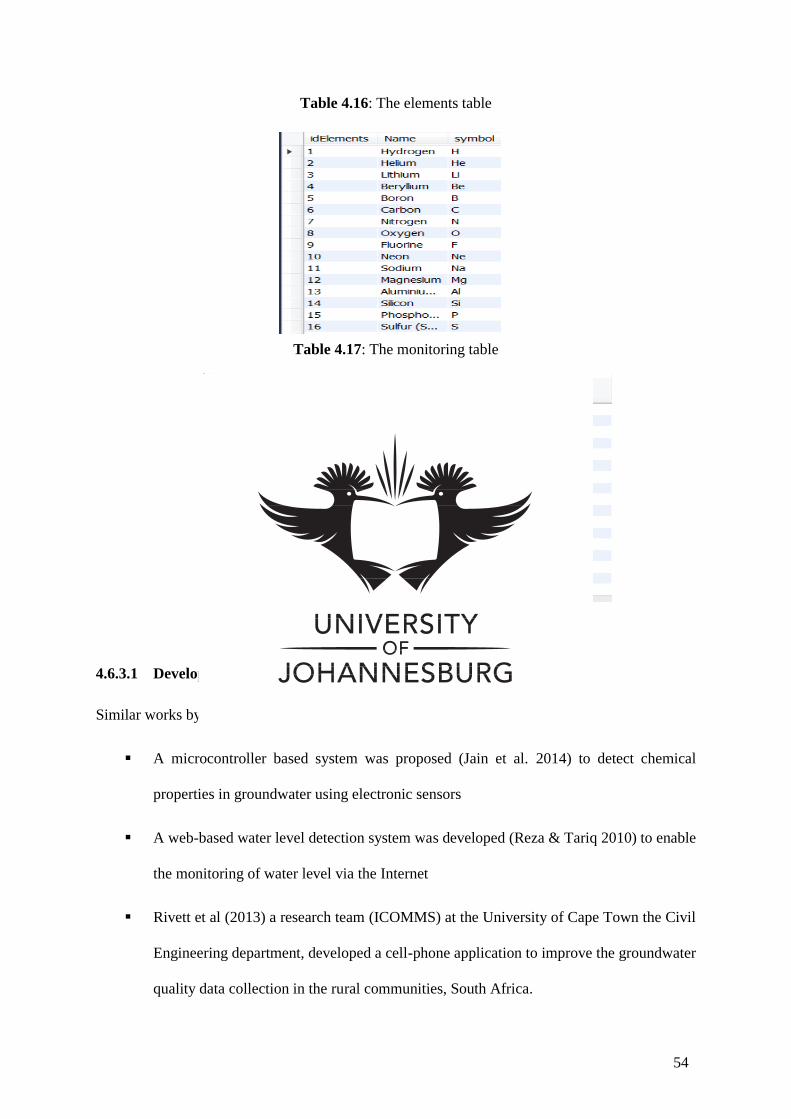
54
Table 4.16: The elements table
Table 4.17: The monitoring table
4.6.3.1 Development of the model
Similar works by experts were adapted to develop the final model.
A microcontroller based system was proposed (Jain et al. 2014) to detect chemical
properties in groundwater using electronic sensors
A web-based water level detection system was developed (Reza & Tariq 2010) to enable
the monitoring of water level via the Internet
Rivett et al (2013) a research team (ICOMMS) at the University of Cape Town the Civil
Engineering department, developed a cell-phone application to improve the groundwater
quality data collection in the rural communities, South Africa.

55
Haron et al (2009) developed a remote water quality monitoring system using wireless
sensors for prawn farming pond
In figure 4.4 and figure 4.5 shows the initial and the final model. The initial model as in figure 4.4
(Mahwayi & Joseph 2016) was revised further after discussions with experts to come up with the
final model for the study in figure 4.5.
4.6.3.2 Initial model
The initial model was presented at the ICIDA’16 conference to get opinions, views of the proposed
model for groundwater quality monitoring in rural areas, as the literature survey was done on
similar works to revise and enhance the model. In the initial model the technologies that can be
used for monitoring quality of groundwater in rural areas were proposed.
Figure 4.4: Initial model for groundwater quality monitoring using cloud computing

56
4.6.3.3 Final model
In the final model the initial model was revised based on the suggestions and inputs from the experts
during the qualitative interviews and based on phase 2. The DWS experts suggested that addition
of doing the monitoring using primary data source will add more weight to the model, as this will
give immediate contamination detection in groundwater as opposed to secondary data that may be
available after an individual has loaded the data into the database. The Initial model sourced the
data for groundwater from a database. If the database is not already in the cloud, the data is copied
to a database hosted in the cloud and this will allow the interpretation of the data from the cloud.
Figure 4.5: Final model for groundwater quality monitoring using cloud computing
4.6.3.4 Functionality of the model
A user with a web-enabled device will access a URL link to retrieve the groundwater quality
monitoring web page using a web browser. A login screen will be presented to the user prompting
them to enter a username and a password. After a successful login, the system home page will be
presented to the user. The user will have a 360 degrees’ view of a borehole or boreholes from the
time the monitoring began to present. Secondary data provide historical events while primary data

57
provide the current events. The array of sensor design was adapted from Jain et al (2014). The
design allowed various sensors to be added to the system. As the water is pumped from the ground,
the sensors start taking the groundwater samples. The measured values from the sensors are loaded
to the database. This can be a database on a local premise or a database in the cloud. If the database
is on a local premise, the data will be transported to a database hosted in the cloud. The measured
results can be viewed using a web-enabled device with internet access from anywhere any the
world.
4.6.4 Testing and evaluation
The testing was conducted in two phases. First phase was to test the secondary data provided by
the Department of Water and Sanitation to ensure that the data is analysed and interpreted correctly
by the system. Unit testing, functionality testing and end to end testing were performed. Phase 2
of the dissertation aimed at testing the real-time data with the secondary data and three parameters
were compared, Temperature, pH and Electrical conductivity. Table 4.11 summarises the results
of the testing. Groundwater from the Emalahleni borehole was collected and stored in a bucket to
be able to do offsite testing of the water using sensors and samples were taken over a month with
daily 10 minute sampling intervals.
4.7 System outputs
Figures below shows the system screenshots. All the user interface screens were designed during
the designed phase of the system. Figure 4.6 shows the system login screen that will appear after
a user calls the system URL from a browser. Authorised users will be able to login to the system
from this page.

58
Figure 4.6: Login screen
Figure 4.7 shows the search page that appears after a user has been successfully authenticated to
the system. A user can do a search based on the filters with drop down combo box and these include
a province, municipality, borehole, elements and a date range. After a search has been performed,
the search results will appear on the result grid as it can be seen in figure 4.8. The system presents
the groundwater information in forms of reports graphs and charts to make it easier for the users to
understand the information.
Figure 4.7: Search page

59
Figure 4.8: Result view
Figure 4.8 illustrate the results after a user has performed a search. In the result widget on the left
displays the monitoring point or name of the boreholes, the status indicating whether the borehole
is active or not, the date that the sample was taken and also the element together with the measured
values. The results are then presented in a form of a bar graph on the right as shown in figure 4.8.
The system can be accessed online using a web-enabled device with internet access using the
following URL: http://196.41.123.37:8081/wms/Controller.jpf

60
5 CHAPTER 5: FINDINGS AND DISCUSSION
5.1 Introduction
Based on the discussion in Chapter 4, the study demonstrated the use of a cloud computing platform
to monitor the groundwater from the boreholes in rural areas. The study also demonstrated the
monitoring of groundwater using secondary data and primary data with the system developed to
test the model proposed. The elements that affect the quality were also analysed using the
developed Java web application that was linked to MySQL database and the microcontroller based
system. This whole system was deployed into the public cloud during the implementation and
loading phase of the database life cycle (DBLC).
5.2 Motivation use of cloud computing
Although monitoring of water quality can be performed using different approaches which include
fixed continuous monitoring systems, sampling with portable devices and post-analysis. Typically,
these approaches to an extent are not scalable and flexible enough to be used for large geographical
areas. The turnaround time with these approaches turn to be longer as well when collecting water
samples from the boreholes. An example is the traditional monitoring borehole sampling method
(Mpenyana-Monyatsi et al. 2012). The method required a lot of human interventions when it comes
to water samples data collection, hence it required someone to visit each and every borehole of the
100 boreholes monitored in the study. This alone took a duration of 3 months to gather the water
samples data from the boreholes. The other cons with existing approaches is the issue of data
management and data centralization for easy access. At any point in time, an entity would require
to know about current status of the drinking water for any borehole in question. Without any
portable devices to check the water quality in real time, it would be impossible for the entity to get
such information. Cloud computing and electronic sensors enable the monitoring of water quality
to be monitored in both real time and non-real time without human interventions. It reduces the
data collection process to be completed in seconds as opposed to the 3 months it took (Mpenyana-

61
Monyatsi et al. 2012). Any entity can access the water quality results from anywhere and from any
web-enabled device with internet access. The cloud also centralizes the water samples data which
enables easy integration with other systems these include GIS, electronic sensors placed in different
locations, business intelligent application for data interpretations and reporting and also mobile
platforms application via API’s. Rivett et al (2013) with the mobile application developed for the
purpose of data collection at the water sites. The data can be taken directly to the database in the
cloud instead of pushing the data to the private network database via GSM. This will also reduce
the internal IT support and setup cost which include hardware, licenses and labour. The use of the
cloud lets the water operators to focus on the what, how and why is the water contaminated instead
of focusing on the what and how to collect the water samples. In terms of the cost-effective of the
cloud, the cloud consumer pays for the usage on a monthly basis, no need to worry about the
management of the infrastructure which includes maintenance, server’s connectivity, hard disk
space and most importantly performance issues. The issues that always arises with cloud computing
implementations is the internet connectivity and data security, just like any other implementation
weather is hosted on consumers premises or in the cloud. Connectivity and data security need to
defined and addressed accordingly depend on the requirements for the solution.
5.3 Conclusion
Domestic water quality remains the greatest contributing factor to human health. Systems that will
pro-actively monitor the source of drinking water are needed, especially in rural areas. In this
study, three phases were conducted to answer the research question “How do we develop a model
for groundwater quality monitoring using cloud computing” and its sub-objectives. Firstly, the
study determined the constituents that highly contaminates the boreholes and this was carried out
by analysing the existing groundwater boreholes data (secondary data) provided by the Department
of Water and Sanitation (DWS) or by manually checking the properties using sensors (primary
data) and making this available in the database. The cloud was used to monitor the quality of
groundwater. In the second phase a cloud computing model was developed for groundwater quality

62
monitoring in the rural areas. The third phase qualitative interviews were conducted to get more
insight on contamination of groundwater. Based on the above mentioned phases the developed
model was revised to propose a suitable final model for groundwater quality monitoring in rural
areas. It is believed that the proposed model will effectively monitor groundwater in rural areas of
Mpumalanga province.
5.4 Future work
New water quality sensors are actively being designed and increasingly appearing on the market.
There is currently a huge gap in the South African market for the effective implementation in water
utilities. The future work will investigate the use of the technology proposed in this study with a
real end user test market to enable the demonstration of the proposed model and also demonstrate
the benefits and then gain production efficiency through scale-up. Apart from the analysis of
ground water for domestic use the future work will also explore the use of this technology in other
areas which include recreational, Industrial water use and agriculture water use (E.g. Irrigation,
livestock watering and Aquaculture).

63
References
1. Statistics South Africa, 2012. Census 2011. Census in brief, pp. 18-25.
2. Adler, E. S. & Clark, R., 2004. An Invitation to social Research, Third Edition. Belmont:
Thomson Higher Education.
3. Becker, W. M., 2005. Ground Water. Potential for Satellite Remote Sensing of Ground
Water.
4. Bhatt, M., Banaras Hindu University & Varanasi , 2014. J2EE and MVC Architecture.
Journal of Global Research Computer Science & Technology, Vol-I(Issue-II).
5. Boss G et al, 2007. Cloud Computing. IBM white paper version 1.0.
6. Chen, D., Ma, M. & Lv, Q., 2002. A Ferderation Model for Education under Hyhbrid
cloud computing. Second International Conference on Future Computers in Education
Lecture Notes in Information Technology, Vols.23-24.
7. Cultural Diversity, Minority Psychology & Hodgson, S., 2004. Cutting through the
silence: A sociological construction of self-injury. Sociological Inquiry, pp. P 162-179.
8. Curasi, C. F., 2001. A critical exploration of face-to-face interviewing vs computer-
mediated interviewing. International Journal of Market Research, pp. P 361-375.
9. Denzin, N. K. & Lincoln, Y. S., 2005. The sage handbook of qualitative research: 3rd
Edition. London: Sage Publications.
10. Fisher, D. K. & Kebede, H., 2010. Computers and Electronics in Agriculture. A low-cost
microcontroller-based system to monitor crop temperature and water status, p. P 168–
173.
11. Foster, G., 1994. Fishing with the Net for research data. British Journal of Educational
Technology, p. P 91–97.
12. Gartner, 2009. Cloud Computing Inquiries at Gartner.
13. Government,M.P.,2011.[Online]
Available at: http//:www.mpumalanga.gov.za/about/province.htm
64
14. Gubrium, J. F. & Holstein, J. A., 2002. Handbook of interview research: context &
method. Thousand Oaks. CA: Sage Publications.
15. Haron, N. S., Mahamad, M. K., Aziz, I. A. & Mehat, M., 2009. Remote Water Quality
Monitoring System using Wireless Sensors.
16. HSRC, 2011. Human Sciences Research Council. [Online]
Available at: http://www.hsrc.ac.za/en/review/hsrc-review-may-2013/spreading-the-
news-the-use-of-ict-to-raise-rural-living-standards
[Accessed 23 April 2015].
17. Jain, D. K., Parakh, A. & DR Verma, H. K., 2014. Microcontroller-Based System for
Water Quality Monitoring using Electronic Sensors. International Journal of Advanced
Research in Electrical Electronics and Instrumentation Engineering, Vol 3 Special Issue.
18. Johnston, M. P., 2014. Secondary Data Analysis. A method of which the time has come.
19. Kamal, R., Karim, M. & Yan, C. K., 2000. GIS Application for Monitoirng Groundwater
Arsenic Contamination in Bangladesh. [Online]
Available at: http://www.eng-consult.com/pub/iahr.pdf
[Accessed 16 February 2014].
20. Kamal, R., Karim, M. & Yan, K. C., 2000. GIS application for monitoring groundwater
Arsenic contamination in Bangladesh.
21. Karchmer, R. A., 2001. The journey ahead: Thirteen teachers report how the Internet
influences literacy and literacy instruction in their K–12 classrooms. eading Research
Quarterly, pp. P 442-466.
22. Kelly, A. P., 2016. Social Research Methods. Undergraduate study in Economics,
Managament, Finance and the Social Sciences.
23. Kennedy, T. L., 2000. An exploratory study of feminist experiences in cyberspace.
CyberPsychology & Behavior, pp. P 707-719.
65
24. Kim, B. S., 2003. A qualitative study of adaptation experiences of 1.5-generation Asian
Americans. s.l.:s.n.
25. Kuo, A. M.-H., 2011. Opportunities and Challenges of Cloud Computing to improve
Health Care Services. Journal of Medical Internet Research, Volume 13.
26. Kvale, S., 1996. Interviews: An introduction to qualitative research
interviewing:Thousand Oaks. CA: Sage Publications.
27. Lehu, J. M., 2004. Back to life! Why brands grow old and sometimes die and what
managers then do: An exploratory qualitative research put into the French context. Journal
of Marketing Communications, pp. P 133-152.
28. Liu, F. et al., 2011. The NIST Cloud Computing, Reference Architecture. NIST Special
Publication, pp. P 500-292.
29. Lyle, S. & Raymond, J. R., 1988. What is groundwater?. New York state water resource
institute center for environmental research Cornell University.
30. Mahwayi, M. P. & Joseph , M. K., 2016. Technologies for Groundwater Quality
Monitoring in Rural Areas, ICIDA'16, STH, UJ.
31. Markovic, N., Stanimirovic, A., Stoimennov, L. & GISLab, 2009. Sensor Web for River
Water Pollution Monitoring and Alert System.
32. Meho, L. I., 2001. The information-seeking behaviour of social science faculty studying
stateless nation. Unpublished doctoral dissertation, University of North Carolina at
Chapel Hill.
33. Meho, L. I. & Tibbo, H. R., 2003. Modeling the information-seeking behavior of social
scientists: Ellis’s study revisited. Journal of the American Society for Information Science
and Technology, pp. P 570-587.
34. Mell, P. & Grance, T., 2011. The NIST Definition of Cloud Computing. NIST Special
Publication 800-145.

66
35. Miles, M. B. & Huberman, A. M., 1994. Qualitative data analysis: An expanded
sourcebook. Thousand Oaks,. CA: Sage Publications.
36. Mpenyana-Monyatsi, L., Onyango, M. S. & Momba, M. N., 2012. Groundwater Quality
in a South African Rural Community. A Possible Threat to Public Health. Pol. J. Environ
Vol 21, pp. P 1349-1358 .
37. Murray, C. D., 2004. An interpretive phenomenological analysis of the embodiment of
artificial limbs. Disability and Rehabilitation, pp. P 963-973.
38. Murray, C. D. & Harrison, B., 2004. The meaning and experience of being a stroke
survivor: An interpretive phenomenological analysis. Disability and Rehabilitation, pp. P
808-816.
39. Murray, P. J., 1995. Research from cyberspace: Interviewing nurses by e-mail. Health
Informatics, pp. p 73-76.
40. Murray, P. J., 1996. Nurses’ computer-mediated communications on NURSENET: A case
study. Computers in Nursing, pp. P 227-234.
41. Notational Integrated water Information System, n.d.
42. Olivero, N. & Lunt, P., 2004. Privacy versus willingness to disclose in e-commerce
exchanges: The effect of risk awareness on the relative role of trust and control. Journal
of Economic Psychology, pp. P 243-262.
43. Patton, M. Q., 2002. Qualitative research and evaluation methods 3rd Edition. Thousand
Oaks. CA: Sage Publications.
44. Persichitte, K. A., YoungD, S. & Tharp, D. D., 1997. Conducting research on the Internet:
Strategies for electronic interviewing. In Proceedings of Selected Research and
Development Presentations at the 1997 National Convention of the Association for
Educational Communications and Technology (19th,Albuquerque,NM,February 14–18,
1997).Washington,.

67
45. Plummer, D. C. et al., 2008. Cloud Computing: Defining and Describing an Emerging
Phenomenon.
46. Pressman, R. S., 2010. SOFTWARE ENGINEERING: A PRACTITIONER’S APPROACH,
SEVENTH EDITION. Seventh Edition ed. 1221 Avenue of the Americas, New: McGraw-
Hill.
47. Prof. Dr Weinhardt, C. et al., 2009. Cloud Computing – A Classification, Business
Models, and Research Directions.
48. Reza, S. M. & Tariq, S. A., 2010. Microcontroller Based Automated Water Level Sensing
and Controlling: Design and Implementation Issue.
49. Rivett, U., Champanis, M. & Jones, W. T., 2013. Monitoring during water quality in South
Africa: Designing information systems for local needs.
50. Rob, P., Caronel , C. & Crockett, K., 2008. Database Systems. International Edition ed.
s.l.:Gaynor Redvers-Mutton.
51. Rosenthal, A. et al., 2010. Cloud computing: A new business paradigm for biomedical
information sharing. Journal of Biomedical Informatics, pp. 342-353.
52. SABS, 2011. South African National Standards. Drinking water Part 1: Microbiological,
physical, aesthetic and chemical determinands, Volume Edition 1.
53. Saunders, M., Lewis, P. & Thomhill, A., 2003. Research Methods for Business Students,
3rd Edition. s.l.:s.n.
54. Sixsmith, J. & Murray, C. D., 1998. E-mail: Aqualitative research medium for
interviewing?. International Journal of Social Research Methodology, pp. P 103 -121.
55. Strauss, A. L. & Corbin, J. M., 1998. Basics of qualitative research: Techniques and
procedures for developing grounded theory. Thousand Oaks: Sage Publications.
56. Taylor, S. J. & Bogdan, R., 1998. Introduction to qualitative research methods: A
guidebook and resource 3rd Edition. New York: John Wiley &Sons, Inc.

68
57. The Department of Water Affairs and Forestry; The Department of Health; Water
Research Commission, 2003. Quality of Domestic Water supplies. Sampling Guide,
Volume 2.
58. UN-Water, 2015. The United Nations World Water Development Report 2015. Water for
a Sustainable World, pp. 12-13.
59. Veelen, M. V. & Dhemba, N., 2011. Water Quality Report: Development of a
Reconcilation Strategy for the Olifants River Water Supply System, s.l.: Department of
Water and Sanitation.
60. Young, S., Tharp, D. D. & Persichitte, K. A., 1998. Electronic mail interviews: Guidelines
for conducting research. International Journal of Educational Telecommunications, pp. P
291-299.
61. Zachman, J. A., 2003. The Zachman Framework: A primer for Enterprise Engineering
and Manufacturing. In: s.l.:s.n.
62. Zikmund, W., 1984. Business Research Methods, 5th Edition. Orlando): The Dryden
Press.

69
ANNEXURE

70
Annexure A: (PIC16F877A Source code)
/*Project: Groundwater Monitoring Model
Student Name: MP Mahwayi
Student No: 200802748
Course: MTech Electrical Engineering
*/
#include <pic.h>
#include <htc.h>
#include <stdlib.h>
#include <stdio.h>
#include <conio.h>
#include <string.h>
#include "lcdUJ.h"
#include "usart.h"
#define _XTAL_FREQ 4000000
__CONFIG(FOSC_XT & WDTE_OFF & PWRTE_ON & BOREN_OFF & LVP_OFF &
CPD_OFF & WRT_OFF & CP_OFF);
unsigned char Vstr[5];
unsigned int result,result1,Scan1,Scan2,distance;
const unsigned char mes1[]= "parking 1 Open";
const unsigned char mes2[]= "parking 2 Open";
const unsigned char mes3[]= "parking 1 Taken";
const unsigned char mes4[]= "parking 2 Taken";
unsigned char strRES1[5],strRES2[5];
char rxchar, i = 0, flag = 0;
unsigned char rxarray[80];
int adc_read();
void main()
{
TRISD=0;
TRISA=0xff;
TRISC=0B10000000;
PORTD=0;
lcd_init();
lcd_clear();
USARTInit();
while(1)
{
ADCON1=0b10000000;
ADCON0=0b01000001;
__delay_us(20);
result=adc_read();
__delay_ms(100);
Scan1=(result*4.88);
lcd_clear();
if(Scan1<=2200)
{

71
putch('A');
putch(' ');
RD0=1;
lcd_goto(0x00);
lcd_putrs(mes1);
}
if(Scan1>2400)
{
putch('B');
putch(' ');
RD1=1;
lcd_goto(0x00);
lcd_putrs(mes3);
}
ADCON1=0b10000000;
ADCON0=0b01001001;
__delay_us(20);
result1=adc_read2();
__delay_ms(100);
Scan2=(result1*4.88);
__delay_ms(1000);
if(Scan2<=2200)
{
putch('C');
putch(' ');
RD3=1;
lcd_goto(0x28);
lcd_putrs(mes2);
}
if(Scan2>2400)
{
putch('D');
putch(' ');
RD2=1;
lcd_goto(0x28);
lcd_putrs(mes4);
}
}
lcd_clear();
}
int adc_read()
{
unsigned int x=0;
GO=1;
while(GO)continue;
x=(ADRESH<<8)+ADRESL;
return x;
}

72
int adc_read2()
{
unsigned int y=0;
GO=1;
while(GO)continue;
y=(ADRESH<<8)+ADRESL;
return y; }

73
Annexure B: Procedure for traditional sampling
Below table illustrate the type of bottles used by water operators to take the water samples with
minimum size required onsite for domestic water quality. The samples are therefore taken to the
laboratory for checking possible contamination. The table is adapted from the Department of Water
Affairs and Forestry et al.(2003).
Procedure for traditional sampling

74
The figures below illustrate the step by step procedures for collecting water samples. The
procedures are documented to assist water operators when taking water samples in rivers, streams,
lake dam or reservoirs. The procedures and steps the water operator do in preparation before taking
the water samples from the borehole are as follows:
First check for any possible vapours, especially at landfill and fuel-spilled areas before
opening any borehole.
First measurement that must be taken when collecting water samples at the borehole is the
water level followed by the depth of the borehole. If the borehole has been sampled before,
the depth measurement will indicate whether borehole collapsed or silting has occurred.
Microbiological samples examination should be collected first if samples for chemical
and microbiological analyses are collected from the same borehole. This precautionary
measure is to avoid the danger of contamination of the water at the sampling point.
Procedures should be followed when taking water samples

75
Preparation procedure before taking the water samples from the borehole
Sampling of borehole without pump

76
Sampling of borehole with pump

77
Annexure C: Information required for data sheets
The information data sheets that goes together with the collected water samples. The datasheets
provide information to the laboratory to where the samples were taken, type of water source, the
station number, the date when the samples were taken and other related information.
Information required for data sheets (Adapted from the Department of Water Affairs and Forestry
et al. 2003).

78
Annexure D: Equipment checklist for domestic water quality
Equipment checklist for domestic water quality (Adapted The Department of Water Affairs et al.
2003). The checklist is used by the water operator to check that all the sampling equipment are
available before going onsite to take water samples for domestic use.
Equipment checklist for domestic water quality (Adapted from the Department of Water Affairs
and Forestry et al. 2003).

79
Annexure E: System for groundwater quality monitoring
System for groundwater quality monitoring using cloud computing