Embed Size (px)
Citation preview

Walter H. WaddellSeptember 10, 20082008PYBA 28
presented to
California Air Resources BoardSacramento, CA
10th Worldwide Tire Survey:Replacement Tires
2
Objectives Compare performance of tires available in the replacement market produced by manufacturers in
Asia Pacific (AP)Europe (EU)Latin America (LA)United States (US)
Relate Tire Inflation Pressure Retention results to the innerliner composition and tire design parameters
Compare results of tires manufactured for Original Equipment versus Replacement market use

3
Background
During the last 25 years, ExxonMobil Chemical has made a seriesof Tyre Surveys to evaluate the influence of Halobutyl Rubber onTire Inflation Pressure Retention (Tire IPR)
Maintaining the correct tire air pressure ensures that the tireperforms under the original design conditions by providing theoptimum road holding, traction and fuel economy, while minimizing excessive tread wear at lower inflation pressures
Achieving a low Tire IPR loss rate requires an impermeable liner
Use of Halobutyl Rubber Provides a Cost Efficient Methodto Obtain Excellent Innerliner Barrier Performance

4
Historical Use of Halobutyl RubberData from manufacturers in Europe (Tyre Surveys 3 - 9) show an increase in Halobutyl Rubber content from ~55 phr to ~ 90 phr, while the cured innerliner gauge has decreased to 0.8 mm
Bridgestone, Continental, Goodyear, Michelin, and PirelliHalobutyl & Liner Gauge
50
60
70
80
90
100Ja
n 85 -
185 /
70 1
4Ju
n 86 -
145 /
80 1
3
May 90
- 16
5 / 7
0 13
Apr 9
2 - 1
95 / 6
5 14
Nov 92
- 17
5 / 70
14
Jun 9
5 - 19
5 / 6
5 15
Jun 9
9 - 17
5 / 7
0 14
Jul 0
1 - 20
5 / 6
0 15
Hal
obut
yl, p
hr
0.5
0.6
0.7
0.8
0.9
1.0
1.1
1.2
1.3
1.4
1.5
Inne
rline
r gau
ge, m
mExxonMobil Chemical Company Data

5
Historical Use of Halobutyl RubberData from manufacturers in Europe (Tyre Surveys 3 - 9) show an increase in Halobutyl Rubber content from ~55 phr to ~ 90 phr, while the cured innerliner gauge has decreased to 0.8 mm
Bridgestone, Continental, Goodyear, Michelin, and PirelliHalobutyl & Liner Gauge
50
60
70
80
90
100Ja
n 85 -
185 /
70 1
4Ju
n 86 -
145 /
80 1
3
May 90
- 16
5 / 7
0 13
Apr 9
2 - 1
95 / 6
5 14
Nov 92
- 17
5 / 70
14
Jun 9
5 - 19
5 / 6
5 15
Jun 9
9 - 17
5 / 7
0 14
Jul 0
1 - 20
5 / 6
0 15
Hal
obut
yl, p
hr
0.5
0.6
0.7
0.8
0.9
1.0
1.1
1.2
1.3
1.4
1.5
Inne
rline
r gau
ge, m
mExxonMobil Chemical Company Data

6
Historical Use of Halobutyl RubberData from manufacturers in Europe (Tyre Surveys 3 - 9) show an increase in Halobutyl Rubber content from ~55 phr to ~ 90 phr, while the cured innerliner gauge has decreased to 0.8 mm
Bridgestone, Continental, Goodyear, Michelin, and PirelliHalobutyl & Liner Gauge
50
60
70
80
90
100Ja
n 85 -
185 /
70 1
4Ju
n 86 -
145 /
80 1
3
May 90
- 16
5 / 7
0 13
Apr 9
2 - 1
95 / 6
5 14
Nov 92
- 17
5 / 70
14
Jun 9
5 - 19
5 / 6
5 15
Jun 9
9 - 17
5 / 7
0 14
Jul 0
1 - 20
5 / 6
0 15
Hal
obut
yl, p
hr
0.5
0.6
0.7
0.8
0.9
1.0
1.1
1.2
1.3
1.4
1.5
Inne
rline
r gau
ge, m
mExxonMobil Chemical Company Data

7
• Higher Halobutyl Rubber levels (increased phr) have led to lower (improved) Tire Inflation Pressure Retention loss values
Intracarcass pressure has remained constant
Historical Use of Halobutyl Rubber
Inflation Pressure Retention and Intracarcass Pressure
2.0
2.5
3.0
3.5
4.0
4.5
5.0
Jan 8
5 - 1
85 /
70 14
Jun 8
6 - 1
45 /
80 13
May
90 -
165
/ 70
13Ap
r 92
- 195
/ 65
14
Nov 9
2 - 17
5 / 7
0 14
Jun 9
5 - 1
95 /
65 15
Jun 9
9 - 1
75 /
70 14
Jul 0
1 - 2
05 /
60 1
5
Infla
tion
Pre
ssur
e R
eten
tion,
% lo
ss/m
onth
0.5
0.6
0.7
0.8
0.9
1.0
1.1
1.2
1.3
1.4
1.5
Intra
carc
ass
pres
sure
, bar
s
ExxonMobil Chemical Company Data

8
• Higher Halobutyl Rubber levels (increased phr) have led to lower (improved) Tire Inflation Pressure Retention loss values
Intracarcass pressure has remained constant
Historical Use of Halobutyl Rubber
Inflation Pressure Retention and Intracarcass Pressure
2.0
2.5
3.0
3.5
4.0
4.5
5.0
Jan 8
5 - 1
85 /
70 14
Jun 8
6 - 1
45 /
80 13
May
90 -
165
/ 70
13Ap
r 92
- 195
/ 65
14
Nov 9
2 - 17
5 / 7
0 14
Jun 9
5 - 1
95 /
65 15
Jun 9
9 - 1
75 /
70 14
Jul 0
1 - 2
05 /
60 1
5
Infla
tion
Pre
ssur
e R
eten
tion,
% lo
ss/m
onth
0.5
0.6
0.7
0.8
0.9
1.0
1.1
1.2
1.3
1.4
1.5
Intra
carc
ass
pres
sure
, bar
s
ExxonMobil Chemical Company Data

9
Agenda
ScopeTires StudiedTire Constructions
Physical Parameters AnalyzedWeightInnerliner Gauge Analysis
Innerliner Composition AnalysisPolymersFillers
Tire IPR PerformanceInnerliner Cost EstimatesSummary

10
Scope
• 58 sets of tires purchased worldwide and evaluated– 31 sets tested in the 9th Tyre Survey completed in 2000
• Imports from Asia Pacific were purchased in Europe and USA for comparison to AP produced tires purchased in AP market– All but one tire brand could have been purchased in the USA
• Tire size requested: 205/60 HR15– Received: 205/60 HR 15 - 51 sets
205/60 TR 15 - 1 set (AP)205/60 VR 15 - 5 sets (2 AP, 3 LA)205/65 HR 15 – 1 set (AP)
ExxonMobil Chemical Company Data

11
Tire Identification
58 Tire sets evaluated
Tire size: P205/60 HR15- 7 in other sizes
COMPANY NAMES Manufactured Purchased AP E LA US AP E LA US
BRIDGESTONE Bridgestone, Firestone 1 2 2 2 1 2 2 2MICHELIN Michelin, Goodrich, Uniroyal 1 1 3 1 1 3
GOODYEAR Goodyear, Dunlop 1 2 1 2 1 2 1 2CONTINENTAL Continental, General 1 1 2 1 1 2
PIRELLI 1 2 1 1 1SUMITOMO Sumitomo, Dunlop, Falken 3 1 1 1
YOKOHAMA 2 1 1 1 1HANKOOK 3 1 1 1COOPER Cooper, Avon 2 1 3KUMHO 3 1 1 1TOYO 2 1 1
CHENG SHIN Maxxis 2 1 1MRF 1 1
NOKIAN 1 1APOLLO 1 1
SHANGHAI Warrior 1 1VREDESTEIN 1 1GOODRIDE 1 1
NEXEN Nexen, Roadstone 2 1 1GAJAH TUNGGAL GT Radial 3 2 1
MATADOR 1 1NANKANG 1 1
MARANGONI 1 128 13 6 11 14 23 5 16
ExxonMobil Chemical Company Data

12
Tire Construction

13
58 tires from 23 manufacturers have 26 different constructions
All tires have 2 steel belts
All tires have polyester carcass, except for 4 tires with rayon38 have single reinforcement ply
13 tires have 2 cap plies, 35 have 1 ply, and 10 have no cap plies
17 tires have 2 cap strips, 28 have 1, and 13 have no cap strip
30 tires have innerliner cushion; 16 have liner shoulder strips12 tires have neither an innerliner cushion nor shoulder strips
Tire Construction
ExxonMobil Chemical Company Data

14
Tire Construction• 16 Tires purchased in the United States
– 10 Tire manufactured in the USA, 1 in LA, and 5 in AP
Tire Constructions VaryExxonMobil Chemical Company Data

15
Tire Construction• 16 Tires purchased in the United States
– 10 Tire manufactured in the USA, 1 in LA, and 5 in AP
Tire Constructions VaryExxonMobil Chemical Company Data

16
Tire Construction• 16 Tires purchased in the United States
– 10 Tire manufactured in the USA, 1 in LA, and 5 in AP
Tire Constructions VaryExxonMobil Chemical Company Data

17
Agenda
ScopeTires StudiedTire Constructions
Physical Parameters AnalyzedWeightInnerliner Gauge Analysis
Innerliner Composition AnalysisPolymersFillers
Tire IPR PerformanceInnerliner Cost EstimatesSummary

18
58 tires having 26 constructions have different Physical Parameters
Average weight of all tires is 9.56 kg, ranging from 8.5 – 11.25 kg>30% weight variation worldwide for same size tire
Average cured innerliner gauge is 0.80 mmVaries between four manufacturing regions, ranging from 0.43 – 1.55 mm
30 tires have an innerliner cushion, and 16 have liner shoulder strips Thickness of cushion varies from 0.27 – 1.02 mm
Physical Parameters
ExxonMobil Chemical Company Data

19
1 Cap ply1 Cap strip2 Steel belts2 Polyester plies
Wt = 11.13 kg
2 Cap strips2 Steel belts1 Polyester ply
Wt = 8.76 kg
Tire Construction
ExxonMobil Chemical Company Data

20
1 Cap ply1 Cap strip2 Steel belts2 Polyester plies
Wt = 11.13 kg
2 Cap strips2 Steel belts1 Polyester ply
Wt = 8.76 kg
Tire Construction
ExxonMobil Chemical Company Data

21
Tire Construction
2 Cap strips2 Steel belts1 Polyester ply
Wt = 8.76 kg
1 Cap ply1 Cap strip2 Steel belts2 Polyester plies
Wt = 11.13 kg
ExxonMobil Chemical Company Data

22
Tire Weight
Tire Weight Varies from 8.5 to 11.25 kgExxonMobil Chemical Company Data

23
Tire Weight Independent of Original Equipment vs Replacement Market
Statistical Analysis: Tire Weight by Market
8.5
9
9.5
10
10.5
11
11.5
Wei
ght
N Y
OE Supplier
Each PairStudent's t0.05
NY
Level3721
Number9.543789.59143
Mean0.6552830.827915
Std Dev0.107730.18067
Std Err Mean9.32539.2146
Lower 95%9.76239.9683
Upper 95%
Means and Std Deviations
Oneway Analysis of Weight By OE Supplier
ExxonMobil Chemical Company Data

24
This test method describes the determination of the innerliner thickness
Innerliner Gauge Analysis (IGA)
Average Gauge to cords (mm) =gn∑
Average cord penetration % =∑ -(lmax g) * 100
dn
Average innerliner flow % =
∑ -(lmax lmin) * 100lmin
nAverage innerliner gauge (mm) = (AVG min + AVG max)/2
Average maximum innerliner gauge (mm) = lmax
nAVG min
∑=
Average minimum innerliner gauge (mm) = ∑
=lmin
nAVG min
ExxonMobil Chemical Company Data

25
Innerliner Average Gauge
AV,AW 0.43 AJ,AP 0.44
U 0.75
L,N 0.46
BA 0.51AM,AN 0.46
AL 0.52
Q 0.84
M,P 0.54AF,AQ 0.49
AX 0.68
AT 0.70
C 0.65
AZ 0.64G 0.63
BE 0.75
AB 0.60
B,I 0.85
AA 0.69E,J 0.67
X 0.75A,H 0.70 AVG 0.71
AVG, AY0.85
AVG, AG 0.78
T 1.11
AVG 1.00AU 0.91
V,Y,AI 0.82
AS 1.03
O 0.60
AH 0.85
W 0.93
BF 1.06R 1.12
D 0.95
AE,Z 0.98
BB 1.14
AD,AR 1.09
F 1.00
BC 1.23
AC,AO 1.14
BD 1.55
AK 1.20
S 1.17
K 1.08
0.4
0.6
0.8
1
1.2
1.4
1.6
Purchased in Purchased in Purchased in Purchased in
USA Latin American EU Asia / Pacific
Ave
rage
Lin
er G
auge
,mm
Worldwide Avg = 0.80
ExxonMobil Chemical Company Data

26
Innerliner & Cushion Average Gauge
BE 0.75
AF 0.49
R 1.12
E 0.67
AU 0.91
X 0.75
B 0.86 Y,AH 0.84
T 1.11
V 0.81
AT 0.97
A 1.18AW 1.10BF 1.06
F 1.00AS 1.03Z,AE 0.98
BA 1.17
W,AP 0.93K 1.08
S 1.17
AVG 1.16
AVG, AZ1.15
AVG, AD,AR 1.10
AVG 1.38
BB 1.14AQ 1.12
BC 1.23
J 1.25
D,L 0.94
AC,AM,AO 1.14 AK 1.20
G,M 1.34
AY 1.39
H 1.32 AB,AN 1.27
I 1.38 AX 1.35AA,AG,AJ 1.44
U 1.67
P 1.42 AV 1.37
C,N 1.20
BD 1.55AI,AL 1.50
Q 1.85
O 1.45
0.4
0.6
0.8
1.0
1.2
1.4
1.6
1.8
2.0
Purchased in Purchased in Purchased in Purchased in
USA Latin American EU Asia / Pacific
Ave
rage
Lin
er &
Cus
hion
Gau
ge,m
m
Worldwide Avg = 1.16
ExxonMobil Chemical Company Data

27
Agenda
ScopeTires StudiedTire Constructions
Physical Parameters AnalyzedWeightInnerliner Gauge Analysis
Innerliner Composition AnalysisPolymersFillers
Tire IPR PerformanceInnerliner Cost EstimatesSummary

28
Innerliner Composition AnalysisFour Tests Run to Determine Polymer and Filler Compositions
phr of Halobutyl rubber varies from 48 - 100 phrSix tires have 100-phr and one tire had zero phr Halobutyl rubberNatural rubber is secondary polymer of choiceSBR added in 11 liner formulas; present in small amounts in many tires
Carbon black is particulate filler of choice, varying from 27 – 81 phrCalcium carbonate (Ca) used in significant amounts in 18 tiresSilicates also used: Clay (Al) and Talc (Mg)
Volatile lower molecular weight ingredients vary from 17 – 31 phr
Halobutyl weight-% varies from 21 – 53%
Halobutyl rubber weight per tire depends upon both liner gaugeand composition, including minimum gauge Effective Halobutyl
ExxonMobil Chemical Company Data

29
Measured Innerliner Composition (phr)
ExxonMobil Chemical Company Data

30
Projected Innerliner Composition (phr)
ExxonMobil Chemical Company Data

31
Projected Innerliner Composition (wt %)
ExxonMobil Chemical Company Data

32
Tire Innerliner Materials
Tire Innerliner Formulations Vary
• 16 Tires purchased in the United States– 10 Tire manufactured in the USA, 1 in LA, and 5 in AP
ExxonMobil Chemical Company Data
HIIR HIIR NR SBR / BR Low MW Carbon Black CaCO3 White Filler
( wt% ) ( phr ) ( phr ) ( phr ) ( phr ) ( phr ) ( phr ) ( phr )
53 100 0 18 55 0 15
43 89 11 27 77 0 5
35 74 19 7 30 77 0 7
42 90 10 29 78 0 5
49 95 2 3 25 63 0 4
50 95 3 2 17 66 0 6
39 78 22 24 54 4 18
41 87 13 27 73 0 13
33 70 25 5 27 71 0 12
39 82 13 5 25 78 0 5
27 66 34 31 68 27 19
29 58 22 20 23 71 0 8
39 83 17 23 76 0 16
34 81 19 24 73 16 22
51 100 0 19 72 0 4
29 55 45 26 52 0 14

33
Tire Innerliner Materials
Tire Innerliner Formulations Vary
• 16 Tires purchased in the United States– 10 Tire manufactured in the USA, 1 in LA, and 5 in AP
ExxonMobil Chemical Company Data
HIIR HIIR NR SBR / BR Low MW Carbon Black CaCO3 White Filler
( wt% ) ( phr ) ( phr ) ( phr ) ( phr ) ( phr ) ( phr ) ( phr )
53 100 0 18 55 0 15
43 89 11 27 77 0 5
35 74 19 7 30 77 0 7
42 90 10 29 78 0 5
49 95 2 3 25 63 0 4
50 95 3 2 17 66 0 6
39 78 22 24 54 4 18
41 87 13 27 73 0 13
33 70 25 5 27 71 0 12
39 82 13 5 25 78 0 5
27 66 34 31 68 27 19
29 58 22 20 23 71 0 8
39 83 17 23 76 0 16
34 81 19 24 73 16 22
51 100 0 19 72 0 4
29 55 45 26 52 0 14

34
Statistically Higher Halobutyl in Tires for Original Equipment Market
Statistical Analysis: Halobutyl Content by Market
-20
0
20
40
60
80
100
120
Hal
o
N Y
OE Supplier
Each PairStudent's t0.05
NY
Level3721
Number71.432481.7619
Mean18.271913.6415
Std Dev3.00392.9768
Std Err Mean65.34075.552
Lower 95%77.52587.971
Upper 95%
Means and Std Deviations
Oneway Analysis of Halo By OE Supplier
ExxonMobil Chemical Company Data

35
Tire Innerliner Materials
Tire Innerliner Formulations Vary
• 16 Tires purchased in the United States– 10 Tire manufactured in the USA, 1 in LA, and 5 in AP
ExxonMobil Chemical Company Data
HIIR HIIR NR SBR / BR Low MW Carbon Black CaCO3 White Filler
( wt% ) ( phr ) ( phr ) ( phr ) ( phr ) ( phr ) ( phr ) ( phr )
53 100 0 18 55 0 15
43 89 11 27 77 0 5
35 74 19 7 30 77 0 7
42 90 10 29 78 0 5
49 95 2 3 25 63 0 4
50 95 3 2 17 66 0 6
39 78 22 24 54 4 18
41 87 13 27 73 0 13
33 70 25 5 27 71 0 12
39 82 13 5 25 78 0 5
27 66 34 31 68 27 19
29 58 22 20 23 71 0 8
39 83 17 23 76 0 16
34 81 19 24 73 16 22
51 100 0 19 72 0 4
29 55 45 26 52 0 14

36
Carbon Black Use Independent of Market Use
Statistical Analysis: Carbon Black by Market
20
30
40
50
60
70
80
90
Bla
ck
N Y
OE Supplier
Each PairStudent's t0.05
NY
Level3721
Number66.351467.8095
Mean12.15928.5768
Std Dev1.99901.8716
Std Err Mean62.29763.905
Lower 95%70.40571.714
Upper 95%
Means and Std Deviations
Oneway Analysis of Black By OE Supplier
ExxonMobil Chemical Company Data

37
Use of Calcium Carbonate Lower for Original Equipment Tires
Statistical Analysis: CaCO3 by Market
0
10
20
30
40
50
CaC
O3
N Y
OE Supplier
Each PairStudent's t0.05
NY
Level3721
Number11.00006.7143
Mean14.834313.8027
Std Dev2.43873.0120
Std Err Mean6.05400.4314
Lower 95%15.94612.997
Upper 95%
Means and Std Deviations
Oneway Analysis of CaCO3 By OE Supplier
ExxonMobil Chemical Company Data

38
Use of White Fillers Statistically Lower for Original Equipment Tires
Statistical Analysis: White Fillers by Market
0
10
20
30
40
50
60
Whi
te F
iller
N Y
OE Supplier
Each PairStudent's t0.05
NY
Level3721
Number15.945910.6667
Mean11.57335.5257
Std Dev1.90261.2058
Std Err Mean12.0878.151
Lower 95%19.80513.182
Upper 95%
Means and Std Deviations
Oneway Analysis of White Filler By OE Supplier
ExxonMobil Chemical Company Data

39
Total Filler Use Statistically Lower for Original Equipment Tires
Statistical Analysis: Total Filler by Market
60
70
80
90
100
110
120
130
140
Tota
l Fill
er
N Y
OE Supplier
Each PairStudent's t0.05
NY
Level3721
Number93.297385.1905
Mean17.022614.9051
Std Dev2.79853.2526
Std Err Mean87.62278.406
Lower 95%98.97391.975
Upper 95%
Means and Std Deviations
Oneway Analysis of Total Filler By OE Supplier
ExxonMobil Chemical Company Data

40
Use of Low Molecular Weight Ingredients Not Statistically Different for Tires
Statistical Analysis: Volatiles by Market
15
20
25
30
35
Vol
atile
s
N Y
OE Supplier
Each PairStudent's t0.05
NY
Level3721
Number24.108124.6190
Mean4.067383.82722
Std Dev0.668670.83517
Std Err Mean22.75222.877
Lower 95%25.46426.361
Upper 95%
Means and Std Deviations
Oneway Analysis of Volatiles By OE Supplier

41
Higher %-Halobutyl Content in Liners for Original Equipment Market
Statistical Analysis: %-Halobutyl Content by Market
-10
0
10
20
30
40
50
60
% H
alo
N Y
OE Supplier
Each PairStudent's t0.05
NY
Level3721
Number33.081139.3333
Mean9.756428.42219
Std Dev1.60391.8379
Std Err Mean29.82835.500
Lower 95%36.33443.167
Upper 95%
Means and Std Deviations
Oneway Analysis of % Halo By OE Supplier

42
Agenda
ScopeTires StudiedTire Constructions
Physical Parameters AnalyzedWeightInnerliner Gauge Analysis
Innerliner Composition AnalysisPolymersFillers
Tire IPR PerformanceInnerliner Cost EstimatesSummary

43
Inflation Pressure Retention Test
00001.965
00002.150DigitalMonitor
Computer
Atmospheric pressure
Modified ASTM F-1112• Two weeks equilibration at 21oC before starting the test• Tire start pressure = 2.2 bar
(220 kPa or 32 psi)• Automatic measurement every minute averaged over 24 hours• Testing duration is 28+ days• Results reported in %-loss/month
P
Time
Time
% Loss
ExxonMobil Chemical Company Data

44
Inflation Pressure Retention
Tire IPR Varies from 1.43 to 3.41 %-Loss/MonthExxonMobil Chemical Company Data

45
Statistical Analysis: Tire IPR
RSquareRSquare AdjRoot Mean Square ErrorMean of ResponseObservations (or Sum Wgts)
0.568710.5447490.2859782.461552
58
Summary of Fit
Continuous factors centered by mean, scaled by range/2
InterceptLiner GaugeHaloNR+SBR
Term2.4615517-0.271788-0.5816540.369724
Scaled Estimate0.0375510.0836310.2124990.197774
Std Error65.55-3.25-2.741.87
t Ratio<.0001*0.0020*0.0084*0.0670
Prob>|t|
Scaled Estimates
1.5
2
2.5
3
3.5
IPR
2.46
1619
±0.0
7528
5
.4 .6 .8 1
1.2
1.4
1.6
0.7984Liner Gauge
-20 0 20 40 60 80 100
120
65.62Halo
-20 0 20 40 60 80 100
120
35.66NR+SBR
Prediction Profiler
Response IPR
IPR can be decreased by1. Increasing Halobutyl
Rubber Content 2. Increasing Liner Gauge
ExxonMobil Chemical Company Data

46
Statistical Analysis: Tire IPR
1.5
2
2.5
3
3.5
IPR
AP E LA US
Region Manufactured
Each PairStudent's t0.05
Excluded Rows 1
APELAUS
Level28134
12
Number2.578212.476152.350002.28833
Mean0.3806720.4644810.2149420.419758
Std Dev0.071940.128820.107470.12117
Std Err Mean2.43062.19552.00802.0216
Lower 95%2.72582.75682.69202.5550
Upper 95%
Means and Std Deviations
Oneway Analysis of IPR By Region Manufactured
Highest IPR Tires Manufactured in Asia/Pacific Region
ExxonMobil Chemical Company Data

47
Analysis of 10th Tire Survey: IPR
1.5
2
2.5
3
3.5
IPR
AP E LA US
Region Purchased
Each PairStudent's t0.05
Excluded Rows 1
APELAUS
Level14234
16
Number2.655712.461742.350002.37750
Mean0.4252190.4139130.2149420.401920
Std Dev0.113640.086310.107470.10048
Std Err Mean2.41022.28272.00802.1633
Lower 95%2.90122.64072.69202.5917
Upper 95%
Means and Std Deviations
Oneway Analysis of IPR By Region Purchased
ExxonMobil Chemical Company Data

48
Statistical Analysis: Tire IPR by Market
Tire IPR Loss Rates Statistically Lower for Original Equipment Tires
1.5
2
2.5
3
3.5
IPR
N Y
OE Supplier
Each PairStudent's t0.05
NY
Level3721
Number2.550272.30524
Mean0.3919080.441935
Std Dev0.064430.09644
Std Err Mean2.41962.1041
Lower 95%2.68092.5064
Upper 95%
Means and Std Deviations
Oneway Analysis of IPR By OE Supplier
ExxonMobil Chemical Company Data

49
Agenda
ScopeTires StudiedTire Constructions
Physical Parameters AnalyzedWeightInnerliner Gauge Analysis
Innerliner Composition AnalysisPolymersFillers
Tire IPR PerformanceInnerliner Cost EstimatesSummary

50
Model Bromobutyl Liner Formulations
Innerliner Formulations Can Vary Considerably Affecting Polymer Ratio• Polymer Type / Ratio
– BIIR, CIIR / NR, SBR• Type / Amount of Total Fillers
– Carbon Black, Clay, Talc, Calcium Carbonate, Ground Rubber• Type / Amount of Processing Aids
– Oil Type / Amount, Resin Types / Amounts
1.251.251.25Accelerator, MBTS
0.50.50.5Sulfur
111Zinc Oxide
111Stearic Acid
888Processing Oil, TDAE
444Processing Aid, SP1068
606060Carbon Black, N660
777Processing Aid, 40MS
4020Natural Rubber, SMR 20
6080100ExxonTM Bromobutyl 2222
321Ingredient
1.251.251.25Accelerator, MBTS
0.50.50.5Sulfur
111Zinc Oxide
111Stearic Acid
888Processing Oil, TDAE
444Processing Aid, SP1068
606060Carbon Black, N660
777Processing Aid, 40MS
4020Natural Rubber, SMR 20
6080100ExxonTM Bromobutyl 2222
321Ingredient
ExxonMobil Chemical Company Data

51
Tire IPR Estimates: Halobutyl ContentIPR data measured for tires made with 1.0-mm cured 100/0, 80/20 and 60/40 phr Bromobutyl Rubber / Natural Rubber innerliners
BIIR 0 50 60 70 75 80 90 100IPR @ 21C 4.5 3.3 2.8 2.5 2.3 2.1 1.8 1.5IPR @ 60C 36.0 26.0 22.4 20.0 18.0 16.8 14.0 12.0
Tire IPR
0.00
1.00
2.00
3.00
4.00
5.00
0 50 60 70 75 80 90 100
BIIR, phr
Tire
IPR
ExxonMobil Chemical Company Data

52
Example Tire Innerliner Database
Tire Type Tires Tire SizesNumber of Sizes Liner Weight, lbs % Liner of Tire, by Weight
Low Average High Low Average HighPassenger 8 R13 2 0.94 1.20 1.53 6.80 8.81 11.20Passenger 5 R14 2 0.92 1.17 1.42 5.54 6.42 7.29Passenger 21 R15 5 1.36 1.91 2.56 4.16 5.93 7.83Passenger 46 R16 6 0.78 1.76 3.71 3.62 6.26 9.50Light Truck 5 R16 - R19 5 2.70 3.51 4.47 5.21 7.75 10.38
Medium Truck 10 R22.5 3 4.98 6.36 9.23 3.55 5.37 8.53Medium Truck 13 R22.5 2 6.96 10.97 13.21 4.13 6.36 7.97Medium Truck 4 R24.5 1 8.14 9.94 11.33 5.33 6.94 7.84
Tire Constructions Can Vary Considerably Affecting Liner Weight• Innerliner Thickness• Use of NR Cushion / Thickness• Use of NR Shoulder Strips / Thickness / Width

53
Tire Cost Estimates
Using Only a BIIR/NR Change in 55 Wt-% Polymer Innerliner
Tire IPR Value
0.020.040.060.080.0
100.0120.0140.0160.0180.0
3.50 3.00 2.50 2.25 2.00 1.75 1.50Inflation Pressure Retention
Incr
emen
tal C
ents
per
Tire
R13, R14 R15, R16 LT, SUV
ExxonMobil Chemical Company Data

54
Tire Cost Estimates
Using Only a BIIR/NR Change in 55 Wt-% Polymer Innerliner
Tire IPR Value
0.020.040.060.080.0
100.0120.0140.0160.0180.0
3.50 3.00 2.50 2.25 2.00 1.75 1.50Inflation Pressure Retention
Incr
emen
tal C
ents
per
Tire
R13, R14 R15, R16 LT, SUV
ExxonMobil Chemical Company Data

55
Tire Cost Estimates
Using Only a BIIR/NR Change in 55 Wt-% Polymer Innerliner
Tire IPR Value
0.020.040.060.080.0
100.0120.0140.0160.0180.0
3.50 3.00 2.50 2.25 2.00 1.75 1.50Inflation Pressure Retention
Incr
emen
tal C
ents
per
Tire
R13, R14 R15, R16 LT, SUV
ExxonMobil Chemical Company Data

56
Model Liner Cost Estimates: BIIR / NR
Using Only a BIIR/NR Change to Effect ~30% Improvement in IPR:$0.183 / Passenger Tire to Reduce IPR by 1.0% / Month$0.347 / Light Truck Tire to Reduce IPR by 1.0% / Month
1 2 3Compound Ingredients List Price Pricing Source ExxonMobil ExxonMobil ExxonMobil
$ / lb (6/2008) phr $ phr $ phr $HALOBUTYL RUBBER, BB 2222 2.02 ExxonMobil Chemical 100 1.105 80 0.884 60 0.663NATURAL RUBBER, SMR 20 1.432 Smithers Report 0.000 20 0.157 40 0.313CARBON BLACK, N-660 0.7825 Columbian Chemicals Co 60 0.257 60 0.257 60 0.257NAPHTHENIC OIL 0.65 R. E. Carroll, Inc 8 0.028 8 0.028 8 0.028ADHESIVE RESIN, 40MS 1.04 Struktol Company of America 7 0.040 7 0.040 7 0.040TACKIFYING RESIN, SP1068 1.62 SI Group, Inc 4 0.035 4 0.035 4 0.035STEARIC ACID 1.01 R. E. Carroll, Inc 1 0.006 1 0.006 1 0.006SULFUR 0.46 Western Reserve Chemical 0.5 0.001 0.5 0.001 0.5 0.001ZINC OXIDE 0.99 American Chemet Corporation 1 0.005 1 0.005 1 0.005ACCELERATORS, MBTS 2.05 Western Reserve Chemical 1.25 0.014 1.25 0.014 1.25 0.014Total Ingredients 182.75 1.492 182.75 1.428 182.75 1.364
Tire IPR, %-loss/month 1.5 2.1 2.8Weight R15-R16 Passenger Tire Liner = 1.85 lbs $2.761 $2.642 $2.523Weight R16-R19 Light Truck Tire Liner = 3.5 lbs $5.223 $4.998 $4.772
ExxonMobil Chemical Company Data

57
Tire IPR Varies with Innerliner GaugeExxonMobil Tire IPR data measured for 100-phr BIIR innerlinerswith varying cured tire liner gauges
Decreasing Liner Gauge Increases Tire IPR %-Loss/Month Rates
ExxonMobil Chemical Company Data
Tire IPR: 100-phr BIIR
1.911.57
1.20
0.00
0.50
1.00
1.50
2.00
2.50
3.00
3.50
4.00
4.50
5.00
0.64 0.75 1.00
Gauge, mm
IPR
%-L
oss/
Mon
th

58
Tire IPR Varies with Innerliner GaugeExxonMobil Tire IPR data measured for 80/20 BIIR / NR innerlinerswith varying cured tire liner gauges
Decreasing Liner Gauge Increases Tire IPR %-Loss Rates/Month
ExxonMobil Chemical Company Data
Tire IPR: 80/20 BIIR / NR
3.85
2.82
1.88
0.00
0.50
1.00
1.50
2.00
2.50
3.00
3.50
4.00
4.50
5.00
0.65 0.73 0.90
Gauge, mm
IPR
%-L
oss/
Mon
th

59
Tire IPR Varies with Innerliner GaugeExxonMobil Tire IPR data measured for 60/40 BIIR / NR innerlinerswith varying cured tire liner gauges
Decreasing Liner Gauge Increases Tire IPR %-Loss Rates/Month
ExxonMobil Chemical Company Data
Tire IPR: 60/40 BIIR / NR
4.61
3.97
3.55
0.00
0.50
1.00
1.50
2.00
2.50
3.00
3.50
4.00
4.50
5.00
0.67 0.77 0.97
IRR, %-Loss/Month
Gau
ge, m
m

60
Model Liner Cost Estimates: Gauge
Using Only a Liner Gauge Change to Effect ~30% Improvement in IPR:$0.353 / Passenger Tire to Reduce IPR by 1.0 % / Month
2Compound Ingredients List Price Pricing Source ExxonMobil
$ / lb (6/2008) phr $HALOBUTYL RUBBER, BB 2222 2.02 ExxonMobil Chemical 80 0.884NATURAL RUBBER, SMR 20 1.432 Smithers Report 20 0.157CARBON BLACK, N-660 0.7825 Columbian Chemicals Co 60 0.257NAPHTHENIC OIL 0.65 R. E. Carroll, Inc 8 0.028ADHESIVE RESIN, 40MS 1.04 Struktol Company of America 7 0.040TACKIFYING RESIN, SP1068 1.62 SI Group, Inc 4 0.035STEARIC ACID 1.01 R. E. Carroll, Inc 1 0.006SULFUR 0.46 Western Reserve Chemical 0.5 0.001ZINC OXIDE 0.99 American Chemet Corporation 1 0.005ACCELERATORS, MBTS 2.05 Western Reserve Chemical 1.25 0.014Total Ingredients 182.75 1.428
Tire IPR, %-loss/month 1.88 2.82 3.85Tire Weight, lb 17.39 17.08 16.65Cured Liner Gauge, mm 0.90 0.73 0.65Estimated Passenger Tire Liner Weight, lbs 1.75 1.42 1.26Estimated Passenger Tire Liner Cost $2.499 $2.028 $1.805
ExxonMobil Chemical Company Data

61
0.5
1.5
2.5
3.5
4.5
5.5
6.5
0.4 0.6 0.8 1.0 1.2 1.4
Innerliner Gauge, mm
Pres
sure
Los
s,%
mon
th (
175
/ 70
TR 1
4 )
NR
40 HIIR
60 HIIR
80 HIIR
100 HIIR
Summary: IPR vs Liner Content / Gauge
Adjusting Halobutyl Rubber Content has Greater Effectiveness than Increasing Liner Gauge in Reducing Tire IPR %-Loss Rates
ExxonMobil Chemical Company Data
62
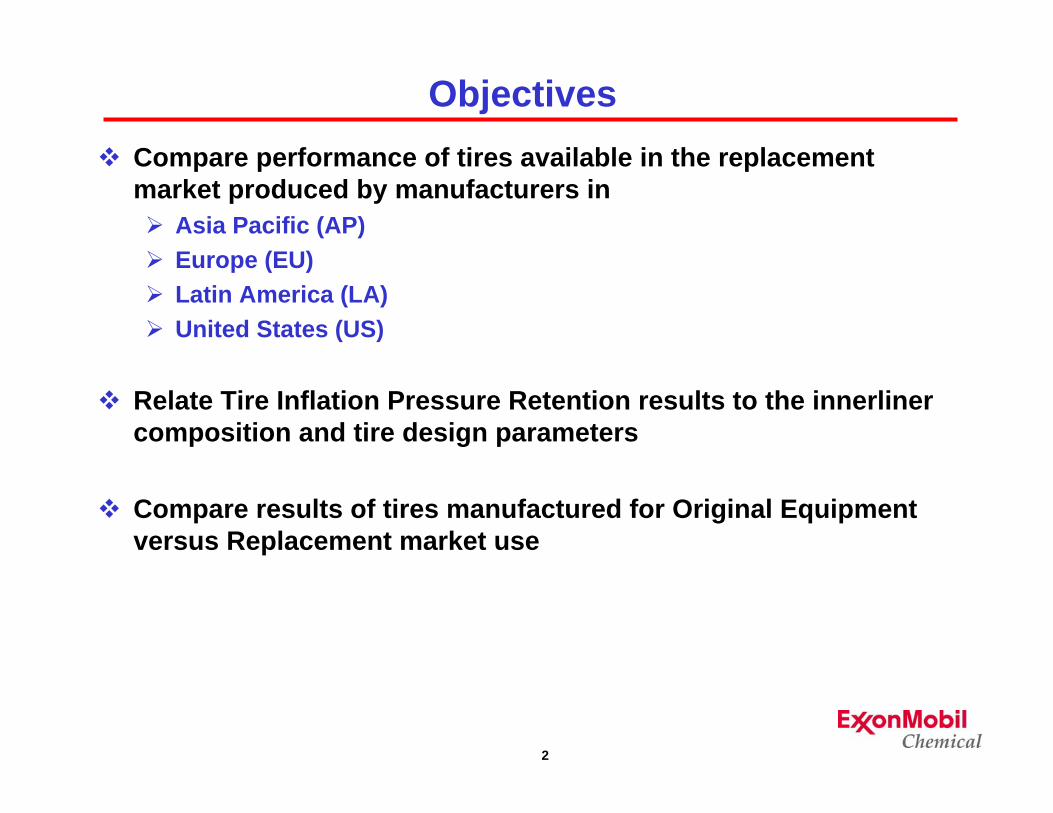
Summary
• 58 sets of HR15 tires purchased worldwide and evaluated– Imports from Asia Pacific were purchased in Europe and USA for
comparison to AP produced tires purchased in AP market– All but one tire brand could have been purchased in the USA
• Tire constructions and weights vary significantly
• Tire innerliner formulations vary
• Tires manufactured in the USA have lower IPR values than tires produced in AP– Tire IPR varies from 1.43 to 3.41 %-loss/month– Top Ten Manufacturers produce lower IPR tires– Original equipment tires have lower IPR monthly loss rates
ExxonMobil Chemical Company Data

63
DISCLAIMER
©2008 ExxonMobil. To the extent the user is entitled to disclose and distribute this document, the user may forward, distribute, and/or photocopy this copyrighted document only if unaltered and complete, including all of its headers, footers, disclaimers, and other information. You may not copy this document to a web site. The information in this document relates only to the named product or materials when not in combination with any other product or materials. We based the information on data believed to be reliable on the date compiled, but we do not represent, warrant, or otherwise guarantee, expressly or impliedly, the merchantability, fitness for a particular purpose, suitability, accuracy, reliability, or completeness of this information or the products, materials, or processes described. The user is solely responsible for all determinations regarding any use of material or product and any process in its territories of interest. We expressly disclaim liability for any loss, damage, or injury directly or indirectly suffered or incurred as a result of or related to anyone using or relying on any of the information in this document. There is no endorsement of any product or process, and we expressly disclaim any contrary implication. The terms, “we”, “our”, “ExxonMobil Chemical", or “ExxonMobil" are used for convenience, and may include any one or more of ExxonMobil Chemical Company, Exxon Mobil Corporation, or any affiliates they directly or indirectly steward.
10th Worldwide Tire Survey: Replacement Tires


![Album Orbis [III] Cypriana Norwida - struktura opowieści ... · PDF fileWalter Benjamin Trzy księgi Album Orbis Norwida stanowią osobliwą całość. ... rozmieszczonych obok siebie](https://img.dokumen.tips/doc/110x75/5aaa722b7f8b9a77188e223f/album-orbis-iii-cypriana-norwida-struktura-opowiesci-benjamin-trzy-ksiegi.jpg)