Embed Size (px)
Citation preview

INTERNATIONAL JOURNAL of RENEWABLE ENERGY RESEARCH Majid Vafaeipour et al., Vol.4, No.1, 2014
Statistical Analysis of Wind and Solar Energy
Potential in Tehran
Majid Vafaeipour*‡, Mohammad H. Valizadeh**, Omid Rahbari*, Mahsa Keshavarz Eshkalag***
* Department of Energy Systems Engineering, Faculty of Engineering, Islamic Azad University-South Tehran Branch, Iran
** Iran University of Science and Technology, School of Electrical Engineering, Iran
*** Faculty of Management and Accounting, Islamic Azad University-South Tehran Branch, Iran
([email protected], [email protected], [email protected], [email protected])
‡Corresponding Author; Department of Energy Systems Engineering, Faculty of Engineering, Islamic Azad University-South
Tehran Branch, Tehran, Iran, [email protected]
Received: 03.01.2014 Accepted: 26.03.2014
Abstract- Knowing the potential of wind and solar energy resources is vital to determine significant information of sizing,
installing and implementation of renewable energy systems in a given region. The present study identifies wind and solar
energy properties of a studied area located in Tehran, Iran, using input meteorological data measured for one year period
provided by the Iran Renewable Energy Organization from a ground station, Letman Jungle. Many prior studies are limited in
using average wind speed without classification of the resource. However, the present paper adopts the random fluctuations of
wind speed data for classification purpose. Furthermore, it utilizes a temperature-based method to estimate solar energy
potential of the region. In this regard, daily and monthly average amounts of global solar irradiation on horizontal surface are
calculated all around a year. Regarding wind energy resource properties, the most probable wind speed and its direction, the
velocity which carries the maximum energy, the average wind power density, and the wind energy density of the region are all
calculated and discussed. Investigation of the results indicates harnessing solar energy would be more favourable for the
studied region.
Keywords- Energy resource, Wind energy potential, Solar energy potential, Wind power density, Weibull distribution,
Temperature-based method
1. Introduction
The rapid rising amount of energy consumption as a
result of modernity besides industrial and agricultural
development has been a main issue of energy discussions
recently. Based on current reserves and consumption rate of
fossil resources, the world will sustain 122 years for coal, 42
years for oil and 60 years for natural gas [1]. Global
warming, depletion of fossil resources, population growth
and environmental awareness plus increasing energy
demands are of the vital factors to consider utilization clean
energy much promising [2, 3]. Figs. 1-2, provided by the
World Renewables Report 2011, illustrate the growth of
employing wind and solar energy in recent years. During
2010, the new capacity added for wind power has reached by
39 GW, and almost 17 GW of photovoltaic capacity was
added globally in 2010 comparing to 7.3 GW in 2009 [4].
Estimating potential of these resources has been the
interested field of a number of researchers throughout the
literature. Kamau et al. [5] employed 6 years of wind data to
estimate wind energy potential and found Marsabit as a
suitable location for stand-alone and grid connected power
generation. To estimate wind mean power density, which is
of the preliminary information of installing feasible wind
farms, statistical investigations have been performed in Hong
Kong, UK, South Africa and Eastern Mediterranean [6-9]. In
other studies, Rumachandra et al. [10] and Sliz-Szkliniarz et
al. [11] utilized GIS-based methods to investigate wind
energy potential in India and Germany, respectively. In a
comparison thorough 7 numerical methods, Paulo Alexandre
Costa Rocha reached smaller errors in fitting Weibull
distribution curves via employing numerical approaches
based on mathematical iterations for defining shape and scale
parameters [12].
Different TB methods has been developed and modified
through the history of solar radiation research. In this regard,
Table 1 presents an overview where most of the proposed
methods are derived from the Hargreaves model. The
difference between TB models with same parameters is due
to their various empirical coefficients and the calculation
way of their constituting parameters.

INTERNATIONAL JOURNAL of RENEWABLE ENERGY RESEARCH Majid Vafaeipour et al., Vol.4, No.1, 2014
234
Fig. 1. Wind power-Existing world capacity (1996-2010) [4]
Fig. 2. Solar PV-Existing world capacity (1996-2010) [4]
In the present study, the renewable energy potential of
wind and solar energy resources and their relevant properties
are evaluated via using input meteorological data measured
for one year period from the studied ground station, Letman
Jungle, located in the west of Tehran city. For this, a TB
method is used for estimation of global solar irradiation on a
horizontal surface, and the wind energy properties of the
region are obtained via utilizing a statistical approach.
2. Analytic Methods
2.1. Wind Analysis
The power per unit area transported by a fluid system is
related to the cube of the fluid speed [5]:
31( )
2P v Av (1)
In the above equation, power of the wind that flows at
speed v through a blade sweep area A (m2) and density
can be calculated.
equals 1.225 kg/m3 which is the
standard air density at the sea level with mean ambient
temperature of 15 C and 1 atmospheric pressure. In order to
decide which statistical distribution or probability density
function (PDF) fits to wind speed data: a) a null hypothesis is
set, b) test statistic is obtained, and c) considering decision
rule (of the null hypothesis) decision regarding acceptance or
rejection of the fitness alternate PDF is made. The Null
hypothesis is considered as: H0: Estimated PDF of wind
speed data set. Decision rules for acceptation or rejection of
the mentioned hypothesis are given: if the calculated p-value
based on applying a proper goodness of fit test is greater than
the significant level (i.e. 0.05) accept H0; otherwise reject it
[18].
Table 1. Temperature-based models
Model (Authors et al.)
Year
Indicators
Almorox
2011 0
H , max
T , min
T
Duat
2011 0
H , max
T , min
T
Mahmood
2002 0H ,
maxT ,
minT , , DOY, LDY
Annandale
2002 0
H ,max
T ,min
T , Z
Winslow
2001 0
H ,max
T ,min
T ,mean
T , Hday,
Goodin
1999 0H ,
maxT ,
minT
Donatelli
1998 0H ,
maxT ,
minT
Allen
1997 0H ,
maxT ,
minT
Bristow
1984 0H ,
maxT ,
minT
Hargreaves
1982 maxT ,
minT
0H extraterrestrial solar radiation,
maxT daily maximum air temperature,
minT daily minimum air temperature,
meanT mean annual temperature,
latitude, DOY day of year, LDY longest DOY, Hday half-day length
fitness alternate PDF is made. The Null hypothesis is
considered as: H0: Estimated PDF of wind speed data set.
Decision rules for acceptation or rejection of the mentioned
hypothesis are given: if the calculated p-value based on
applying a proper goodness of fit test is greater than the
significant level (i.e. 0.05) accept H0; otherwise reject it
[18].
In many cases among all density functions, the Weibull
distribution could act as an appropriate fitness alternative for
wind speed PDF [19]. Weibull function has flexibility and
simplicity and provides a logical fit to experimental data
when applying to wind data [20]. Eq. 2 represents the
Weibull probability function with shape and scale parameters
of k and c respectively:
1( ) ( ) exp[ ( ) ]k kk v vf v
c c c
(2)
To indicate the fraction of time the wind speed is equal or
lower than speed v, the cumulative distribution function
(CDF) of velocity is:
( ) 1 exp[ ( ) ]kvF v
c
(3)
The average wind velocity and its variance of wind can be
calculated using the measured data via Eqs. 4-5.
1
1 n
i
i
v vn
(4)
2 2
1
1( )
1
n
i
i
v vn
(5)
As follows in Eq. 6, the Weibull function parameters, k
(shape factor) and c (scale factor), can be approximated:

INTERNATIONAL JOURNAL of RENEWABLE ENERGY RESEARCH Majid Vafaeipour et al., Vol.4, No.1, 2014
235
1.086( ) (1 10)k kv
(6)
1(1 )
vc
k
(7)
where the gamma function ( ) can be obtained via utilizing
Stirling approximation as follows:
1
0
( ) u xx e u du
(8)
The average power density based on the Weibull PDF is
given as:
3 3
0
1 1 3( ) ( )
2 2
P kv f v dv c
A k
(9)
Knowing wind power density (P/A), wind energy density for
a favorable duration of T, can be obtained via Eq. 10.
31 3( )
2
E kc T
A k
(10)
After the scale and shape parameters of Weibull function are
yielded, the most probable wind speed (Vmp ) and the wind
speed which carries the maximum energy Vmax,E can be
calculated as represented in the following Eqs.:
11
(1 )kmpV c
k
(11)
1
max,
2(1 ) k
EV ck
(12)
2.2. Solar Analysis
Using the ambient temperature difference, Hargreaves and
Samani [21] suggested Eq. 13 to estimate global solar
irradiation sR .
0.5
max min( )
s r aR K T T R
(13)
In the above-mentioned Eq., rK is an empirical coefficient
and aR is the extraterrestrial radiation. rK
is an unit-less
coefficient which varies for different atmospheric conditions
and can be taken equal to 0.17 for arid and semi-arid
climates, respectively. It also presented by Hargreaves equal
to 0.16 and 0.19 for interior and coastal regions, respectively
[21]. Later on, Allen [22] introduced a correction factor for
rK which can be seen in Eq. 14.
0.5
0
( )r ra
pK K
p
(14)
where p and 0p are the mean atmospheric pressure of the
site and the mean atmospheric pressure at sea level, 101.3
kPa, respectively. Mean pressure of the site, can be either
considered using the measured data of the site or the
estimated values according to Burman equation as it follows
[23]. For the purpose of the current study, measured mean
pressure data is employed.
5.26293 0.0065( )
293o
ZP P
(15)
where Z would be the height in m. In Eq. 14, the value of
empirical coefficient raK equals 0.17 and 0.2, suggested by
Allen for interior and coastal regions respectively [22]. It is
notable that Eq. 14 performs inefficient for elevations higher
than 1500 meters [15] in contrast with the elevation of the
studied region. Another way to calculate raK
is to use
Samani’s modified form via using maximum and minimum
ambient temperature differences as given in Eq. 16:
2
max min max min0.00185( ) 0.0433( ) 0.4023rK T T T T
(16)
36023.45 [
365
(284 )]sin n
(17)
In Eq. 17, the sun declination angle ( ), is the angle between
the joining line of the centers of the sun and the earth and its
projection on the equatorial plane, and depends on the nth
day of the year. Introducing the hour angle ( ) which the
earth must rotate to take meridian plane under the sun, the
sunset hour angle ( s ) will be as follows:
1( )s cos Tan Tan
(18)
where is latitude of the location. As follows, Eq. 19
defines the angle between the sun’s ray and perpendicular
line to the horizontal plane called Zenith (Polar) angle.
( ) ( ) ( ( ) ( ))z s s
cos cos cos sin sin sin
(19)
The solar radiation outside the atmosphere on a horizontal
plane ( oI ) for nth day of the year, considering the SCI (solar
constant) which is defined equal to 1367 2
w
m by the world
meteorological organization (WMO) standard, is given in Eq.
20 [16, 17].
0
360[1 0.033 ( )]
365SC z
nI I cos cos
(20)
To calculate the integrated daily extraterrestrial radiation on
a horizontal surface ( aR ), Eq. 21 can be employed.
0
24 3600a
R I
(21)

INTERNATIONAL JOURNAL of RENEWABLE ENERGY RESEARCH Majid Vafaeipour et al., Vol.4, No.1, 2014
236
3. Area and Using Data
Tehran, a populated city and the capital of Iran is located
at altitude of 1190.8 m from the sea level. The utilized data
of the study is measured for one year period by the Iran
Renewable Energy Organization from a ground station,
Letman Jungle, located in the west of Tehran. The input
utilized data include maximum, minimum and average of the
daily ambient temperature, and the pressure to evaluate the
status of global solar irradiation on horizontal surface. Also,
wind velocity data with 1 hour intervals are utilized to obtain
wind energy properties of the region. In this regards, monthly
maximum, minimum and average atmospheric pressures and
ambient temperatures are shown in Table 2 via using the
measured daily data. Also, Figs. 3-4 illustrate the changes
regarding monthly mean wind velocity and monthly mean
ambient temperature, respectively. From the average of daily
measured data, it can be seen that Tehran experiences its
coldest and hottest months in January (-4 C ) and July (42
C ) respectively.
Table 2. The monthly maximum, minimum ambient
temperature and average atmospheric pressure of the
collected data
Max
Temp
Min
Temp Mean P
Jan 13 -4 101.85
Feb 14 -4 101.25
Mar 23 -2 101.73
Apr 23 7 101.43
May 36 14 101.45
Jun 39 19 100.94
Jul 42 24 101.06
Aug 40 15 101.1
Sep 34 17 101.43
Oct 31 6 101.81
Nov 18 -1 101.9
Dec 13 -1 102.28
Maximum of the mean wind speed occurs at March
(5.20 m/s) which may result highest wind potential in this
month depending on Weibull function parameters. Yearly
average of wind speed equals 4.09 m/s and the monthly mean
wind speed exhibits its biggest variation from February to
March and April to May.
To handle the uncertainties caused by the discontinuous
nature of wind velocity, the fitted PDF over histogram of the
measured wind data of the region is plotted in Fig. 5. As can
be seen, the PDF follows the Weibull function’s general
pattern appropriately. Also, the plot for Weibull parametric
cumulative distribution is shown in Fig. 6 which indicates
the probability where wind speed is equal or lower than
speed v. The monthly calculated values of Vmp and Vmax,E are
plotted in Fig. 7 via using the shape and scale parameters of
the Weibull function.
Fig. 3. The monthly mean wind speed changes of the
collected data
Fig. 4. The temperature changes of the collected data
211815129630
9
8
7
6
5
4
3
2
1
0
Wind Speed (m/s)
Pe
rce
n t (
%)
Fig. 5. Weibull pdf curve and the collected wind velocity
data histogram
10987654321
100
80
60
40
20
0
Wind Speed (m/s)
Per
cen
t (%
)
Fig. 6. The cumulative distribution function of the collected
wind velocity data
0
1
2
3
4
5
6
7
Jan
Feb
Mar
Ap
r
May
Jun
Jul
Au
g
Sep
Oct
No
v
Dec
Mea
n w
ind
sp
eed
(m
/s)
-10
10
30
Jan
Feb
Mar
Ap
r
May
Jun
Jul
Au
g
Sep
Oct
No
v
Dec
Tem
perature (˚C)
Max Temp Avg Temp Min Temp
INTERNATIONAL JOURNAL of RENEWABLE ENERGY RESEARCH Majid Vafaeipour et al., Vol.4, No.1, 2014
237
Fig. 7. The monthly mean Vmp and Vmax,E
4. Results and Discussion
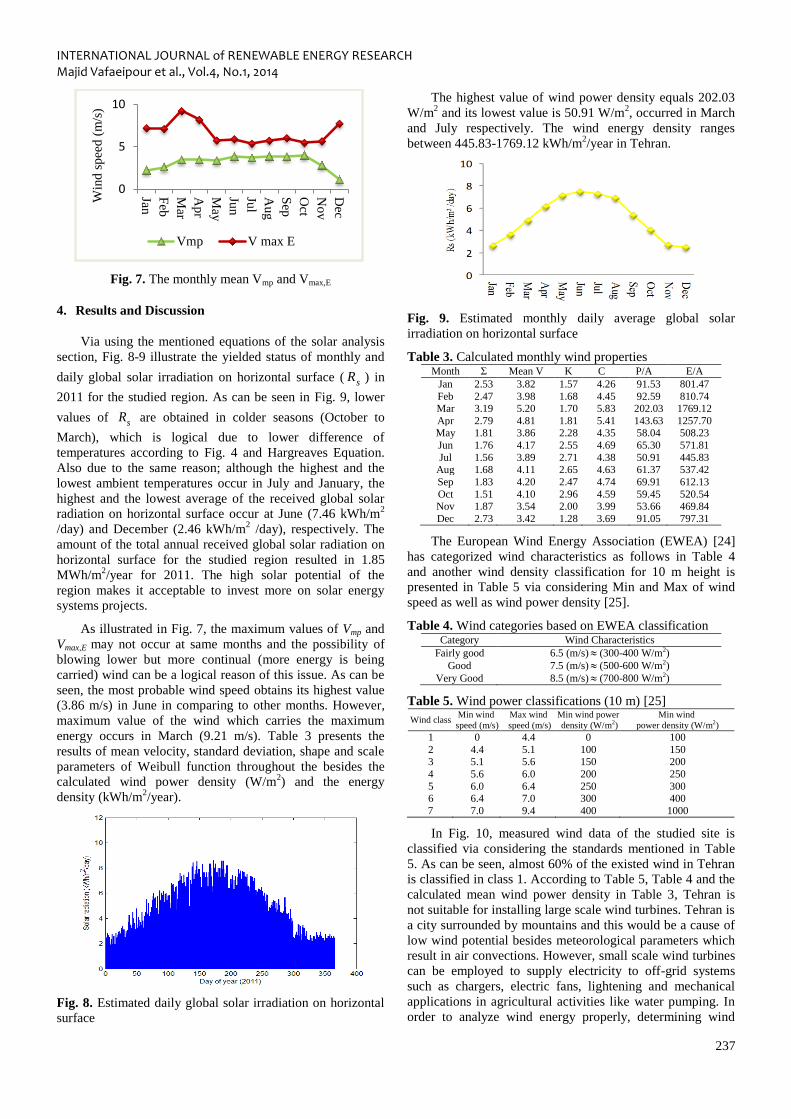
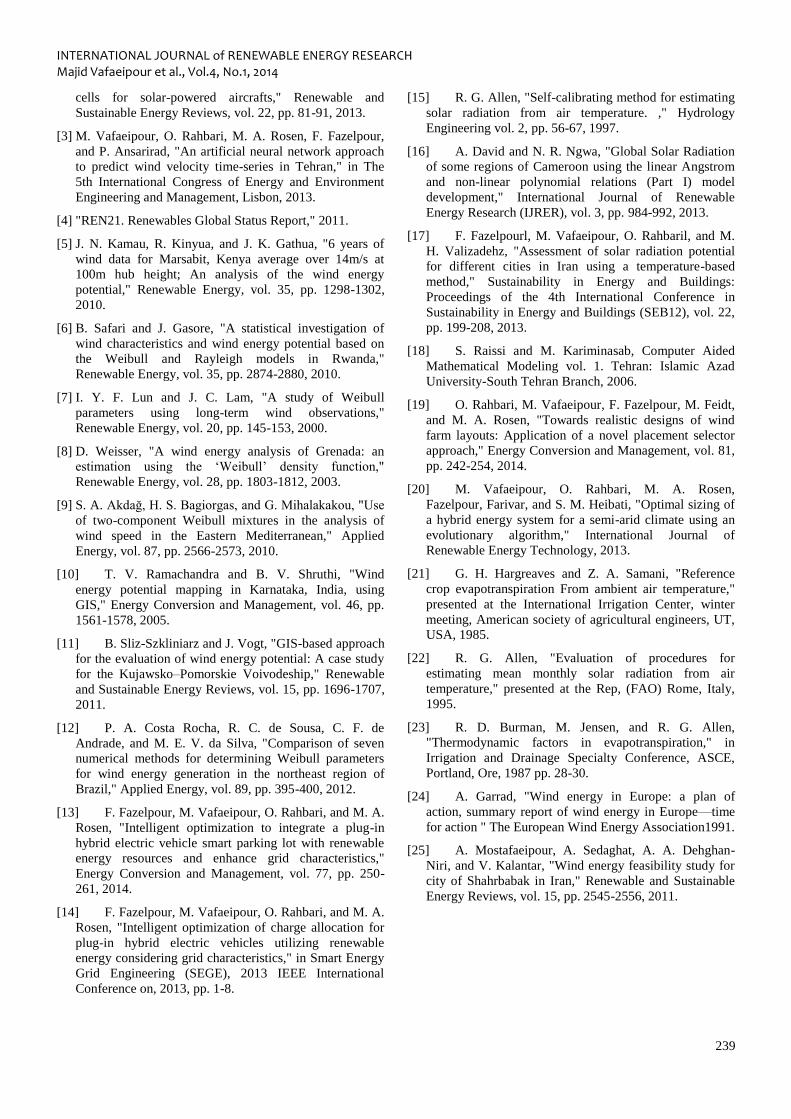
Via using the mentioned equations of the solar analysis
section, Fig. 8-9 illustrate the yielded status of monthly and
daily global solar irradiation on horizontal surface ( sR ) in
2011 for the studied region. As can be seen in Fig. 9, lower
values of sR are obtained in colder seasons (October to
March), which is logical due to lower difference of
temperatures according to Fig. 4 and Hargreaves Equation.
Also due to the same reason; although the highest and the
lowest ambient temperatures occur in July and January, the
highest and the lowest average of the received global solar
radiation on horizontal surface occur at June (7.46 kWh/m2
/day) and December (2.46 kWh/m2 /day), respectively. The
amount of the total annual received global solar radiation on
horizontal surface for the studied region resulted in 1.85
MWh/m2/year for 2011. The high solar potential of the
region makes it acceptable to invest more on solar energy
systems projects.
As illustrated in Fig. 7, the maximum values of Vmp and
Vmax,E may not occur at same months and the possibility of
blowing lower but more continual (more energy is being
carried) wind can be a logical reason of this issue. As can be
seen, the most probable wind speed obtains its highest value
(3.86 m/s) in June in comparing to other months. However,
maximum value of the wind which carries the maximum
energy occurs in March (9.21 m/s). Table 3 presents the
results of mean velocity, standard deviation, shape and scale
parameters of Weibull function throughout the besides the
calculated wind power density (W/m2) and the energy
density (kWh/m2/year).
Fig. 8. Estimated daily global solar irradiation on horizontal
surface
The highest value of wind power density equals 202.03
W/m2 and its lowest value is 50.91 W/m
2, occurred in March
and July respectively. The wind energy density ranges
between 445.83-1769.12 kWh/m2/year in Tehran.
Fig. 9. Estimated monthly daily average global solar
irradiation on horizontal surface
Table 3. Calculated monthly wind properties Month Σ Mean V K C P/A E/A
Jan 2.53 3.82 1.57 4.26 91.53 801.47
Feb 2.47 3.98 1.68 4.45 92.59 810.74 Mar 3.19 5.20 1.70 5.83 202.03 1769.12
Apr 2.79 4.81 1.81 5.41 143.63 1257.70 May 1.81 3.86 2.28 4.35 58.04 508.23
Jun 1.76 4.17 2.55 4.69 65.30 571.81
Jul 1.56 3.89 2.71 4.38 50.91 445.83 Aug 1.68 4.11 2.65 4.63 61.37 537.42
Sep 1.83 4.20 2.47 4.74 69.91 612.13
Oct 1.51 4.10 2.96 4.59 59.45 520.54 Nov 1.87 3.54 2.00 3.99 53.66 469.84
Dec 2.73 3.42 1.28 3.69 91.05 797.31
The European Wind Energy Association (EWEA) [24]
has categorized wind characteristics as follows in Table 4
and another wind density classification for 10 m height is
presented in Table 5 via considering Min and Max of wind
speed as well as wind power density [25].
Table 4. Wind categories based on EWEA classification Category Wind Characteristics
Fairly good 6.5 (m/s) (300-400 W/m2)
Good 7.5 (m/s) (500-600 W/m2)
Very Good 8.5 (m/s) (700-800 W/m2)
Table 5. Wind power classifications (10 m) [25]
Wind class Min wind
speed (m/s)
Max wind
speed (m/s)
Min wind power
density (W/m2)
Min wind
power density (W/m2)
1 0 4.4 0 100
2 4.4 5.1 100 150 3 5.1 5.6 150 200
4 5.6 6.0 200 250
5 6.0 6.4 250 300 6 6.4 7.0 300 400
7 7.0 9.4 400 1000
In Fig. 10, measured wind data of the studied site is
classified via considering the standards mentioned in Table
5. As can be seen, almost 60% of the existed wind in Tehran
is classified in class 1. According to Table 5, Table 4 and the
calculated mean wind power density in Table 3, Tehran is
not suitable for installing large scale wind turbines. Tehran is
a city surrounded by mountains and this would be a cause of
low wind potential besides meteorological parameters which
result in air convections. However, small scale wind turbines
can be employed to supply electricity to off-grid systems
such as chargers, electric fans, lightening and mechanical
applications in agricultural activities like water pumping. In
order to analyze wind energy properly, determining wind
0
5
10
Jan
Feb
Mar
Ap
r
May
Jun
Jul
Au
g
Sep
Oct
No
v
Dec
Win
d s
pee
d (
m/s
)
Vmp V max E

INTERNATIONAL JOURNAL of RENEWABLE ENERGY RESEARCH Majid Vafaeipour et al., Vol.4, No.1, 2014
238
direction accompanied by its other properties is a significant
issue in wind energy systems research. To illustrate wind
direction accompanied by its velocity, wind roses which are
polar diagrams are helpful tools in wind energy
investigations. Based on wind direction data which is
measured clock wise in degrees, wind frequencies (%) are
plotted in a polar diagram with respect to the cardinal point
from which the wind blows. The wind rose is divided to
sectors and each of them covers an arc of ig. 11
illustrates the wind rose of the studied region, and Fig. 12
plots it on the location where the utilized wind data of the
study was provided from. From Fig. 11 it can be seen that the
most probable wind direction of the region is in the quadrant
which correspond to the south east.
Fig. 10. Classification of existed wind velocities in Tehran
based on Table 5
Fig. 11. Wind rose of the studied region
Fig. 12. 3D Wind Rose of the studied region
5. Conclusions
Wind and solar energy are renewable and
environmental-friendly. They are alternate clean energy
sources associated to the fossil fuels that contaminate our
atmosphere. Via using the available measured data provided
by a ground meteorological station in Tehran, Iran, this study
evaluated the status of solar and wind energy potential. The
daily and monthly global solar irradiation on horizontal
surface and various wind energy properties were assessed
using a temperature-based method and Weibull distribution
function, respectively. To investigate the most probable
direction of the wind, wind direction and velocity data were
employed to plot the 2D and 3D wind roses of the region.
The sum of received annual global solar radiation on
horizontal surface yielded 1.85 MWh/m2/year for 2011. The
highest and the lowest ambient temperatures occurred in July
and January but the highest and the lowest average of global
solar irradiation were estimated in June (7.46 kWh/m2 /day)
and December (2.46 kWh/m2/day), respectively. Wind
analysis indicated that the region experiences its maximum
average velocity in March, April and February. The yearly
mean wind speed ranged between 3.42-5.2 m/s values related
to December and March. The yearly average of wind speed
was equal to 4.09 m/s and the biggest variations of monthly
mean wind speed were observed from February to March and
April to May. The most probable wind speed direction was at
the quadrant which corresponded to the south east. The
yearly average wind power density ranged between 50.91
and 202.03 W/m2
which is not desirable for using large scale
wind turbines but it will be sufficient for using small scale
turbines for small size non-grid electricity generation.
Although the investigations demonstrate higher solar energy
potential in comparison with wind energy density in Tehran,
it is notable that for the months with lower irradiation such as
January, February, March and April, the wind energy density
reaches to its highest values. This can support probable
feasibility of employing reliable PV-wind hybrid energy
systems in the region to be evaluated. Also, economic
programming and developing policies to employ the
investigated resources in an optimized way merit further
investigations via considering the renewable energy
characteristics of the region.
References
[1] M. S. H. Lipu, M. S. Uddin, and M. A. R. Miah, "A
Feasibility Study of Solar-Wind-Diesel Hybrid System in
Rural and Remote Areas of Bangladesh," International
Journal of Renewable Energy Research (IJRER), vol. 3,
pp. 892-900, 2013.
[2] F. Fazelpour, M. Vafaeipour, O. Rahbari, and R.
Shirmohammadi, "Considerable parameters of using PV
INTERNATIONAL JOURNAL of RENEWABLE ENERGY RESEARCH Majid Vafaeipour et al., Vol.4, No.1, 2014
239
cells for solar-powered aircrafts," Renewable and
Sustainable Energy Reviews, vol. 22, pp. 81-91, 2013.
[3] M. Vafaeipour, O. Rahbari, M. A. Rosen, F. Fazelpour,
and P. Ansarirad, "An artificial neural network approach
to predict wind velocity time-series in Tehran," in The
5th International Congress of Energy and Environment
Engineering and Management, Lisbon, 2013.
[4] "REN21. Renewables Global Status Report," 2011.
[5] J. N. Kamau, R. Kinyua, and J. K. Gathua, "6 years of
wind data for Marsabit, Kenya average over 14m/s at
100m hub height; An analysis of the wind energy
potential," Renewable Energy, vol. 35, pp. 1298-1302,
2010.
[6] B. Safari and J. Gasore, "A statistical investigation of
wind characteristics and wind energy potential based on
the Weibull and Rayleigh models in Rwanda,"
Renewable Energy, vol. 35, pp. 2874-2880, 2010.
[7] I. Y. F. Lun and J. C. Lam, "A study of Weibull
parameters using long-term wind observations,"
Renewable Energy, vol. 20, pp. 145-153, 2000.
[8] D. Weisser, "A wind energy analysis of Grenada: an
estimation using the ‘Weibull’ density function,"
Renewable Energy, vol. 28, pp. 1803-1812, 2003.
[9] S. A. Akdağ, H S Bagiorgas, and G Mihalakakou, "Use
of two-component Weibull mixtures in the analysis of
wind speed in the Eastern Mediterranean," Applied
Energy, vol. 87, pp. 2566-2573, 2010.
[10] T. V. Ramachandra and B. V. Shruthi, "Wind
energy potential mapping in Karnataka, India, using
GIS," Energy Conversion and Management, vol. 46, pp.
1561-1578, 2005.
[11] B. Sliz-Szkliniarz and J. Vogt, "GIS-based approach
for the evaluation of wind energy potential: A case study
for the Kujawsko–Pomorskie Voivodeship," Renewable
and Sustainable Energy Reviews, vol. 15, pp. 1696-1707,
2011.
[12] P. A. Costa Rocha, R. C. de Sousa, C. F. de
Andrade, and M. E. V. da Silva, "Comparison of seven
numerical methods for determining Weibull parameters
for wind energy generation in the northeast region of
Brazil," Applied Energy, vol. 89, pp. 395-400, 2012.
[13] F. Fazelpour, M. Vafaeipour, O. Rahbari, and M. A.
Rosen, "Intelligent optimization to integrate a plug-in
hybrid electric vehicle smart parking lot with renewable
energy resources and enhance grid characteristics,"
Energy Conversion and Management, vol. 77, pp. 250-
261, 2014.
[14] F. Fazelpour, M. Vafaeipour, O. Rahbari, and M. A.
Rosen, "Intelligent optimization of charge allocation for
plug-in hybrid electric vehicles utilizing renewable
energy considering grid characteristics," in Smart Energy
Grid Engineering (SEGE), 2013 IEEE International
Conference on, 2013, pp. 1-8.
[15] R. G. Allen, "Self-calibrating method for estimating
solar radiation from air temperature. ," Hydrology
Engineering vol. 2, pp. 56-67, 1997.
[16] A. David and N. R. Ngwa, "Global Solar Radiation
of some regions of Cameroon using the linear Angstrom
and non-linear polynomial relations (Part I) model
development," International Journal of Renewable
Energy Research (IJRER), vol. 3, pp. 984-992, 2013.
[17] F. Fazelpourl, M. Vafaeipour, O. Rahbaril, and M.
H. Valizadehz, "Assessment of solar radiation potential
for different cities in Iran using a temperature-based
method," Sustainability in Energy and Buildings:
Proceedings of the 4th International Conference in
Sustainability in Energy and Buildings (SEB12), vol. 22,
pp. 199-208, 2013.
[18] S. Raissi and M. Kariminasab, Computer Aided
Mathematical Modeling vol. 1. Tehran: Islamic Azad
University-South Tehran Branch, 2006.
[19] O. Rahbari, M. Vafaeipour, F. Fazelpour, M. Feidt,
and M. A. Rosen, "Towards realistic designs of wind
farm layouts: Application of a novel placement selector
approach," Energy Conversion and Management, vol. 81,
pp. 242-254, 2014.
[20] M. Vafaeipour, O. Rahbari, M. A. Rosen,
Fazelpour, Farivar, and S. M. Heibati, "Optimal sizing of
a hybrid energy system for a semi-arid climate using an
evolutionary algorithm," International Journal of
Renewable Energy Technology, 2013.
[21] G. H. Hargreaves and Z. A. Samani, "Reference
crop evapotranspiration From ambient air temperature,"
presented at the International Irrigation Center, winter
meeting, American society of agricultural engineers, UT,
USA, 1985.
[22] R. G. Allen, "Evaluation of procedures for
estimating mean monthly solar radiation from air
temperature," presented at the Rep, (FAO) Rome, Italy,
1995.
[23] R. D. Burman, M. Jensen, and R. G. Allen,
"Thermodynamic factors in evapotranspiration," in
Irrigation and Drainage Specialty Conference, ASCE,
Portland, Ore, 1987 pp. 28-30.
[24] A. Garrad, "Wind energy in Europe: a plan of
action, summary report of wind energy in Europe—time
for action " The European Wind Energy Association1991.
[25] A. Mostafaeipour, A. Sedaghat, A. A. Dehghan-
Niri, and V. Kalantar, "Wind energy feasibility study for
city of Shahrbabak in Iran," Renewable and Sustainable
Energy Reviews, vol. 15, pp. 2545-2556, 2011.