Embed Size (px)
Citation preview

Fisheries management in the Baltic SeaHow to get on track to a sustainable future in Baltic fisheries
Nyhavn 16, 4 sal
1051 Copenhagen (Denmark)
Phone: + 45 33151160
baltic.oceana.org
Rue Montoyer, 39
1000 Brussels (Belgium)
Tel.: + 32 (0) 2 513 22 42
Fax: + 32 (0) 2 513 22 46
Plaza de España - Leganitos, 47
28013 Madrid (Spain)
Tel.: + 34 911 440 880
Fax: + 34 911 440 890
www.oceana.org
1350 Connecticut Ave., NW, 5th Floor
Washington D.C., 20036 (USA)
Tel.: + 1 (202) 833 3900
Fax: + 1 (202) 833 2070
33 Cor. Regent and Dean St.
Belize City, Belize, C.A.
Tel.: + 501 227 2705
Fax: + 501 227 2706
Av. Condell 520,
Providencia, Santiago (Chile)
CP 7500875
Tel.: + 56 2 925 5600
Fax: + 56 2 925 5610
Fish
erie
s m
anag
emen
t in
the
Bal
tic S
ea
This publication and all related research was completed by Oceana.
Project Directors • Xavier Pastor, Anne SchroeerAuthors • Anne Schroeer, Andrzej Białaś, Hanna Paulomäki, Christina AbelGeographic Information Systems • Jorge UberoEditor • Marta Madina, Hanna PaulomäkiEditorial Assistants • Angela Pauly, Ángeles Sáez, Natividad Sánchez, Martyna LapinskaiteCover • Finnish trawler in the Bothnian Sea, Sweden. April 2011. © OCEANA/ Carlos MinguellContents • Artisanal fishing vessels on the beach of Kśty Rybackie, Poland. April 2011. © OCEANA/ LXDesign and layout • NEO Estudio Gráfico, S.L.Photo montage and printer • Imprenta Roal, S.L.
Acknowledgments • This report was made possible thanks to the generous support of the Arcadia Foundation, Zennström Philanthropies and the Robertson Foundation.
Portions of this report are intellectual property of ESRI and its licensors and are used under license. Copyright © ESRI and its licensors.
Reproduction of the information gathered in this report is permitted as long as © OCEANA is cited as the source.
March 2012
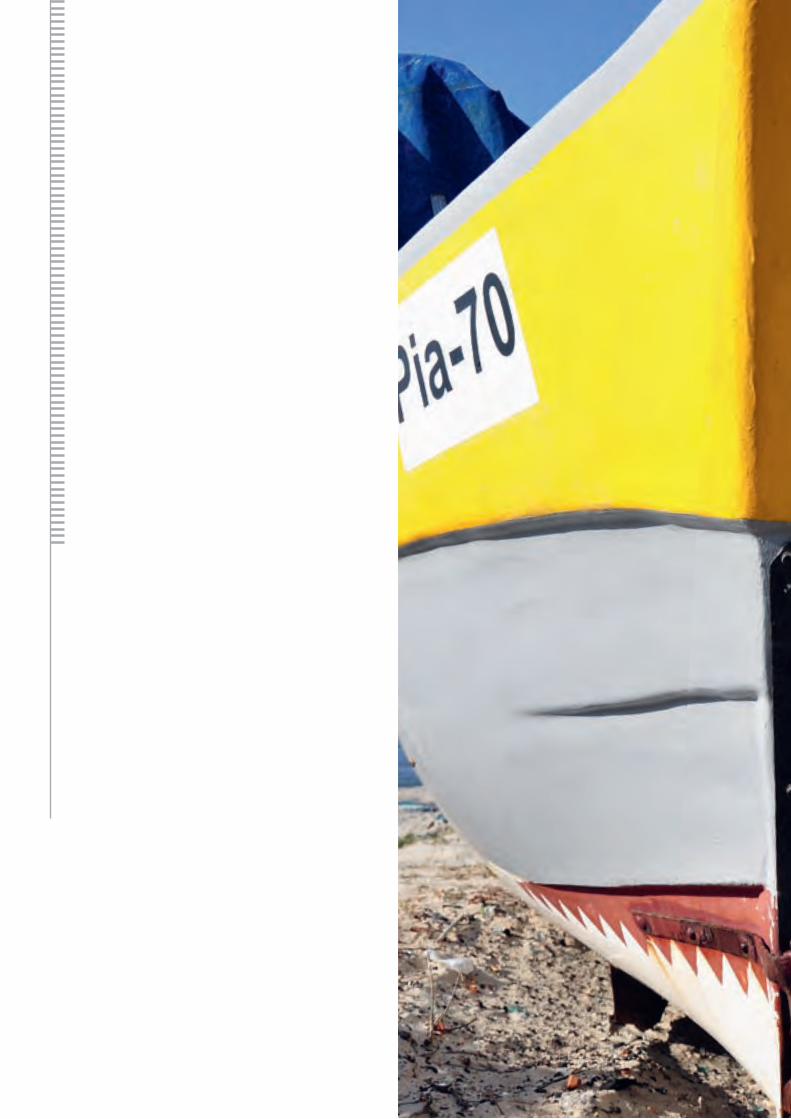
Artisanal fishing vessel on the beach, Piaski, Poland. April 2011. © OCEANA/ LX

ContentsExecutive summary 02
1. Introduction: Fisheries in the Baltic Sea 05 1.1. Baltic fishing countries, species and fisheries management 06 1.2. The Baltic fishing fleet 13
2. The biggest problems 18 2.1. Overfishing, destructive and problematic fishing methods 19 2.2. Unmanaged fisheries 26 2.3. Threatened fish species and their fisheries 30
3. IUU fishing in the Baltic Sea and the Kattegat 35
4. Cod 41 4.1. Cod fisheries and management in the Baltic Sea and the Kattegat 42 4.2. IUU fishing for cod in the Baltic Sea and the Kattegat 44
5. Salmon and sea trout 49 5.1. Salmon and sea trout fisheries and management in the Baltic Sea
and the Kattegat 50 5.2. IUU fishing for salmon and sea trout in the Baltic Sea and the
Kattegat 52
6. Herring and sprat 59 6.1. Herring and sprat fisheries and management in the Baltic Sea and
the Kattegat 60 6.2. IUU fishing for herring and sprat in the Baltic Sea and the Kattegat 61
7. Recreational fisheries 64 7.1. Unreported recreational fisheries in the Baltic Sea and the Kattegat 65 7.2. Poaching 66
8. Conclusions and recommendations 70
References 75

2
Executive summary
Artisanal fishing vessels at the beach of Sopot, Poland. April 2011. © OCEANA/ LX

Fisheries management in the Baltic Sea
3
A multitude of human activities have put the Baltic Sea ecosystems under se-vere pressure and turned this brackish, semi-enclosed sea into one of the most polluted in the world. Destructive fish-ing practices like dredging and bottom trawling pose heavy threats to these sensitive ecosystems. Oceana’s report on fisheries outlines the biggest prob-lems related to fisheries in the Baltic Sea and shows that the problem of Ille-gal, Unregulated and Unreported (IUU) fishing remains a problem. The report also provides an overview of issues on the political agenda in European Union and discusses the need for improved fisheries management and the imple-mentation of agreed commitments, like achieving Maximum Sustainable Yields (MSY) for all fish stocks by 2015 as a first step towards a sustainable fisheries management, and legal obligations, like achieving Good Environmental Status of all marine environments, including Baltic Sea by 2020.
Over 50 species of fish are commer-cially caught in the Baltic Sea and the Kattegat, for which only 10 of have been given scientific advice, and only five are managed with Total Allowable Catch (TAC) in the Baltic Sea. While the status of the eastern Baltic cod stock has improved over the last years, other stocks have not been as successful: most of the Baltic fish stocks are overfished, and for five of these (sea trout, floun-der, turbot, brill and dab) scientific ad-vice to limit fisheries has been ignored. Additionally, in the case of salmon in particular, the TAC was set twice as high as the scientific advice recom-mended. Despite the fact that salmon, sea trout and eel are all threatened and declining, they remain continuously commercially fished.
IUU fishing for cod in the Eastern Baltic Sea has declined in the past years after increased monitoring, control and sur-veillance efforts, but the problem is not solved overall and the percentage of un-reported catches is still very high in cer-tain fisheries. The worst examples right now include Baltic salmon and sea trout and cod in the Kattegat.
During the 2011 at-sea expedition and harbour research, Oceana document-ed a number of unsustainable fishing practices. The findings included sev-eral large fishing vessels still officially registered as driftnetters, even though the driftnet ban in the Baltic Sea has been in force since 2008. Additionally several “semi-driftnetters” were docu-mented that use driftnets which are anchored on one side making it legal, as this type of driftnet was excluded from the driftnet ban but nevertheless has the same by-catch problem as con-ventional driftnets. Other findings in-cluded the unloading of cod in April in the Western Baltic Sea and in July and August in the Eastern Baltic Sea, despite the fact that fisheries in those months and areas are “closed” to preserve the cod stocks. Fish was also spotted be-ing sold directly to consumers, inside and outside closed seasons, before or without being inspected to verify catch amounts. Furthermore, Oceana found it unacceptable that almost all Baltic sprat and an enormous amount of Baltic herring is caught for fishmeal and ani-mal food, destined for highly controver-sial mink farms. These types of fisher-ies are unsustainable as they are carried out by large scale fishing vessels using very small mesh sizes which often take non-target and undersized fish.
Fishing net with float and rollers in the port of Rønne, Bornholm, Denmark. March 2011. © OCEANA/ LX
4
Artisanal fishing vessel, Piaski, Poland. April 2011. © OCEANA LX
Recreational catches are high in the Baltic Sea and have often been under-estimated in earlier years. Yet in cer-tain areas, like the Sound and in the Kattegat, recreational catches are esti-mated to amount to up to 50% or more of commercial catches. In German Bal-tic coast, there are over 80 active cut-ters (“Fischkutter”), a lot of which are longer than 24 metres, that offer angling on a daily basis during most of the year for up to 50 anglers a day - a practice called “trolling” in commercial fisher-ies. These fisheries are almost entirely unregulated and catches are not includ-ed in quota amounts.
For the Baltic Sea’s depleted fish stocks to recover, Oceana calls for the imple-mentation of an ecosystem based fisher-ies management, taking into account the entire sensitive ecosystem, and the ap-
plication of the precautionary approach. Besides better management, which must also include the management of all fish species caught, more stringent monitoring, control and surveillance in all Baltic Sea countries is needed, and catch reporting and fisheries manage-ment must include recreational fisher-ies. The selectivity of fishing gear needs to be improved and destructive fishing like bottom trawls has to be changed to prevent detrimental effects on the sea bottom as well as by-catch and discards. Finally, marine protected areas should provide sanctuaries for fish, while also shielding ecosystems from the effects of destructive fishing practices. Oceana finds it unacceptable that damaging activities, like trawling and dredging, are still allowed inside many marine protected areas in the Baltic Sea.

Fisheries management in the Baltic Sea
5
1. Introduction: Fisheries in the Baltic Sea
Danish trawler Kingfisher, unloading cod and flounder in the port of Hel, Poland. March 2011. © OCEANA/ LX

6
1.1. Baltic fishing countries, species and fisheries management
Fisheries have always been an integral part of cultures for the people living around the Baltic Sea. Records show that fishing activities were conducted along the Baltic Sea coast since well before the Middle Ages. Some of the best documented long-term fisheries in Europe are those in the Sound and Bohuslän regions in the Western Baltic Sea and Skagerrak, all targeting herring (Clupea harengus)1, which was the most abundant and important species in the
Medieval era. At that time, herring was also considered to be the largest fishery in the whole of Europe. The environ-mental situation in the Baltic Sea has drastically changed in the 20th century with dramatically increased fish land-ings2,3 and increased pressure from hu-man activities4. After the Second World War rapid industrialisation had a major impact on fishing in the Baltic. Small fisheries-based communities gradually began to vanish and, because more and more advanced technologies were in-troduced, the numbers of fishing vessels and professional fishermen have been continually decreasing5.
!!̂
!!̂
!!̂
!!̂
!!̂
!!̂
!!̂
!!̂
!!̂
!!̂
!!̂
!!̂
!!̂
R U S S I A!!̂
!!̂
Kaliningrad
Saint Petersburg
Skagerrak
Great Belt
LittleBelt
KattegatWestern Gotland
Basin
The Sound
Kiel Bay
Bay of Mecklenburg
Southern Baltic Proper Gulf of Gdansk
Northern Baltic Proper
Eastern Gotland Basin
Gulf of Riga
Åland Sea
Archipelago Sea
Gulf of Finland
Bothnian Sea
The Quark
Bothnian Bay
N O R W A Y
R U S S I A
S W E D E N
D E N M A R K
P O L A N D
G E R M A N Y
B E L A R U S
E S T O N I A
F I N L A N D
L A T V I A
L I T H U A N I A
U K R A I N E
Oslo
Vilnius
Helsinki
Tallinn
Riga
Stockholm
Berlin
Copenhagen
Warsaw
Minsk
IIIaKattegat and
Skagerrak
24Baltic West
of Bornholm22
Belt Sea
23The
Sound
25SouthernCentral
Baltic, West
26Southern
Central Baltic,East
28-2East
of Gotland
28-1Gulf ofRiga
27West ofGotland
29Archipelago
Sea
32Gulf of Finland
30Bothnian
Sea
31Bothnian
Bay
Sources: ESRI, HELCOM and ICES.
0 130 26065Kilometers
Baltic Sea sub-basinsand ICES areas
ICES areas
EEZ limits
Sub-basins
Figure 1: Baltic Sea subdivisions of the International Council for the Exploration of the Sea (ICES)6 and Kattegat and Skagerrak (subdivision IIIa)7.

Fisheries management in the Baltic Sea
7
Today, the Baltic Sea is one of the most exploited and polluted seas in the world. High levels of nutrient inflow, mainly from agriculture, cause eutroph-ication and as a consequence massive algae blooms have become the largest problem with implications for the eco-systems and economies of the wider Baltic Sea region (Figure 1). Overfishing and contamination by hazardous sub-stances, as well as sand and gravel ex-traction and oil and gas exploitation, are further threats. In addition, the rise in
shipping, construction, pipelines, cables and offshore aquaculture places addi-tional pressure on the sea’s ecosystem8. Current commercial fishing practices have environmental impacts through-out the entire sea: several fish stocks are overfished, like cod in the Kattegat, herring and sprat, while others, like Baltic salmon, sea trout and eel have become threatened species. Fishing also affects mammals such as harbour porpoises, seals and sea birds which are accidentally caught as by-catch9.
Table 1. 2010 reported catches by country in the Baltic Sea (ICES 2011)10. For the Kattegat and Skagerrak see Table 2.
Species/countries (2010 reported catches in tonnes) Sweden Finland Poland Denmark Estonia Latvia Germany Russian
Fed. Lithuania Sum
European sprat (Sprattus sprattus) 79,985 24,601 59,276 48,181 47,861 45,852 17,753 25,647 10,223 359,379
Atlantic herring (Clupea harengus) 46,585 92,401 24,897 6,246 28,862 21,372 14,474 9,128 1,558 245,523
Atlantic cod (Gadus morhua) 11,546 1,028 12,155 17,616 796 5,160 8,158 4,252 3,200 63,911
European flounder (Platichthys flesus) 166 26 11,202 1,351 285 281 1,364 1,032 503 16,210
Blue mussel (Mytilus edulis) - - - 6,600 - - - - - 6,600
European perch (Perca fluviatilis) 74 742 838 18 911 38 239 338 1 3,199
European smelt (Osmerus eperlanus) - 497 - - 453 1,127 - 247 17 2,341
Roach (Rutilus rutilus) - 227 601 - 64 11 329 765 - 1,997
European plaice (Pleuronectes platessa) 101 3 38 1,448 - - 299 - - 1,889
Freshwater bream (Abramis brama) 3 741 590 - - 61 204 1,424 1 1,392
Vendace (Coregonus albula) 1,038 133 - - - - - 11 - 1,182
Pike-perch (Stizostedion lucioperca) 16 352 152 - 73 6 131 426 9 1,165
Common dab (Limanda limanda) 3 - - 544 - - 417 - - 964
European eel (Anguilla anguilla) 307 - 54 373 3 1 74 16 - 828
Whiting (Merlangius merlangus) 48 7 89 314 - - 295 - - 753
Atlantic salmon (Salmo salar) 300 215 48 130 4 4 8 1 1 711
Pollock (Pollachius pollachius) 0 647 - 0 - - - - - 647
Sandeels (=Sandlances) nei (Ammodytes spp.) - - 1 597 - - - - - 598
Sea trout (Salmo trutta) 25 54 372 8 12 5 12 - - 488
Other species 314 408 211 821 247 127 451 991 27 3,597
Total 140,511 122,082 110,524 84,247 79,571 74,045 44,208 44,278 15,540 713,374

8
In 2010, the total reported amount of all fish caught in the Baltic Sea was 713,374 tonnes. From the Kattegat and Skagerrak the catch in 2010 was 96,924 tonnes (Table 1, Table 2). Out of nine countries that have shore-lines along the Baltic Sea the largest fishing nations in terms of catches are Sweden (19.70%), Finland (17.11%) and Poland (15.50%). Additional unreported catches have been estimated up to 30% to 40% in some fisheries.11
The countries surrounding the Baltic Sea catch more than 50 different fish species in commercial fisheries,12 where the main target species, cod, herring and sprat, constitute about 93% of the total reported catch13 and provide the highest total income to fisher-men. Herring and sprat catches make up about 46% of total catches in the Kattegat and Skagerrak. Other fish species caught frequently are inter alia European flounder, perch, smelt, roach, sea trout, European plaice, common dab, brill (Scophthalmus rhombus), turbot (Psetta maxima) and European eel.
Edible crab in Kattegat, Denmark. May 2011. © OCEANA/ Carlos Minguell
Greater weever in Kattegat, Sweden. April 2011. © OCEANA

Fisheries management in the Baltic Sea
9
Further species that are commercially caught in the Baltic Sea and the Kattegat, as well as in the Skagerrak and North Sea, need to be properly managed, differentiated and evaluated. Among these, there are crustaceans like northern prawn (Pandalus borealis), Baltic shrimp (Palaemon adspersus), European lobster (Homarus gammarus), edible crab (Cancer pagurus), marine crab (Carcinus maenas), etc., molluscs like scallop (Pecten maximus), razor shells (Ensis spp.) and other fish species, like whiting (Merlangius merlangus), Greenland halibut (Reinhardtius hippoglossoides), witch flounder (Glyptocephalus cynoglossus), greater weaver (Trachinus draco), etc.
In 2012, total fish landings from Baltic Sea European Union (EU) countries had a total value of €219 million, measured by first sale income for fishermen. Swe-den has the largest income from fisher-ies in the Baltic Sea. While Denmark is only the fourth largest fishing nation in the Baltic in terms of tonnage, it has the second highest income from Baltic fish-eries. On the other hand, while Finland is the second largest nation in terms of catches in tonnes, it is only in 5th place in terms of income, indicating a rela-tively low income from Baltic fisheries (Table 3).
Flounder in the Northern Baltic Proper, Sweden. April 2011. © OCEANA/ Carlos Minguell
Table 2. 2010 reported catches by country in the Kattegat and Skagerrak (ICES 2011)14.
Species/countries (reported catches in tonnes) Denmark Sweden Norway Germany Other15 Sum
Atlantic herring (Clupea harengus) 7,610 20,138 3,282 146 1,078 32,254
European sprat (Sprattus sprattus) 10,195 1,420 914 308 308 13,145
Sandeels (Ammodytes spp.) 9,285 720 - - 0 10,005
European plaice (Pleuronectes platessa) 7,278 193 49 17 1,537 9,074
Saithe (Pollachius virens) 3,565 710 1,155 365 365 6,160
Northern prawn (Pandalus borealis) 1,125 1,508 2,598 - 0 5,231
Norway lobster (Nephrops norvegicus) 3,723 1,252 125 30 30 5,160
Atlantic cod (Gadus morhua) 3,400 497 433 56 82 4,468
Blue mussel (Mytilus edulis) 1,787 52 - - 0 1,839
Atlantic mackerel (Scomber scombrus) 52 274 1,236 - 0 1,562
Haddock (Melanogrammus aeglefinus) 1,139 126 94 65 66 1,490
Other 3,511 947 1,822 48 256 6,536
Sum 52,670 27,837 11,708 1,035 3,722 96,924

10
Baltic cod provides the highest income for fishermen all together, making up almost one-third in 2010. Herring and sprat come next, accounting for 22% each of the total turnover from catches.
However, sprat and herring have a low economic value, when compared to the tonnage of catches, because they are caught both for human consumption and animal food/fishmeal production.
Table 3. 2010 reported catches by country and income from fisheries from the Baltic Sea excluding the Kattegat16,17.
Country Catch (tonnes)
Catch (%)
Catch income (1000 €)
Catch income (%)
Sweden 140,511 21.00 48,902 22.28
Finland 122,082 18.25 24,583 11.20
Poland 110,524 16.52 39,957 18.20
Latvia 74,045 11.07 20,439 9.31
Estonia 79,571 11.89 12,915 5.88
Denmark 84,247 12.59 42,299 19.27
Germany 44,208 6.61 30,400 13.85
Total 669,096 100.00 219,495 100.00
32%
22%
22%
3%
2%
2%
2% 1%
1% 1%
1%
11%
Cod
Herring
Sprat
Flounder
Eel
Perch
Vendace
Pike-perch
Whitefish
Salmon
Sea trout
Other
Figure 2: Relative income from the Baltic Sea fisheries, excluding Kattegat in 2010 (STEFC 2011)18.

Fisheries management in the Baltic Sea
11
Of all species caught in the Baltic Sea, sole (€13.4 kg), Norway lobster (€8.2 kg), eel (€7.01 kg), brill (€5.70 kg), common prawn (€5.60 kg), sea trout (€4.85 kg), pike perch (€4.80 kg), salm-on (€4.18 kg) and European whitefish (€3.75 kg) fetch the highest prices. Sprat (€0.15 kg) and herring (€0.21 kg) pro-vide fishermen the lowest income per kg caught, while cod (€1.20 kg) is at the lower end of the scale19. Having a larger variety of carefully managed species for fisheries would make economic sense as other species than sprat and herring have much a higher value for consumers and therefore provide relatively higher income for fishermen (Figure 2).
Management of Baltic Sea fish stocks
Fisheries in the Baltic Sea, Skagerrak and Kattegat are managed by different regimes. As in other European seas, fisheries management falls within the jurisdiction of EU’s Common Fisheries Policy. Inside 12 nautical miles (nm), fisheries are managed mostly by coast-al EU Member States. But also outside the 12 nm, for the entire Exclusive Eco-nomic Zones, countries are able to set fisheries management measures for their own fleets, regardless of where those fleets are operating as long as those fisheries management measures are not less stringent than the CFP20. The European Habitats Directive21 foresees the establishment of a network of Marine Protected Areas, the marine Natura 2000 network, and management measures for those areas and species mentioned in the directive, as a way to secure the status of species and habi-tats of community interest on a long term basis. Protected species under the Habitats Directive include harbour porpoises, seals, and fish like salmon and eel. The European Marine Strat-egy Framework Directive22 constitutes the environmental pillar of the EU’s Integrated Maritime Policy, including fisheries, and requires good environ-mental status for European seas, one of the benchmarks being to get fish
stocks at Maximum Sustainable Yield (MSY) levels. MSY describes the largest yield, or catch, that can be taken from a stock over an indefinite period, while still maintaining population size at the point of maximum growth. Internation-al commitments like the Johannesburg declaration23 also require that EU fish stocks reach MSY by 2015. Currently, most of the Baltic fish stocks are over-fished beyond MSY24.
A number of commercially important fisheries in Europe are managed with catch limits, known as Total Allow-able Catches (TACs), which are later divided into fishing quotas by coun-tries. While more than 50 different spe-cies of fish are commercially caught in the Baltic Sea, in 2011, the European Commission proposed Baltic TACs for only five of them. TAC proposals are based on scientific advice, which takes into consideration many factors, including the state of the stock, previ-ous years’ recruitment estimates, etc. Advice is given annually by the In-ternational Council for the Explora-tion of the Seas (ICES) and reviewed by the EU Scientific, Technical and Economic Committee for Fisheries (STECF). On the basis of this advice, TACs are proposed by the European Commission and decided upon by the Agriculture and Fisheries Coun-cil of the European Union, which con-sists of Fisheries Ministers from all EU Member States. The main prob-lem during this process is that minis-ters have traditionally ignored much of the scientific advice, setting TACs that were much higher than pro-posed, resulting in heavily overfished stocks. In 2011 for example, the TAC for Baltic salmon was set more than twice as high as the scientific advice for the Baltic Sea and 50% higher than advice for the Gulf of Finland, while the TAC for Baltic plaice was set 30% higher than the advice.
Unloading cod and flatfish from a trawler in the port of Tejn, Bornholm, Denmark. March 2011. © OCEANA/ LX

12
Table 4 gives an overview on Baltic fish stocks and the status of their stocks. According to ICES advice for 2012, the western Baltic cod stock is over-fished in relation to MSY and the aver-age recruitment has been much lower than historically recorded levels. This is noteworthy because cod fishery is highly dependent on recruiting year classes, and while the eastern Baltic stock has shown some recovery. The status of the sprat stock in the Kattegat
(and Skagerrak) is not known and catches should therefore be reduced. In the Baltic Sea (sub-divisions 22-32) the stock is fished above MSY. Her-ring stocks in all ICES subdivisions are fished unsustainably above MSY, except in the Gulf of Riga, the Bothnian Sea and the Bothnian Bay. In the Bothnian Sea, the status of the stock is good whereas in the Bothnian Bay, the herring status is unknown.
Table 4. ICES advice and fishing quotas for 2012 in the Baltic Sea, the Kattegat and the Skagerrak. Red colour indicates Council agreements where scientific advice was not followed. (ICES; Council of the European Union, October 2011; HELCOM 2007)25,26,27.
StockICES Advice
2012aEC Proposal
2012
Council Agreement
2012Status of the stock Total reported
catches 2010
Tonnes Tonnes Tonnes ICES 2011 HELCOM 2007 Tonnes
Herring Gulf of Bothnia
104,000 106,000 106,000 Bothnian Bay: Unknown Bothnian Sea: Fished appropriately in relation to MSY
277,631
Herring Western Baltic and Kattegat/Skagerrak spring spawning herring
42,700 20,900 20,900 Fished above MSY
Herring Eastern Baltic except Gulf of Bothnia
92,000 72,178 78,417 Fished above MSY, fished unsustainably in relation to the precautionary approach
Herring Gulf of Riga
25,500 28,878 30,576
Cod Eastern Baltic
74,200 67,850 67,850 Fished appropriately in relation to MSY, fished sustainably in relation to the precautionary approach
Threatened/declining
68,323
Cod Western Baltic
21,300 21,300 21,300 Fished above MSY Threatened/declining
Cod Kattegat
No fishing 0 0 Unknown Threatened/declining
Plaice Baltic Sea
Catches should not increase
2,281 2,889 Unknown 10,946
Salmonb Baltic Sea except Gulf of Finland
54,000 52,904 122,553 Among the 27 assessed rivers, 13 are unlikely to reach 50% survival rate of young salmons and for 6 rivers, the situation is uncertain
Threatened/declining
712
Salmonb Gulf of Finland
No fishing 10,884 15,419
Sprat Baltic Sea 242,000 213,110 225,237 Fished above MSY, harvested unsustainably in relation to the precautionary approach
359,379
a_Including the Russian quotas b_TAC is given in number of individuals, not in tonnes
Fisheries management in the Baltic Sea
13
1.2. The Baltic fishing fleet
Growing demand for fish and fish products and the availability of fish-ing subsidies, combined with increas-ing resource depletion in the Baltic as in all EU waters, has promoted the expansion of European fishing fleets in both size and range over the last few decades. Today, the EU fleet is esti-mated to be two to three times greater than what sustainable fisheries limits would allow28.
Fishing subsidies, defined as direct or indirect financial transfers of funds from public entities that help make the fishing sector more profitable than it would be without additional fund-ing, can create incentives to fish more, even when catches are declining29. This type of funding results in overfish-ing, fleet overcapitalization, reduced economic efficiency and failure to re-alize the potential economic benefits from the resource30. Fleet overcapacity affects fisheries management in many ways: it leads to political demands to prevent the establishment of TAC’s, disregard scientific advice on the re-duction of catch limits, supports IUU fishing and reduces the profitability of operators. Excessive fishing activi-ties also damage the marine environ-
ment, particularly through overfishing, destructive impact on the seafloor and increased catches of non-target and protected species31.
Overcapacity has been the largest prob-lem with the EU fishing fleet for dec-ades, leading to TACs that have been set too high and massive overfishing. The Baltic Sea is no exception to this problem. The largest fleets among the Baltic EU Member States, in terms of to-tal power, measured in kilowatts (kW), belong to Denmark (ca. 233,000 kW), Sweden (ca. 174,000 kW), Finland (ca. 170,000 kW) and Germany (ca. 157,000 kW) (Figure 3). In terms of tonnage Germany, Denmark and Lithuania have the largest capacity, while Finland has the most vessels (3,325 total registered in 2012), followed by Denmark and Germany32.
Furthermore, overfishing and the avail-ability of subsidies for the cessation of fishing activities have led to high numbers of fishing boats in the Baltic Sea countries, reported as “inactive”. Finland declares more than 50% of its vessels to be “inactive”, while Denmark reports about 40%33. Figure 3 shows the discrepancies between total regis-tered engine power and active vessels engine power of Baltic Sea countries.
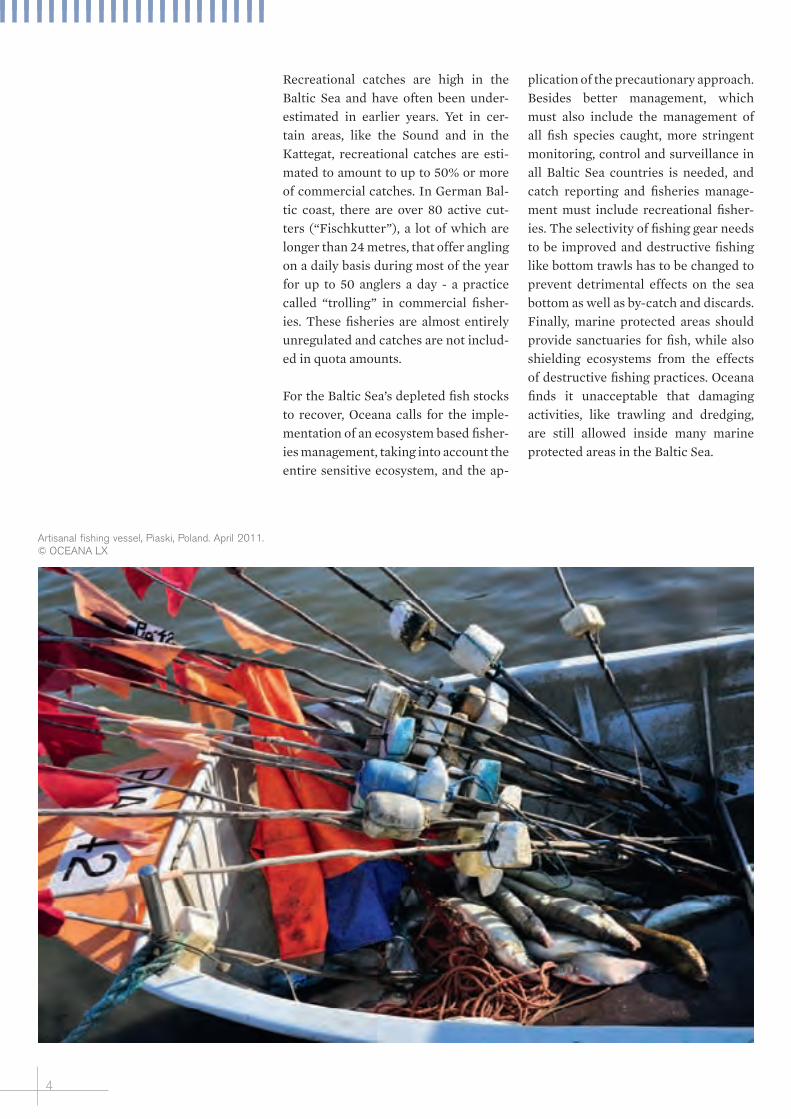
Former German trawler Seeschwalbe, retired as War‑101 from EU fleet register in 1991, re‑entered EU fleet register as Hel 125 in 2004 and trawlers in the port of Hel, Poland. March 2011. © OCEANA/ LX

14
Thousand kilowatts
0
50
100
150
200
250
Denmark Germany Estonia Latvia Lithuania Poland Finland Sweden
Active fleet engine power Total engine power
Figure 3: Fishing fleet engine power by Baltic Sea country (Eurostat 2011)34.
Fishing vessels in the port of Ustka, Poland. March 2011. © OCEANA/ LX
Estonian midwater trawler Kotkas in the port of Tallinn, Estonia. May 2011. © OCEANA/ Carlos Suárez
Swedish bottom trawler Ingun, constructed in the year 2000 with more than half a million Euro EU fishing subsidies, sailing in Kattegat, Sweden. May 2011. © OCEANA/ Carlos Minguell

Fisheries management in the Baltic Sea
15
Artisanal fisheries in the Baltic Sea
Small-scale, artisanal fishing vessels35 represent over 83% (~70,000 vessels) of the total fleet in the EU, and are defined as vessels shorter than 12m without towed fishing gear. Support-ing the artisanal fishing fleet segment is an important and widespread objec-tive in many EU Member States, due to the economic benefits and employ-ment opportunities that such fleets provide. Artisanal fisheries produce around €2,1 billion worth of landed fish which accounts for 27% of the val-ue of all fish catches in the entire EU. On average some 90,000 fishermen are employed in this sector compared to about 78,000 employed on board vessels over 12 metres long. At the same time, this segment only accounts for about 10% of the total gross ton-nage of the European fleet and about 35% of its engine power36.
In general, artisanal fleets operate in a more environmentally friendly way, using no bottom trawls, mostly pas-sive gears and producing little or no discards. Artisanal fisheries have other
advantages as well. For example, almost no catch taken by the artisanal fisheries end up as fishmeal or fish oil to feed fish farms, whereas most of the fish caught in large-scale fisheries in the Baltic are used for industrial purposes. On top of that artisanal fisheries provide gener-ally higher quality, fresh products, gen-erate less by-catch and employ more fishermen in relation to the biomass of landed fish37.
Vessels in the port of Władysławowo, Poland. April 2011. © OCEANA/ LX
Artisanal fshing vessels on thebeach of Kąty Rybackie, Poland. April 2011. © OCEANA/ LX

16
When it comes to CO2 emissions, arti-sanal fleets have a much smaller carbon footprint than large fleets. Small-scale fishing vessels use one tonne of fuel to produce four to eight (in the best case scenario) tonnes of fish38. This means that using the same amount of fuel, small-scale fisheries produce up to four times as much fish as industrial fisheries. Therefore, a solution for re-ducing fishing mortality in depleted resources, while maintaining most social benefits, is to phase out large-scale fisheries in favour of the arti-sanal model. However, artisanal fish-ing fleets can also pose problems to the ecosystem, they need to be man-aged and controlled carefully, catches have to be reported correctly and also passive nets have to be operated in a way that by-catch is minimized.
Of the 6,841 total active fishing vessels in the Baltic Sea, only 15% are larger than 12 metres. The remaining 85%, made up of vessels smaller than 12 me-
tres, is only responsible for 9% of the total catch in tonnes in the Baltic Sea. Finland, which has the most active fishing vessels, has few that are over 12 metres and no active bottom trawl-ers larger than 12 metres. Sweden, the country with most fish catches in the Baltic Sea has the second most ves-sels in total, and 22% of its vessels are larger than 12 metres.
The significance of the few larger vessels in the Baltic Sea becomes clear, when the catches per length class are further analysed. Vessels between 12 and 24 metres long bring in 20% of the reported Baltic catch, while vessels larger than 24 metres are responsible for 71% of the total catch. To illustrate these figures: 35 Swedish mid-water trawlers larger than 24 metres catch twice as much fish as the reported catch of the entire Baltic fishing fleet small-er than 12 metres39. Table 5 describes the fishing fleets in the Baltic Sea and the Kattegat.
Table 5. Catches by Baltic Sea country, gears and length classes in 2010 (STECF 2011)40.
Country, % of total catch/vessel gear and length
classes (number of fishing vessels)
Artisanal, passive/
active gear
(0‑12m)
Bottom trawlers (0‑12m)
Passive and
active gears
(12‑24m)
Drift‑/fixed gillnetters (12‑24m)
Mid‑water trawlers (12‑24m)
Bottom trawlers (12‑24m)
Mid‑water trawlers (24+m)
Gillnetters (24+m)
Bottom trawlers (24+m)
Total vessels larger 12 m
Total fishing vessels
Poland 576 86 56 93 3 25 263 839
Sweden 825 64 27 162 35 32 256 1,145
Denmark 613 11 61 131 0 192 816
Latvia 736 30 66 26 122 858
Finland 1,486 0 18 33 16 0 67 1,553
Estonia 878 24 40 64 942
Germany 960 7 8 1 36 2 3 6 56 1,023
Lithuania 78 13 8 16 37 115
Total 6,152 82 61 152 122 452 178 29 63 1,057 6,841
% of the total catch 9% 20% 71%
Artisinal fishing vessel at the beach of Gdynia, Poland. August 2007. © OCEANA/ LX

Fisheries management in the Baltic Sea
17
Artisanal fishing vessels on the beach of Kąty Rybackie, Poland. April 2011. © OCEANA/ LX
Artisanal fishing vessels on the beach of Chlopy, Poland. April 2011. © OCEANA/ LX

18
2. The biggest problems
Polish trawler with sprats onboard a vessel in Kołobrzeg, Poland. April 2011. © OCEANA/ LX

Fisheries management in the Baltic Sea
19
2.1. Overfishing, destructive and problematic fishing methods
Total annual catches in the Baltic Sea currently stand at 713,000 tonnes. During the past half century Baltic fisheries have seen an enormous shift from a sustainable and artisanal fishing practices to an international industry, relying on large industrial fishing ves-sels, fish location technology, on-board treatment and storage, that is much more detrimental to the environment. Large scale fisheries in the open Baltic Sea mainly target cod, herring, sprat, plaice, flounder, mussels, salmon and sea trout. Coastal fisheries, on the other hand, target species such as European whitefish (Coregonus lavaretus), north-ern pike (Esox lucius) and pike-perch.
Besides removing target species, fishing also affects the structure of the food-web by removing large predatory species like cod and salmon, which play an impor-tant role in regulating the lower trophic levels. Several recent analyses have shown that overexploitation has con-tributed to ecosystem regime shifts in the Baltic Sea (see Box 1), and even enhanced eutrophication41. Fisheries account for large scale pressures in the Baltic Sea (Figure 4). Bottom trawling and the by-catch of marine mammals and seabirds in bottom-set gillnets are obstacles facing the Baltic Sea, as indi-cated by a recent project42 on environ-mentally sound fisheries practices.
Ecosystem changes in the Baltic Sea
The Baltic Sea ecosystem has undergone prominent structural changes and regimes shifts over the last three decades caused by the combination of different stressors, like fisheries, eutrophication and climate change43. These changes have altered the functioning and the composition of the zooplankton and fish communities throughout the Baltic Sea. This has raised concerns of weakened ecosystem services of the Baltic Sea, like the production of fish for human con-sumption. Observed changes include for instance the decline of weight of herring since the late 1980s and the decline of cod, the main top predator44,45. At the same time sprat and warm water copepods (Acartia spp.) have increased46 due to climatic changes and overfishing of cod. For the Baltic Sea herring, the decline in weight may be associated with a lower stock productivity since smaller females potentially lay fewer eggs and eggs of leaner females have lower hatchability47.
It is assumed that the prime factor in the decline of cod is probably related to climatic variation, from a decline in the frequency of oxygenated and salty water inflow from the Northeast Atlantic since the 1980s48, which is a prerequisite for the successful spawning of cod49. Unfavorable salinity conditions for cod spawning and the lack of key zooplankton species (e.g. Pseudocalanus acuspes) for cod larvae have further affected the recruitment failure of cod50. Historically cod has spawned at three known locations in the Baltic Sea: the Bornholm Deep, the Gdansk Deep and the Gotland Deep51. At present, favorable conditions for the spawning and production of viable larvae have only remained in the Born-holm Deep52. It is also anticipated that the large sprat stock has exerted high predation pressure on cod eggs53,54, further worsening the status of the cod stock.
However, recently the eastern Baltic cod stock has recovered after more than two decades of low biomass and pro-ductivity. Environmental conditions have not changed significantly but there has been a reduction in mortality caused by fishing, implying that this increase in stock is driven by a decrease in fishing pressure55.
Northern pike in the port of Dziwnów, Poland. April 2011. © OCEANA/ LX

20
Fishing causes the unintentional by-catch of non-target species such as benthic invertebrates, other fish species, undersized target species, seabirds, and marine mammals. Bottom trawling and dredging are the fishing methods with the largest by-catch of non-target fish species, some of which are threatened and/or declining57.
Dredging of blue mussels in Danish waters
Blue mussel (M. edulis) fishing is car-ried out in several areas in Danish wa-ters: the Limfjord, along the east coast of Jutland in the Kattegat, the Belt Sea, and in the Wadden Sea58. Most of the blue mussels are dredged, which is a highly controversial fishing tech-
!!̂
!!̂
!!̂
!!̂
!!̂
!!̂
!!̂
!!̂
!!̂
!!̂
!!̂
!!̂
!!̂
R U S S I A!!̂
!!̂
Kaliningrad
Saint Petersburg
Minsk
WarsawBerlin
Stockholm
Copenhagen
Riga
OsloTallinn
Vilnius
Helsinki
S W E D E N
F I N L A N D
P O L A N D
R U S S I A
N O R W A Y
G E R M A N Y
B E L A R U S
L A T V I A
L I T H U A N I A
E S T O N I A
U K R A I N E
D E N M A R K
Sources: ESRI, HELCOM.
0 130 26065Kilometers
Pressures in the Baltic Sea
30
Fishing and hunting of seals
Inputs of nutrients (P, N)
Inputs of metals (Cd, Hg, Pb, Ni, Pb, Zi)
Riverine input of organic matter
Bathymetry (m)
25 50 100
150
250
400
584
ArkonaBasin
BornholmBasin
Kiel andMecklenburg Bay
Gulf of Gdansk
Åland andArchipelago Sea
Western GotlandBasin
Gulf of Riga
Northern BalticProper
Eastern GotlandBasin
Bothnian Bay
Kattegat
Bothnian Sea
Gulf of Finland
Figure 4: Area-specific pressures and their potential impacts on the ecosystem for each sub-basin according to the HELCOM Baltic Sea Impact Index. Fisheries (and the hunting of seals) related impacts are the major pressure in five out of the 13 sub-basins and the second largest pressure in three other sub-basins. The potential impacts and their magnitudes are comparable across basins. For more information on the HELCOM Baltic Sea Impact Index and the categories used in the map, see HELCOM 201056.
Polish vessel Zag 31 unloading sprats in the port of Hel, Poland. March 2011. © OCEANA/ LX

Fisheries management in the Baltic Sea
21
nique as it destroys the sea bottom. The Limfjord is the area with the high-est activity of blue mussel fishing, rep-resenting between 50-90% of the total blue mussel fishing in Denmark59.
In 2010, Danish dredging vessels landed 1,700 tonnes of blue mussels from the Kattegat and Skagerrak and 7,000 tonnes from the Belt Sea. German dredgers landed 314 tonnes from the Belt Sea. Dredgers, like bottom trawl-ers use fishing gears with heavy weights that are dragged over the seafloor, changing physical structures and af-fecting surroundings60. The removal of blue mussels and shells can reduce the macro algae distribution, as macro algae depend on hard substrate, such as the shells, for adherence. Other organisms that can be affected by mussel dredg-ing are benthic fauna, eelgrass, and birds foraging on blue mussels, such as the common goldeneye (Bucephala
clangula). For benthic communities, it takes years to recover from dredging, and in some cases, for instance with eelgrass, it can take up to 20 years to recover. Mussel dredging is also tak-ing place inside Natura 2000 sites61. Indeed, in 2010 about one third of the mussel dredging in the Limfjord was carried out inside these protected ar-eas.
In the autumn of 2011, the Danish Ministry for Food, Agriculture and Fisheries granted permission to contin-ue mussel dredging inside Natura 2000 sites. but the EU Commission is now preparing judicial proceedings in front of the European Court of Justice against Denmark as the environmental protec-tion needs in Natura 2000 areas are not sufficiently taken into account. Licenc-es for mussel dredging in Natura 2000 areas in the Baltic Sea, like in the little Belt, have to be postponed62.
Lithuanian bottom trawler LBB ‑ 1100 in the port of Liepaja, Latvia. May 2011. © OCEANA/ LX

22
Commercial bottom‑trawling fishery
Bottom trawling is the most wide-spread destructive fishing method in the Baltic Sea and Kattegat. It physi-cally disturbs the seafloor and results in high levels of by-catch. Bottom trawl-ing is mainly practiced in the southern Baltic Sea, but also to a minor extent in the Bothnian Bay where vendace and herring are targeted (Figure 5). In the southern sea areas, bottom trawl-ing targets many species of fish (cod, sprat, herring and flounder being the most common), prawns and lobsters.
Fishing of crustaceans and mussels is limited to the Kattegat, the Limfjord and the Belt Sea63.
Bottom trawling creates aisles of de-struction that are several hundred metres long, trailing wide sediment clouds64 and changing the physical and biological characteristics of the seabed65. The scale of impact depends on the intensity of the trawling. In in-tense bottom trawling areas, like in the Kattegat, this practice has degraded the state of the seabed.
!!̂
!!̂
!!̂
!!̂
!!̂
!!̂
!!̂
!!̂
!!̂
!!̂
!!̂
!!̂
!!̂
R U S S I A!!̂
!!̂
Kaliningrad
Saint Petersburg
Minsk
WarsawBerlin
Stockholm
Copenhagen
Riga
OsloTallinn
Vilnius
Helsinki
S W E D E N
F I N L A N D
P O L A N D
R U S S I A
N O R W A Y
G E R M A N Y
B E L A R U S
L A T V I A
L I T H U A N I A
E S T O N I A
U K R A I N E
D E N M A R K
Sources: ESRI, HELCOM.
0 130 26065Kilometers
Bottom trawlingCatches/landings (tonnes)
0,0 - 112,0
112,1 - 508,9
509,0 - 1324,0
1324,1 - 3124,9
3125,0 - 5142,4
Figure 5: Bottom trawling caches/landings (in tonnes) in the Baltic Sea. Data sources: national fisheries authorities/HELCOM66.
Bottom trawling marks in Kattegat, Denmark. May 2011. © OCEANA

Fisheries management in the Baltic Sea
23
Bottom trawling for Norway lobster and Northern prawn in the Kattegat and Skagerrak
The Norway lobster (Nephrops norvegicus) fishery is one of the most economically important fisheries in Denmark. Both Denmark and Sweden have Nephrops directed fisheries in the Kattegat. In 2010, Denmark accounted for about 80% of total landings in the Kattegat, while Sweden took 19%67.
In the Kattegat and Skagerrak in 2010, Nephrops catches accounted for 53% and 25% respectively of the total value of fish and shellfish landed by Danish fishermen while cod landing accounted for 2% and 17% respective-ly. In the past 15 years, landings from the Kattegat and Skagerrak have var-ied between 3,700 tonnes and over 5,000 tonnes68.
Nephrops are fished with heavy weight-ed bottom trawls that are dragged over the seafloor, badly disturbing it. By-catch and discard rates are high in this type of fishery reaching up to 50% (by-catch) and, according to a study69, can comprise up to 24 different species. Despite the fact that ICES ad-vice recommends a zero TAC for cod in the Kattegat, the by-catch rate for this species is high in the Nephrops fishery.
Pandalus borealis, the Northern prawn, is fished by bottom trawls in the Kattegat and Skagerrak at 150-400 me-tres depth throughout the year by Dan-ish, Norwegian and Swedish fleets70,71. Total landings varied between 8,000 and 15,000 tonnes between 1985-2009, dropping to 5000 tonnes in 2010. Discarding is also a problem with the Pandalus fishery. Small and medium size prawns are discarded, mainly due to high grading72. There is also a by-catch of several valuable fish spe-cies, e.g. cod, flounder and anglerfish (Lophius piscatorius), Norway pout (Trisopterus esmarkii) and blue whiting (Micromesistius poutassou)73.
The Pandalus fishery is managed by TACs, but the state of the stock is un-known. Landing per unit effort (lpue) indices have declined from 2008 on-ward. Also, survey biomass indices have declined since 2007 and the recruit-ment index is low74. Based on precau-tionary considerations, ICES is advis-ing to reduce catches and also stresses that measures addressing discarding should be implemented75.
Beam trawling in the Western Baltic Sea and the Kattegat/Skagerrak
Beam trawling is a destructive fish-ing technique in which a net is held open by a steel beam. Usually a vessel tows two of these nets over the sea-floor. The nets are typically fitted with heavy chains which scrape the bottom and destroy marine life on the seafloor. In 2010, German beam trawlers oper-ated in the Western Baltic Sea, catching 123 tonnes of fish, of which 70% was cod. Dutch beam trawlers operated in the Kattegat and Skagerrak, catching 1,200 tons of fish, of which 80% was plaice and dab76.
Blue mussel with bryozoans in Kalmarsund, Western Gotland Basin, Sweden. April 2011. © OCEANA/ Carlos Minguell

24
Pelagic mid‑water trawling
Mid-water trawling causes, mainly due to very small meshed nets, pres-sure on target fish species and leads to the catch of undersized fish and non-target species77. Mid-water trawl-ers from Poland and Latvia catch by far the most fish with this gear type in the
Baltic Sea. The largest catches with this type of gear come from the Arkona and Bornholm Basins, Eastern Baltic Proper and from the Bothnian Sea and are com-prised mainly of sprat and herring, the “target species”, as well as of cod, and plaice78 (Figure 6).
!!̂
!!̂
!!̂
!!̂
!!̂
!!̂
!!̂
!!̂
!!̂
!!̂
!!̂
!!̂
!!̂
R U S S I A!!̂
!!̂
Kaliningrad
Saint Petersburg
Minsk
WarsawBerlin
Stockholm
Copenhagen
Riga
OsloTallinn
Vilnius
Helsinki
S W E D E N
F I N L A N D
P O L A N D
R U S S I A
N O R W A Y
G E R M A N Y
B E L A R U S
L A T V I A
L I T H U A N I A
E S T O N I A
U K R A I N E
D E N M A R K
Sources: ESRI, HELCOM.
0 130 26065Kilometers
Surface and midwater trawlingCatches/landings (tonnes)
0 - 1780
1780 - 5500
5500 - 11087
11087 - 19383
19383 - 36417
Figure 6: Catches/landings (in tonnes) from surface and mid-water trawling in the Baltic Sea. Data sources: national fisheries authorities/HELCOM79.
Blue mussel bed, Arkona Basin, Denmark. June 2011. © OCEANA

Fisheries management in the Baltic Sea
25
Discards and by‑catch in the Baltic Sea
Discards and by-catch, caused by the use of non-selective fishing gear, are two closely related problems. By-catch is the portion of the catch that is not comprised of the fishery’s target species and discards are the portion that is thrown back into the sea for several reasons.
Discards and by-catch are a serious problem in the Baltic Sea, particularly in dredging and bottom trawling fisheries for cod, Nephrops and Pandalus80. Sometimes the discarded catch are commercially valuable, but less so than a later catch by the same vessel. This is known as high grading, when part of the catch is classified and discarded in order to conserve only the most valuable catch. High grading has been prohibited in all Baltic fisheries, since 1st January 2010, yet the ban contains loopholes. The by-catch of marine mammals and sea birds in the Baltic Sea is problematic81 and the by-catch of non-target fisheries, particularly cod is high in certain gear types.
Cod discards and by‑catch in the Kattegat
Discards of cod in the Kattegat are extremely high and are currently estimated at a similar level to reported landings. In numbers, 90% of individuals of cod caught in the Kattegat is estimated to be discarded82.
Cod discards and by‑catch in the Western Baltic Sea
ICES estimated that 1,400 tonnes of cod was discarded in 2010 - some 22% of the total cod catch in number of indi-viduals, as estimated by ICES83 - most of which came from trawlers. The most common age groups discarded are age groups 2, 3 and 4. There were also indications that high grading was occurring.
Cod discards and by‑catch in the Eastern Baltic Sea
ICES has estimated that, in 2010 a total of 15% of the eastern cod catch in numbers of individuals was discarded. It is also be-lieved that discards made in connection with unallocated land-ings consist mostly of high-grading. The discards were mainly of juvenile cod84.
Discards and by‑catch of sprat and herring
Discards and by-catch of sprat and herring are generally low be-cause catches of non-target fish/undersized fish are used for fish meal and feeding animal farms. In fact, in the Baltic Sea, almost all of the sprat and much of the herring catches are used for fish-meal. Large mid-water trawlers, which make most of the catches, use extremely small mesh sizes. As all kinds of fish can be used in fishmeal factories, by-catch of undersized fish and non-target fish is not discarded but also processed. Some by-catch and discards of young sprat take place in the central Baltic Sea, but the amount of discarding of these age-groups is unknown85. In the mid-water trawl fishery for herring and sprat, the separation of herring and sprat catches is imprecise and there is a lack of discard data. In the Bothnian Sea and Bothnian Bay there are small amounts of sprat by-catch in the herring fishery, and also mixed landings of herring and sprat86 ,87,88. The by-catch of sprat and juvenile cod in herring fisheries is unknown for the Eastern Baltic Sea89. In the Gulf of Riga the by-catch of sprat is low, and by-catch of other species is insignificant90.
Dead flounder, Åland Islands, Finland. May 2011. © OCEANA/ Carlos Suárez

26
Discards and by‑catch of flatfish
Flatfish are often caught as by-catch in cod trawl fisheries. For the common sole (Solea solea) the available discard data is incomplete, but evidence from Sweden shows that the amount of flatfish discarded in bottom trawling for cod is high. Data on plaice fisheries in the Baltic Sea is poor, but by-catch occurs91. Turbot and brill are caught mainly as a by-catch of trawl and gillnet fisheries92,93. Dab is taken as by-catch in cod fisheries, but there is also targeted fishing of dab in the Sound94.
By‑catch of sea trout
Sea trout is caught in fisheries targeting whitefish, pike-perch and perch in the Gulf of Bothnia and the Gulf of Finland. Sea trout migrating offshore are largely caught in offshore salmon fishery. As no TAC exists for sea trout, national regula-tions can limit the amount of sea trout catch. Sweden has for example banned gillnet fishing in the Bothnian Bay during the spring and fall in waters with depth less than 3 metres for the sake of sea trout95.
By‑catch of harbour porpoises
Harbour porpoises were once abundant in the entire Baltic Sea, but the population has steadily decreased. Hunting for harbour porpoises started at the end of the 19th century, and in the last decades, by-catch in fishing gear and pollution, among other factors, have been responsible for this decline96. The population of Baltic Sea harbour porpoise is estimated to have stood at an average of 800 total individuals between 2002 and 200897. They are red listed as “critically endan-gered” by the IUCN98 and are threatened with extinction in the near future according to ASCOBANS99. The amount of by-catch of harbour porpoises in the Baltic is estimated at between 3.9% and 15.2% of the total population100 - a per-centage range that far surpasses the 1%-1.7% limit at which ASCOBANS and the International Whaling Commission deem by-catch levels to be “unacceptable interaction”101. The ASCOBANS Recovery Plan for Baltic Harbour Porpoises (Jastarnia plan) deems that a maximum of two by-caught individuals in the Eastern Baltic Sea is acceptable102.
Dead common eider, Åland Islands, Finland. May 2011. © OCEANA/ Carlos Suárez
Fisheries management in the Baltic Sea
27
In Poland, the by-catch of harbour porpoises has been documented mainly in semi-driftnets and cod bottom gillnets. In 2009, two harbour porpoises were reported as by-catch and two as strandings in Polish waters103. In Germany a high number of harbour porpoise by-catch is documented every year. Recent German studies showed that between 2000 and 2009, the number of harbour porpoises found dead in the German Baltic coast increased from 25 to 152 individuals a year - of which 47% to 87% were caught in fishing nets.
Several measures have been taken in the past few years to improve the situation, including the obligation to use “pingers”, acoustic devices that attempt to direct harbour porpoises away from the net, for gillnets in certain fisheries104. The marine station in Hel, together with the University of Gdansk is testing a system to protect whole fishing areas with acoustic barriers in the Puck bay. Germany has carried out a number of studies to replace fishing nets with gears that have no by-catch problems105.
By‑catch of birds
The Baltic Sea is a popular area for wintering diving water birds and many of their populations have declined over the last few decades. Of the 20-species of water birds covered by the report mentioned above, 11 have seen their total population size decreased, seven of which have seen a serious decline by more than 30% over 16 years. The estimated total number of wintering water birds between 2007 and 2009 was 4,41 million, compared to 7,44 million between 1992 and 1993 - a 41% reduction. A range of causes behind these declines has been suggested, including climate change, eutrophication, oil pollution and incidental by-catch106, the latter of which is not considered to be the main threat. Coastal gillnet fisheries carried out in low depths are thought to be responsible for the most by-catch of birds in fishing gears. It is estimated that at least 76.000 birds are caught as by-catch in the Baltic Sea annually107.
Lost nets
Lost nets are a problem in the Baltic Sea, as they continue fishing after being lost or abandoned, in particular from the gillnet fishery, but also from fisheries that use entangling and trammel nets. Tonnes of fish are caught in lost nets every year. The amount of lost nets, so called “ghost nets” in the Baltic Sea is estimated to be several thousand. They continue to catch fish they also pose a threat to reefs and bubbling reefs, as the nets can get caught into the reef, and therefore can be a physical blockage for animals and plants108.
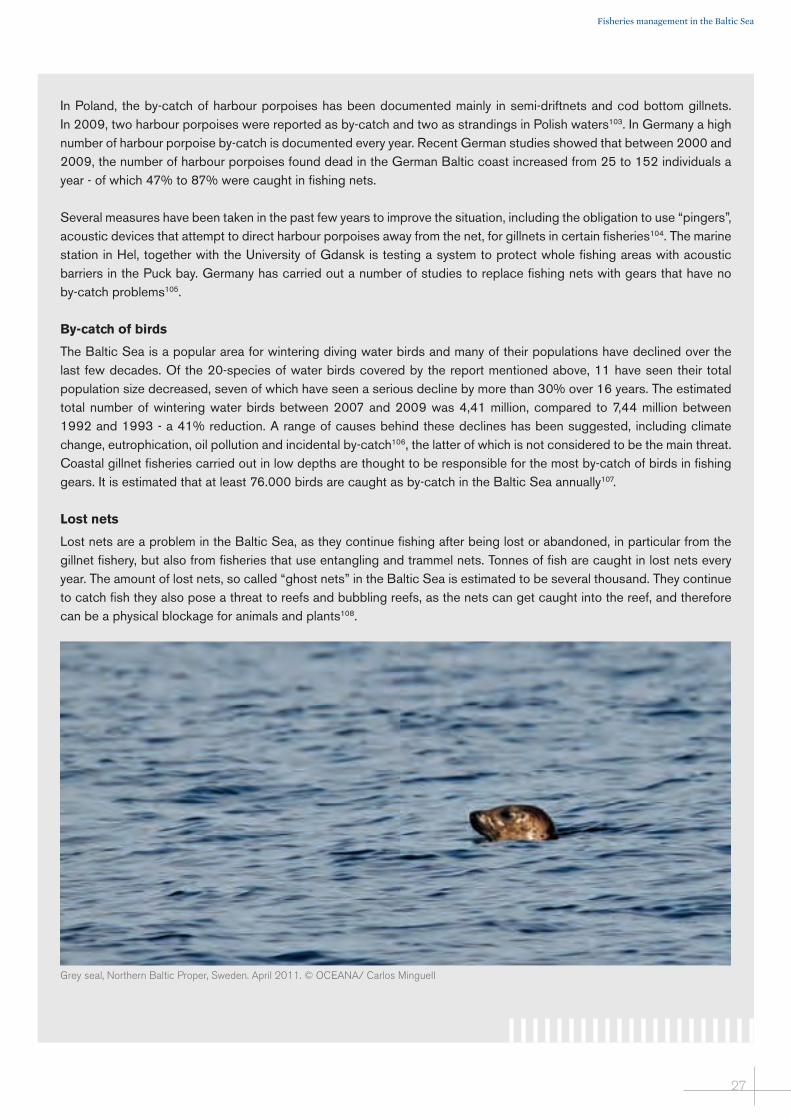
Grey seal, Northern Baltic Proper, Sweden. April 2011. © OCEANA/ Carlos Minguell

28
2.2. Unmanaged fisheries
In 2010, more than 50 different species of fish, totaling more than 800,000 tonnes, were caught in the Baltic Sea and the Kattegat. The European Commission however, has proposed a TAC for only five species in the Baltic, ignoring their own com-mitment to propose 25% precaution-ary reductions for stocks where data is lacking for scientific assessments, as is the case for most Baltic fish stocks109. Baltic TACs are set only for herring, sprat, cod, salmon and plaice, and only cod is subject to a multi annual fisheries management plan, while eel has to be managed by national eel man-agement plans. Not included are spe-cies like sea trout, brill, dab, flounder and turbot, even though in 2012 ICES advised immediate fishing restrictions
for sea trout, reducing the catches of flounder and turbot and not to increase catches for dab and brill.
Locally, in some countries or regions, a number of fisheries management measures like minimum landing sizes or fishing gear restrictions exist for some species, however a Baltic Sea-wide consistent fisheries management for those species is lacking. Countries are supposed to manage those fisheries that take place within 12 nautical miles of the shoreline through national legislation.
Table 6 gives an overview of the stock statuses and the ICES advice for fish species that are not managed with TACs in the Baltic Sea.
Baltic flounder, unloaded from a gillnetter in the port of Ustka, Poland, March 2011. © OCEANA/ LX

Fisheries management in the Baltic Sea
29
Flatfish
Of all Baltic flatfish, only the plaice stock has a TAC in the Baltic Sea. The plaice stock is at a low level and higher recruitment could not be observed112. Distribution of plaice is formed by salinity gradient and extends in the Baltic Sea eastwards to the Gulf of Gdansk and northwards to the Gotland area. The species is found only sporadi-cally further north.
There are several distinct flounder stocks and migration between them is limited113.
Table 6. Catches, ICES status of the stock and HELCOM status of unmanaged fisheries in the Baltic Sea110,111.
SpeciesTotal reported catches 2010 (tonnes) in the
Baltic Sea
Total reported catches 2010 (tonnes)
in Kattegat and Skagerrak
Status of the stock/Advice 2012 (ICES) HELCOM status 2007 TAC 2012
Flounder 16,210 205 Unknown/Advice: Catches should be reduced None
Turbot 356 95 Unknown/Catches should be reduced None
Sea trout 488 - Immediate fishing restrictions needed in all subdivisions
Threatened (VU=vulnerable) None
Dab 964 589 Unknown/Catches should not be increased None
Brill 80 122 Unknown/Catches should not be increased None
Common sole - 415 Kattegat: below target Baltic Sea: No advice None
Perch 3,199 - Not assessed/ No advice None
Blue mussel 6,600 1,839 Not assessed/ No advice None
Smelt 2,341 - Not assessed/ No advice None
Pike 336 - Not assessed/ No advice None
Roach 1,997 - Not assessed/ No advice None
Whitefish 49 - Not assessed/ No advice None
Pike-perch 1,165 - Not assessed/ No advice None
Freshwater breams nei (Abramis spp.) 1,632 - Not assessed/ No advice None
Whiting 753 195 Not assessed/ No advice None
Vendace 1,182 - Not assessed/ No advice Threatened (VU=vulnerable) None
Freshwater bream 1,392 - Not assessed/ No advice None
Garfish (Belone belone) 471 20 Not assessed/ No advice None
Lemon sole (Microstomus kitt) 5 308 Not assessed/ No advice None
Pollock 647 552 Not assessed/ No advice Threatened (EN=endangered) None
Flounder, despite having no TAC or agreed upon management measures, is frequently caught commercially in the Baltic Sea and sold for human con-sumption. Misreporting of flounder is a major problem. According to the lat-est ICES assessment, only about 50%, 20% and 15% of the flounder land-ings are reported from the southern Baltic Sea. Further north, especially in Sweden and Finland, recreational fish-eries becomes increasingly important with a total catch that equals or even exceeds the commercial catch114.

30
The stock status of brill, turbot and dab are unknown115,116.117, and based on pre-cautionary considerations, ICES advises that catches should not be increased.
2.3. Threatened fish species and their fisheries
Salmon
Atlantic salmon spend most of their lives in the sea, but migrate into their home rivers to spawn. Each of the salm-on rivers contains a genetically unique population and therefore the loss of even a single river population is irre-versible. The decline of Baltic salmon stocks started in the mid-19th century and has worsened since the late 1940s, due to the construction of hydroelectric power plants, damming and pollution of the rivers and river mouths. HELCOM has classified Atlantic salmon as endan-gered under International Union for Conservation of Nature and Natural Re-sources (IUCN) criteria118. It is also list-ed as critically endangered by Poland, as endangered by Denmark, Estonia, Finland, and Germany, and as a threat-ened migrant by Lithuania. Finally, it is
also included in Annexes II and V of the EU Habitats Directive, which means that its conservation requires, besides other measures, the designation of pro-tected areas. Even though Baltic salmon migrates between the open sea and riv-ers, protection according to the Habitats Directive is only needed in freshwater habitats and Atlantic salmon in Finnish rivers is excluded all together.
According to the ICES Working Group on Baltic salmon and sea trout, the re-ported total landings of salmon in the Baltic Sea have declined by 85% since 1990 and were at historic low levels in 2008. Improvements in the state of growth of the stock have occurred since. Unreported catches are estimated at around 40% of total catches.
Sea trout
The Baltic Sea contains approximately 1,000 sea trout populations of which about 500 reproduce naturally in the Baltic Sea rivers. Most of the sea trout rivers flow into the Main Basin. Sea trout is assessed as threatened under IUCN criteria and ICES advises imme-
Turbot trapped in gillnet, Southern Baltic Proper, Germany. May 2011. © OCEANA/ Carlos Suárez

Fisheries management in the Baltic Sea
31
diate fishing restrictions to be enforced in the Gulf of Bothnia and the Gulf of Finland, to safeguard the remaining wild sea trout populations in the region. Minimum mesh size for gillnets, and ef-fort limitations should be implemented for the fisheries in the sea and in rivers carrying wild sea trout populations in order to reduce the exploitation rate119.
Aside from setting a minimum landing size for sea trout, no other management measures or TACs have been agreed. The minimum landing size of sea trout is smaller than salmon and this has led to an increase in misreporting of under-sized salmon as sea trout, which in ad-dition to IUU fishing is a frequent prob-lem in sea trout fisheries120,121.
European eel
European eel is a ‘catadromous’ fish meaning that it spawns and is born at sea, and then migrates into inland wa-ters to eat and grow. Eel is now believed to spawn in the Sargasso Sea in the mid-dle of the North Atlantic, the larvae then migrate to the coasts of Europe by drifting in the Gulf Stream. There they congregate in estuaries as glass eels, before metamorphosing into elders and moving upstream. Eels spend six to 20 years of their lifespan in fresh-water, where their bellies turn yellow. When the time comes to spawn, their skin turns silver and their stomachs dissolve. They then return downriver to swim the 5,000 kilometres back to the Sargasso Sea where their lives be-gan. Eels can live for over 80 years and reach up to 130 cm in length, but aver-age adult length is around 60-80 cm, when they weigh around 1-2 kg.
Traditionally eel fisheries have focused on adult eels and were aimed for local consumption. In the last few decades, however, the focus has shifted towards fishing glass eels, which are exported to Asian markets where they are fattened in farms before being sold. As a result, the price of glass eel has soared so high
that in the mid-2000s it exceeded that of caviar. At present the fishing of eel relies on stocking with imported glass eels,122 though ICES is concerned that glass eel stocking programs are unlike-ly to contribute to the recovery of the stock if fishing continues123.
Eel stocks are severely depleted and urgent action is needed. European eel is one of the most broadly utilized fish in Europe and in 2003124 ICES warned that eel stocks are about to collapse. It is classified as “critically endan-gered” by the IUCN - a threat level higher than that given to the polar bear (vulnerable), the giant panda (en-dangered) or the blue whale (endan-gered). Eel stocks have fallen to below 10% of 1970s levels and in the Baltic Sea 99% of the stocks are believed to have disappeared125 - they continued to decline in 2011126.
Moreover, according to ICES, the eel recruitment level is only 1% of what it was before 1980s. The glass eel re-cruitment trend has fallen to 5% of the 1960-1979 average in the Atlantic region and to less than 1% in the North Sea area, showing no sign of recov-ery. There has also been a continuous decline in the recruitment of young yellow eel since the 1950s.
Salmon caught with hook, Nexø, Bornholm, Denmark. March 2011. © OCEANA/ LX
Sea trout and salmon for sale, Riga, Latvia. May 2011. © OCEANA/ LX

32
Besides extensive overfishing, changes in environmental conditions at the spawn-ing grounds and during the oceanic phase are likely to have affected the sta-tus of eel. Habitat alterations, including barriers to eel passage, deterioration in water quality, contaminants, non-native diseases and parasites have contributed to the mortality of eels. Another threat is the bioaccumulation of contaminants in eels, which has been a serious prob-lem in some areas. It is even likely that there is a negative relationship between eel contaminant levels and the spawn-ing success of eels. This problem has been highlighted mainly in relation to food consumption limits and is leading to fishery closures to protect consum-ers. Setting closures in this type of se-lective manner may lead to an increased proportion of low quality spawners in the escapement127.
ICES advice for eel in 2012128 reiterates its previous advice that all anthropo-genic mortality, from recreational and commercial fishing, hydropower and
pollution affecting production, and eels escapes should be reduced to as close to zero as possible until there is clear evidence of an increase in both recruit-ment and the size of the adult stock. Furthermore, ICES advises that in order to facilitate stock recovery all catches of glass eel should be used for stock-ing. Moreover, stocking should not be used to continue fishing and should only take place where all anthropogenic mortalities are low.
After decades without effective ac-tion to stop the decline, a management framework for the recovery of eel was established in 2007 through a European Council Regulation known as the Eel Regulation129. The objective of this regu-lation is the protection and recovery of the eel stock. To achieve the objective, Member States have developed national management plans for their river basin districts, designed to reduce anthropo-genic mortalities and increase silver eel biomass. Measures in the plans include limiting fisheries; facilitating migra-European eel in the Sound, Sweden. May 2011.
© OCEANA/ Enrique Talledo
Fisheries management in the Baltic Sea
33
tion through the rivers and restocking suitable inland waters with young eels. In 2012, Member States will report to the EU on the implementation of their management plans, and the effect they have had on the stock and fisheries.
In the Baltic, countries have agreed on joint measures under HELCOM and on a rapid implementation of the long-term management plans for eel no later than 2012, which in-cludes ensuring successful eel migra-tions from the Baltic Sea drainage basin to natural spawning grounds. Sweden has agreed to be the lead country for these actions.
Since 2008, European eel has been listed on Annex II of the Convention on International Trade of Endangered Species (CITES) - which went into ef-fect in March 2009. This means that glass eels cannot be exported from the EU unless such export is deemed not to be detrimental to the stock. Additionally, an EU country wishing to export glass eel outside the EU must have an approved eel management plan in place.
Since the entry into force of the listing, the species has been closely monitored by the EU Scientific Review Group (SRG). The SRG unanimously con-cluded that it would be impossible (for the time being), for scientific authori-ties in the EU to deliver a “non-detri-ment finding” for any export from or import into the EU of European eels. This means a de facto import and ex-port ban for trade with European eel and with countries outside the EU. The ban has been prolonged until December 2012 - following a confirma-tion of the negative opinion of the SRG on the 7th October 2011130.
Though any exports and imports of eel after March 2011 from countries outside the European Union and to the
EU from third countries should be im-possible based on CITES rules and the SRG decision, loopholes allow the trade of processed or frozen specimen with countries outside the EU harvested prior to the ban until April 2012. In fact, after March 2011, the trade of eels con-tinued with countries outside the EU ac-cording to the EU trade statistics131: Den-mark imported 15 tonnes of live eels and exported 100 kilos of fresh eel, 50 tonnes of frozen eels and 5 tonnes of smoked eels. Germany imported 66 tonnes and exported 200 kilos of frozen eels and exported 2 tonnes of smoked eels. Estonia exported 200 kilos of fresh eels, Lithuania exported 20 tonnes of frozen eels, Poland imported 75 tonnes of fro-zen eels and Sweden imported 100 ki-los of fresh eel. These large amounts bring into question why trade with alive or fresh eels was still possible after March 2011 and wether the proc-essed or frozen species were actually harvested prior to the ban.
Harbour porpoise
The harbour porpoise is a small cetacean species inhabiting temperate and cold waters throughout the northern hemi-sphere. In the early 1900s, the species was wide-spread throughout the Baltic Sea with approximately 10,000 individ-uals. Between 2002 and 2008 however, the population of Baltic Sea harbour porpoise is estimated to have stood at an average of 800 total individuals132.
The Baltic Sea sub-population of har-bour porpoises is classified as “critically endangered” under IUCN criteria and is listed both in Annex II and Annex IV of the EU Habitats Directive. It is also part of the “Agreement on the Conser-vation of Small Cetaceans of the Baltic and North Seas under the Bonn Con-vention (ASCOBANS)”. Baltic Sea states have also agreed on HELCOM Recom-mendation 17/2 to protect the harbour porpoise in the Baltic marine area.
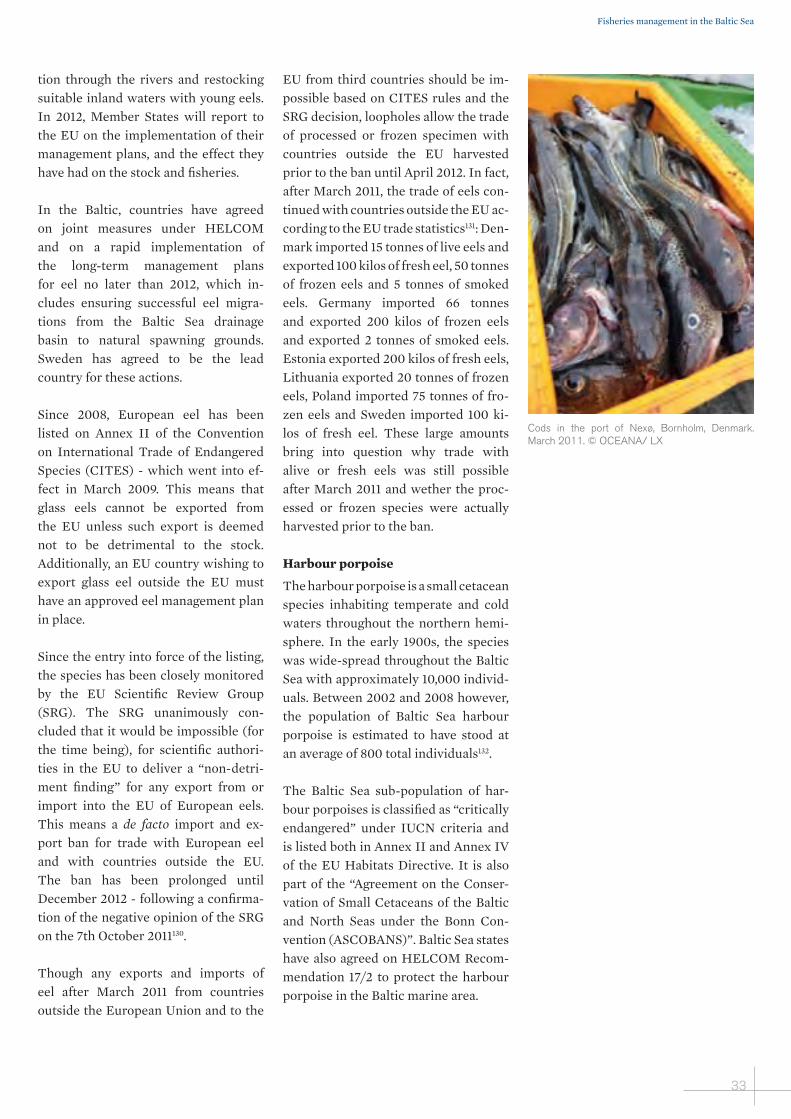
Cods in the port of Nexø, Bornholm, Denmark. March 2011. © OCEANA/ LX
34
The collapse of the population start-ed with intense hunting in the late 1800s, which ended in the early 1900s. Today the main threat to the Baltic Sea harbour porpoise is entanglement in fishing gear. Other major threats in-clude hazardous substances, the de-struction of habitats and underwater noise as well as increased ship traffic. ASCOBANS has estimated that due to the low abundance of porpoises in the Baltic, the current by-catch rate is much too high, and Baltic porpoises may become extinct in the near future unless actions are taken to prevent future decline133. German studies indi-cate that by-catch is a major threat to harbour porpoises in south-western Baltic Sea134.
Sharks
Due to the conditions in the Baltic Sea, mostly low salinity levels, small size, physical barriers and others, there is a belief that neither shark, nor ray nor chimaera species have ever inhabited it, but that is not correct. These conditions do restrict and limit the occurrence of the aforementioned species, but do not preclude their ex-istence. A recent study135 shows that
more than 30 such species have been found in the Baltic and the Skagerrak, some are even commonly found, like the spurdog (Squalus acanthias) and dogfish (Scyliorhinus caniculus). Most of the sharks in the Baltic Sea and the Kattegat are classified as threatened under IUCN criteria and are includ-ed in the HELCOM list of threatened species. Moreover, available data on shark and ray catches in the Baltic Sea show a high level of catches in the Skagerrak and the Kattegat and even in the Western Baltic Sea to some extent. The report shows that sharks, rays and chimaeras are not only present but that their populations have been and still are caught in fisheries, underscoring a need for strong conservation meas-ures (i.e. management plans), which are currently non-existent.
Fisheries management in the Baltic Sea
35
3. IUU fishing in the Baltic Sea and the Kattegat
© OCEANA/ LX

36
Fisheries provide a vital source of food, employment, recreation, trade and economic well-being. IUU fish-ing - which stands for illegal, unregu-lated and unreported fishing under-mines these roles. EU fisheries com-missioner Maria Damanaki points out: “Pirate fishing, often called illegal, unreported and unregulated fish-ing, deprives an estimated half billion law-abiding fishermen and their com-munities up to $23 billion worth of seafood annually around the world”. A study estimates the total value of current illegal and unreported fish-ing losses worldwide to be between $10 billion and $23,5 billion annu-ally, representing between 11 and 26 million tonnes136. Even the low end of that range is equivalent to 15% of world marine catches137.
According to the Food and Agricultur-al Organisation of the United Nations (FAO), IUU fishing includes three prin-cipal types of activities138:
1. Illegal fishing refers to activities:
· conducted by national or foreign vessels in waters under the jurisdic-tion of a State, without the permis-sion of that State, or in contraven-tion of its laws and regulations;
· conducted by vessels flying the flag of States that are parties to a rele-vant regional fisheries management organization but operate in con-travention of the conservation and management measures adopted by that organization and by which the States are bound, or relevant provi-sions of the applicable international law; or
· in violation of national laws or in-ternational obligations, including those undertaken by cooperating States to a relevant regional fisher-ies management organization,
2. Unreported fishing refers to fishing activities:
· which have not been reported, or have been misreported, to the rel-evant national authority, in contra-vention of national laws and regula-tions; or
· undertaken in the area of compe-tence of a relevant regional fisheries management organization which have not been reported or have been misreported, in contravention of the reporting procedures of that organization,
3. Unregulated fishing refers to fishing activities:
· in the area of application of a rele-vant regional fisheries management organization that are conducted by vessels without nationality, or by those flying the flag of a State not party to that organization, or by a fishing entity, in a manner that is not consistent with or contravenes the conservation and management measures of that organization; or
· in areas or for fish stocks in rela-tion to which there are no applica-ble conservation or management measures and where such fishing activities are conducted in a man-ner inconsistent with State respon-sibilities for the conservation of liv-ing marine resources under inter-national law.
Catch misreporting, most commonly observed in the form of unreported or misreported landings (i.e. landing more fish than reported or not reporting cer-tain landings at all) and area misreport-ing (e.g. taking fish from a certain stock during its closed season and reporting a different area) is often the result of a combination of an oversized fishing fleet with low, restrictive quotas and/or insufficient number of inspections.

Fisheries management in the Baltic Sea
37
The activities listed above by definition mean that catches are either misreport-ed, or not reported at all, to the relevant public authorities. IUU fishing is thus a major contributor to overfishing139.
The EU is the world’s largest im-porter and exporter of fish by volume. In 2008, the EU was the third largest importer behind Japan and the United States, and the second largest exporter behind China, by value140. Growing de-mand for fish, combined with local re-source depletion, has promoted a major expansion of European fleets in size and fishing range.
Fishermen often employ already tested and effective methods of circumventing regulations. The most notable of them involve141:
· Hiding illegal cargo in specially adapted and concealed holds on vessels;
· Hiding illegally caught fish under a layer of fish of another species;
· Reporting eastern Baltic cod as western Baltic cod;
· Evading inspection by quickly pass-ing information to each other on the whereabouts of inspectors;
· Landing fish late at night;
· Engaging in “fish laundering” - sell-ing traders larger quantities of fish than those declared in first‑sale records;
· Putting untaxed fish on the market through illegal channels of distribu-tion;
· Attempting to make connections and “deals” with inspection agen-cies.
Four major types of negative outcomes of illegal, unreported and unregulated fisheries can be described:
· Direct economic losses: these loss-es are coming from the monetary value of fish caught that could have been taken if not for IUU fishing ac-tivities. It translates into the loss of revenue from levies never paid such as landings or license fees and taxes. It results in direct losses to GNP;
· Indirect economic losses: these losses result from the decrease of employment and income and in fisheries (e.g. lower catches leading to loss of jobs and turnover in the sector);
· Environmental losses: IUU fish-ing is unsustainable and is posing major negative impact and threat to ecosystems and targeted species (e.g. overfishing leading to stock collapse);
· Socio‑economic losses: IUU fish-ing activities can lead to reduction in productivity of fish stocks. This leads to reduced catches and other negative impacts on other, legally working fishermen.
In the EU, several regulations have been established and enforced in the past few years to tackle IUU fish-ing: the EU Control regulation142; the IUU Regulation to combat illegal, unreported and unregulated fishing143 (which applies mainly to third-country vessels); and the Regulation on Fisher-ies Authorisations144 (which deals with the control of EU vessels fishing outside EU waters and of third country vessels fishing in EU waters).
In 2004, the ICES Baltic Fisheries Assessment Working Group estimated the level of IUU fisheries to be as high as 35-40% in some Baltic fisheries145. Latest since then, the problem has be-come well known and discussed among scientists, experts and the fishing
Cods in crate in the port of Ustka, Poland. March 2011. © OCEANA/ LX

38
industry. As a consequence, the Eu-ropean Fisheries Control Agency got involved and control measures have been increased on eastern Baltic cod fisheries. Misreporting by countries is estimated to have decreased to 6% for cod in 2008 and 2009, however, the ICES Baltic Fisheries Assessment Working Group also points out major inconsistencies in reported catch data, compared to independent scientific sur-veys, and states that the decrease to 6% seems unrealistic146.
In May 2010, the Fisheries Centre at the University of Bristish Columbia published: “Total marine fsheries ex-tractions by country in the Baltic Sea: 1950-present” as a part of the worldwide "Sea Around Us" project. The report was published in order to estimate the
total fisheries catches by the countries bordering the Baltic Sea (as opposed to reported landings) from 1950 to 2007 (Table 7). In addition to the reported landings, four other catch components were estimated for the nine coastal Baltic Sea countries (Denmark, Estonia, Finland, Germany, Latvia, Lithuania, Poland, Russia and Sweden): adjust‑ments’ to ICES landings statistics (i.e. data source adjustments), unreported landings‘, ‘discards’, and recreational catches‘147. In that report, the overall amount of IUU fishing (adjustments and unreported landings), discards and recreational catches have been esti-mated to be between 12% for sprat and 54% for Baltic cod in 2007. On average, species by species, these types of catch-es were estimated at 33% of the real total catch.
Table 7. Estimated total catches of Baltic Sea fisheries in 2007. Source: “Total marine fisheries extractions by country in the Baltic Sea: 1950-present”148.
Species Reported landings to ICES 2007 (tonnes)
IUU fishing (tonnes)Discards
2007
Recreational fisheries 2007
(tonnes)
Total (tonnes)
% IUU, discards and recreational fishingAdjustments to ICES
statistics 2007Unreported
landings 2007
Cod 63,480 2,964 48,628 14,950 8,714 13,8736 54%
Herring 258,195 6,714 56,864 24,854 3,508 350,135 26%
Sprat 407,017 -15,242 42,910 26,144 45 460,874 12%
Salmon 916 -32 120 425 176 1,605 43%
Flatfish 23,074 -74 2,560 12,076 1,417 39,053 41%
Other 50,573 -9,705 4,648 4,742 15,096 65,355 23%
Loading cods to a truck in the port of Ustka, Poland. March 2011. © OCEANA/ LX

Fisheries management in the Baltic Sea
39
In May 2011, ICES published their an-nual stock assessments and advice for some Baltic and Kattegat fish stocks, including updated estimations of mis-reporting and unallocated removals of the stocks (Table 8). Even though for some stocks the amount of IUU fishing had improved over the last years, for other stocks and areas, it was still very high. For eastern Bal-tic cod, the ICES working group on Baltic Fisheries Assessments clarified in 2011 that the drastic drop in cod
misreporting from 2004 levels (as men-tioned above) “might not reflect real-ity”. Inconsistencies in the data for officially reported cod catches in the Kattegat with fisheries independent data forced scientists to apply a factor of corrections to the removal from the stocks, due to discards and misreport-ing up to 12 times the reported catch. Misreporting of salmon catches in 2010 was as high as ever and scientists esti-mate IUU catches that year to be up to 50% of the total catches in tonnes.
Table 8. Information on IUU fishing from ICES stock assessments149.
Stock % IUU/Unallocated landings ICES 2011: Report of the Baltic Fisheries Assessment Working Group
Baltic cod West Not given "Removals of cod in recreational fisheries in the Baltic are substantial, but not consistently and completely sampled, and therefore not included in the assessment.""Some high-grading in Danish fisheries might take place but not indicated to be substantial."
Baltic cod East Cannot be quantified "…although unreporting has likely decreased in 2008-2009 due to more strict enforcement of fishing control and an overall reduction in effort, a decline to 6% from 35-40% (the estimate of previous years) in just one year might not reflect reality."
Baltic cod Kattegat 82%-92% "The assessment has shown a discrepancy between the reported landings and total removals from the stock The model estimated total removals in 2003-2010 to be 3-8-times higher than the reported landings; this level cannot be explained by the available estimates of discards. For 2010, ICES scientists estimated that actual removals from the Baltic cod stock in the Kattegat are 5,59 to 12,26 times higher than the reported landings. Discrepancies cannot be explained with discards."
Herring, Gulf of Riga 10% "It is expected that misreporting of catches occurs (either underreporting or over reporting), in 2010 it was estimated at the level of 10%."
Herring, Bothnian Sea
6% "Of the total catch, 94% was re-ported with the EU fishing logbook, In the final Finnish catch estimates, the landings data is corrected accordingly."
Herring, Bothnian Bay
6% "Of the total catch, 94% was re-ported with the EU fishing logbook, In the final Finnish catch estimates, the landings data is corrected accordingly."
Herring, subdivisions 25-29 and 32
Not given "No quantitative information on unallocated landings was presented, It is, however, expected that misreporting of catches occurs…"
Spring spawning herring
0% "…not believed to occur…"
Baltic sprat Cannot be quantified "It is expected, however, that misreporting of catches occurs, as the estimates of species composition of the clupeids catches are imprecise…"
Salmon 22%-50% "Misreporting of catches probably occurs in all different types of fisheries, fisheries zones and countries… Reporting of salmon as sea trout or rainbow trout or even marine rainbow trout, creates an additional source of unreported salmon, Inexplicable inadequacies of basic data exist"
Sea trout -37% of the catch in Main Basin, -24% of total catch
"The actual catch of Polish sea trout may be overestimated because due to TAC restrictions salmon is likely reported as sea trout…"

40
Cases of IUU fishing: Denmark and Sweden
IUU fishing in the Baltic Sea has been best documented in Poland and Denmark, the largest fishing nations for cod, and some cases have been made public in Sweden. The fact that information on IUU fishing in com-mercial and recreational fisheries is not publicly available from the other Baltic countries does not mean, how-ever, that it is not happening, but rather shows the approach to transparency in these countries. In 2010, the Danish AgriFish Agency identified, in total, 104 cases of fisheries law violations in the Kattegat, the Sound, the Belt Sea and the Western and Eastern Baltic Sea (see Table 9)150. Twenty-nine of these cases involved cod, of which 21 were identified in the Eastern Baltic Sea, as shown in the Table 9.
In August 2010, Greenpeace Denmark unveiled evidence of illegal fishing activity in the Kattegat. By attaching GPS transmitters on five vessels in the Danish port of Gilleleje in the spring of 2010, they revealed that they had all fished inside a closed cod area158,159. This particular area was established by Denmark and Sweden in Janu-ary 2009, as a result of the collapse of cod stocks in the Kattegat and in order to protect the spawning area160. As the closed area is situated in both Danish and Swedish waters, the two countries’ authorities cooperate on the coordina-tion of controls and the exchange of monitoring data161. Unfortunately, the closures have only been enforced for vessels from Denmark and Sweden.
Greenpeace’s information on four of the five vessels was corroborated by the Danish AgriFish Agency, which col-lects data on all vessels over 15 metres long via a satellite-based monitoring system. The fifth, which was less than 15 metres long and hence too small to be monitored by the agency, was neverthe-less reported to the police.
The five vessels together made more than 70 trips into the closed area be-tween March 25th and August, 2010162. As a consequence of the Greenpeace’s work, in 2011, three fishermen went to court and two were fined up to €6,600 and at the same time had to repay the money they earned from selling the illegally caught fish, which for one of the fisherman amounted to about €34,000163.
Table 9. Information on IUU fishing from media reports and country information (Media, several articles 2010-2012).
Area Date Case
Denmark, Bornholm151
22.06.2011 Trawl fisherman used with illegal gear with reduced mesh sizes west of Bornholm. The fisherman was fined.
Denmark, Bornholm152
30.01.2009 Polish fisherman fished illegal, and was caught when he landed the fish in Nexø, Bornholm. The fisherman was fined and the catch was confiscated.
Denmark, Kattegat153
2010-2011 The Greenpeace case: in total 10 cases of illegal fishery in a closed area in the Kattegat were reported to the police by the Danish AgriFish Agency. Some of the fishermen were fined so far.
Denmark, Bornholm154
2010 In May 2010, Danish fisheries inspectors found a large Latvian trawler fishing illegally in the Bornholm Basin and brought the vessel up.
Sweden, Bothnian Bay155
09.02.2012 Illegal fishery in the Bothnian Bay. The Swedish Agency for Marine and Water Management charged a fisherman in Haparanda to have fished without lawful vessel permits. The man is suspected to have engaged in illegal commercial fishing.
Sweden, Simrishamn156
13.05.2011 An inspection found an illegal fishing net near the coast in Baskemölla. The net was around 559 meter long, far too long. It was not marked with identification information. The net was confiscated, and about 40 kg of fish were released into the sea.
Sweden, Simrishamn157
14.02.2012 Two inspectors boarded a trawler vessel from Halland, and discovered that the crew had caught 224 kg undersized cod. The fish were confiscated.

Fisheries management in the Baltic Sea
41
4. Cod
© OCEANA/ LX

42
4.1. Cod fisheries and management in the Baltic Sea and the Kattegat
Cod, a keystone species in the pelagic community and crucial for the func-tioning of the Baltic ecosystem164, is one of the most important commer-cially caught fishes in the Baltic Sea. Consequently, it has long been an attractive target for IUU fishing activities. Despite a recent increase in the biomass of eastern Baltic cod, Baltic cod stocks in the Western Baltic Sea and the Kattegat are still overexploited.
The cod stock in the Kattegat is severely overfished. Reported catches have de-clined from more than 15,000 tonnes in the 1970s to 10,000 tonnes in the late 1990s and in 2009, reported land-ings were below 200 tonnes accord-ing to the ICES working group for stock assessments in the Baltic Sea. The present level of fishing mortality is uncertain due to significant unallo-cated removals, discards are estimated at 90% of the total removals in num-bers of individuals, and levels of IUU fishing are is estimated to be very high. Officially, the stock status is unknown and ICES advises that there should be no directed fisheries, and by-catch and discards should be minimised165. For the Kattegat stock, the ICES ad-vice has for years been not to have directed fisheries of this stock as the stock status is unknown166. This advice has been constantly ignored.
In the Baltic Sea, there are two dis-tinct stocks of cod: eastern and western Baltic stocks. Historically these stocks have been assessed separately from each other by ICES, although they have only been managed separately since 2005. Previously, both the eastern and western stocks were managed as a single stock with a shared TAC set for them.
The eastern and western Baltic cod stocks overlap in the Arkona Basin. The degree of overlap has not been quanti-fied, but it is likely that it has increased in recent years, as the eastern Baltic stock is currently increasing in size167.
Western Baltic cod is fished unsus-tainably, above MSY, while eastern Baltic cod is harvested sustainably. The highest spawning stock biomass, up to 700,000 tonnes for eastern Bal-tic cod and around 60,000 tonnes for western Baltic cod, was record-ed in the late 1970s and early 1980s. Both stocks declined steeply dur-ing the 1980s and early 1990s when catches were at the highest levels ever recorded.
Eastern Baltic cod was severely over-fished some years ago, mainly due to a high amount of IUU fishing, but there has been an increase in size of the eastern Baltic cod stock in recent years. Besides fishing, the recruit-ment of the eastern Baltic cod stock is strongly driven by environmental factors. Spawning is restricted to the deep basins where the oxygen content
Polish bottom trawler Jas‑39, unloading cod at 9pm in the port of Jastarnia, Poland. March 2011. © OCEANA/ LX

Fisheries management in the Baltic Sea
43
and salinity are still sufficiently high for eggs to survive. Due to pollution and eutrophication, several traditional spawning areas of cod have become “dead areas”. The amount of water with these characteristics depends on the inflow of high-salinity water from the North Sea.
The cod population is highly dependent on sprat and herring. Cod is their main predator, while sprat and herring adults in turn feed on cod eggs and larvae. Natural mortality of the pelagic stocks of sprat and herring is likely to increase in the near future since Baltic cod stocks are rebuilding successfully.
The main fisheries for cod in the Baltic Sea use bottom trawls, but cod is also caught in gillnets and pelagic mid-water trawls. The importance of longlines in this fishery has increased in recent years.
Western cod stock (ICES subdivi-sions 22 to 24) fisheries are dominated by Denmark and Germany, with the rest of the catches taken by Sweden and Poland. The majority of landings are made using trawls (62%) and gill-nets (38%). In recent years the land-ings have been oscillating between 14,000 and 24,000 tonnes, with the lowest value of the time series recorded in 2010. Estimated volume of discards in 2010 was 10% of the total catch in weight. The majority of the discards were undersized fish.
The eastern cod stock (ICES subdivi-sions 25 to 32) fisheries are dominated by Poland, Sweden, and Denmark, with rest of the catches taken by Latvia, Lithuania, Russia, Germany, Finland, and Estonia. The majority of landings are made using trawlers (77%) and gillnetters (23%).
Baltic cod is mainly regulated by TACs and quotas. Because of overexploita-tion of cod stocks in the Baltic Sea in 2007, the European Commission’s “multi-annual plan for the cod stocks in the Baltic Sea and the fisheries ex-ploiting those stocks”168 was established to rebuild the declining population. According to the plan, the cod fisher-ies in the Western and Eastern Baltic Sea are regulated by seasonal closures, from 1st to 30th of April in the Western Baltic and during the month of July and August in the Eastern Baltic, to protect the cod stock, especially the spawning aggregations. The plan further stipu-lates several measures for increased monitoring, control and surveillance of cod fisheries. The minimum landing size of cod in the Baltic Sea is 38 cm169.
Following a joint initiative by Denmark and Sweden, from 1st January 2009, a small area (“the triangle”) in the Sound was closed for all fisheries in February and March, months which have traditionally seen a large directed cod fishery. This led to a reduction of the cod catch in subdivision 23 by more than 50% compared to the time period from 2004-2008170.
Unloading cod from a gillnetter in the port of Hel, Poland. March 2011. © OCEANA/ LX

44
4.2. IUU fishing for cod in the Baltic Sea and the Kattegat
Illegal, unreported and unregulated (IUU) fishing has a long history in the Baltic Sea, depleting fish stocks and compromising management efforts and recovery measures developed to main-tain sustainable levels. IUU catches pose a major threat to already highly overexploited stocks, making any at-tempts to produce scientific stock size assessments much more difficult.
The ICES Baltic Fisheries Assessment Working Group has estimated the level of IUU fishing for Baltic cod to be as high as 35-40% in past years171. Moreover, es-timates of the degree of misreporting available from the national industries and control agencies indicate that total catches between 2000 and 2007 were about 32-45% higher than the reported figures172. In 2005, the true volume of cod catches from the eastern stock was estimated to be as much as 38% higher than the officially reported landings of around 40,000 tonnes173. Most of these catches are believed to have been taken from Polish waters174.
Between 2005 and 2006, European Commission inspectors conducted eval-uations of the system for the verification of declared cod catches in eight Member
States, including Poland. Analyses of the collected data sets (recorded catch data from the inspected and non-inspected landings) indicated under-recordings averaging at 48.71%175.
Since 2007, both national and European Fisheries Control Agency control activi-ties increased, especially with regards to cod fisheries and landings in the Baltic Sea: the number of coordinated days of control activity increased from 92 to 128, and the number of inspec-tions at sea and ashore was quadru-pled (from 500 to 2063). However, the problem persists, as confirmed in 2012 by the Control Agency: “the question of assessment of the current situation re-mains and the under declaration of cod catches still is considered a recurrent problem”176.
In Table 10, information from countries on national control programs for Baltic cod is summarized, although Germany, Finland and Sweden, which did not provide the information requested from ICES by June 2011, are not included. The table shows a very low degree of national control activities overall (with the exception of Denmark) and a simi-lar level of or increase in infringements in 2010 compared to 2007 for Lithuania and Poland.
Table 10. Information on national control action programmes in the Baltic Sea177.
Information on national control action programmes in the Baltic Sea (2007‑2010)178
DENMARK: At sea inspections increased in 2008 and 2009 and a decreased in 2010 to levels below those in 2007. Meanwhile the number of control vessels remained the same for the entire reporting period. The number of at sea violations peaked at 19 in 2009, but was much lower during the rest of the reporting period (6, 3 and 2 in 2007, 2008 and 2010 respectively). The total number of infringements in ports was much higher with as many as 55 cases reported in 2007, a number that has since decreased to about 32 in 2009 and 2010.
ESTONIA: No control activity for 2007-2010 was reported. The reason for that is the absence of cod fisheries in Estonian waters. Estonian inspections of cod fishery in other EU waters conducted in 2009 and 2010 (with a single control vessel), did not reveal any violations.
LITHUANIA: The number of at sea inspections showed an overall increasing trend from 13 days in 2007 to 56 days in 2010 with a small decline in 2009. The number of violations increased until 2009, when it reached 40 infringements, and then declined but is still higher in 2010 than it was in 2007. Additionally a relatively high increase in inspections was observed in 2008 (when the Multi-Annual Plan for Cod was implemented) as compared to 2007.
LATVIA: With the exception of 2009, the number of at sea inspections generally decreased during this reporting period. The number of control vessels also decreased from three to zero (in 2009-2010). However, even with no vessel in action, Latvia still reported a few violations.
POLAND: Similarly to Latvia, the level of Polish sea inspections declined from 2007 to 2010, with the exception of 2009. The number of inspection vessels, which ranged between 10 and 12, was the highest among all Member States that reported their national control program data. The highest number of recorded violations (17 events) occurred in 2007 and 2010, while in 2008 and 2009 it was significantly lower (8 and 2 recorded infringements respectively). In 2010, the level of detected infringements again was as high as in 2007. Poland also showed big overall number of inspections nearing 2 inspections per day at sea.

Fisheries management in the Baltic Sea
45
In their 2011 stock assessments for eastern Baltic, western Baltic and Kattegat cod, the ICES Baltic Fisher-ies Assessment Working Group com-mented on the misreported and unallo-cated landings for all three cod stocks. Concrete numbers or percentages were not provided in all cases, but it was clarified that both still occur and that, specifically in the Kattegat, the real catches of cod through discards or IUU fishing were estimated to be 80% high-er than the reported landings in tonnes. Details are given in Table 11.
Cods in a crate, Nexø port, Bornholm, Denmark. March 2011. © OCEANA/ LX
Table 11. Information on IUU fishing from stock assessments (ICES 2011)179.
Stock % IUU/Unallocated landings ICES 2011. Report of the Baltic Fisheries Assessment Working Group
Baltic cod West Not given "Removals of cod in recreational fisheries in the Baltic are substantial, but currently not consistently and completely sampled, and therefore not included in the assessment."
"Size compositions within Danish commercial landings in 2010 from fishing trips with and without observers on-board were compared. The data indicated that relatively more cod at the smallest sorting category (category 5) were landed when the observers were on-board, compared to the trips without an observer; however the difference was relatively small. This indicates that some high-grading might take place, however it is not indicated to be substantial."
Baltic cod East Cannot be quantified "WGBFAS considers that although unreporting has likely decreased in 2008-2009 due to more strict enforcement of fishing control and an overall reduction in effort, a decline to 6% from 35-40% (the estimate of previous years) in just one year might not reflect reality. However, WGBFAS has no additional information to quantify this. For 2010, no information of potential misreporting was available to the WG. Thus, no corrections to landings figures were applied."
Baltic cod Kattegat Not given, actual removals from the Baltic cod stock in the Kattegat are 5,59 to 12,26 times higher than the reported landings.82%-92%
"The assessment has shown a discrepancy between the reported landings and total removals from the stock and ICES assumed that the majority of the unallocated mortality was caused by discard, but other factors such as migration, non-reported landings and re-allocation of catches also could be part of the problem."180 The reported landings of cod in the Kattegat in 2010 were 155 tonnes, while the TAC was 379 tonnes.
"In recent years, reported landings appeared not to represent total removals from the stock; significant bias was estimated for 2003-2010. The model estimated total removals in 2003-2010 to be 3-8 times higher than the reported landings; this level cannot be explained by the available estimates of discards. Unallocated removals were estimated separately for the years 2003-2010, but common for all age-groups within a year. Scaling factors estimated for 2003-2010 were significant for all the years. For 2010, ICES scientists estimated that actual removals from the Baltic cod stock in the Kattegat are 5.59 to 12.26 times higher than the reported landings. Discrepancies cannot be explained with discards."181

46
Poland
Poland had a large problem with IUU fishing of cod until 2007, when national and European controls were increased and fisheries rules became better en-forced. However, a review of local news stories showed that IUU fishing of cod is still happening in Poland (Table 12).
Polish scientists have been more scep-tical than ICES in their estimates182, assuming illegal catches to be more than 100% higher (at the stock level) than the actual quota.
In 2006, Grzegorz Hałubek, Presi-dent of the Polish Fishermen’s Asso-ciation openly admitted to one of the Polish biggest daily newspapers183 that: “In Poland all fishermen exceed the quota, because if they fished only what they are allowed to do they would have starved to death”. A year later, Polish fisheries became infamous, when “the big cod fraud” case of fishermen ex-ceeding quotas, made headlines in the local media.
Outlook: Polish cod fleet returns to fishing in 2012
Between 2009 and 2011, new rules in Polish cod fisheries were introduced188. The previous requirement to inspect 20% of cod landings was raised to 100% - all cod retained on-board of fishing vessels had to be reported to inspectors. Furthermore, in order to address the is-sues facing cod fisheries, Poland imple-mented a system called ‘Trójpolówka’. The key principle was that only 1/3 of the fleet would go out to sea to fish for cod while the rest stayed in port and re-ceived compensation in the form of sub-sidies (though they still could fish other species). Vessels were selected on a ran-dom basis in a lottery each year. While this system was in place (between 2009 and 2011) the Polish cod quota had also been reduced as a penalty from the Eu-ropean Council for previously exceed-ing catches189.
However, since 2012, Poland has not had sufficient funds to continue the compensation scheme, and has thus ended the ‘Trójpolówka’ system, allow-ing for the entire cod fleet to resume normal activities. At the same time, while the cod quota for 2012 increased by 15%, the amount of cod fishing ves-sels increased by 200%, thereby reduc-ing individual vessel quotas by 50% of what they were in 2011. This caused a lot of controversy between fishermen and the government. Angry fishermen took the streets190 to show their disap-proval. The government has stood firm against initial protests, but fishermen are now filing lawsuits on the basis of the Polish constitution which “forbids limiting economic activities by means other than official regulations”, claim-ing that the government is trying to re-duce their profits illegally.
Table 12. Information on IUU fishing from media reports and country information (2011, 2012).
Area Date Case
Poland184 26.01.2012 Two tons of illegal caught cod hidden in a secret cache.
Poland,185 Jeziorzany
03.12.2011 Two poachers caught for illegal fishing. Residents of the Jeziorzany municipality caught fish with nets in the river.
Poland, Słupsk186,187
21.07.2011 Polish fisheries inspectors and coast guard in Słupsk found half-a-tonne of illegally caught cod on a vessel from Kołobrzeg (Koł-180), according to Głos Pomorza newspaper in Słupsk.

Fisheries management in the Baltic Sea
47
Oceana findings: Cod fisheries
Cod management plan and closed seasons
The long-term cod management plan, introduced after stocks had been dramatically reduced, includes closed seasons. In the Western Baltic Sea and the Belt Sea, the fishing season closes during the month of April, and in the Eastern Baltic, it closes in July and August191.
Despite these measures, aimed at protecting cod stocks and spawning aggregations, considerable amounts of cod were landed and traded in Denmark and Sweden during the closed season. In April 2011, for example, Danish fishing vessels landed 151 tonnes of cod, caught in the Western Baltic Sea192, while Swedish vessels from Eastern Baltic ports landed seven tonnes in August 2011193.
In Polish fishing ports, cod was offered to clients and res-taurants and sold directly from the ships throughout July and August, as shown in the photographs below.
The cod management plan’s many loopholes make controls extremely difficult and create legal situations wherein fish-ing for and landing cod during “closed seasons” is permis-sible, undermining the very point of the plan’s conservation efforts.
In Poland, Oceana observed cod being sold directly from fishing vessels to customers and restaurants. This practice, especially during the closed season, makes it difficult to con-trol the amount of fish a vessel is unloading.
Cod and flatfish for sale directly from the boat, in the port of Darlowo, Poland. July 2011. © OCEANA/ Marek Budniak
Cods for sale in the port of Darłowo, directly from the boat. Poland. July 2011. © OCEANA/ Marek Budniak
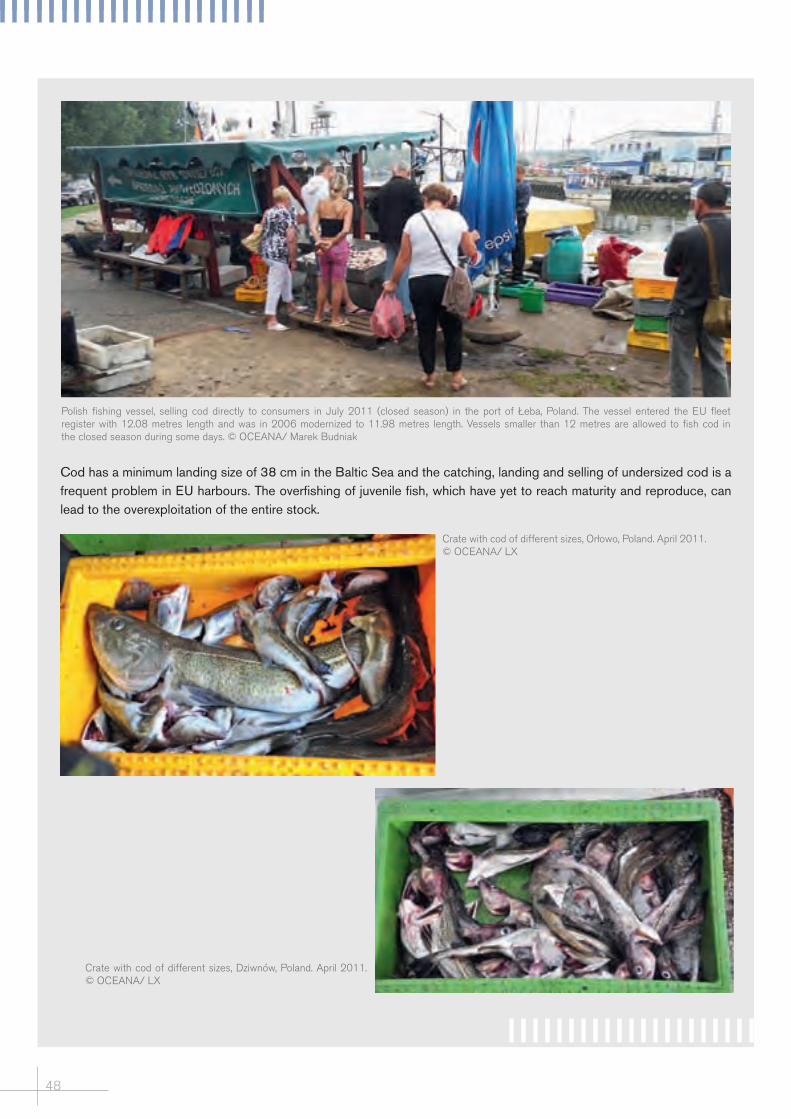
48
Cod has a minimum landing size of 38 cm in the Baltic Sea and the catching, landing and selling of undersized cod is a frequent problem in EU harbours. The overfishing of juvenile fish, which have yet to reach maturity and reproduce, can lead to the overexploitation of the entire stock.
Polish fishing vessel, selling cod directly to consumers in July 2011 (closed season) in the port of Łeba, Poland. The vessel entered the EU fleet register with 12.08 metres length and was in 2006 modernized to 11.98 metres length. Vessels smaller than 12 metres are allowed to fish cod in the closed season during some days. © OCEANA/ Marek Budniak
Crate with cod of different sizes, Dziwnów, Poland. April 2011. © OCEANA/ LX
Crate with cod of different sizes, Orłowo, Poland. April 2011. © OCEANA/ LX

Fisheries management in the Baltic Sea
49
5. Salmon and sea trout
© OCEANA/ LX

50
5.1. Salmon and sea trout fisheries and management in the Baltic Sea and the Kattegat
Some positive developments have been noted194,195 in salmon stocks. These in-clude an increase in the number of ju-veniles entering the sea (total smolt196 production), although this has now lev-elled off, particularly in the northern Baltic Sea. Nevertheless, a large part of salmon stocks remain in a critical state.
Salmon is listed as threatened and declining by HELCOM197. Salmon in freshwater (with the exception of those in Finland) is listed as a species of European importance in the Habitats Directive198 and EU Member States are obliged to designate special areas of conservation (SACs) in order for the species to be restored and maintained at a favourable conservation status. The latest reporting round on the im-plementation of the Habitats Directive showed that salmon has an unfavour-able conservation status across the bioregions in the Baltic Sea catchment area.
Baltic salmon populations reproduce in at least 43 river systems, of which at least 29 host an original salmon popu-lation or one that is partly mixed with
other populations following stocking practices199. There are wild salmon riv-ers in all sub-basins of the Baltic Sea including the Kattegat. Many bigger rivers have shown an increased produc-tion of smolts and of ascending spawn-ers. Unfortunately this positive trend has not been observed in many small salmon rivers200, of which many have also lost their original wild salmon pop-ulations. The main reasons for the loss have been the damming of rivers for hydropower and the dredging of rapids and riffles for log driving purposes.
The Baltic Sea contains approximately 1,000 sea trout populations of which about 500 reproduce naturally in Baltic rivers201. The status of these populations varies greatly across different regions202. ICES assessments show that the stock status is poorest in eastern (ICES sub-divisions 26 and 28) and northern (ICES subdivisions 29-32) areas of the Baltic Sea. In the Gulf of Bothnia, sea trout populations are endangered203 and in the Gulf of Finland they are in an unsatisfactory state. This is due to excessive fishing pressure, obstacles to migration and habitat degradation204. In the main basin of the Baltic Sea, stocks are generally in a better state, but are also threatened by migration barriers and habitat destruction205.
Salmon, caught in floating nets in the mouth of the Vistula river, Świbno, Poland. April 2011. © OCEANA/ LX

Fisheries management in the Baltic Sea
51
Fishing and management
The Baltic Sea commercial salmon quo-ta is divided into two parts: the main basin and the Gulf of Bothniaquota and the Gulf of Finland quota. Not included in quota calculations, are recreational catches from the sea, estuaries and rivers, despite the fact that recreational fishing accounts for approximately one quarter of the total amount of salmon caught in the Baltic Sea region and nearly one half of the catch taken from the shore or rivers.
Salmon catches have decreased from 5,633 tonnes in 1990 to 886 tonnes in 2010206. The decrease has been par-ticularly marked in offshore fisheries, and the proportion of catch taken in coastal and recreational river fisher-ies has actually increased. This has mainly been due to fishing pressure in offshore waters stemming from the EU regulation prohibiting driftnets. Since then, fishing in the Baltic main basin for mixed salmon stock declined signifi-cantly. In fact, longline fisheries have increased substantially since 2008 and ICES207 has indicated that the current offshore harvest rate is almost as high as the combined harvest rate for lon-glines and driftnets in the mid-2000s. Since the ban, former driftnet fishermen have also started to use semi-drifting, anchored nets instead (see page 54). Currently, the stock is unlikely to reach a 50% survival target for one or two year old salmon in half of the 27 rivers assessed by ICES. Only the stock in eight of the rivers is likely or very likely to reach 50% of the survival rate in the short term. For six rivers the situation is uncertain.
Salmon in in the Gulf of Finland: ICES advises that there should be no fishing of Estonian and Russian wild salmon in the Gulf of Finland208. A reduction in exploitation in the Main Basin needs to be considered as salmon from the Gulf of Finland utilize it as a feeding area.
Salmon in the Main Basin and Gulf of Bothnia: based on the MSY approach, ICES advised a TAC of 54,000 salmon for 2012209.
Despite ICES’ aforementioned TAC recommendation, the Council of Min-isters disregarded the advice, much like they have in previous years, set-ting a TAC more than twice as high at 122,000 salmon. If IUU catches remain at the same level as estimated in 2011, this means that the 2012 quota will be exceeded by an additional several tens of thousands of salmon.
The Swedish board of fisheries has de-cided to phase out salmon fisheries in the Baltic main basin in 2012210.
In 2011, the European Commission proposed establishing a multiannual plan for the Baltic salmon stock and the fisheries exploiting that stock211. This proposed management plan ap-plies to commercial fishing both in the Baltic Sea and to the rivers flowing into it. The proposal’s main aim is to ensure that the salmon stock is exploited in a sustainable way, in line with the prin-ciple of MSY, and that its genetic in-tegrity and diversity are safeguarded. The plan has not yet been adopted.
Sea trout, on the other hand, is main-ly fished in coastal areas and rivers and only to a minor extent in off-shore waters. It is the target of both commercial and recreational fisher-ies. The overall trend of catches has been decreasing since the 1990s from 1,563 tonnes in 1990 to 756 tonnes in 2009. The largest proportion of the to-tal catch is taken from the Baltic Proper, while the Gulf of Bothnia and Gulf of Finland are other important catch areas212.

52
5.2. IUU fishing for salmon and sea trout in the Baltic Sea and the Kattegat
The proportion of mature salmon in-dividuals returning to their natal riv-ers to reproduce has been at low lev-els in recent years213. This is suspected to be due to high levels of IUU fishing for salmon and the misreporting of salmon as sea trout in some fisheries. IUU fishing for Baltic salmon has been a well-known and widely discussed
problem for decades. The ICES work-ing group on Baltic salmon and sea trout estimates unreported landings to be between 355 and 1,700 tonnes per year since 1985.
Figure 7 shows ICES estimates for the real amount of salmon catches per year since 2000. Total reported catches only represent around 50% of the total catch and unreported catches represent around 30% of total catches.
0
500
1000
1500
2000
2500
3000
3500
4000
4500
5000
2000 2001 2002 2003 2004 2005 2006 2007 2008 2009 2010
Tonnes
Year
Total reported catches Recreational catches Discards Unreported catches
Figure 7: ICES estimates for the real amount of salmon catches per year (ICES 2011)214.
Åland Islands fishing vessel Verona, former driftnetter, unloading salmon in Nexø port, Bornholm. Denmark. March 2011. © OCEANA/ LX

Fisheries management in the Baltic Sea
53
catches (Tables 13 and 14). In 2010, an estimated additional 70,511 salmon went unreported or were misreported as sea trout. The catch per unit effort in the Polish offshore fishery indicates large scale misreporting of salmon as sea trout, which constitutes 22% of the ICES estimated total salmon catch216.
Misreporting salmon as sea troutIn its advice on fishing opportunities for 2012, ICES identifies widespread mis-reporting of salmon catches as sea trout in longline fishing in the Baltic Sea. The latest ICES information shows the magnitude of the misreporting by pre-senting estimates of additional Polish
Table 13. Information on IUU fishing from stock assessments (ICES 2011)215.
Stock % IUU/Unallocated landings ICES 2011. Report of the Baltic Fisheries Assessment Working Group
Salmon 22%-50% "Misreporting of catches probably occurs in all different types of fisheries, fisheries zones and countries… Reporting of salmon as sea trout or rainbow trout or even marine rainbow trout, creates an additional source of unreported salmon. Inexplicable inadequacies of basic data exist: i.e. significant differences of tagged fish recapture compared to total catch of salmon by country, significant differences in catch composition in the same fisheries by different countries (proportion of sea trout and salmon in the same fisheries and subdivision)."
Sea trout -37% of the catch in Main Basin, -24% of total catch
"The actual catch of Polish sea trout may be overestimated because due to TAC restrictions salmon is likely reported as sea trout."
Table 14. Total salmon catches in the Main Basin and Gulf of Bothnia (ICES subdivisions 22-31), discard estimates, additional Polish catches estimates, total unreported catches estimates, and total catches estimates between 2005 and 2010217.
Year Reported total
Discard estimation
Estimated additional Polish catches
Total unreported catches, estimation
Total catches, estimation
2005 340,855 54,040 111,396 184,746 605,080
2006 227,468 37,278 45,533 94,388 376,817
2007 217,193 32,024 53,793 101,024 367,467
2008 198,103 32,118 2,282 47,629 292,199
2009 219,270 40,985 63,988 108,818 389,286
2010 167,923 32,837 70,511 107,454 320,015

54
Oceana findings: salmon and seatrout fisheries
The use of driftnets and “semi‑driftnets” in the Baltic Sea
Salmon and sea trout in the Baltic Sea have been caught during the last decades through the use of gillnets, mainly driftnets and set (anchored) gillnets. Gillnets are defined by FAO, as strings of walls vertical, near by the surface, mid-water or on the bottom, on which the fish will gill, entangle, or enmesh. They have a characteristic float line in the upper rope, and weights in the ground line or footrope.
Driftnets are defined by the EU law218 as: “any gillnet held on the sea surface or at a certain distance below it by floating devices, drifting with the current, either independently or with the boat to which it may be attached. It may be equipped with devices aiming to stabilize the net or to limit its drift”. Those nets have been used in Baltic offshore fisheries for salmon and sea trout as driftnets, attached to a boat only at one side and left free to drift with the current. Due to the fact that those nets have a lot of by-catch of unwanted fish, marine mammals and seabirds, driftnets longer than 2.5 kilometres have been banned by the United Nations General Assembly since 1992, in EU waters and for EU vessels since 2002219 and are banned in the Baltic Sea since January 2008220.
The use of driftnets and “semi‑driftnets” in the Baltic Sea
Another type of floating gillnet, with a similar by-catch problem, which in the Baltic Sea includes catches of harbour porpoises and seabirds, is the floating gillnet, which is attached to the sea bottom, typically with an anchor and used in fisheries for salmon and sea trout. These nets, though previously treated legally as driftnets, and originally bound to the same rules as driftnets before the ban, have been exempt from the driftnet ban in the Baltic and have been defined by the European Commission as “set gillnets (anchored)” since 2006. They are also called “semi-driftnets” and are used in Polish and Finnish coastal fisheries221.
Drifting nets for salmon and sea trout in the Vistula River
In the summer of 2011, Oceana documented a number of fishermen from the port of Świbno, in the mouth of the Vistula River, just a few metres from the open Baltic Sea, using driftnets to fish salmon and sea trout. Five hundred meter-long nets, long enough to cover the width of the river, were attached to one boat and left to drift for two hours towards the open sea before being retrieved at the mouth of the river. Five boats form a team and as soon as one net is retrieved, the next net is set222. Before the driftnet ban came into effect in January 2008, Świbno was one of the ports where Polish driftnetters were based223.
Retrieving the net. Artisanal fishermen, fishing salmon and sea trout in the mouth of the Vistula river with a floating net, Świbno, Poland. April 2011. © OCEANA/ LX
Floating net, Świbno, Poland. April 2011. © OCEANA/ LX

Fisheries management in the Baltic Sea
55
Baltic fishing vessels, registered as driftnetters in 2012
Even though “driftnets” are banned in the Baltic Sea, the Belt Seas and the Sound, some 10 to 32 meter long vessels from Latvia, Lithuania and Finland are still officially registered as driftnetters in the EU fleet register224. Three Latvian fish-ing vessels >24 metres are actively fishing in the Baltic Sea, holding a license for cod in 2012, two of them are owned by the Latvian company Lat-Salmon Ltd.225. Table 15 lists information about vessels registered as driftnetters.
Artisanal fishermen, fishing salmon and sea trout in the mouth of the Vistula river with a floating net, Świbno, Poland. April 2011. © OCEANA/ LX
Salmon, caught in a floating net. Świbno, Poland. April 2011. © OCEANA/ LX
Table 15. Information about driftnetters from the European Fleet register (EU fleet register 2012).
Country code Vessel name Port name Call sign Gear main
codeGear sec
codeLength overall Remarks
LVA SĒME RIGA YL2018 GNS GND 31,85 Holds a Latvian license for cod fishing in the Baltic 2012226, Owner: Rabusko227
LVA LAIMDOTA LIEPAJA YLJT GNS GND 26,5 Holds a Latvian license for cod fishing in the Baltic 2012, Owner: Lat-Salmon Ltd
LVA DZINTARI LIEPAJA YLJU GNS GND 26,5 Holds a Latvian license for cod fishing in the Baltic 2012, Owner: Lat-Salmon Ltd
FIN M/S MERILINTU UUSIMAA OF2605 LLD GND 14,6
Registered as a driftnetter since 1995, changed registry to set-gillnets in January 2008 and back to driftnets in January 2010228.
FIN DELFIN TURKU OF2619 GND GNS 10,97Registered as a driftnetter since 1995, changed registry to set-gillnets in January 2008 and back to driftnets in January 2011229.
LTU KOPGALIS KLAIPEDA LYBB GNS GND 14,6 Inactive
Gear code: GNS/ set gillnet (anchored), GND/ drift nets, LLD/ drifting longline.

56
In addition to the vessels of 10 metres or more in length described in the table above, several hundred shorter Danish vessels are still registered as driftnetters in the European fleet register. Most are currently in small ports in the Belt Seas and the Sound230. These vessels use small meshed nets and do not target salmon and sea trout specifically.
Semi‑driftnetters
In January 2005, Finland had 81 registered salmon driftnetters of more than 10 metres in length, most of which were in the harbours of Turku, Uusimaa and the Aland Islands231. Today, some of the driftnetters have either been re-tired or exported but most of the fleet changed their gear in the EU register on January 1st 2008 from driftnets to “set gillnets (anchored)”. Before 2008, when the driftnet ban was enforced, one of the centres for offshore driftnet-ters targeting salmon was the Aland Islands, an autonomous region in Finland, where today a number of the so called “semi-driftnetters” are still active232.
Environmental organisations and the Swedish board of fisheries have requested a change in the definition of driftnets in the EU regulation, to include “semi-driftnets” into the driftnet ban:
The former Swedish Board of Fisheries: “It is crucial to keep the present article 9 regarding the prohibition to fish with driftnets and it should be ensured that similar gears which are fixed to the bottom with the use of anchors will not be permitted to use. Therefore it might be necessary to review the definition for driftnets or to develop a specific definition for the types of similar gears which could be a threat for the recovery of weak salmon populations in the southern part of the Baltic Sea”.233
Latvian fishing vessels, Laimdota and Dzintari, registered with driftnets fishing gear in the port of Liepaja, Latvia. May 2011. © OCEANA/ LX

Fisheries management in the Baltic Sea
57
A fleet of former driftnetting vessels, registered since January 2008, with set gillnets (anchored), similar to the vessels, based in the Finnish Aland Islands shown above is operating from the harbours of Jastarnia and Hel in the Hel Peninsula, which separates the Puck Bay from the Baltic Sea.
Fishing vessel registered as a driftnetter until the driftnet ban came in force, than changed registration to set gillnets (anchored), Åland Islands, Finland. May 2011. © OCEANA/ Carlos Suárez
Fishing vessel registered as a driftnetter until the driftnet ban came in force, than changed registration to set gillnets (anchored), Åland Islands, Finland. May 2011. © OCEANA/ Carlos Suárez
Åland Islands fishing vessel Verona, former driftnetter, unloading salmon in Nexø port, Bornholm, Denmark. March 2011. © OCEANA/ LX
Åland Islands fishing vessel Verona, former driftnetter, unloading salmon in Nexø port, Bornholm, Denmark. March 2011. © OCEANA/ LX
Åland Islands fishing vessels in the port of Nexø, Bornholm. March 2011. © OCEANA/ LX
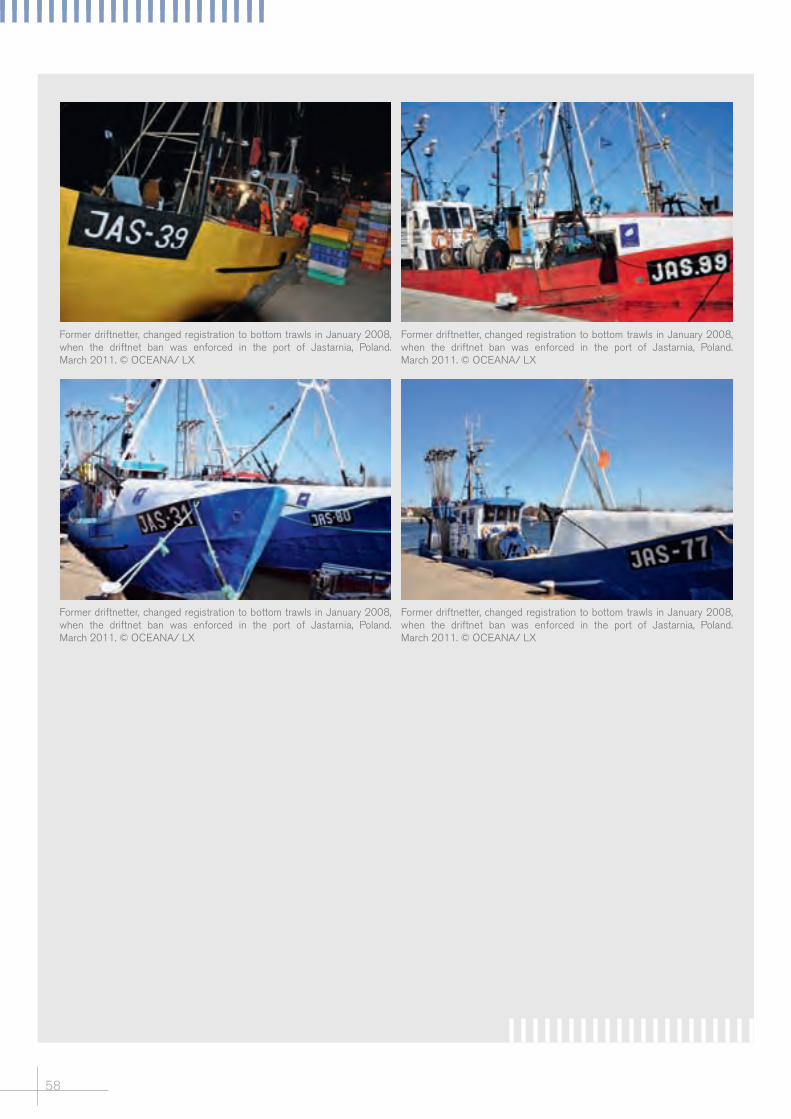
58
Former driftnetter, changed registration to bottom trawls in January 2008, when the driftnet ban was enforced in the port of Jastarnia, Poland. March 2011. © OCEANA/ LX
Former driftnetter, changed registration to bottom trawls in January 2008, when the driftnet ban was enforced in the port of Jastarnia, Poland. March 2011. © OCEANA/ LX
Former driftnetter, changed registration to bottom trawls in January 2008, when the driftnet ban was enforced in the port of Jastarnia, Poland. March 2011. © OCEANA/ LX
Former driftnetter, changed registration to bottom trawls in January 2008, when the driftnet ban was enforced in the port of Jastarnia, Poland. March 2011. © OCEANA/ LX

Fisheries management in the Baltic Sea
59
6. Herring and sprat
Unloaded sprats in the port of Hel, Poland. In Poland, sprats are processed and appreciated as canned food. In Poland, sprats are not processed into fishmeal or animal food. March 2011. © OCEANA/ LX

60
6.1. Herring and sprat fisheries and management in the Baltic Sea and the Kattegat
There are several stocks of herring in the Baltic Sea. The spring spawning Rügen herring spawns in the west-ern part of the Baltic Sea, near the German island of Rügen, before mi-grating to the Skagerrak and the north-ern part of the North Sea in search of food. There, they are mixed with the North Sea herring (which spawn in the autumn), and both are heavily fished. Before returning to Rügen in spring, Rügen herring spend the winter in the Sound and the Great Belt234,235,236. The herring in the inner Baltic Sea is generally smaller than other herrings (20-25 cm long), and reach sexual ma-turity at 2-3 years old237.
Herring stocks in the Baltic Sea and the western Baltic spring spawning herring are fished both above MSY, unsustainably in relation to the pre-cautionary approach. The state of the stock in the Bothnian Bay is unknown and only the stock in the Bothnian Sea is fished appropriately relative to MSY. Autumn-spawning Baltic her-ring populations have decreased since the 1960s, when they used to be abun-dant. Especially in the Baltic Proper, the Gulf of Finland, and the Gulf of
Riga the condition of the herring has worsened since the 1980s.
Herring stocks in the Baltic are man-aged by four TACs that were largely set according to scientific advice for 2012:
· Baltic Sea subdivisions 30-31 (Gulf of Bothnia)
· Baltic Sea subdivisions 22-24 (West-ern Baltic)
· Baltic Sea subdivisions 25-27, 28.2, 29, 32 (Eastern Baltic Sea except Gulf of Bothnia)
· Baltic Sea subdivision 28-1 (Gulf of Riga)
Herring is mainly fished by mid-water trawlers in the Baltic Sea and particu-larly in the Baltic Proper238, but it is also frequently caught by bottom trawlers. In coastal areas herring is caught us-ing other methods, namely trapnets, poundnets, and gillnets. Finnish fisher-ies target adult herrings with bottom trawlers and use pelagic trawling to catch the younger part of the stock.
Since the 1980s herring landings in the Main Bain and subdivisions 22-29, and 32 had decreased from around 400,000 tonnes to 126,155 tonnes in 2008, which was actually an 8% in-crease from 2007. In the central Baltic the amount of landings is uncertain, as herring is mostly caught in mixed fish-eries together with sprat239.
In contrast, herring populations in the Gulf of Bothnia have increased in size since the 1980s from slightly more than 20,000 tonnes to around 70,000 tonnes at the end of the last decade. Accord-ing to ICES, the herring catch in sub-divisions 22-24 has on average made up 53,6% of the total stock of spring spawners between 2000 and 2008240.
The minimum landing size for herring is 20 cm in the North Sea and 18 cm in the Skagerrak and the Kattegat, but none exists for herring in the Baltic Sea241.
Unloading of sprats from Danish trawler for animal food production in the port of Nexø, Bornholm, Denmark. March 2011. © OCEANA/ LX
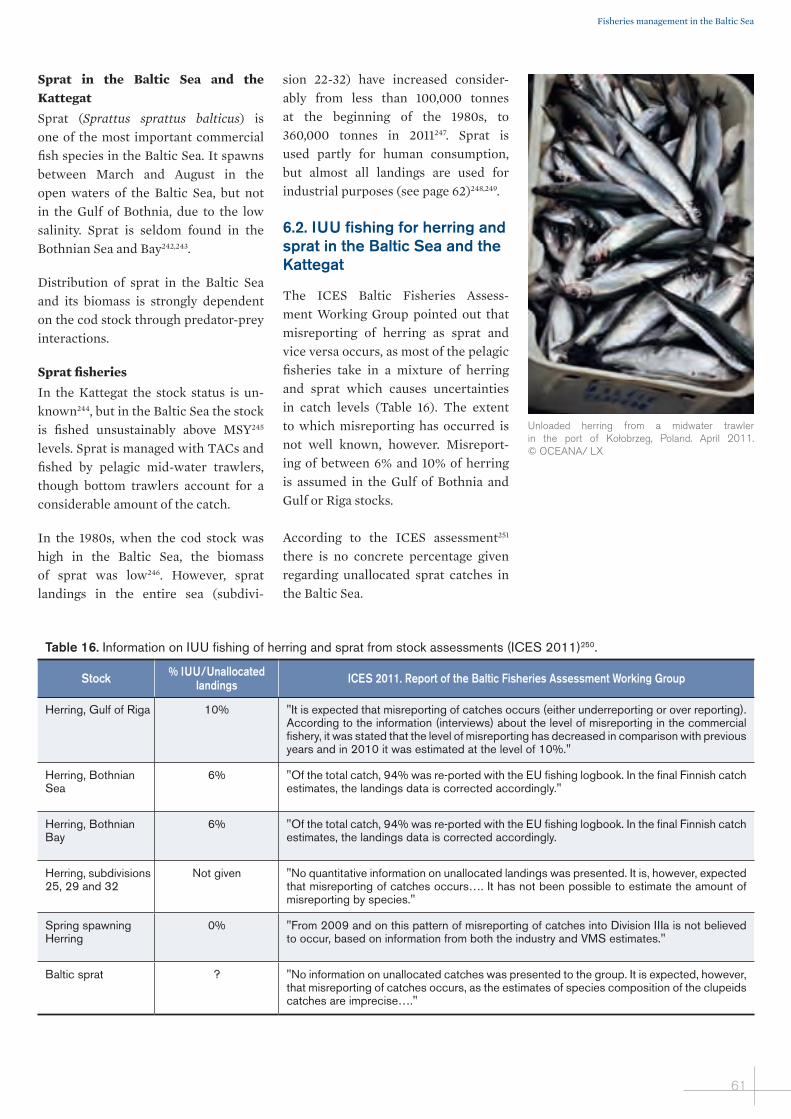
Fisheries management in the Baltic Sea
61
Sprat in the Baltic Sea and the Kattegat
Sprat (Sprattus sprattus balticus) is one of the most important commercial fish species in the Baltic Sea. It spawns between March and August in the open waters of the Baltic Sea, but not in the Gulf of Bothnia, due to the low salinity. Sprat is seldom found in the Bothnian Sea and Bay242,243.
Distribution of sprat in the Baltic Sea and its biomass is strongly dependent on the cod stock through predator-prey interactions.
Sprat fisheries
In the Kattegat the stock status is un-known244, but in the Baltic Sea the stock is fished unsustainably above MSY245 levels. Sprat is managed with TACs and fished by pelagic mid-water trawlers, though bottom trawlers account for a considerable amount of the catch.
In the 1980s, when the cod stock was high in the Baltic Sea, the biomass of sprat was low246. However, sprat landings in the entire sea (subdivi-
sion 22-32) have increased consider-ably from less than 100,000 tonnes at the beginning of the 1980s, to 360,000 tonnes in 2011247. Sprat is used partly for human consumption, but almost all landings are used for industrial purposes (see page 62)248,249.
6.2. IUU fishing for herring and sprat in the Baltic Sea and the Kattegat
The ICES Baltic Fisheries Assess-ment Working Group pointed out that misreporting of herring as sprat and vice versa occurs, as most of the pelagic fisheries take in a mixture of herring and sprat which causes uncertainties in catch levels (Table 16). The extent to which misreporting has occurred is not well known, however. Misreport-ing of between 6% and 10% of herring is assumed in the Gulf of Bothnia and Gulf or Riga stocks.
According to the ICES assessment251 there is no concrete percentage given regarding unallocated sprat catches in the Baltic Sea.
Unloaded herring from a midwater trawler in the port of Kołobrzeg, Poland. April 2011. © OCEANA/ LX
Table 16. Information on IUU fishing of herring and sprat from stock assessments (ICES 2011)250.
Stock % IUU/Unallocated landings ICES 2011. Report of the Baltic Fisheries Assessment Working Group
Herring, Gulf of Riga 10% "It is expected that misreporting of catches occurs (either underreporting or over reporting). According to the information (interviews) about the level of misreporting in the commercial fishery, it was stated that the level of misreporting has decreased in comparison with previous years and in 2010 it was estimated at the level of 10%."
Herring, Bothnian Sea
6% "Of the total catch, 94% was re-ported with the EU fishing logbook. In the final Finnish catch estimates, the landings data is corrected accordingly."
Herring, Bothnian Bay
6% "Of the total catch, 94% was re-ported with the EU fishing logbook. In the final Finnish catch estimates, the landings data is corrected accordingly.
Herring, subdivisions 25, 29 and 32
Not given "No quantitative information on unallocated landings was presented. It is, however, expected that misreporting of catches occurs…. It has not been possible to estimate the amount of misreporting by species."
Spring spawning Herring
0% "From 2009 and on this pattern of misreporting of catches into Division IIIa is not believed to occur, based on information from both the industry and VMS estimates."
Baltic sprat ? "No information on unallocated catches was presented to the group. It is expected, however, that misreporting of catches occurs, as the estimates of species composition of the clupeids catches are imprecise…."

62
Herring and sprat fishing for fishmeal and animal food
While fishermen in Denmark on average make €437 per tonne of herring meant for human consumption, they only made €194 per tonne when it was going towards industrial uses in 2010. In Germany, Baltic herring is a highly appreciated specialty, and in Lithuania it is regarded as a national heritage food. In Denmark, one tonne of sprat for human consump‑tion brings in €280 and €197 for industrial uses like animal food or fishmeal252. Sweden transforms 50% of herring and 75% of sprat landed in their ports into animal food or fishmeal; Finland transforms 70% of herring and 100% of sprat landings and Lithuania uses herring and sprat only for fishmeal. Denmark, which transforms 30% of herring and 100% of sprat landings, is the largest producer of fishmeal, while in Poland no fish is used to produce fish meal253.
Besides the economic disadvantages of much lower landing values for fish that can also be sold for direct human con‑sumption, and the complete or net loss of protein for human food254, mid‑water trawl fisheries for fishmeal in the Baltic Sea are also inherently unsustainable because the net mesh sizes used to catch herring and sprat are very small. As a result, there are by‑catches of juveniles and of non‑target species, particularly of cod.
Fish for industrial uses is transformed, in most cases, as a compound food ingredient for feeding other animals. Herring and sprat from countries around the Baltic Sea is used as animal food in highly controversial Scandinavian and Russian mink farms ‑ a use that reflects a complete loss of the resource as a source of food and protein for human consumption.
The Danish animal food factory Fish Pro, producing mink food for fur farms from Baltic sprat, in Nexø harbor, Bornholm, Denmark. March 2011. © OCEANA/ LX
Bornholm mink feed central in the port of Nexø, Bornholm, Denmark. March 2011. © OCEANA/ LX
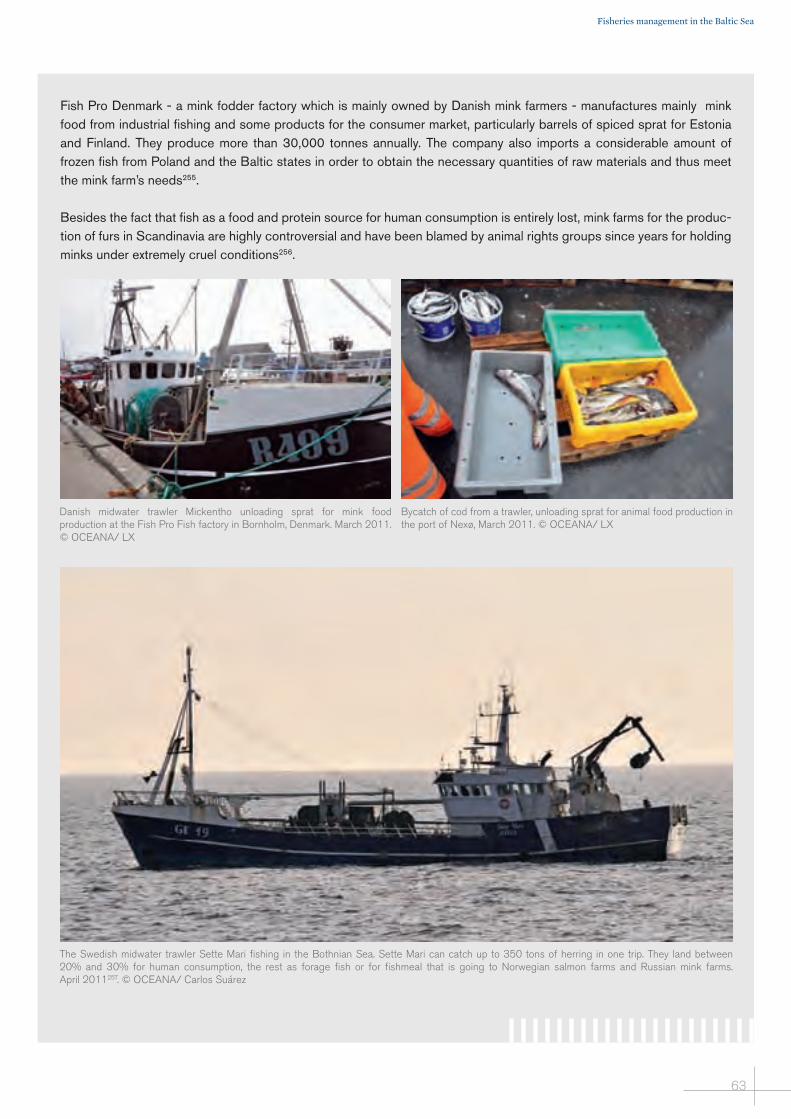
Fisheries management in the Baltic Sea
63
Fish Pro Denmark ‑ a mink fodder factory which is mainly owned by Danish mink farmers ‑ manufactures mainly mink food from industrial fishing and some products for the consumer market, particularly barrels of spiced sprat for Estonia and Finland. They produce more than 30,000 tonnes annually. The company also imports a considerable amount of frozen fish from Poland and the Baltic states in order to obtain the necessary quantities of raw materials and thus meet the mink farm’s needs255.
Besides the fact that fish as a food and protein source for human consumption is entirely lost, mink farms for the produc‑tion of furs in Scandinavia are highly controversial and have been blamed by animal rights groups since years for holding minks under extremely cruel conditions256.
Danish midwater trawler Mickentho unloading sprat for mink food production at the Fish Pro Fish factory in Bornholm, Denmark. March 2011. © OCEANA/ LX
Bycatch of cod from a trawler, unloading sprat for animal food production in the port of Nexø, March 2011. © OCEANA/ LX
The Swedish midwater trawler Sette Mari fishing in the Bothnian Sea. Sette Mari can catch up to 350 tons of herring in one trip. They land between 20% and 30% for human consumption, the rest as forage fish or for fishmeal that is going to Norwegian salmon farms and Russian mink farms. April 2011257. © OCEANA/ Carlos Suárez

64
7. Recreational fisheries
German recreational fishing vessel, Karoline, fishing south of Fehmarn, Germany. May 2011 . © OCEANA/ Carlos Suárez

Fisheries management in the Baltic Sea
65
7.1. Unreported recreational fisheries in the Baltic Sea and the Kattegat
Recreational fisheries from the shore, from fishing boats, from offshore rec-reational fishing boats and with differ-ent kinds of nets are widespread in the Baltic Sea. Recent studies show that the quantity of fish caught by recrea-tional fishermen has previously been underestimated and give a more realis-tic view of the real amount.
There is no data available on the true volume of fish caught by anglers, who are not obliged to report any catches in the Baltic area. In principle, angling from fishing boats, a practice called “trolling” in commercial fisheries is a highly selective and sustainable fish-ing practice and it should certainly be a technique for commercial fishing ves-sels to consider when phasing out de-structive methods like bottom trawling for cod. Fishing with small artisanal nets is also in principle an environmentally friendly and sustainable fishing meth-od. However, the fact that recreational fisheries are largely unregulated and catches are largely unreported poses a big problem for fisheries management in the Baltic Sea.
When it comes to sport and recreation-al fishing in Poland, in addition to the lack of an obligation to report catches, one of the main problems is the insuf-ficient number of inspections. Accord-ing to the calculations of some fisher-men, recreational catches of Baltic cod may exceed 10,000 tonnes258. In 2006, the National Marine Fisheries Research Institute estimated the figure at be-tween 4,000 and 7,000 tonnes for the entire Baltic Sea259.
One of the widely recognised problems with recreational fisheries in Poland is the fact that anglers catch undersized fish. But Poland is the only Member State that limits recreational fish-
ing for cod in the Baltic Sea - anglers can fish up to 7 individuals per day. This encourages foreign fishing trips, mainly to Denmark in order to fish for cod, as there are no bag limits in force. It is not unheard of for Polish anglers to then sell the fish they catch at the market, which is illegal under Polish legislation260.
Recreational fisheries also have very high catches in Denmark and Germany. The Danish AgriFish Agency launched a control program to evaluate the state of recreational fisheries when it comes to IUU activities. The conclusion was that even though it is illegal for rec-reational fishermen to sell fish caught when angling, it still ends up on the market. Another problem Denmark is facing is the practice of unlicensed fish-eries. Approximately 300,000 people engage in recreational fishing activities in Denmark per year. Based on data col-lected from anonymous interviews, it was estimated that between 23% and 28% of all Danish angler and passive gear fishermen fished without license, though with lower effort levels than fishermen with an annual license261.
According to a German study, 113,000 to 147,000 people fish cod along the German Baltic coast for a combined total of 880,000 to 1,500,000 an-gling days annually. Depending on the angling method and year, two to five million cod are caught in recrea-tional fisheries annually, which trans-lates into 1,900 to 5,200 tonnes a year. This represents roughly 50% of the commercial German catch of cod from the same area262. These estimates are made without taking any illegal activi-ties into account.
A recent Danish study on recreation-al fishing for eel, sea trout and cod in the Baltic Sea found that the per-centage of cod catches is extremely high in the Sound and the Kattegat. Recreational fishing in 2010 accounted

66
for 41% of the total Danish Western Baltic Sound cod yield and angling alone for 37%. The angling catch may be even higher, since the numbers re-ported were converted into weight by assuming an average mass of 1500 g. The average weight of cod caught and kept by anglers in the Sound is likely a little higher, at least during the win-ter when spawning fish are targeted and fish larger than 10 kg are caught regularly263. In the Kattegat, 36% of total reported cod catches come from recreational fishermen.
In Denmark, 20% of the total eel catch and a suggested 90% of the sea trout catch comes from Danish recreational fishermen. Recreational fishing also accounts for approximately a quar-ter of the total salmon caught in the Baltic Sea region and nearly one half of the catch taken from the shore or rivers. These catches are not included in fishing quota calculations.
Trolling by recreational fishing ves-sels, mostly for cod, is becoming more and more popular in the Baltic, espe-cially on spawning aggregations in the Danish and German waters of the Belt Sea. This type of recreational fishing, often from fishing vessels that are more than 24 metres long, is also allowed in areas that are closed to protect cod and during the month of April, when the entire Western Baltic is closed to protect cod spawning aggregations.
7.2. Poaching
In 2010, the Danish AgriFish Agency identified 305 cases of fishing rule vio-lations in recreational fisheries. More than half of the cases involved gillnets (162 cases), and 112 cases involved traps. The locations with most cases in 2010 were Bornholm (34 cases), Isefjorden (29), Roskilde fjord (27), Smålandsfarvandet (in the Belt Sea) (23), the Sound (20), Læsø (20), the southern part of Fyn (19), and the eastern coast of South Jutland (16)264. Tables 17 and 18 show some typi-cal cases of poaching from Denmark, Sweden and Poland.
Table 17. Information on IUU fishing from media reports and country information (2011, 2012).
Area Date Case
Denmark, Bornholm265 2012 Fished in closed area. Illegal gear. Fine of 7,500 DKK. Fishing ban for 6 months.
Denmark, Sjælland266 2011 Angler sold his catch of eel and trout. Conviction in progress.
Denmark, The east coast of Sønderjylland267
2011 Several cases of illegal recreational fishing in Sønderjylland. Until July (23.07.2011) there were 38 cases of illegal fishing, compared to 50 in the whole of 2010. 102 nets and traps were confiscated until July 2011.
Denmark, Bornholm268 06.05.2011 In May 2011, the Danish AgriFish Agency found a lot of illegal fishing along the coast of Bornholm. Observers confiscated 40 nets and 11 hocklines within a few days. It is illegal to fish with hocklines between May 1st and September 30, and between May 10th and July 31st, it is illegal to fish with traps, unless special permission has been granted.
Denmark, Fyn269 23.04.2010 Inspectors found no less than 39 traps in a conservation belt in Helnæs in November 2010, later they found more traps that had caught 50 trouts. The inspectors believed they were probably meant for selling, which is illegal.
Sweden, Kattegat270 29.12.2011 A poacher was fined for using illegal fishing gear to catch eel in Barsebäck.
Denmark, Bornholm271 08.03.2012 An angler fished with hook line during closed season. In addition, some fishing nets were not labelled in a lawful manner. The angler received a conviction consisting of a fine on 7,500 DKK, confiscating of nets, and a ban on doing angling fishery for 6 months.

Fisheries management in the Baltic Sea
67
Table 18. Information on IUU fishing from media reports and country information (2011, 2012).
Area Date Case
Poland, Gulf of Gdansk272
23.11.2011 Poaching: More than half-a-tonne of fish caught illegally with nets. Four poachers were captured by the Maritime Border Guard. Fifty sets of poaching nets with a total length of over two kilometres, and about half-a-tonne of illegally caught fish were confiscated.
Poland, Notec River273 18.08.2011 Poachers did not have the appropriate permits to catch fish and had up to 18 pieces bundles and nets (wontons). Coast guards stopped them from fishing from a pontoon in Rożniaty (commune Kruszwica).
Poland, Szkarpawa, Vistula Królewiecka, Tugi and Nogat rivers274
06.07.2011 In 2011 more poachers’ nets were recovered in Szkarpawa, Vistula Królewiecka, Tugi and Nogat rivers than in 2010. Illegal traps were also found. In 2011, poachers were hit with 29 fines and paid total of 41,000 PLN. As many as 12 of the cases went to court. 32 inspections were carried to find cases of poaching and illegal fishing.
Poland, Vistula river275 18.02.2012 Five men with illegal fishing equipment and using illegal techniques were arrested. In total, police seized 32 kg of fish (bream and perch), and confiscated their certification and equipment. They face up to 3 years imprisonment.
Oceana findings: Angling boats, flags of convenience etc.
During the expedition in 2011, Oceana documented many fishing vessels, mainly from Germany, Denmark and Poland carrying out “recreational” fisheries for cod and herring. Those vessels fish outside EU fisheries regulations, without catch limits and without being required to report their catches. Along the German Baltic coast alone, according to the recrea-tional anglers homepages, more than 80 cutters, so called “Fischkutter” offer angling tours in the Baltic Sea276, usually from six to 11 months a year277. They can take up to 50 anglers on board in a day trip and go out every day, weather permitting. Anglers on a typical German Fischkutter, the “Tuemmler” for example, caught 80 tonnes of cod in 2011278. The Tuemmler for example is also registered as a fishing vessel in the European fleet register, thus defined as vessels equipped for commercial fisheries279.
Recreational fishing vessels
German recreational fishing vessel, Südwind, fishing south of Fehmarn, Germany. May 2011280. © OCEANA/ Carlos Suárez

68
German recreational fishing vessel, Karoline, fishing south of Fehmarn, Germany able to take up to 50 anglers onboard fishing cod281. May 2011. © OCEANA/ Carlos Suárez
German recreational fishing vessel, Silverland, fishing near Fehmarn, Germany able to take up to 55 anglers onboard fishing cod on daytrips throughout the year282. May 2011. © OCEANA/ Carlos Suárez

Fisheries management in the Baltic Sea
69
German recreational fishing vessel Antares, sailing near Fehmarn, Germany able to take up to 55 anglers onboard fishing cod, flatfish or herring on daytrips throughout the year283. May 2011. © OCEANA/ Pitu Rovirosa
The Polish “recreational” fishing vessel UST 124 in the harbour of Ustka and entering the harbour of Ustka, May 2011. According to the EU fleet register this vessel was scrapped using EU fishing subsidies in 2011. © OCEANA/ LX

70
8. Conclusions and recommendations
Pile of crates for fish in the port of Nexø, Bornholm, Denmark. March 2011. © OCEANA/ LX

Fisheries management in the Baltic Sea
71
EU Member States have committed to fish sustainably, recover fish stocks to the Maximum Sustainable Yield by 2015 and are bound by the Marine Strat-egy Framework Directive to achieve Good Environmental Status of the EU marine waters by 2020. Past decades of unsustainable fishing practices have put fish stocks in the Baltic Sea and the Kattegat in danger, and some of them are threatened. In addition, overfish-ing and destructive fishing practices have damaged many important habi-tats and communities throughout the Baltic Sea area.
In this report Oceana shows, that de-spite some positive developments in the past years (like some recovery of the eastern Baltic cod stock), a number of unsustainable fishing practices, both legal and illegal, unreported and unregulated still persist in the Baltic Sea. In order to achieve the agreed tar-gets, Oceana recommends a number of measures for environmentally sus-tainable fisheries management. These include phasing out all destructive fishing practices and the fishing of endangered species, as well as bet-ter monitoring, control and surveil-lance and enforcement of existing laws. Oceana requests strict fisheries man-agement measures inside and outside marine protected areas, to safeguard not only fish stocks but also the entire Baltic Sea ecosystem, the fishing in-dustry, fishing communities and fish-ermen. The Common Fisheries Policy, currently under reform, has the key role in defining ecological sustain-ability as the main aim of EU fisheries policy. The sustainability of the social and economic aspects of fisheries can only be achieved by first accomplishing ecological sustainability.
In order to restore Baltic Sea fish stocks and the Baltic ecosystem, Oceana pro-vides the following recommendations.
Recommendations for all fisheries in the Baltic Sea
· Ensure the management of all com-mercially exploited fish species, moving away from a single species approach and applying an ecosys-tem-based approach to fisheries management. Management plans and TACs should be introduced for all commercially caught species in the Baltic. The precautionary approach to the management of species has to be applied for species with missing fisheries data, or for which scientific assessments are incomplete. Urgent measures have to be taken to achieve Good Environmental Status by 2020 as requested in the Marine Strategy Framework Directive.
· Immediately stop fishing for endan-gered species in the Baltic Sea. Ban all eel fisheries in the Baltic Sea and rivers until the European eel has recovered from its almost depleted state.
· Support and expand Baltic Sea ar-tisanal fisheries. Artisanal fisheries provide more employment than their commercial counterparts, are more environmentally friendly, do not de-stroy the Baltic ecosystem further, are more selective, land high value fresh fish and have a high touristic value.
· Prohibit all destructive fishing meth-ods, including dredging and trawling, in the Baltic Sea. Develop a time-frame for the conversion of these destructive and low selective fishing methods to ones that are more envi-ronmentally friendly and highly se-lective in the Baltic Sea and the Kat-tegat.
· Improve the selectivity of all fishing gears used in the Baltic Sea to pre-vent the by-catch of non-target fish species, marine mammals and birds.

72
· Improve monitoring, control and surveillance in all Baltic Sea coun-tries. Real time satellite monitoring (VMS ) should be implemented for all active fishing vessels, specifically for the ones fishing in MPAs.
· No tolerance of any kind of IUU fish-ing: enforce fisheries regulations rig-orously and treat IUU fishing as an environmental crime.
· Manage recreational fisheries. Re-port all recreational fisheries catches of in all Baltic Sea countries and the Kattegat. Recreational fisheries have to respect closed areas and seasons. Recreational catches should count against the quota allocated for each Member State.
· National governments should imme-diately develop their own national conservation and fisheries manage-ment measures inside the national 12 nautical mile zone as established by the Common Fisheries Policy in order to protect biodiversity inside and outside of MPAs.
· National governments should also implement conservation and fisher-ies management measures inside the whole EEZ for their fleets that are more stringent than Community leg-islation.
· Implement of a set of measures that have been proven effective to prevent discards in other fisheries: oblige the landing of all catches, implement a Best Available Technologies (BAT) approach, improve the selectivity of fishing gears; spatial management: closing areas in real time, closed sea-sons, obligation to change fishing grounds and creation of preferential access zones; prohibit high grading effectively.
· Fisheries not intended for direct hu-man consumption should be stopped in the Baltic Sea.
· Salmon fishing in the open Baltic Sea should be banned and only rivers with viable populations should be allowed when they migrate back to the sea to ensure the genetic diver-sity of the stocks.
Recommendations for fisheries inside Marine Protected Areas
Oceana urges that the following fish-eries management measures be imple-mented inside Marine Protected Areas.
· MPAs should in general consist of two zones: no-take zones and buffer zones:
‑ No-take zones are closed for fisher-ies and all types of human activity except for scientific research activi-ties.
‑ In the buffer zone, low-impact ac-tivities (artisanal fishing, scuba div-ing, etc.) could be allowed when carefully managed.
· MPAs need to be large enough to allow the establishment of no take zones. If the MPAs are too small for this, no fishing should be allowed.
· No-take zones are expected to pro-duce the following benefits as a result of the elimination of fishing:
‑ Increase of abundance and density of commercial species with reduced mobility.
‑ Increase of average size, especially for long-living species with slow growth rates and large maximum sizes.
‑ Recovery of the shallower areas be-ing more vulnerable to fishing pres-sure by both recreational and com-mercial fisheries.
‑ Improvement of the quality of habi-tats within the protected area com-pared to the outside by the removal of disruptive human activities.
‑ Increase in the size and number of species with longer migratory dis-tances because of improved habitat quality and abundance of food.
‑ Contribution to the neighbouring areas because of a spillover effect.

Fisheries management in the Baltic Sea
73
· Trawling, dredging and any other fishing with towed gears should be prohibited in MPAs.
· Recreational fisheries should be ef-fectively controlled and widely re-stricted inside MPAs.
Recommendations for the Common Fisheries Policy:
· The Common Fisheries policy should prioritise ecological sustainability: The sustainability of social and eco-nomic aspects of fisheries can only be achieved by first accomplishing ecological sustainability and there-fore minimising the existing/poten-tial adverse impacts and pressures of fisheries activities, while at the same time allowing the recovery of stocks or populations that are depleted or at risk of depletion. Securing eco-logical sustainability will result in long-term beneficial economic and social outcomes for the fishery sector and other coastal activities (such as tourism).
· The Common Fisheries Policy should apply an ecosystem‑based approach to the management of fishing activi‑ties: Restoring ocean ecosystems, in-cluding rebuilding marine biodiver-sity and allowing species to recover from exploitation, requires moving away from fisheries management based on the single species approach. Instead, what is needed is manage-ment of the entire ocean ecosystem, which aims to stop biodiversity loss and rebuild the natural diversity of the oceans, thereby enhancing their resilience. Given that the Marine Strategy Framework Directive Arti-cle 13 states that good environmen-tal status shall be reached by apply-ing an “ecosystem-based approach” to fisheries management, the future CFP must make a significant step for-ward and apply an ecosystem-based approach.
· The Common Fisheries Policy should implement a science‑based approach: Over the last 20 years, ICES has pro-duced over 1,500 scientific opinions for the EU and other governments in the Northeast Atlantic for the correct management of fish stocks. However, only 350 (22%) have been properly translated into effective catch limits – 78% of scientific rec-ommendations on TACs for Europe-an Union fish stocks have been con-tinuously ignored. When the Council of Fish Ministers decided on fishing opportunities for 2011, it still ignored approximately 35% of the scientific recommendations made by ICES.
· The Common Fisheries Policy should effectively apply the precautionary approach: The ecosystem approach to fisheries management must apply the precautionary approach, which mainly involves applying precau-tionary management measures when there is a lack of scientific knowledge or advice. Fisheries must not operate without management measures and new fisheries should only operate when there is proof that they do not harm the ecosystem.
· The Common Fisheries Policy should implement a flexible approach based on the protection of Essential Fish Habitats: In recent years, the deg-radation of marine aquatic habitats essential for healthy fish populations has increasingly been recognised as a global concern. Consequently, the importance of habitat manage-ment within fisheries management is being increasingly viewed as a key component of an ecosystem-based approach. Essential Fish Habitats are the fragile and vital marine habitats that need to be protected due to their vital role in support-ing the biological needs of fish spe-cies (e.g., spawning, nursery, and feeding grounds). The concept of Essential Fish Habitats is a useful ecosystem-based management tool

74
for limiting fishing mortality and the environmental impacts of fishing ac-tivities.
· The Common Fisheries Policy should end the wasteful practice of discards: In Europe, around 1.3 million tonnes of marine fish are discarded every year, representing 13% of total catch-es. Because in most cases discards do not survive, this practice under-mines the health of stocks and jeop-ardises future yields, threatening the long-term economic sustainability of European fisheries.
· The Common Fisheries Policy should ensure the management of all com‑mercially exploited species: Several hundred marine species are com-mercialised in the European Union. However, only a small fraction is actually managed, and unmanaged species represent a significant pro-portion of total landings in the EU. This single fact strongly hampers the implementation of all of the key principles that should guide the fu-ture CFP. Therefore, in order to be consistent with the Marine Strategy Framework Directive, the renewed CFP should guarantee that all ex-ploited fish stocks be managed.
· The Common Fisheries Policy should ensure consistency with international and European objectives for biodiver‑sity protection: The Common Fisher-ies Policy must integrate the objec-tives set forth in other biodiversity laws and conventions, in order to secure both the ecological sustain-
ability of the seas and the long-term viability of fisheries activities. The CFP should be consistent with the objectives of the Habitats Directive, the Marine Strategy Framework Directive, Convention on Biological Diversity, the Barcelona Convention, the Helsinki Convention, the OSPAR Convention, and the Convention on the Conservation of Migratory Species.
· The Common Fisheries Policy should ensure that Good Environ‑mental Status be achieved by 2020: The Marine Strategy Framework Directive sets a binding roadmap to achieve GES in European seas by 2020. This requirement identifies clear boundaries concerning fisheries activities to be carried out in Europe-an seas. Oceana recommends that the renewed CFP place at its core the tar-get of achieving GES by 2020, in or-der to be consistent with the Marine Strategy Framework Directive.
· The Common Fisheries Policy should compel Member States to control and enforce fishing rules: Even the best text for a renewed CFP will fail if Member States do not ensure that fishermen follow the rules. In fact, every year, the European Commis-sion reports an increasing number of infringements against the Common Fisheries Policy. The lack of political will to ensure compliance is one of the primary reasons for the failure of the CFP of 2002.
Artisanal fishing vessel at the beach in Orłowo, Poland. April 2011. © OCEANA/ LX

Fisheries management in the Baltic Sea
75
References
Vessels moored in the harbor of Kuźnica, Poland. April 2011. © OCEANA/ LX

76
1. Introduction: Fisheries in the Baltic Sea 1 MacKenzie, B., Alheit, J., Conley, D., Holm, P., Kinze, C. K. 2000. Ecological hypotheses for a historical reconstruction of upper trophic level biomass
in the Baltic Sea and Skagerrak. Canadian Journal of Fisheries and Aquatic Sciences. http://hmapcoml.org/documents/Baltic/mack.pdf
2 HELCOM. A historic view of Baltic fisheries, Helsinki Commission website. http://www.helcom.fi/environment2/biodiv/fish/en_GB/history/
3 MacKenzie B. 2005. Anthropogenic impacts on the Baltic Sea: problems and solutions. Presented at International Conference on Biodiversity Science and Governance, Paris, France; Jan. 24‑28, 2005. http://www.ifremer.fr/gascogne/actualite/colloque/atelier‑biodiversite/G‑at10‑MacKENZIE.pdf
4 Eero M. 2008. Dynamics of the eastern Baltic cod (Gadus morhua) stock in the 20th century under variable climate and anthropogenic forcing; Ph. D. thesis. University of Southern Denmark Faculty of Humanities and Technical University of Denmark National Institute of Aquatic Resources.
5 HELCOM. A historic view of Baltic fisheries, Helsinki Commission website: http://www.helcom.fi/environment2/biodiv/fish/en_GB/history/
6 ICES. ICES Areas, statistical rectangles and EcoRegions. http://www.ices.dk/aboutus/icesareas.asp
7 Skagerrak is not part of the Baltic Sea. For the purpose of this report Kattegat is considered as part of the Baltic Sea unless stated otherwise.
8 HELCOM, 2010. Ecosystem Health of the Baltic Sea 2003‑2007: HELCOM Initial Holistic Assessment. Balt. Sea Environ. Proc. No. 122. http://www.helcom.fi/stc/files/Publications/Proceedings/bsep122.pdf
9 HELCOM. Assessing the state of the Baltic Sea environment, Helsinki Commission website: http://www.helcom.fi/environment/assessment/en_GB/assessment/
10 Eurostat/ICES database on catch statistics ‑ ICES 2011, Copenhagen.
11 The ICES Baltic Fisheries Assessment Working Group estimated the level of IUU to be as high as 35‑45% in the eastern Baltic cod fishery in 2005 (http://www.ices.dk/committe/acom/comwork/report/2005/may/cod‑2532.pdf), around 20% in the Baltic sprat fishery, approximately 35% in some Baltic herring fisheries (2004). The ICES Baltic Fisheries Assessment Working Group estimated the level of IUU to be as high as 35‑45% in the eastern Baltic cod fishery in 2005 (http://www.ices.dk/committe/acom/comwork/report/2005/may/cod‑2532.pdf and FCRR 2010: Total marine fisheries extractions by country in the Baltic Sea: 1950‑present. Fisheries Centre Research Reports 18(1) 2010 Vol. 18(1) 263 pp.).
12 FCRR 2010. Total marine fisheries extractions by country in the Baltic Sea: 1950‑present. Fisheries Centre Research Reports 18(1) 2010 Vol. 18(1) 263 pp.
13 ICES 2011. Report of the Baltic Fisheries Assessment Working Group (WGBFAS), 15 ‑ 22 April 2010, ICES Headquarters, Copenhagen.
14 Eurostat/ICES database on catch statistics ‑ ICES 2011, Copenhagen.
15 Other countries include Germany, Lithuania, the Netherlands and the Faroe Islands.
16 Statistical Office of the European Communities (Eurostat). Landings of fishery products in the ports of EEA member countries (quantity and value) 2010. http://epp.eurostat.ec.europa.eu/portal/page/portal/fisheries/data/database
17 Scientific, Technical and Economic Committee for Fisheries 2011. Annual Economic Report on the EU fishing fleet (STECF‑11‑16). Luxembourg: Publications Office of the European Union. 2011 ‑ 233 pp. https://stecf.jrc.ec.europa.eu/c/document_library/get_file?p_l_id=53222&folderId=256769&name=DLFE‑15803.pdf
18 Scientific, Technical and Economic Committee for Fisheries 2011. Annual Economic Report on the EU fishing fleet (STECF‑11‑16). Luxembourg: Publications Office of the European Union. 2011 ‑ 233 pp. https://stecf.jrc.ec.europa.eu/c/document_library/get_file?p_l_id=53222&folderId=256769&name=DLFE‑15803.pdf
19 Scientific, Technical and Economic Committee for Fisheries 2011. Annual Economic Report on the EU fishing fleet (STECF‑11‑16). Luxembourg: Publications Office of the European Union. 2011 ‑ 233 pp https://stecf.jrc.ec.europa.eu/c/document_library/get_file?p_l_id=53222&folderId=256769&name=DLFE‑15803.pdf
20 Council Regulation (EC) No 2371/2002 of 20 December 2002 on the conservation and sustainable exploitation of fisheries resources under the Common Fisheries Policy; Article 10: Member State measures applicable solely to fishing vessels flying their flag. Member States may take measures for the conservation and management of stocks in waters under their sovereignty or jurisdiction provided that:
(a) they apply solely to fishing vessels flying the flag of the Member State concerned and registered in the Community or, in the case of fishing activities which are not conducted by a fishing vessel, to persons established in the Member State concerned and
(b) they are compatible with the objectives set out in Article 2(1) and no less stringent than existing Community legislation.
21 Council directive 92/43/EEC of 21 May 1992 on the conservation of natural habitats and of wild fauna and flora (OJ No L 206, 22.07.1992). http://eur‑lex.europa.eu/LexUriServ/LexUriServ.do?uri=OJ:L:1992:206:0007:0050:EN:PDF
22 Council Directive 2008/56/EC of the European Parliament and of the Council of 17 June 2008 establishing a framework for community action in the field of marine environmental policy (Marine Strategy Framework Directive). The Council of the European Union, 2008. http://eur‑lex.europa.eu/LexUriServ/LexUriServ.do?uri=OJ:L:2008:164:0019:0040:EN:PDF
23 The “Rio Declaration” of 1992 established an objective that stocks should be recovered to levels that can produce maximum sustainable yields (MSY). Paragraph 31 (a) of the Johannesburg Declaration has established a deadline of 2015 for reaching this objective.
24 The western Baltic cod stock is only slowly recovering from an almost depleted state and cuts in the fishing quota would have been needed in order to reach MSY by 2015. Instead, the quota has been increased, ignoring the MSY commitment. The catches for western Baltic herring have declined since the early 1990s and the biomass is at a historical low level. The decision to increase catches in this situation is very risky and consequently, catches in the Skagerrak and Kattegat must be reduced substantially to reach MSY by 2015, which is rather unlikely.
25 Council Regulation (EU) No 1256/2011 of 30 November 2011 fixing for 2012 the fishing opportunities for certain fish stocks and groups of fish stocks applicable in the Baltic Sea and amending Regulation (EU) No 1124/2010. http://eur‑lex.europa.eu/LexUriServ/LexUriServ.do?uri=OJ:L:2011:320:0003:0011:EN:PDF
26 ICES Advice 2011, Book 8; Ecoregion: Baltic. Advice for 2012. http://www.ices.dk/committe/acom/comwork/report/2011/2011/Baltic_Sea_overviews.pdf
27 HELCOM 2007: HELCOM lists of threatened and/or declining species and biotopes/habitats in the Baltic Sea area Baltic Sea Environmental Proceedings, No. 113. http://www.helcom.fi/stc/files/Publications/Proceedings/bsep113.pdf

Fisheries management in the Baltic Sea
77
28 European Commission 2008. Press Release: Common Fisheries Policy: Commission launches a mid‑term review. 17 September 2008, Brussels. IP/08/1339. http://europa.eu/rapid/pressReleasesAction.do?reference=IP/08/1339&format=HTML&aged=0&language=EN&guiLanguage=en
29 Sumaila, U. R., and D. Pauly, 2006. Catching more bait: a bottom‑up re‑estimation of global fisheries subsidies. Fisheries Centre, University of British Columbia.
30 Arnason R., Kelleher K. and Willmann R. 2008. The Sunken Billions: The Economic Justification for Fisheries Reform. Joint publication of the World Bank and the FAO.
31 Oceana 2011. The European Union and Fishing Subsidies. September 2011. Copenhagen. http://baltic.oceana.org/en/fisheries‑subsidies
32 European Commission. Eurostat online; The total number of fishing vessels of EU Member States, Iceland and Norway. Date of extraction: 02 Nov 2011 09:53:19 MET. http://epp.eurostat.ec.europa.eu/portal/page/portal/fisheries/data/main_tables
33 Scientific, Technical and Economic Committee for Fisheries 2011. Annual Economic Report on the EU fishing fleet (STECF‑11‑16). Luxembourg: Publications Office of the European Union. 2011 ‑ 233 pp. https://stecf.jrc.ec.europa.eu/c/document_library/get_file?p_l_id=53222&folderId=256769&name=DLFE‑15803.pdf
34 European Commission. Eurostat online; The total number of fishing vessels of EU Member States, Iceland and Norway. Date of extraction: 02 Nov 2011 09:53:19 MET. http://epp.eurostat.ec.europa.eu/portal/page/portal/fisheries/data/main_tables
35 According to Council Regulation (EC) No 1198/2006 of the European Fisheries Fund, vessels in “small‑scale coastal fisheries” are defined as ones with overall length of less than 12 metres and not using towed gear (i.e. using passive gears).
36 Macfadyen G., Salz P., Cappel R. 2011. Characteristics of small‑scale coastal fisheries in Europe; Directorate General for International Policies, Policy Department B: Structural and Cohesion Policies: Fisheries. Brussels, © European Parliament, July 2011.
37 Ifremer (coord.) 2007. Small‑Scale Coastal Fisheries in Europe, Final report of the contract No FISH/2005/10, 447 p. http://ec.europa.eu/fisheries/documentation/studies/small_scale_coastal_fisheries_en.pdf
38 Pauly, D. 2006. Major trends in small‑scale marine fisheries, with emphasis on developing countries, and some implications for the social sciences. MAST 2006, 4(2):7‑22. http://www.marecentre.nl/mast/documents/Pauly_Mast2006vol_4no_2_new.pdf
39 Scientific, Technical and Economic Committee for Fisheries 2011. Annual Economic Report on the EU fishing fleet (STECF‑11‑16). Luxembourg: Publications Office of the European Union. 2011 ‑ 233 pp. https://stecf.jrc.ec.europa.eu/c/document_library/get_file?p_l_id=53222&folderId=256769&name=DLFE‑15803.pdf
40 Scientific, Technical and Economic Committee for Fisheries 2011. Annual Economic Report on the EU fishing fleet (STECF‑11‑16). Luxembourg: Publications Office of the European Union. 2011 ‑ 233 pp. https://stecf.jrc.ec.europa.eu/c/document_library/get_file?p_l_id=53222&folderId=256769&name=DLFE‑15803.pdf
2. The biggest problems 41 HELCOM, 2010. Ecosystem Health of the Baltic Sea 2003‑2007. HELCOM Initial Holistic Assessment. Balt. Sea Environ. Proc. No. 122.
42 Pusch, C. & Pedersen, S. A. 2010. Environmentally sound fisheries management in marine protected areas (EMPAS) in Germany. Federal Agency for Nature Conservation, Naturscutz und Biologische Vielfalt, Heft 92. 302 pp.
43 Holmgren, N. M. A., Norrström, N. & Kuikka, S. 2011. MSY oriented management of the Baltic Sea herring under regime shifts. ICES working document in ICES WGBFAS REPORT 2011. ICES CM 2011/ACOM:10.
44 ICES 2011. Report of the Baltic Fisheries Assessment Working Group (WGBFAS), 12 ‑ 19 April, ICES Headquarters, Copenhagen. ICES CM 2011/ACOM:10. 824 pp. http://www.ices.dk/reports/ACOM/2011/WGBFAS/WGBFAS%20Report%202011.pdf
45 Möllmann C., Müller‑Karulis B., Kornilovs G., St. John M. A. 2008. Effects of climate and overfishing on zooplankton dynamics and ecosystem structure: regime shifts, trophic cascade, and feedback loops in a simple ecosystem. ICES J Mar Sci 65:302‑310.
46 MacKenzie B. R., Gislason H., Möllmann C., Köster F. W. 2007. Impact of 21st century climate change on the Baltic Sea fish community and fisheries. Glob Change Biol 13: 1348‑1367.
47 ICES 2011. Report of the Baltic Fisheries Assessment Working Group (WGBFAS), 12 ‑ 19 April, ICES Headquarters, Copenhagen. ICES CM 2011/ACOM:10. 824 pp. http://www.ices.dk/reports/ACOM/2011/WGBFAS/WGBFAS%20Report%202011.pdf
48 ICES 2010. Report of the ICES Advisory Committee, ICES Advice 2010, Book 8. ICES, Copenhagen.
49 MacKenzie B. R., Hinrichsen H. H., Plikshs M., Wieland K., Zezera A. S. 2000. Quantifying environmental heterogeneity: habitat size necessary for successful development of cod Gadus morhua eggs in the Baltic Sea. Mar Ecol Prog Ser 193: 143‑156.
50 Möllmann C., Müller‑Karulis B., Kornilovs G., St. John M. A. 2008. Effects of climate and overfishing on zooplankton dynamics and ecosystem structure: regime shifts, trophic cascade, and feedback loops in a simple ecosystem. ICES J Mar Sci 65:302‑310.
51 Aro E. 1989. A review of fish migration patterns in the Baltic. Rapp PV Réun Cons Int Explor Mer 190:72‑96.
52 Hinrichsen H. H., Lehmann A., Möllmann C., Schmidt J. O. 2003. Dependency of larval and juvenile fish survival on retention/dispersion in food limited environments: the Baltic Sea as a case study. Fish Oceanogr 12:425‑433.
53 Köster F. W., Möllmann C. 2000. Egg cannibalism in Baltic sprat Sprattus sprattus. Mar Ecol Prog Ser 196:269‑277.
54 Möllmann C., Müller‑Karulis B., Kornilovs G., St. John M. A. 2008. Effects of climate and overfishing on zooplankton dynamics and ecosystem structure: regime shifts, trophic cascade, and feedback loops in a simple ecosystem. ICES J Mar Sci 65:302‑310.
55 Cardinale M., Svedäng H. 2011. The beauty of simplicity in science: Baltic cod stock improves rapidly in a ‘cod hostile’ ecosystem state. Mar Ecol Prog Ser 425: 297‑301.
56 HELCOM, 2010. Ecosystem Health of the Baltic Sea 2003‑2007: HELCOM Initial Holistic Assessment. Balt. Sea Environ. Proc. No. 122. http://www.helcom.fi/stc/files/Publications/Proceedings/bsep122.pdf
57 Ottosson, L. 2008. By‑catches of non‑commercial invertebrate taxa in Skagerrak and Katteget, generated by demersal otter trawling. Master thesis in marine ecology, Department of Marine Ecology, Gothenburg, Sweden. 67 pp.

78
58 Dolmer, P. & Frandsen, R. P. 2002. Evaluation of the Danish mussel fishery: suggestions for an ecosystem mangement approach. Helgoland Marine Research 56: 13‑20.
59 Dolmer, P., Poulsen, L. K., Blæsbjerg, M., Kristensen, P. S., Geitner, K., Christoffersen, M., & Holm, N. 2009. Konsekvensvurdering af fiskeri på blåmuslinger i Lovns Bredning 2009/2010. DTU Aqua‑rapport nr. 215‑2009. Charlottenlund. Institut for Akvatiske Ressourcer, Danmarks Tekniske Universitet, 85 p.
60 Scientific, Technical and Economic Committee for Fisheries 2011. Annual Economic Report on the EU fishing fleet (STECF‑11‑16). Luxembourg: Publications Office of the European Union. 2011 ‑ 233 pp. https://stecf.jrc.ec.europa.eu/c/document_library/get_file?p_l_id=53222&folderId=256769&name=DLFE‑15803.pdf
61 Poulsen, L. K., Christoffersen, M., Kristensen, P. S., Dolmer, P., Aabrink, M., Kindt‑Larsen, L., Dinesen, G. E. & Holm, N. 2010. Konsekvensvurdering af fiskeri på blåmuslinger i Lillebælt 2011. DTU Aqua‑rapport nr. 231‑2010. Institut for Akvatiske Ressourcer, Danmarks Tekniske Universitet, 86 p.
62 Danmarks Naturfredningsforening, Muslingesagens forløb, http://www.dn.dk/Default.aspx?ID=28232; Ministry of Food, Agriculture and Fisheries. Ny EU‑kritik af muslingefiskeri i naturbeskyttelsesområder. http://www.fvm.dk/Default.aspx?ID=18481&PID=167617&year=&NewsID=7065
63 HELCOM, 2010. Ecosystem Health of the Baltic Sea 2003‑2007: HELCOM Initial Holistic Assessment. Balt. Sea Environ. Proc. No. 122. http://www.helcom.fi/stc/files/Publications/Proceedings/bsep122.pdf
64 Riemann, B. & E. Hoffmann (1991). Ecological consequences of dredging and bottom trawling in the Limfjord, Denmark. Marine Ecology Progress Series 69:171‑178.
65 Rosenberg, R., H. C. Nilsson, A. Grémare & J. M. Amouroux 2003. Effects of demersal trawling on marine sedimentary habitats analysed by sediment profile imagery. Journal of Experimental Marine Biology and Ecology 285‑286: 465‑477.
66 HELCOM, 2010. Ecosystem Health of the Baltic Sea 2003‑2007: HELCOM Initial Holistic Assessment. Balt. Sea Environ. Proc. No. 122. http://www.helcom.fi/stc/files/Publications/Proceedings/bsep122.pdf
67 ICES 2011. Nephrops in Subareas IIIa and IV. ICES WGNSSK Report 2011. http://www.ices.dk/reports/ACOM/2011/WGNSSK/Sec%2003%20Nephrops%20in%20Subareas%20IIIa%20and%20IV.pdf
68 Casey, J., Vanhee, W. & Doerner, H. 2011 (eds.). Scientific, Technical and Economic Committee for Fisheries (STECF) Review of Scientific Advice For 2012. Consolidated Advice on Fish Stocks of Interest to the European Union (STECF 11‑18). JRC Scientific and Technical Reports. http://publications.jrc.ec.europa.eu/repository/bitstream/111111111/22904/1/stecf‑11‑18%20consolidated%20review%20of%20advice%20for%202012%20final%20report%20jrc67802.pdf
69 Ottosson, L. 2008. By‑catches of non‑commercial invertebrate taxa in Skagerrak and Kattegat, generated by demersal otter trawling. Master thesis in marine ecology, Department of Marine Ecology, Gothenburg University, Sweden. 67 pp.
70 Casey, J., Vanhee, W., Rätz, H. J. & Druon, J. N. 2011 (eds.). Scientific, Technical and Economic Committee for Fisheries (STECF) Review of Scientific Advice For 2012. Part 3 (STECF 11‑15). JRC Scientific and Technical Reports. https://stecf.jrc.ec.europa.eu/c/document_library/get_file?p_l_id=53338&folderId=222034&name=DLFE‑15302.pdf
71 ICES 2011. Northern shrimp (Pandalus borealis) in Divisions IIIa and IVa East (Skagerrak and Norwegian Deep). ICES Advice 2012, Book 6. http://www.ices.dk/committe/acom/comwork/report/2011/2011/pand‑sknd.pdf
72 ICES 2011. Northern shrimp (Pandalus borealis) in Divisions IIIa and IVa East (Skagerrak and Norwegian Deep). ICES Advice 2012, Book 6. http://www.ices.dk/committe/acom/comwork/report/2011/2011/pand‑sknd.pdf
73 Munch‑Petersen, S., Eigaard, O., Søvik, G. and Ulmestrand, M. 2010. NAFO/ICES Pandalus Assessment Group Meeting ‑ October‑2010. The Northern shrimp (Pandalus borealis) Stock in Skagerrak and the Norwegian Deep (ICES Divisions IIIa and IVa East). Serial No. N5864 SCR Doc. 10/70. http://archive.nafo.int/open/sc/2010/scr10‑070.pdf
74 ICES 2011. Northern shrimp (Pandalus borealis) in Divisions IIIa and IVa East (Skagerrak and Norwegian Deep). ICES Advice 2012, Book 6. http://www.ices.dk/committe/acom/comwork/report/2011/2011/pand‑sknd.pdf
75 ICES 2011. Northern shrimp (Pandalus borealis) in Divisions IIIa and IVa East (Skagerrak and Norwegian Deep). ICES Advice 2012, Book 6. http://www.ices.dk/committe/acom/comwork/report/2011/2011/pand‑sknd.pdf
76 Scientific, Technical and Economic Committee for Fisheries. 2011. Annual Economic Report on the EU fishing fleet (STECF‑11‑16). Luxembourg: Publications Office of the European Union. 2011 ‑ 233 pp. https://stecf.jrc.ec.europa.eu/c/document_library/get_file?p_l_id=53222&folderId=256769&name=DLFE‑15803.pdf
77 ICES 2011. Report of the ICES Advisory Committee, ICES Advice 2010, Book 8. ICES, Copenhagen.
78 Scientific, Technical and Economic Committee for Fisheries 2011. Annual Economic Report on the EU fishing fleet (STECF‑11‑16). Luxembourg: Publications Office of the European Union. 2011 ‑ 233 pp. https://stecf.jrc.ec.europa.eu/c/document_library/get_file?p_l_id=53222&folderId=256769&name=DLFE‑15803.pdf
79 HELCOM 2010. Ecosystem Health of the Baltic Sea 2003‑2007: HELCOM Initial Holistic Assessment. Balt. Sea Environ. Proc. No. 122. http://www.helcom.fi/stc/files/Publications/Proceedings/bsep122.pdf
80 ICES 2011. Report of the Baltic Fisheries Assessment Working Group (WGBFAS), 15 ‑ 22 April 2010, ICES Headquarters, Copenhagen.
81 HELCOM 2002. Environment of the Baltic Sea area 1994‑1998. Baltic Sea Environment Proceedings No. 82B
82 ICES 2011. Report of the Baltic Fisheries Assessment Working Group (WGBFAS), 15 ‑ 22 April 2010, ICES Headquarters, Copenhagen.
83 ICES 2011. Report of the Baltic Fisheries Assessment Working Group (WGBFAS), 15 ‑ 22 April 2010, ICES Headquarters, Copenhagen.
84 ICES 2011. Report of the Baltic Fisheries Assessment Working Group (WGBFAS), 15 ‑ 22 April 2010, ICES Headquarters, Copenhagen.
85 ICES 2011, Advice Book 8; Ecoregion: Baltic Sea; Stock: Sprat in Subdivisions 22‑32 (Baltic Sea). Advice for 2012. http://www.ices.dk/committe/acom/comwork/report/2011/2011/spr‑2232.pdf
86 ICES 2011. Herring in Subdivision 30 (Bothnian Bay). Advice 2012, Book 8. http://www.ices.dk/committe/acom/comwork/report/2011/2011/Her‑30.pdf
87 HELCOM website. http://www.helcom.fi/environment2/biodiv/fish/species_communities/en_GB/sprat/?u4.highlight=sprat

Fisheries management in the Baltic Sea
79
88 ICES 2011. Herring in Subdivision 30 (Bothnian Bay). Advice 2012, Book 8. http://www.ices.dk/committe/acom/comwork/report/2011/2011/Her‑31.pdf
89 ICES 2011. Herring in Subdivisions 25‑29 and 32 (excluding Gulf of Riga herring). Advice 2012, Book 8. http://www.ices.dk/committe/acom/comwork/report/2011/2011/Her‑2532‑Ex‑Go.pdf
90 ICES 2011. Herring in Subdivision 28.1 (Gulf of Riga). Advice 2012, Book 8. http://www.ices.dk/committe/acom/comwork/report/2011/2011/Her‑riga.pdf
91 ICES 2011. Plaice in Subdivisions 22‑32 (Baltic Sea). Advice 2012, Book 8. http://www.ices.dk/committe/acom/comwork/report/2011/2011/ple‑2232.pdf
92 ICES 2011. Turbot in Subdivisions 22‑32 (Baltic Sea). Advice 2012, Book 8. http://www.ices.dk/committe/acom/comwork/report/2011/2011/tur‑2232.pdf
93 ICES 2011. Brill in Subdivisions 22‑32 (Baltic Sea). Advice 2012, Book 8. http://www.ices.dk/committe/acom/comwork/report/2011/2011/bll‑2232.pdf
94 ICES 2011. Dab in Subdivisions 22‑32 (Baltic Sea). Advice 2012, Book 8. http://www.ices.dk/committe/acom/comwork/report/2011/2011/dab‑2232.pdf
95 ICES 2011. Sea trout in Subdivision 22‑32 (Baltic Sea). Advice 2012, Book 8. http://www.ices.dk/committe/acom/comwork/report/2011/2011/trt‑bal.pdf
96 IUCN. The IUCN redlist of threatened species, Phocoena phocoena (Baltic Sea subpopulation). http://www.iucnredlist.org/apps/redlist/details/17031/0
97 Koschinsky, S. 2012. NABU, GRD, GSM. Strategien zur Vermeidung von Beifang von Seevögeln und Meeressäugetieren in der Ostseefischerei.
98 IUCN. The IUCN redlist of threatened species, Phocoena phocoena (Baltic Sea subpopulation). http://www.iucnredlist.org/apps/redlist/details/17031/0
99 ASCOBANS 2010. ASCOBANS Recovery Plan for Baltic Harbour Porpoises Jastarnia Plan (2009 Revision). In: Report of the 6th Meeting of the Parties to ASCOBANS ASCOBANS, Bonn, Germany.
100 Several studies, quoted from: Koschinsky, S. 2012. NABU, GRD, GSM. Strategien zur Vermeidung von Beifang von Seevögeln und Meeressäugetieren in der Ostseefischerei.
101 International Whaling Commission 2000. Report of the Scientific Committee, Annex O. REport of the IWC‑ASCOBANS working group on harbour porpoises. J. Cetacean Res. Manage, 2 (Suppl.), 297‑304.
102 ASCOBANS 2010. ASCOBANS Recovery Plan for Baltic Harbour Porpoises Jastarnia Plan (2009 Revision). In: Report of the 6th Meeting of the Parties to ASCOBANS ASCOBANS, Bonn, Germany.
103 These data are also reported annually to ASCOBANS and HELCOM (data: Hel Marine Station, University of Gdańsk). Quoted from: ICES Bycatch 2011. ICES CM 2010/ACOM:25 Report of the Study Group on Bycatch of Protected Species (SGBYC) 1‑4 February 2010 Copenhagen, Denmark.
104 COUNCIL REGULATION (EC) No 812/2004 of 26.4.2004 laying down measures concerning incidental catches of cetaceans in fisheries and amending Regulation (EC) No 88/98Regulation 812/2004.
105 Quoted from: Report of the Study Group on Bycatch of Protected Species (SGBYC) 1‑4 February 2010 Copenhagen, Denmark.
106 Nordic Council of ministers 2012. Waterbird Populations and Pressures in the Baltic Sea. http://www.norden.org/en/publications/publikationer/2011‑550
107 In a recent review on bird bycatch in northern Europe, Žydelis et al. (2009) identified over 20 unique studies reporting bird bycatch in fishing nets in the Baltic Sea. By simple summing reported numbers of caught birds, the authors suggested that at least 76,000 birds are being killed in the Baltic Sea annually. Quoted from: Nordic Council of ministers (2012). Waterbird Populations and Pressures in the Baltic Sea. http://www.norden.org/en/publications/publikationer/2011‑550.
108 WWF Poland & Baltic 2020 2012. Ecological effects of ghost net retrieval in the Baltic Sea. http://www.balticsea2020.org/english/images/Bilagor/ghostnet_en%202.pdf
109 “When scientific advice on overfishing is unavailable, a reduction of 25% in the TAC and/or in the fishing effort levels should be proposed, unless scientific advice indicates that a bigger reduction is necessary because of short‑term risks to the stock”. Source: Brussels, 25.5.2011 COM(2011) 298 final, http://ec.europa.eu/fisheries/partners/consultations/fishing_opportunities/consultation_document_en.pdf
110 ICES 2011. Ecoregion: Baltic. Advice 2012, Book 8. http://www.ices.dk/committe/acom/comwork/report/2011/2011/Baltic_Sea_overviews.pdf
111 The threat status was taken from two existing HELCOM lists as shown below. These two documents are the best available threat status assessments covering the whole Baltic Sea and the Kattegat. According to IUCN "vulnerable" is described as threatened.
HELCOM 2007: HELCOM Red list of threatened and declining species of lampreys and fish of the Baltic Sea. Baltic Sea Environmental Proceedings, No. 109, 40 pp. http://www.helcom.fi/stc/files/Publications/Proceedings/bsep109.pdf
HELCOM 2007: HELCOM lists of threatened and/or declining species and biotopes/habitats in the Baltic Sea area Baltic Sea Environmental Proceedings, No. 113. http://www.helcom.fi/stc/files/Publications/Proceedings/bsep113.pdf
112 ICES 2011. Plaice in Subdivisions 22‑32 (Baltic Sea). Advice 2012, Book 8. http://www.ices.dk/committe/acom/comwork/report/2011/2011/ple‑2232.pdf
113 ICES 2011. Flounder in Subdivisions 22‑32 (Baltic Sea). Advice 2012, Book 8. http://www.ices.dk/committe/acom/comwork/report/2011/2011/fle‑2232.pdf
114 ICES 2011. Report of the Baltic Fisheries Assessment Working Group (WGBFAS), 12 ‑ 19 April, ICES Headquarters, Copenhagen. ICES CM 2011/ACOM:10. 824 pp. http://www.ices.dk/reports/ACOM/2011/WGBFAS/WGBFAS%20Report%202011.pdf
115 ICES 2011. Brill in Subdivisions 22‑32 (Baltic Sea). Advice 2012, Book 8. http://www.ices.dk/committe/acom/comwork/report/2011/2011/bll‑2232.pdf

80
116 ICES 2011.Turbot in Subdivisions 22‑32 (Baltic Sea). Advice 2012, Book 8. http://www.ices.dk/committe/acom/comwork/report/2011/2011/tur‑2232.pdf
117 ICES 2011. Dab in Subdivisions 22‑32 (Baltic Sea). Advice 2012, Book 8. http://www.ices.dk/committe/acom/comwork/report/2011/2011/dab‑2232.pdf
118 HELCOM 2007. HELCOM Red list of threatened and declining species of lampreys and fish of the Baltic Sea. Baltic Sea Environmental Proceedings, No. 109, 40 pp.
119 ICES 2011. Sea trout in Subdivisions 22‑32 (Baltic Sea). ICES Advice 2011, Book 8. http://www.ices.dk/committe/acom/comwork/report/2011/2011/trt‑bal.pdf
120 ICES 2011. Report of the Baltic Salmon and Trout Assessment Working Group (WGBAST), 22‑30 March 2011, Riga, Latvia. ICES 2011 /ACOM:08. 297 pp. http://www.ices.dk/reports/ACOM/2011/WGBAST/wgbast_2011_final.pdf
121 Council Regulation (EC) No 2187/2005 of 21 December 2005 for the conservation of fishery resources through technical measures in the Baltic Sea, the Belts and the Sound, amending Regulation (EC) No 1434/98 and repealing Regulation (EC) No 88/98. OJ L 349, 31.12.2005, p. 1‑23. http://eur‑lex.europa.eu/LexUriServ/LexUriServ.do?uri=OJ:L:2005:349:0001:0023:EN:PDF
122 Westin, L. 2003. Migration failure in stocked eels Anguilla anguilla. Mar Ecol Prog Ser, Vol. 254: 307‑311.
123 ICES 2011. Widely Distributed and Migratory Stocks, European eel. Advice 2012, Book 9. http://www.ices.dk/committe/acom/comwork/report/2011/2011/eel‑eur.pdf
124 ICES 2003. Report of the ICES Advisory Committee on Fishery Management 2002. ICES Cooperative Research Report No. 255: 938‑947.
125 ICES. 2011. Report of the Baltic Fisheries Assessment Working Group (WGBFAS), 15 ‑ 22 April 2010, ICES Headquarters, Copenhagen.
126 ICES 2011. Widely Distributed and Migratory Stocks, European eel. Advice 2012, Book 9. http://www.ices.dk/committe/acom/comwork/report/2011/2011/eel‑eur.pdf
127 ICES 2011. Widely Distributed and Migratory Stocks, European eel. Advice 2012, Book 9. http://www.ices.dk/committe/acom/comwork/report/2011/2011/eel‑eur.pdf
128 ICES 2011. Widely Distributed and Migratory Stocks, European eel. Advice 2012, Book 9. http://www.ices.dk/committe/acom/comwork/report/2011/2011/eel‑eur.pdf
129 Council Regulation 2007/1100 of 18 September 2007 establishing measures for the recovery of the stock of European eel. Official Journal of the European Union L 248/17.
130 Short summary if conclusions of the 57th meeting of the scientific review group on trade in wild fauna and flora 17 October 2011. http://ec.europa.eu/environment/cites/pdf/srg/57_summary_srg.pdf
131 Statistical Office of the European Communities (Eurostat) 2012. Database Landings of fishery Products. http://epp.eurostat.ec.europa.eu/portal/page/portal/eurostat/home/
132 Koschinsky, S. 2012. NABU, GRD, GSM. Strategien zur Vermeidung von Beifang von Seevögeln und Meeressäugetieren in der Ostseefischerei.
133 ASCOBANS 2000. Report of the Agreement on the Conservation of Small Cetaceans of the Baltic and North Seas (ASCOBANS) Baltic Discussion Group (ABDG), January 2001, Charlottenlund, Denmark.
134 Koschinski, S., Pfander, A. 2009. By‑catch of harbour porpoises (Phocoena phocoena) in the Baltic coastal waters of Angeln and Schwansen (Schleswig Holstein, Germany). 16th ASCOBANS Advisory Committee Meeting Document AC16/Doc.60 (P) Brugge, Belgium, 20‑24 April 2009. http://www.service‑board.de/ascobans_neu/files/ac16/AC16_60_HarbourPorpoiseBycatchGermanBaltic.pdf
135 Zidowitz, H., George, M., Fordham, S., Kullander, S. O. & Pelczarski, W. 2008. The Shark Alliance ‑ Sharks in the Baltic ‑ May 2008.
3. IUU fishing in the Baltic Sea and the Kattegat 136 Agnew, D. J., Pearce, J., Pramod, G., Peatman, T. & Watson R. 2009. Estimating the Worldwide Extent of Illegal Fishing. PLoS ONE 4(2): e4570.
doi:10.1371/journal.pone.0004570. http://www.plosone.org/article/info:doi/10.1371/journal.pone.0004570
137 Report on combating illegal fishing at the global level ‑ the role of the EU, (2010/2210(INI)). Committee on Fisheries, Rapporteur: Isabella Lövin.
138 FAO 2001. International Plan of Action to prevent, deter and eliminate illegal, unreported and unregulated fishing. Rome, FAO. 2001. 24 p.
139 FAO 2001. International Plan of Action to prevent, deter and eliminate illegal, unreported and unregulated fishing. Rome, FAO. 2001. 24 p.
140 FISHSTAT Plus: Universal Software for fishery statistical time series. Version 2.30. Capture production: quantities 1970‑2009. FAO, Rome. Commodities production and trade 1976‑2009 (Release date: December 2011). FAO Rome.
141 Federacja Zielonych GAJA. 2010. Survey of institutions responsible for inspecting Polish fisheries in the Baltic Sea ‑ report. Szczecin 2010. http://gajanet.pl/publikacje/raport‑z‑przeprowadzonego‑monitoringu‑polskiego‑systemu‑kontroli‑polowow‑na‑morzu‑baltyckim/
142 Council Regulation (EC) No 1224/2009 of 20 November 2009 establishing a Community control system for ensuring compliance with the rules of the common fisheries policy, amending Regulations (EC) No 847/96, (EC) No 2371/2002, (EC) No 811/2004, (EC) No 768/2005, (EC) No 2115/2005, (EC) No 2166/2005, (EC) No 388/2006, (EC) No 509/2007, (EC) No 676/2007, (EC) No 1098/2007, (EC) No 1300/2008, (EC) No 1342/2008 and repealing Regulations (EEC) No 2847/93, (EC) No 1627/94 and (EC) No 1966/2006. OJL 343/1. http://eur‑lex.europa.eu/LexUriServ/LexUriServ.do?uri=OJ:L:2009:343:0001:0050:EN:PDF
143 Council Regulation (EC) No 1005/2008 of 29 September 2008 establishing a Community system to prevent, deter and eliminate illegal, unreported and unregulated fishing, amending Regulations (EEC) No 2847/93, (EC) No 1936/2001 and (EC) No 601/2004 and repealing Regulations (EC) No 1093/94 and (EC) No 1447/1999. OJ L 286/1 http://eur‑lex.europa.eu/LexUriServ/LexUriServ.do?uri=OJ:L:2008:286:0001:0032:EN:PDF
144 Council Regulation (EC) No 1006/2008 of 29 September 2008 concerning authorisations for fishing activities of Community fishing vessels outside Community waters and the access of third country vessels to Community waters, amending Regulations (EEC) No 2847/93 and (EC) No 1627/94 and repealing Regulation (EC) No 3317/94. http://eur‑lex.europa.eu/LexUriServ/LexUriServ.do?uri=OJ:L:2008:286:0033:0044:EN:PDF

Fisheries management in the Baltic Sea
81
145 ICES 2011. Report of the Baltic Fisheries Assessment Working Group (WGBFAS), 12 ‑ 19 April, ICES Headquarters, Copenhagen. ICES CM 2011/ACOM:10. 824pp. http://www.ices.dk/reports/ACOM/2011/WGBFAS/WGBFAS%20Report%202011.pdf
146 ICES 2011. Report of the Baltic Fisheries Assessment Working Group (WGBFAS), 12 ‑ 19 April, ICES Headquarters, Copenhagen. ICES CM 2011/ACOM:10. 824pp. http://www.ices.dk/reports/ACOM/2011/WGBFAS/WGBFAS%20Report%202011.pdf
147 ICES landings statistics were used as the ‗reported data’ baseline for our reconstruction, since they are the only publicly‑available data, covering all taxa, fishing areas and countries in the Baltic Sea back to 1950. Estimated unreported landings and discards were applied to landings data on a taxonomic and country‑specific basis. Discard estimates included ‗underwater‘ discards from actively‑fishing trawl gear; ‗ghostfishing‘ due to lost or abandoned fishing gear; ‗boat‑based’ discards, generally resulting from fishers‘ intentional behavior; and ‗seal‑damaged’ discards representing catch lost because of seal damage. The inclusion of recreational catch estimates for each country allowed estimates of the likely total catch (as opposed to reported landings) to be derived.
148 FCRR 2010. Total marine fisheries extractions by country in the Baltic Sea: 1950‑present. Fisheries Centre Research Reports 18(1) 2010 Vol. 18(1) 263 pp.
149 ICES 2011. Report of the Baltic Fisheries Assessment Working Group (WGBFAS), 15 ‑ 22 April 2010, ICES Headquarters, Copenhagen.
150 The Danish AgriFish Agency. “OVTR ‑ erhverv” document, pers. comm with Finn Vind, the AgriFish Agency.
151 Netavisen Bornholm.nu. http://www.bornholm.nu/?Id=36620
152 DR. http://www.dr.dk/Regioner/Bornholm/Nyheder/Oestlandet/2009/01/30/070933.htm
153 Sn.dk Dagbladet Frederiksborg Amts Avis Sjællandske. http://www.sn.dk/Ti‑fiskere‑meldt‑for‑ulovligt‑fiskeri/Gribskov/artikel/105511
154 Netavisen Bornholm.nu http://www.bornholm.nu/?Id=29753
155 Skärgårdsbryggan http://www.skargardsbryggan.com/index.lasso?a=588467592&s=1
156 Ystads Allehanda http://www.ystadsallehanda.se/simrishamn/baskemolla/article1467786/Fiskeriverket‑hittade‑olagligt‑fiskenat.html
157 Ystads Allehanda http://www.ystadsallehanda.se/simrishamn/article1606482/Vastkustfiskare‑tralade‑upp‑224‑kilo‑smatorsk.html
158 Greenpeace 2010. Pirate fishing in Kattegat. http://www.greenpeace.org/denmark/da/vores‑arbejdsomraader/red‑livet‑i‑havet/piratfiskeri/
159 Greenpeace 2010. Evidence of extensive poaching in the protected area of Kattegat. http://www.greenpeace.org/denmark/da/vores‑arbejdsomraader/red‑livet‑i‑havet/piratfiskeri/dokumentation/
160 Bekendtgørelse om forbud mod visse former for fiskeri i nærmere afgrænsede områder i Kattegat og nordlige del af Øresund. Nr. 391. Udgivet d. 20. april 2010. Fiskeridirektoratet, j.nr. 2010‑00997.
161 The Danish Ministry of Agriculture, Food and Fisheries. http://www.fvm.dk/Default.aspx?ID=18481&PID=167617&year=&NewsID=6189
162 Greenpeace 2010. Evidence of extensive poaching in the protected area of Kattegat. http://www.greenpeace.org/denmark/da/vores‑arbejdsomraader/red‑livet‑i‑havet/piratfiskeri/dokumentation/
163 http://www.domstol.dk/Helsingoer/nyheder/domsresumeer/Pages/DomforulovligtfiskeriidetsydoestligeKattegat.aspx
4. Cod 164 HELCOM 2010. Ecosystem Health of the Baltic Sea 2003–2007: HELCOM Initial Holistic Assessment. Balt. Sea Environ. Proc. No. 122.
165 ICES 2011. Cod in Division IIIa East (Kattegat). Advice 2012, Book 6. http://www.ices.dk/committe/acom/comwork/report/2011/2011/cod‑kat.pdf
166 ICES 2011. Cod in Division IIIa East (Kattegat). Advice 2012, Book 6. http://www.ices.dk/committe/acom/comwork/report/2011/2011/cod‑kat.pdf
167 ICES 2011. Cod in Subdivisions 22–24. Advice 2012, Book 8. http://www.ices.dk/committe/acom/comwork/report/2011/2011/cod‑2224.pdf
168 European Commission 2007. Commission Regulation (EC) No 1098/2007 establishing a multiannual plan for the cod stocks in the Baltic Sea and the fisheries exploiting those stocks, amending.
169 European Commission 2005. Commission Regulation (EC) No 2187/2005 for the conservation of fishery resources through technical measures in the Baltic Sea, the Belts and the Sound, amending Regulation (EC) No 1434/98 and repealing Regulation (EC) No 88/98. December 21, 2005.
170 ICES 2011. Cod in Subdivisions 22‑24. Advice 2012, Book 8. http://www.ices.dk/committe/acom/comwork/report/2011/2011/cod‑2224.pdf
171 ICES 2011. Report of the Baltic Fisheries Assessment Working Group (WGBFAS), 15 ‑ 22 April 2010, ICES Headquarters, Copenhagen.
172 ICES 2011. Cod in Subdivisions 25–32. Advice 2012, Book 8. http://www.ices.dk/committe/acom/comwork/report/2011/2011/cod‑2532.pdf
173 ICES 2006. Cod in Subdivisions 25–32. Advice for 2007, Volume 8. http://www.ices.dk/committe/acom/comwork/report/2006/may/cod‑2532.pdf
174 Greenpeace 2006. The cod fishery in the Baltic Sea: unsustainable and illegal. Greenpeace International report; Netherlands, 2006.
175 European Commission 2007. Evaluation report of catch registration in Baltic Sea Member States, 2005‑2006.
176 European Fisheries Control Agency. http://cfca.europa.eu/pages/home/jdp_baltic.htm
177 Information on national control action programmes in the Baltic Sea (2007‑2010). Summarized by K. Radtke. Provided by countries following the WKROUNDMP/EWG 11‑01 data request for the Baltic Sea (Ref. Ares (2011)439284 ‑ 19/04/2011. (2007‑2010).
178 It should be noted that during the extensive vessel scrapping programs carried out when the inspections were taking place in Estonia, Lithuania, Latvia and Poland, changes to the fleet size of said countries may have had effects on the results of the control activities.
179 ICES 2011. Advice for 2012, ecoregion: The Baltic Sea. http://www.ices.dk/advice/icesadvice.asp
180 http://www.ices.dk/reports/ACOM/2011/WGBFAS/Annex%2016%20Working%20Documents.pdf
181 http://www.ices.dk/committe/acom/comwork/report/2011/2011/cod‑kat.pdf
182 Morski Instytut Rybacki w Gdyni 2006. Czy wiemy ile jest dorszy w Baltyku. Gdynia, 2006.
183 Gazeta Wyborcza 2007. „The big cod fraud” article, May 4, 2006. http://gospodarka.gazeta.pl/gospodarka/1,33181,3324426.html

82
184 Gazetakaszubska http://www.gazetakaszubska.pl/24615/dwie‑tony‑nielegalnie‑zlowionych‑ryb‑ukryli‑w‑skrytce
185 Onet.pl http://wiadomosci.onet.pl/regionalne/lublin/zlapano‑klusownikow‑nielegalnie‑lowili‑ryby,1,4946209,wiadomosc.html
186 Fiskesekretariatet http://www.fishsec.org/2011/07/21/polish‑inspectors‑find‑half‑a‑ton‑of‑illegal‑cod/
187 Serwis Glosu Pomorza http://www.gp24.pl/apps/pbcs.dll/article?AID=%2F20110713%2FPOMORZE%2F376075566
188 Rozporządzenie Ministra Rolnictwa i Rozwoju Wsi z dnia 19 grudnia 2008 r. zmieniające rozporządzenie w sprawie wymiarów i okresów ochronnych organizmów morskich oraz szczegółowych warunków wykonywania rybołówstwa morskiego.
189 Council Regulation (EC) No 338/2008 of 14 April 2008 providing for the adaptation of cod fishing quotas to be allocated to Poland in the Baltic Sea (Subdivisions 25‑32, EC Waters) from 2008 to 2011. http://eur‑lex.europa.eu/LexUriServ/LexUriServ.do?uri=OJ:L:2008:107:0001:0003:EN:PDF
190 TVN24, published: 07:07 07.01.2012 / Fakty TVN, PAP; “Mamy głodowe limity”; TVN24 website: http://www.tvn24.pl/1,1730544,druk.html
191 European Commission 2007. Commission Regulation (EC) No 1098/2007 establishing a multiannual plan for the cod stocks in the Baltic Sea and the fisheries exploiting those stocks, amending Regulation (EEC) No 2847/93 and repealing Regulation (EC) No 779/97. September 18, 2007. http://eur‑lex.europa.eu/LexUriServ/LexUriServ.do?uri=OJ:L:2007:248:0001:0010:EN:PDF
192 Dansk Naturerhervstyrelsen 2012: ‘Dynamisk tabel for landinger’ Landinger registreret af NaturErhvervstyrelsen. http://naturerhverv.fvm.dk/dynamisk_landingstabel.aspx?ID=44289
193 http://www.havochvatten.se/download/18.352f20b813271034bf080003258/JO50SM1110.pdf
5. Salmon and sea trout 194 ICES 2011. Salmon in the Main Basin and the Gulf of Bothnia (Subdivisions 22‑31). Advice 2012, Book 8. http://www.ices.dk/committe/acom/
comwork/report/2011/2011/sal‑2231.pdf
195 ICES WGBAST REPORT 2011. Report of the Baltic Salmon and Trout Assessment Working Group (WGBAST) 22‑30 March 2011, Riga, Latvia.
196 Smolt ‑ The stage in the life cycle of salmon in which the young fish acquire a bright silvery color and migrate down the river to begin their adult lives in the open sea.
197 HELCOM 2007. HELCOM lists of threatened and/or declining species and biotopes/habitats in the Baltic Sea area Baltic Sea Environmental Proceedings, No. 113.
198 Council Directive 92/43/EEC of 21 May 1992 on the conservation of natural habitats and of wild fauna and flora. Official Journal L 206, 22/07/1992 P. 0007 ‑ 0050.
199 HELCOM 2011. Salmon and Sea Trout Populations and Rivers in the Baltic Sea ‑ HELCOM assessment of salmon (Salmo salar) and sea trout (Salmo trutta) populations and habitats in rivers flowing to the Baltic Sea. Balt. Sea Environ. Proc. No. 126A.
200 HELCOM 2011. Salmon and Sea Trout Populations and Rivers in the Baltic Sea ‑ HELCOM assessment of salmon (Salmo salar) and sea trout (Salmo trutta) populations and habitats in rivers flowing to the Baltic Sea. Balt. Sea Environ. Proc. No. 126A.
201 HELCOM 2011. Salmon and Sea Trout Populations and Rivers in the Baltic Sea ‑ HELCOM assessment of salmon (Salmo salar) and sea trout (Salmo trutta) populations and habitats in rivers flowing to the Baltic Sea. Balt. Sea Environ. Proc. No. 126A.
202 ICES WGBAST REPORT 2011. Report of the Baltic Salmon and Trout Assessment Working Group (WGBAST) 22‑30 March 2011, Riga, Latvia.
203 HELCOM 2011. Salmon and Sea Trout Populations and Rivers in the Baltic Sea ‑ HELCOM assessment of salmon (Salmo salar) and sea trout (Salmo trutta) populations and habitats in rivers flowing to the Baltic Sea. Balt. Sea Environ. Proc. No. 126A.
204 HELCOM 2011. Salmon and Sea Trout Populations and Rivers in the Baltic Sea ‑ HELCOM assessment of salmon (Salmo salar) and sea trout (Salmo trutta) populations and habitats in rivers flowing to the Baltic Sea. Balt. Sea Environ. Proc. No. 126A.
205 Both salmon and sea trout are stocked in the Baltic Sea. Currently, the hydropower companies are running large‑scale restocking programs in order to compensate for the vast loss in wild salmon reproduction caused by damming. In addition there are similar initiatives carried‑out by state actors as well as recreational fishermen. Since 1990, salmon smolts have been stocked into the Baltic Sea at levels varying from 4.3 to 5.8 million smolts per year while sea trout stocking has increased from 1.6 to 3.6 million smolts per year. The reared salmon survival rates are generally low and today they make up only about 10% of the salmon catches but this activity helps keeping the fishing pressure high and therefore contradict with conservation objectives. Oceana encourages to phase‑out the direct restocking of Baltic salmon as also proposed in the proposal for the Regulation of the European Parliament and of the Council establishing a multiannual plan for the Baltic salmon stock and the fisheries exploiting that stock.
206 ICES WGBAST REPORT 2011. Report of the Baltic Salmon and Trout Assessment Working Group (WGBAST) 22‑30 March 2011, Riga, Latvia.
207 ICES 2011. Salmon in Subdivisions 22–31 (Main Basin and Gulf of Bothnia). Advice 2012, Book 8. http://www.ices.dk/committe/acom/comwork/report/2011/2011/sal‑2231.pdf
208 ICES 2011. Salmon in Subdivision 32 (Gulf of Finland). Advice 2012, Book 8. http://www.ices.dk/committe/acom/comwork/report/2011/2011/sal‑32.pdf
209 ICES 2011. Salmon in Subdivisions 22–31 (Main Basin and Gulf of Bothnia). Advice 2012, Book 8. http://www.ices.dk/committe/acom/comwork/report/2011/2011/sal‑2231.pdf
210 Commercial fishing for salmon in the open sea in the Baltic Sea will be phased out by 2013 based on the decision by Swedish Sea and Water Authority (http://www.havochvatten.se/tillstandsprovningochtillsyn/tillsyn/yrkesfiske/nyttomfiskeregler/nyttomfiskeregler/nyakravparapporteringvidfiskeefterlaxiostersjon.5.64f5b3211343cffddb280004579.html).
The decision aims to increase protection for wild salmon in the Baltic Sea. The Swedish salmon quota should instead primarily go to the fishing is done with traps near the river mouth, especially in the north where the majority and most important salmon rivers there. One consequence of the decision is that commercial fishing near the coast with traps and mainly in the North can continue while the small‑scale commercial fishing for salmon out of the southern Baltic phased out.
211 COM 2011. Proposal for a Regulation of the European Parliament and of the Council establishing a multiannual plan for the Baltic salmon stock and the fisheries exploiting that stock. Brussels, 12.8.2011, COM(2011) 470 final, 2011/0206 (COD).

Fisheries management in the Baltic Sea
83
212 ICES WGBAST REPORT 2011. Report of the Baltic Salmon and Trout Assessment Working Group (WGBAST) 22‑30 March 2011, Riga, Latvia.
213 HELCOM 2011. Salmon and Sea Trout Populations and Rivers in the Baltic Sea ‑ HELCOM assessment of salmon (Salmo salar) and sea trout (Salmo trutta) populations and habitats in rivers flowing to the Baltic Sea. Balt. Sea Environ. Proc. No. 126A.
214 ICES 2011. Report of the Baltic Salmon and Trout Assessment Working Group (WGBAST). 22‑30 March 2011, Riga, Latvia. ICES 2011/ ACOM:08. 297 pp. http://www.ices.dk/reports/ACOM/2011/WGBAST/wgbast_2011_final.pdf
215 ICES 2011. Advice for 2012, ecoregion: The Baltic Sea. http://www.ices.dk/advice/icesadvice.asp
216 ICES 2011. Report of the Baltic Salmon and Trout Assessment Working Group (WGBAST). 22‑30 March 2011, Riga, Latvia. ICES 2011/ACOM:08. 297 pp. http://www.ices.dk/reports/ACOM/2011/WGBAST/wgbast_2011_final.pdf
217 ICES 2011. Salmon in Subdivisions 22–31 (Main Basin and Gulf of Bothnia). Advice 2012, Book 8. http://www.ices.dk/committe/acom/comwork/report/2011/2011/sal‑2231.pdf
218 Council Regulation (EC) No 809/2007 of 28 June 2007 amending Regulations (EC) No 894/97, (EC) No 812/2004 and (EC) No 2187/2005 as concerns drift nets.
219 Council Regulation (EC) No 1239/98 of 8 June 1998 amending Regulation (EC) No 894/97 laying down certain technical measures for the conservation of fishery resources. http://eur‑lex.europa.eu/LexUriServ/LexUriServ.do?uri=OJ:L:1998:171:0001:0004:EN:PDF
220 Council Regulation (EC) No 812/2004 of 26.4.2004 laying down measures concerning incidental catches of cetaceans in fisheries and amending Regulation (EC) No 88/98. http://eur‑lex.europa.eu/LexUriServ/LexUriServ.do?uri=OJ:L:2004:150:0012:0031:EN:PDF
221 Helsinki Commission 2006. HELCOM HABITAT 8/2006 Nature Protection and Biodiversity Group Eighth Meeting Isle of Vilm, Germany, 15‑19 May 2006. http://meeting.helcom.fi/c/document_library/get_file?folderId=73533&name=DLFE‑29438.pdf
222 Findings from interviews with fishermen in Swibno
223 http://ec.europa.eu/fisheries/fleet/index.cfm
224 Community fishing fleet register, January 2012, http://ec.europa.eu/fisheries/fleet/index.cfm
225 IHS Seaweb. http://www.sea‑web.com/seaweb_welcome.aspx
226 http://www.vvd.gov.lv/data/doc/strukturvienibas/jiup/zvejas.kugi/List_of_Latvian_vessels_holding_a_special_permit_for_fishing_for_cod_in_Baltic_Sea_during__2012.pdf
227 IHS Seaweb. http://www.sea‑web.com/seaweb_welcome.aspx
228 http://ec.europa.eu/fisheries/fleet/index.cfm
229 http://ec.europa.eu/fisheries/fleet/index.cfm
230 Community fishing fleet register. http://ec.europa.eu/fisheries/fleet/index.cfm
231 http://ec.europa.eu/fisheries/fleet/index.cfm
232 http://ec.europa.eu/fisheries/fleet/index.cfm and observations in the harbours of Aland Island
233 http://ec.europa.eu/fisheries/partners/consultations/baltic_salmon/contributions/swedish_board_of_fisheries_en.pdf
6. Herring and sprat 234 Muus B. J. & Nielsen J. G. 2006. Havfisk og fiskeri i Nordvesteuropa. 6. edition.
235 ICES 2011. Herring in Division IIIa and Subdivisions 22‑24 (Western Baltic spring spawners). Advice 2012, Book 6. http://www.ices.dk/committe/acom/comwork/report/2011/2011/her‑3a22.pdf
236 HELCOM website. http://www.helcom.fi/environment/assessment/Fish/en_GB/fish/
237 Muus B. J. & Nielsen J. G. 2006. Havfisk og fiskeri i Nordvesteuropa. 6. edition.
238 ICES 2011. Report of the Baltic Fisheries Assessment Working Group (WGBFAS), 15 ‑ 22 April 2010, ICES Headquarters, Copenhagen.
239 ICES 2011. Report of the Baltic Fisheries Assessment Working Group (WGBFAS), 15 ‑ 22 April 2010, ICES Headquarters, Copenhagen.
240 ICES 2011. Report of the Baltic Fisheries Assessment Working Group (WGBFAS), 15 ‑ 22 April 2010, ICES Headquarters, Copenhagen.
241 ICES‑FishMap. http://www.helcom.fi/environment/assessment/Fish/en_GB/fish/
242 HELCOM website. http://www.helcom.fi/environment/assessment/Fish/en_GB/fish/
243 ICES 2011. Report of the Baltic Fisheries Assessment Working Group (WGBFAS), 15 ‑ 22 April 2010, ICES Headquarters, Copenhagen.
244 ICES 2011. Sprat in Division IIIa (Skagerrak ‑ Kattegat). Advice 2012, Book 6. http://www.ices.dk/committe/acom/comwork/report/2011/2011/spr‑kask.pdf
245 ICES 2011. Sprat in Subdivisions 22‑32 (Baltic Sea). Advice 2012, Book 8. http://www.ices.dk/committe/acom/comwork/report/2011/2011/spr‑2232.pdf
246 ICES 2011. Sprat in Subdivisions 22‑32 (Baltic Sea). Advice 2012, Book 8. http://www.ices.dk/committe/acom/comwork/report/2011/2011/spr‑2232.pdf
247 ICES 2011. Report of the Baltic Fisheries Assessment Working Group (WGBFAS), 15 ‑ 22 April 2010, ICES Headquarters, Copenhagen.
248 ICES‑FishMap. http://www.helcom.fi/environment/assessment/Fish/en_GB/fish/
249 ICES 2011. Report of the Baltic Fisheries Assessment Working Group (WGBFAS), 15 ‑ 22 April 2010, ICES Headquarters, Copenhagen.
250 ICES 2011. Report of the Baltic Fisheries Assessment Working Group (WGBFAS), 15 ‑ 22 April 2010, ICES Headquarters, Copenhagen.
251 ICES 2011. Report of the Baltic Fisheries Assessment Working Group (WGBFAS), 15 ‑ 22 April 2010, ICES Headquarters, Copenhagen.

84
252 Statistical Office of the European Communities (Eurostat) 2012. Database Landings of fishery Products. http://epp.eurostat.ec.europa.eu/portal/page/portal/eurostat/home/
253 Statistical Office of the European Communities (Eurostat) 2012. Database Landings of fishery Products. http://epp.eurostat.ec.europa.eu/portal/page/portal/eurostat/home/
254 It takes about three kgs of wild fish caught to produce one kg of farmed salmon, which produces only about 600 grams of fillets (Naturvårdsverket 2009. What’s in the Sea for Me? Report 5872; The Swedish Environmental Protection Agency, February 2009. http://www.naturvardsverket.se/Documents/publikationer/978‑91‑620‑5872‑2.pdf
255 Bornholms Tidene http://www.e‑pages.dk/bhstid/654/9
256 http://www.peta.de/web/nerzfarm.5397.html
257 http://gd.se/nyheter/gavle/1.2010370‑gavlefiskare‑satsar‑stort
7. Recreational fisheries 258 Federacja Zielonych GAJA 2010. Survey of institutions responsible for inspecting Polish fisheries in the Baltic Sea ‑ report. Szczecin 2010.
http://gajanet.pl/publikacje/raport‑z‑przeprowadzonego‑monitoringu‑polskiego‑systemu‑kontroli‑polowow‑na‑morzu‑baltyckim/
259 National Marine Fisheries Research Institute. 2007. Połowy sportowo‑rekreacyjne dorszy. Wiadomości Rybackie NR 7‑8 (158), LIPIEC‑SIERPIEŃ 2007.
260 Federacja Zielonych GAJA. 2010. Survey of institutions responsible for inspecting Polish fisheries in the Baltic Sea ‑ report. Szczecin 2010. http://gajanet.pl/publikacje/raport‑z‑przeprowadzonego‑monitoringu‑polskiego‑systemu‑kontroli‑polowow‑na‑morzu‑baltyckim/
261 Sparrevohn, C. R., Storr‑Paulsen, M. 2010. Eel and cod catches in Danish recreational fishing. Survey design and 2009 catches. DTU Aqua report no. 217‑2010. Charlottenlund. National Institute of Aquatic Ressources, Technical University of Denmark, 23 p.
262 Zimmerman Ch., Schultz N., Hammer C. 2008. How much cod is removed from the Western Baltic Sea by recreational fishers? Johann Heinrich von Thunen‑Institut; ICES; 2008. http://www.ices.dk/products/CMdocs/CM‑2008/K/K2408.pdf
263 Sparrevohn, C. R., Storr‑Paulsen, M. 2010. Eel and cod catches in Danish recreational fishing. Survey design and 2009 catches. DTU Aqua report no. 217‑2010. Charlottenlund. National Institute of Aquatic Ressources, Technical University of Denmark, 23 p.
264 The Danish AgriFish Agency. OVT ‑ rekreativt” document. (Received personally by the AgriFish Agency)
265 Netavisen Bornhom.nu: http://www.bornholm.nu/?Id=40563
266 The Danish AgriFish webpage. http://naturerhverv.fvm.dk/visningsside.aspx?ID=46658&PID=415856&NewsID=6853
267 DR: http://www.dr.dk/P4/Syd/Nyheder/Soenderborg/2011/07/23/075015.htm?rss=true
268 Netavisen Bornholm.nu. http://www.bornholm.nu/?Id=35813
269 DR: http://www.dr.dk/P4/Fyn/Nyheder/Fynogoeerne/2011/04/23/093659.htm
270 Fiske Notiser http://www.vasthamnsfisket.se/33539177
271 Netavisen Bornholm.nu http://www.bornholm.nu/?Id=41231
272 Naszemiasto.pl http://gdansk.naszemiasto.pl/artykul/1172525,klusownictwo‑na‑zatoce‑gdanskiej‑pol‑tony‑nielegalnie,id,t.html
273 Gazeta Pomorska http://www.pomorska.pl/apps/pbcs.dll/article?AID=/20110818/INOWROCLAW01/306406569
274 Dziennik Batycki http://www.dziennikbaltycki.pl/artykul/423497,zulawy‑klusownicy‑pustosza‑rzeki,id,t.html
275 Moje Miasto to Wloclawek http://www.mmwloclawek.pl/artykul/nielegalny‑polow‑ryb‑nad‑wisla‑klusownicy‑zatrzymani
276 http://www.hobby‑angeln.com/adressen_angelkutter2.php
277 According to a number of commercial “Fischkutter” websites, assessed January 2012.
278 http://www.gerth‑hansen.de/kutter.htm
279 http://ec.europa.eu/fisheries/fleet/index.cfm?method=Search.ListSearchSimple
280 http://www.hochseeangeln.com/
281 http://www.hochseeangeln.com/
282 http://www.hochseeangeln.com/
283 http://www.hochseeangeln.com/

This publication and all related research was completed by Oceana.
Project Directors • Xavier Pastor, Anne SchroeerAuthors • Anne Schroeer, Andrzej Białaś, Hanna Paulomäki, Christina AbelGeographic Information Systems • Jorge UberoEditor • Marta Madina, Hanna PaulomäkiEditorial Assistants • Angela Pauly, Ángeles Sáez, Natividad Sánchez, Martyna LapinskaiteCover • Finnish trawler in the Bothnian Sea, Sweden. April 2011. © OCEANA/ Carlos MinguellContents • Artisanal fishing vessels on the beach of Kśty Rybackie, Poland. April 2011. © OCEANA/ LXDesign and layout • NEO Estudio Gráfico, S.L.Photo montage and printer • Imprenta Roal, S.L.
Acknowledgments • This report was made possible thanks to the generous support of the Arcadia Foundation, Zennström Philanthropies and the Robertson Foundation.
Portions of this report are intellectual property of ESRI and its licensors and are used under license. Copyright © ESRI and its licensors.
Reproduction of the information gathered in this report is permitted as long as © OCEANA is cited as the source.
March 2012
Artisanal fishing vessel on the beach, Piaski, Poland. April 2011. © OCEANA/ LX

Fisheries management in the Baltic SeaHow to get on track to a sustainable future in Baltic fisheries
Nyhavn 16, 4 sal
1051 Copenhagen (Denmark)
Phone: + 45 33151160
baltic.oceana.org
Rue Montoyer, 39
1000 Brussels (Belgium)
Tel.: + 32 (0) 2 513 22 42
Fax: + 32 (0) 2 513 22 46
Plaza de España - Leganitos, 47
28013 Madrid (Spain)
Tel.: + 34 911 440 880
Fax: + 34 911 440 890
www.oceana.org
1350 Connecticut Ave., NW, 5th Floor
Washington D.C., 20036 (USA)
Tel.: + 1 (202) 833 3900
Fax: + 1 (202) 833 2070
33 Cor. Regent and Dean St.
Belize City, Belize, C.A.
Tel.: + 501 227 2705
Fax: + 501 227 2706
Av. Condell 520,
Providencia, Santiago (Chile)
CP 7500875
Tel.: + 56 2 925 5600
Fax: + 56 2 925 5610
sher
ies
man
agem
ent
in t
he B
altic
Sea