Embed Size (px)
Citation preview

PHYSICO-FUNCTIONAL PROPERTIES OF WHEAT-MORAMA BEAN
COMPOSITE FLOUR AND ITS PERFORMANCE IN FOOD SYSTEMS
A THESIS SUBMITTED TO THE SCHOOL OF GRADUATE STUDIES, UNIVERSITY
OF GHANA
BY
LESEGO BUDDY PHUTHEGO
(10361129)
IN PARTIAL FULFILLMENT OF THE REQUIREMENTS FOR THE AWARD OF THE
MASTER OF PHILOSPHY DEGREE IN FOOD SCIENCE
JUNE, 2014.
University of Ghana http://ugspace.ug.edu.ghUniversity of Ghana http://ugspace.ug.edu.gh

i
DECLARATION
This is to certify that this thesis is the result of research undertaken by Lesego Buddy
Phuthego towards the award of the Masters of Philosophy in Food Science in the
Department of Nutrition and Food Science, University of Ghana
………………………………………. …………………………….
Lesego Buddy Phuthego Date
(Student)
………………….....………….. ………………………….
Dr. F. K. Saalia Date
(Supervisor)
…………………..………….. …………………………..
Prof. E. Sakyi-Dawson Date
(Supervisor)
University of Ghana http://ugspace.ug.edu.ghUniversity of Ghana http://ugspace.ug.edu.gh

ii
ABSTRACT
There is an increasing demand for variety in food products, mankind rely on very limited
number of crops to meet the needs of staple diets on a very limited number of major non-
food crops to meet the associated needs, the functionality of wheat-morama bean
composite flour for food applications was thus investigated. Morama bean (Tylosema
esculentum) was shelled and milled into flour. Part of the morama bean flour was defatted
using n-hexane. Wheat flour (both hard and soft) was substituted with defatted and full fat
morama bean flour at varying levels and their physico-functional and pasting properties
determined. The design of the study followed a 2 X 2 X 4 factorial design for morama
bean flour (full fat and defatted), wheat flour type (soft and hard) and morama bean flour
substitution level in composite flour (10, 20, 30 and 40%).
The least gelation concentrations of the wheat-morama composites were quite low with
some composites gelling at 4%. The functionality of the composite flours was significantly
influenced by the particles size distribution of the morama bean flour. Defatted morama
bean flour had a similar particle size distribution as the soft wheat flour. Full fat morama
bean flour generally had larger particle sizes due to the presence of fat. At 70°C, water
absorption capacity of the composite flours decreased with increasing morama bean flour
(full fat or defatted) concentration. The functionality of the composite flours was more
influenced by morama bean flour (defatted or full fat) level than by wheat type (soft or
hard wheat). Incorporation of morama bean flour (both defatted and full fat) to wheat
reduced the pasting indices of peak viscosity, breakdown and setback even when as little
as 5% of full fat morama bean flour was added. At 40% morama level of substitution the
composite flour did not show meaningful pasting profile.
At 30°C the water sorption behavior of the composite flours was influenced by the amount
and type of morama bean flour. The equilibrium moisture content of composite flour with
University of Ghana http://ugspace.ug.edu.ghUniversity of Ghana http://ugspace.ug.edu.gh

iii
defatted morama bean flour was more sensitive to increasing water activity, indicating the
possibility of it being less stable due to moisture absorption during storage than full –fat
morama flour composites. Monolayer values of the composite flour were influenced by the
level of morama bean flour (full fat and defatted). The GAB model was the better model in
describing the relationship between water activity and moisture content of soft wheat-
morama bean flour, as compared to the BET model.
Consumer preference tests data showed that twenty (20) percent substitution of soft wheat
with full fat morama bean flour was the preferred composite flour for making biscuits.
The successful application of morama bean flour in food systems will enhance its
utilization and improve food and nutrition security.
University of Ghana http://ugspace.ug.edu.ghUniversity of Ghana http://ugspace.ug.edu.gh

iv
DEDICATION
Glory be to God Almighty.
This is dedicated to my lovely mother Gerita Dikhai, beloved sister Pinkie and my brother
Bashen.
University of Ghana http://ugspace.ug.edu.ghUniversity of Ghana http://ugspace.ug.edu.gh

v
ACKNOWLEDGEMENT
I would like to give special appreciation to my supervisors, Prof Esther Sakyi-Dawson and
Prof. Firibu Saalia, you made this possible, thank you for the guidance and support all
throughout the work. Dr Jose Malete for giving me this great opportunity to further my
studies, and the University of Botswana through SIDA for funding my work.
To all lecturers and staff of the Department of Nutrition and Food Science, University of
Ghana, I say thank you for the input you made making my graduate studies successful.
A thank you also goes to following:
The National Food Technology Research Centre, Botswana for providing me with morama
beans.
Chemistry Department of the University of Ghana, for letting me make use of their
laboratory to defat my bean flour.
University of Ghana’s International Programmes Office, for your support.
Relatives and friends, for their words of encouragement and support.
My Ghanaian family (Freddy and Emma) for opening their home to me.
University of Ghana http://ugspace.ug.edu.ghUniversity of Ghana http://ugspace.ug.edu.gh

vi
TABLE OF CONTENTS
DECLARATION ............................................................................................................... i
ABSTRACT ..................................................................................................................... ii
DEDICATION ................................................................................................................ iv
ACKNOWLEDGEMENT ................................................................................................ v
TABLE OF CONTENTS ................................................................................................. vi
LIST OF TABLES………………………………………………………………………...xii
LIST OF FIGURES ........................................................................................................ xii
LIST OF PLATES ......................................................................................................... xiii
LIST OF ABBREVIATIONS ....................................................................................... xivi
1.0INTRODUCTION ....................................................................................................... 1
1.1 Background ................................................................................................................ 1
1.2 Problem statement ...................................................................................................... 2
1.3 Rationale .................................................................................................................... 2
1.4 Objectives .................................................................................................................. 3
1.5 Specific objectives ..................................................................................................... 3
2.0 LITERATURE REVIEW ........................................................................................... 4
2.1 Background information on the Morama bean ............................................................ 4
2.1.1 Physical traits of morama bean ................................................................................ 4
2.1.2 Chemical composition of morama bean ................................................................... 5
2.2 Defatted legume flours .............................................................................................. 7
2.3 Particle size distribution of legume flours ................................................................... 8
2.4 Composite flours ........................................................................................................ 9
2.5 Nutritional composition of composite flours ............................................................. 10
2.5.1 Protein .................................................................................................................. 10
2.5.2 Fat ......................................................................................................................... 11
2.5.3 Moisture ................................................................................................................ 11
2.6 Functional properties of legume flours ..................................................................... 11
2.6.1 Bulk density .......................................................................................................... 11
2.6.2 Water and oil absorption ....................................................................................... 12
2.6.3 Emulsion capacity and stability ............................................................................. 13
2.6.4 Foaming capacity and stability .............................................................................. 14
University of Ghana http://ugspace.ug.edu.ghUniversity of Ghana http://ugspace.ug.edu.gh

vii
2.6.5 Least gelation concentration .................................................................................. 14
2.7 Sorption isotherms .................................................................................................... 15
2.7.1 Brunauer-Emmett-Teller (BET) equation. ............................................................. 16
2.7.2 Guggenheim -Anderson-de Boer (GAB) model: .................................................... 17
2.8 Rheological properties of composite flour ................................................................ 18
2.8.1 Pasting properties .................................................................................................. 18
2.9 Biscuits .................................................................................................................... 19
2.10 Physical properties of biscuits ................................................................................ 20
2.11 Sensory evaluation of biscuits ................................................................................ 20
3.0 MATERIALS AND METHODS .............................................................................. 22
3.1 Experimental design ................................................................................................. 22
3.2 Material acquisition.................................................................................................. 22
3.3 Production of full fat and defatted morama flour ...................................................... 22
3.4 Production of composite flours ................................................................................. 23
3.5 Proximate Analysis .................................................................................................. 25
3.5.1 Determination of protein content… ................................................................... ….25
3.5.2 Determination of fat content .................................................................................. 25
3.5.3 Determination of ash content ................................................................................. 25
3.5.4 Determination of moisture content ........................................................................ 25
3.6 Determination of particle size distribution ................................................................ 25
3.7 Functional Properties............................................................................................ 26
3.7.1 Determination of Bulk density ............................................................................... 26
3.7.2 Determination of water absorption and oil absorption……………………………...26
3.7.3 Determination of emulsifying properties ............................................................... 27
3.7.4 Determination of Least gelation concentration……………………………………..27
3.7.5 Determination of foaming properties ..................................................................... 28
3.8 Sorption Isotherm analysis……………………………………………………………28
3.9 Determination of pasting properties .......................................................................... 29
3.10 Biscuits production ................................................................................................ 30
3.11 Physical parameters of biscuits ............................................................................... 30
3.12 Colour analysis ...................................................................................................... 31
3.13 Sensory evaluation .................................................................................................. 31
4.0 RESULTS AND DISCUSSION ................................................................................ 32
4.1 Proximate analysis of the flours ................................................................................ 32
University of Ghana http://ugspace.ug.edu.ghUniversity of Ghana http://ugspace.ug.edu.gh

viii
4.1.1 Protein content of whole flours .............................................................................. 32
4.1.2 Fat content of whole flours .................................................................................... 32
4.1.3 Ash content of whole flours................................................................................... 33
4.1.4 Moisture content of whole flours ........................................................................... 33
4.2 Analysis of the Wheat Flour and composite flours ..................................................... 34
4.2.1 Particle size distribution of whole flours ................................................................ 34
a) SOFT WHEAT ........................................................................................................... 35
4.2.2 Soft wheat and full fat morama blends................................................................... 35
4.2.3 Soft wheat and defatted morama blends................................................................. 36
b) HARD WHEAT ......................................................................................................... 38
4.2.4 Particle size distribution of Hard wheat and full fat morama flour blends .............. 38
4.2.5 Particle size distribution of Hard wheat and defatted morama flour blends ............ 39
4.3 Moisture content of composite flours ....................................................................... 40
4.4 Functional Properties ............................................................................................... 41
4.4.1 Bulk Density of the flours ..................................................................................... 42
4.4.2 Water absorption ................................................................................................... 43
4.4.3 Oil absorption ....................................................................................................... 47
4.4.4 Emulsifying properties (emulsifying capacity and emulsifying stability) ............... 49
4.4.4.1 Emulsifying capacity .......................................................................................... 49
4.4.4.2 Emulsifying stability .......................................................................................... 51
4.4.5 Foaming properties (foaming capacity and foaming stability) ................................ 52
4.4.6 Least gelation concentration .................................................................................. 55
4.5 Sorption isotherms for soft wheat and morama bean flour at 30°C............................. 56
4.5.1 Sorption isotherm of soft wheat – morama bean flour based on GAB model........... 57
4.5.2 Sorption isotherm of soft wheat – morama bean flour based on BET model .......... 61
4.5.3 Monolayer Moisture Content .................................................................................. 65
4.5.4 Best of fit .............................................................................................................. 65
4.6 Pasting properties of doughs..................................................................................... 65
4.7 Biscuit Dough formation .......................................................................................... 68
4.8 Physical analysis of the biscuits ................................................................................ 69
4.9 Colour analysis of biscuits ........................................................................................ 70
4.10 Sensory evaluation of biscuits ................................................................................. 71
University of Ghana http://ugspace.ug.edu.ghUniversity of Ghana http://ugspace.ug.edu.gh

ix
4.11 Appearance ............................................................................................................. 72
4.12 Colour ..................................................................................................................... 72
4.13 Crispiness…………………………………………………………………………….73
4.14 Texture.................................................................................................................... 73
4.15 Taste………………………………………………………………………………….74
4.16 Overall acceptance of the biscuits…………………………………………………...74
5.0 CONCLUSIONS AND RECOMMENDATIONS .................................................... 76
5.1 Conclusion ................................................................................................................ 76
5.2 Recommendations .................................................................................................... 77
5.3 REFERENCES ......................................................................................................... 79
6.0 APPENDICES .......................................................................................................... 92
Appendix 1 ..................................................................................................................... 92
Appendix 2 ................................................................................................................... 100
Appendix 3. .................................................................................................................. 101
University of Ghana http://ugspace.ug.edu.ghUniversity of Ghana http://ugspace.ug.edu.gh

x
LIST OF TABLES
Table 4.1: Proximate analysis of the whole flours in dry matter per 100g
sample…………………………………………………………………..…………..……..34
Table 4.2: Moisture contents for the different composite flours… ………………………41
Table 4.3: Bulk densities of wheat and morama flours…………………………………...42
Table 4.4: Bulk densities of composite flours…………………………………………….43
Table 4.5: Least gelation capacity of whole flours and composite flours………….……..58
Table 4.6: Values of parameters α, β, γ of the GAB equation and their regression
coefficients.………………………………………….………………………………….....62
Table 4.7: Values of parameters α, β, γ of the BET equation and their regression
coefficients………………………………………………………………………………..65
Table: 4.8 Pasting properties of the whole flours and composite flours………………….67
Table 4.9: Physical analysis of biscuits...............................................................................70
Table 4.10: Colour of wheat-morama composite flour biscuits..........................................71
Table 4.11: Sensory acceptability ratings of biscuits made from soft wheat-morama bean
composite flour……………………………………………………………………………75
University of Ghana http://ugspace.ug.edu.ghUniversity of Ghana http://ugspace.ug.edu.gh

xi
LIST OF FIGURES
Figure 3.1: Flow chart of sample preparation of full fat and defatted morama bean
flour………………………………………………………………………………………..22
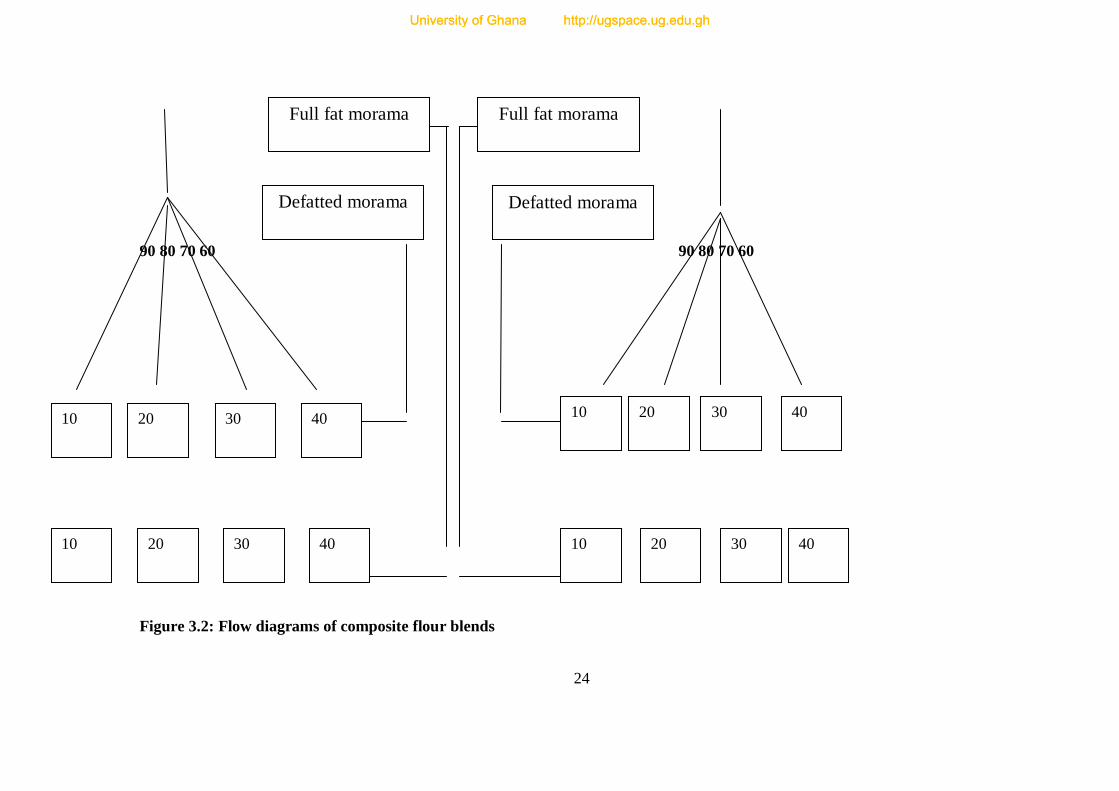
Figure 3.2: Flow diagrams of composite flour blends……………………………..….......24
Figure 4.1: Particle size distribution of the wheat, full fat morama bean and defatted
morama bean flours………………………………….…………………………………....35
Figure 4.2: Particle size distributions for soft wheat and full fat morama composites
flours……………………………………………………………………………………...36
Figure 4.3: Particle size distributions for soft wheat and defatted morama bean composites
flours…….………………………………………………………………………………..37
Figure 4.4: Particle size distributions for hard wheat and full fat morama bean composites
flours…….………………………………………………………………………………..39
Figure 4.5: Particle size distributions for hard wheat and defatted morama bean
composites……………………………………………………………………….……….40
Figure 4.6: Water absorption of wheat-morama bean flour composites and whole flours at
25°C………………………………………………………………………………………45
Figure 4.7: Water absorption of wheat-morama bean flour composites and whole flours at
70°C ……………………………………………………………………………………....46
Figure 4.8: Oil absorption capacity of whole flours and wheat-morama bean composite
flours………………….………………………………………………………………......48
Figure 4.9: Emulsifying capacity of whole flours and wheat-morama bean flour
composites……………………………………………………………………………..….50
Figure 4.10: Emulsifying stability of whole flours and wheat-morama
composites…………..………………………………………………………..…………...51
University of Ghana http://ugspace.ug.edu.ghUniversity of Ghana http://ugspace.ug.edu.gh

xii
Figure 4.11: Foaming capacity of whole flours and wheat-morama bean flour
composites………………………………………………………………………………...53
Figure 4.12: Foaming stability of wheat-morama bean flour composites and whole
flours...…………………………………………………………………………………….54
Figure 4.13: Sorption isotherms for soft wheat-morama bean flour at 30°C…..................57
Figure 4.14:Sorption isotherm for 40 percent full fat morama bean flour at 30°C based on
GAB model………………………………………………………………………………..60
Figure 4.15: Sorption isotherm for 10 percent full fat morama bean flour at 30°C based on
BET model………………………………………………………………………………...63
Figure 4.16: Pasting behavior of whole flours and composite flours……………… …….68
University of Ghana http://ugspace.ug.edu.ghUniversity of Ghana http://ugspace.ug.edu.gh

xiii
LIST OF PLATES
Plate 2.1: Morama in pods-both green and brown……………………………………5
Plate 2.2: Morama beans………………..………………………………………………7
Plate 2.3: Shelled morama beans-the edible part……………………………………...7
University of Ghana http://ugspace.ug.edu.ghUniversity of Ghana http://ugspace.ug.edu.gh

xiv
LIST OF ABBREVIATIONS
FC = Foam capacity
FS=Foam Stability
SW=Soft wheat
HW= Hard wheat
FFM= Full fat morama bean flour
DFM= Defatted morama bean flour
University of Ghana http://ugspace.ug.edu.ghUniversity of Ghana http://ugspace.ug.edu.gh

1
1.0 INTRODUCTION
1.1 Background
In spite of growing threats to food and nutritional security due to climate change and
associated factors, there are still many under-utilized food crops indigenous to the developing
world, particularly in Africa. For such crops, rigorous research work is needed to determine
their potential and applications in foods in order to derive their full benefits. Morama bean is
one of such many under exploited crops that have been shown to have exceptionally high
nutritional value (Hartley et al., 2002) and holds promise in helping to strengthen the food
and nutritional security in areas where it grows.
Morama bean, [Tylosemaesculentum (Burchell) Schreiber] (Family Fabacae) is a drought-
tolerant wild perennial legume (Nepolo et.al 2009) which is currently not cultivated but
harvested from the wild for human consumption (Amarteifio and Moholo, 1998). It is
adapted to the harsh conditions of Botswana and Namibia, which are characterized by low
rainfall and nutritionally poor soils (Hartley et al., 2002). In those regions the seeds are an
important component of the diet among the nomadic people in remote settlements where few
conventional crops can survive (Mosele et al., 2011). The mature seeds have been reported
to be exceptional as they contain high amounts of lipid (35-43%), protein (30-39%) and some
carbohydrates (18-25%) (Mpotokwame et al, 2013) but does not contain starch (Mosele et
al., 2011). Consequently the roasted mature seeds can be ground into butter, similar to
peanuts. They could also be blended with cereals to improve the nutritional value (Van der
Maesen, 2006).
The diet of an average Motswana consists of foods that are mostly carbohydrate based. There
is therefore a need for strategic use of inexpensive high protein resources that complement
the amino acid profile of the staple diet in order to enhance their nutritive value. The proteins
University of Ghana http://ugspace.ug.edu.ghUniversity of Ghana http://ugspace.ug.edu.gh

2
of morama beans have been shown to have an impressive profile of essential amino acids,
which include tyrosine, arginine, leucine and lysine (Mosele et al., 2011).The use of legumes
to enrich wheat flour is not a new technique and different legumes have been used for this
purpose. Incorporation of morama bean flour in composite flours can help cut down the costs
of importation of wheat flour and increase the availability of protein-rich flours.
1.2 Problem statement
Batswana consumers have become more aware of the benefits of healthy eating and demand
healthier foods. Botswana, a country that used to rely a great deal on animal protein, is
therefore in search of alternative ways to provide healthier and affordable plant protein. For
economic reasons too, the increasing prices of meat and meat products is making it more and
more difficult for the low income consumer to afford or acquire the required amounts of
nutrients. The solution is to provide alternative sources of good nutrition by exploring
available vegetable sources. The continuous increase in population and inadequate supply of
protein has increased the occurrence of malnutrition in developing countries (Siddhuraju,
1996). Studies have shown that malnutrition among children in developing countries is
mainly due to the consumption of cereal based porridge which is bulky, low in energy and
density and high in anti-nutrients (Michaelsen and Henrik, 1998)’.Morama-enriched flour
could play an important role in reducing malnutrition.
1.3 Rationale
Morama bean (Tylosemaesculentum) occurs naturally in the drier areas of Southern Africa,
including Botswana and Namibia, where it is not cultivated but grows in the wild. It is a good
crop for semi-arid and arid agriculture, and like other legumes it provides inexpensive forms
of proteins and oil. The application of morama bean flour in composite flours to improve the
University of Ghana http://ugspace.ug.edu.ghUniversity of Ghana http://ugspace.ug.edu.gh

3
nutritional quality of bakery products has not been exploited. As an under-utilized crop its
substitution for wheat in composite flours for bakery products will cut down on the cost of
importation of wheat, improve the nutritional quality of products, and increase morama bean
utilization in food applications.
1.4 Objectives
The main objective of this work was to develop wheat-morama bean composite flours and
assess their physical and functional properties as well as their performance in a bakery
product.
1.5 Specific objectives
The specific objectives of this study were to:
1. formulate composite flours from wheat and morama bean flours
2. Assess the physical and functional properties of wheat-morama bean composite flours
3. Analyze the quality and consumer acceptance of wheat – morama bean composite
flour biscuits.
University of Ghana http://ugspace.ug.edu.ghUniversity of Ghana http://ugspace.ug.edu.gh

4
2.0 LITERATURE REVIEW
2.1 Background information on the Morama bean
‘Tylosemaesculentum (Burch) A. Schreibpopularly known as Morama in Setswana
(Botswana), Braaiboonjie, Maramabonjie, and Elandbonjie in Afrikaans (Van Wyk and
Gericke 2000) is a wild, underutilized legume in Southern Africa and is used as a food source
by the rural communities of the Kalahari desert (Jackson et. al. 2010)’.It has also gained
some names in the process as researchers were looking at its food potential. Some call it the
magic bean of Africa and some have called it the green gold of Africa. It grows in open sand
veld and open grass and bush savannah (Amarteifio and Moholo 1998). Above ground it
produces seeds similar to the peanut or soybean but is actually higher in nutritional value than
either. Below ground it produces a tuber that is bigger and more nutritious than potatoes,
yams or sugar beet. It is dormant in winter and re-grows from the tuber in spring. The plant
grows in well-drained, fine, generally calcareous sands, but also in regions of harder
calcareous conglomerates, at pH 6 to 8, with very little organic matter, nitrate or phosphate
(Lawlor, 2004). Hartley et al., (2002) pointed that the plant is adapted to the harsh conditions
of Botswana and Namibia, which are characterized by low rainfall and nutritionally poor
soils. The plant thrives in the poor quality, sandy soil of the desert, withstanding blistering
summer temperatures, freezing nights of the Kalahari winters, and highly erratic and often
absent rainfall.
2.1.1 Physical traits of morama bean
Morama beans are reported to grow in a large, flat woody pod (Plate 2.1) in groups of
approximately six beans per pod. Jideane et al. (2009) described the morama bean as chestnut
to dark brown in color, spherical and weighing 2- 3 g each (Plate 2.2). Each bean has a hard
University of Ghana http://ugspace.ug.edu.ghUniversity of Ghana http://ugspace.ug.edu.gh

5
inedible brown outer shell with edible two lobed seeds inside. The edible part is cream in
color (Plate 2.3).
The most common way that local people prepare morama beans is by roasting the bean, still
in shells in hot sand. The beans are never eaten raw; they have been reported to have an
unpleasant slimy texture or soapy taste. However the immature beans can be boiled and
eaten, whilst still green. Menninger, (1970) indicated that, after roasting, the seeds take on a
nutty flavor that has been compared with roasted cashew nuts
Plate 2.1: Morama in pods-both green and brown
2.1.2 Chemical composition of morama bean
Many researchers have compared the composition of morama beans to that of peanuts and
soybeans. Mosele (2012) even concluded that morama bean is equally, if not more nutritious
than well known high nutritional value legumes. Jideane et al., (2009) reported that morama
protein ranges between 29.9 and 41.8 %. Its protein (29–38%) and oil (32-42%) contents
(Holse et al., 2010) are very similar to those of soya (Mujoo et al., 2003) and peanut
(Venkatachalam and Sathe, 2006). Mmonatau (2005) reported morama bean to have protein
content of 37%.
University of Ghana http://ugspace.ug.edu.ghUniversity of Ghana http://ugspace.ug.edu.gh
6
According to Jideane et al., 2009 the oil content of morama beans ranges between 32.1 and
45.3%. They described the oil as clear golden yellow and has a nutty flavor which they
associate with almond oil. Holse et al., (2010) seemed to concur with Jideane et al. (2009).
They found the morama oil content to range between 32 and 42%. Ketshajwang, Holmack
and Yeboah (1998) reported oil content of 48.2% while Mmonatau (2005) reported 39% for
morama beans as cited by Maruatona (2010).
This places morama beans in a good position in comparison with other oilseeds like
groundnuts (45-55%), sunflower seeds (22-36%), rapeseed (22-49%), or soya bean (21%)
(Salunkhe and Kadam, 1989)
Total carbohydrate content of morama has been approximated at 24% (Bower et al., 1988;
Amarteifio and Moholo, 1998; Mosele et al., 2011a) as cited by Mosele (2012). According to
Holse et al. (2010), also cited by Mosele (2012) mature morama beans have a high content of
dietary fibre with variation between 19% and 27%. They also associated the large variation to
the fact that morama bean is not a domesticated plant so some external factors cannot be
controlled.
Morama beans are also reported to contain minerals and vitamins which include potassium,
thiamin, calcium, iron, zinc, phosphorus, riboflavin and nicotinic acid (Mpotokwane et.al.
2013).
University of Ghana http://ugspace.ug.edu.ghUniversity of Ghana http://ugspace.ug.edu.gh

7
Plate 2.2: Morama beans
Plate 2.3: Shelled morama beans cotyledons
2.2 Defatted legume flours
When protein rich, stable flours are required, defatting is necessary like in the case of
leguminous oilseeds like morama beans. Full fat flours, though deemed to be more energy
dense when compared to the partially or defatted flours, are said to be lower in protein
content and are prone to hydrolytic and oxidative rancidity. The main purpose of oil
University of Ghana http://ugspace.ug.edu.ghUniversity of Ghana http://ugspace.ug.edu.gh

8
extraction is thus to reduce the oil content of oilseeds so that they can have a higher protein
content and a longer shelf life.
It has been suggested that dry heating morama beans prior to dehulling disrupts oil bodies
which allows oil to be readily available during the defatting stage. Maruatona et al (2009)
said the process thus results in higher protein content than flour produced from unheated
morama beans.
Singh et al., (2009) cited Bongirwar et al. (1979) who looked at the development of high
protein ready-to-eat foods from defatted groundnut and soybean blends and observed that
defatted soy flour mixed products gave satisfactory structure, colour and appearance.
2.3 Particle size distribution of legume flours
Milling of dry cereal or legumes is a size reduction unit operation involving a number of
stages (such as grinding, reduction, sifting and purifying) used to produce flours or meals.
Sieving happens in two stages: in the first stage the particles with much smaller sizes pass
through the sieve; and in the second stage (which is actually the slowest) particles that are
closer to that of the opening of the sieve get sieved through. ‘Particle size distribution of
flours influences functionality of cowpea paste and final end product quality (Ubbor and
Akobundu, 2009). According to Kerret al., (2001), milling the flour to too fine particle size
could result in textural quality problems in end products.
Particle size and distribution is an important characteristic contributing to product
appearance. Particle size affects the overall bulk properties of the food item such as visual
texture and density as well as color. Kerr et al., (2001) cited that larger particle size may
indicate a chewy food, whereas smaller particle size may indicate crunchy and less moist.
University of Ghana http://ugspace.ug.edu.ghUniversity of Ghana http://ugspace.ug.edu.gh

9
Determinations of particle size and its distribution in flour are important in understanding
both physical and chemical properties of food ingredients as they affect their behaviour when
in contact with water (Ayernor, 1976). In particular, particle size and particle size distribution
affect the hydration properties of food flours. Hebrard et al. (2003) observed that the size of
semolina particles influenced sorption kinetics: the finer the particles, the faster their sorption
kinetics. The authors explain that even though the biochemical composition ultimately
determines the amount of water sorbed, the particle size distribution is a determinant of the
sorption rate.
2.4 Composite flours
Composite flours are considered as blends of wheat and other flours, which can be anything
from tubers to cereal or legume and there have been instances where wheat flour was not in
the composite.
The composite flours containing wheat and legumes are utilized in many parts of the world.
The basic composite flour technology refers to the process of mixing wheat flour with cereals
and legumes to produce high quality food products in an economical way. Flours produced
from only either cereals, legumes or tubers will have a nutritional value inferior to those
produced from a combination of cereals, legumes or tubers. For instance, composite flours
produced from cereals and legumes have the advantage of improving overall nutrition (FAO,
1995) while composite flours produced from legumes and tubers will have high protein
content and will also have high calorific value (Chinma et al., 2007).
Several studies about the influence of the addition of legume flours on the functional
properties of bread dough and final bread quality have been reported. Noor et al. (2012)
indicated that there were significant changes in the composition, like the protein content of
University of Ghana http://ugspace.ug.edu.ghUniversity of Ghana http://ugspace.ug.edu.gh

10
chick pea cookies showed to be the highest while mung bean cookies showed high ash
content and this was attributed to the high mineral content of mung bean.
Awadhesh et al. (2009) observed that protein content of soy-fortified mix increased and
postulated it was due to the use of higher protein content of defatted soy flour. McWaters
(1978) indicated that protein content was significantly affected by the addition of peanut flour
to the sugar cookie- each increment raised the protein content by 1.5%-and cookies prepared
from the 30% peanut flour formulation showed double the protein (8.9%) as compared with
the control.
2.5 Nutritional composition of composite flours
There are two reasons for making composite flours, economic and nutritional. It is for these
reasons that legumes have been used extensively in composite flours; they are superior in
nutrition content, compared to tubers or cereals and thus provide cheaper protein. When
added to the wheat or any other flour then they are expected to help improve the nutritional
status of that flour.
2.5.1 Protein
The findings by Ubbor and Akobundu (2009) claimed that a blend of watermelon seed and
cassava flour (90:10) showed to have more protein content than a 50:50 blend of the same
flours. The protein content seemed to increase with the watermelon seed flour content. They
attributed this increase to the fact that watermelon seed has a high content of protein. Saleh et
al. (2012) reported that as the substitution of either defatted flour or chickpea was increased
from 5% to 15%, the protein content of biscuits increased. A higher increase was reported in
defatted soy flour.
University of Ghana http://ugspace.ug.edu.ghUniversity of Ghana http://ugspace.ug.edu.gh

11
2.5.2 Fat
According to Ubbor and Akobundu, (2009) a blend of watermelon seed flour and cassava
90:10 had higher amount of fat, followed by a blend of watermelon seed flour and cassava
flour 85:15. The fat content of biscuits increased from 14.6 to 24.0% with the increase in soy
flour from 0 to 25% as was reported by (Banureka and Mahendran, 2009). Soy bean flour has
a high amount of fat and this could have contributed to their findings.
2.5.3 Moisture
In their results Saleh et al. (2012) showed that as wheat was substituted with defatted soy
flour or chickpea flour the moisture content showed a gradual increase in biscuits. Banureka
and Mahendran (2009) found that the moisture content of the control was higher than that of
wheat-soy bean flour biscuits. The moisture content decreased from 2.90 to 1.53% as the
soybean flour was increased from 0 to 25%. This was attributed to the fact that soy bean flour
has a lot of dry matter and higher emulsifying properties than wheat.
2.6 Functional properties of legume flours
The term "functional property" as applied to food ingredients, is defined as any property,
aside from nutritional attributes, that influences the ingredient's usefulness in food. Most
functional properties play a major role in the physical behaviour of foods or food ingredients
during their preparation, processing, or storage (Fennema, 1985).
2.6.1 Bulk density
The bulk density gives an indication of the relative volume of packaging material required; it
is a reflection of the load a sample would carry if allowed to rest directly on one another.
Ikpeme et al. (2010) looked at the difference between loose bulk density and packed bulk
University of Ghana http://ugspace.ug.edu.ghUniversity of Ghana http://ugspace.ug.edu.gh
12
density, the slight differences according to them indicated that the incorporation of taro did
not cause a significant decrease in bulk densities of flour blends. They also pointed out that
lower bulk densities are more desirable as they imply the sample would pack better during
storage or distribution. High bulk density is a good physical attribute when determining the
mixing quality of a particular matter.
Edema et al. (2005) found that their values for bulk density were generally lower (between
0.38 for commercially sold soybean flour and 0.55 for Maize soya blend) than those obtained
by Amarjeet et al. (1993) for durum wheat blends (0.80 to 0.82).Butt and Batool, (2010)
reported that the defatting process results in porous texture of the defatted product that can be
attributed to low bulk density. This would be an advantage in the formulation of
complementary foods (Akpata and Akubor, 1999).
2.6.2 Water and oil absorption
Water absorption is the amount of water absorbed by flour to produce dough of workable
consistency. Interactions of water and oil with flours are very important in food systems
because of their effects on the flavor and texture of foods.
High water absorption may assure the product cohesiveness and this is a functional
characteristic mostly important for ready-to-use foods but may also be important for dough
making. Proteins are mainly responsible for the bulk of the water uptake and to a lesser extent
the starch and cellulose at room temperature (Afoakwa, 1996). Ikpeme et al. (2010) claimed
their results suggested that indeed addition of taro flour affected the water absorption. In their
case the taro starch actually inhibited the absorption of water as the 90:10wheat: taro blend
had the highest absorption of water. Uzor-Peters et al.(2008) suspected that the addition of
defatted soy flour or defatted groundnut cake flour for kokoro (a finger-like maize-based
snack food that is consumed alone or with roasted groundnuts) formulation may have
University of Ghana http://ugspace.ug.edu.ghUniversity of Ghana http://ugspace.ug.edu.gh

13
increased the oil absorption capacity of the product which resulted in a higher fat content of
the products: 26.8% for defatted soya flour and 34.06% for defatted groundnut cake flour.
Olu et al. (2012) reported that the water absorption of yam flour reduced as the proportion of
soy flour was increased.
The importance of oil absorption is in the fact that oil acts as a flavour retainer and helps
increase the mouth feel of food. The main chemical component affecting the oil absorption
capacity is protein which is composed of both hydrophilic and hydrophobic parts. Non polar
amino acid side chain can form hydrophobic interactions with hydrocarbon chains of lipid
(Jitngarmkusol et al., 2008).
2.6.3 Emulsion capacity and stability
Emulsion capacity and emulsion stability are critical parameters that affect the choice of a
protein for use in an industrial process. Proteins can reduce tension at the water-oil interface
and help prevent coalescence (McWatters and Cherry, 1981). A protein‘s stabilizing effect in
an emulsion comes from the membrane matrix that surrounds the oil drop and prevents its
coalescence.
High emulsion capacity could be an indication that the flour can make a good emulsifier with
other foods. Kohajdova et al. (2011) associated the higher emulsion capacity of legumes with
the dissociation and partial unfolding of globular proteins, leading to exposure of
hydrophobic amino acid residues, which consequently increase the surface activity and
adsorption at the oil and water interface. When incorporating chickpea in wheat flour,
Kohajdova et al. (2011) concluded that the ability to form an emulsion was majorly from the
chickpea flour than from the wheat flour.
Carvalho et al. (2006) pointed that the ability of a protein to interact with both the water and
oil shows that they possess well balanced proportions of externally hydrophilic and
University of Ghana http://ugspace.ug.edu.ghUniversity of Ghana http://ugspace.ug.edu.gh

14
hydrophobic groups and could be used as thickeners, viscosity and adherence enhancers in
addition to increasing flavor retention.
2.6.4 Foaming capacity and stability
Another practical application of proteins in industrial production comes from their ability to
generate foam (foam capacity). Proteins must be highly soluble in water, flexible and form
part of a cohesive film at the water-air interface to ensure good foam formation (Wagner and
Gueguen, 1999). The film should possess sufficient viscosity to prevent rapture and
subsequent coalescence (foam stability).
Researchers report that defatting markedly increases the foaming properties of flours and thus
make better aerating agents. Partially defatted flaxseed flour samples were reported by
Hussainet al. (2008) to have higher foam capacity and stability. Giami and Bekebian (1992)
and Egbekun and Ehieze (1997) reported that the foam of defatted flours was more stable
than that of the full fat flours.
2.6.5 Least gelation concentration
The ability of protein to form gels and provide structure matrices for holding water flavours,
sugars and food ingredients is useful in food applications and in new product development,
thereby providing an added dimension to protein functionality (Devi and Haripriya, 2012).
The ability of seed flour to form gels is especially desirable in extended meat products.
Protein gelation is vital in the preparation and acceptability of many foods, including
vegetables and other products (Lawal et al., 2007). Lower least-gelation concentration
enhances the swelling capacity of the flour. According to (Ikpeme et al., 2010), the taro
blends had better gelling capacity; the least gelation concentration of wheat and taro blends
ranged from 6-8% while the control had a high gelation concentration of 10%. Complete
gelation of instant chickpea incorporated in wheat flour was reported to be 6% by (Kohajdova
University of Ghana http://ugspace.ug.edu.ghUniversity of Ghana http://ugspace.ug.edu.gh

15
et al., 2011). The gelation concentration is said to be interrelated to water absorption
capacities, the lower the water absorption could mean low gel formation. It readily takes
place at higher protein concentration because the intermolecular contact during heating is
high.
2.7 Sorption isotherms
The shelf life of packaged food materials has been shown to be influenced greatly by the
temperature, relative humidity and moisture content and thus the water activity of the
material. The knowledge and understanding of sorption isotherms is highly important in food
science and technology for the design and optimization of drying equipment, designing of
packages, predicting of quality, stability, shelf life, and calculating moisture changes that may
occur during storage (Abramovic and Klofutar, 2006).
Several different isotherm models have been proposed and compared in the literature to fit
the moisture sorption behavior of different food powders at different storage temperatures.
Some of these models have theoretical basis while others are semi -empirical or fully
empirical. Staudt et al., (2013) reported that these models are necessary to predict the
moisture content at a given water activity and are used to evaluate thermodynamic functions
of water in foods.
The most common equations that are used for describing sorption in food products are the
Langmuir equation, the BET equation, the Oswin model, the Smith model, the Halsey model,
the Henderson model, the Iglesias-Chirife equation, the GAB model, and the Peleg model.
NIkolay D. Menkov and Albena G. Durakov (2006) used the five models (modified Oswin,
modified Halsey, modified Chung -Pfost, modified Henderson and Guggenheim-Anderson-de
Boer (GAB) to determine the moisture equilibrium (adsorption and desorption) of sesame
flour. The GAB model was found to be the most suitable for describing the sorption data and
University of Ghana http://ugspace.ug.edu.ghUniversity of Ghana http://ugspace.ug.edu.gh

16
the monolayer moisture content was estimated using the Brunauer- Emmertt- Teller (BET).
Saad et al., (2007) modelled the experimental water adsorption isotherms of wheat flour
based on the two parameter model (BET), the three parameter model (GAB) and the four
parameter model (TSS).
2.7.1 Brunauer-Emmett-Teller (BET) equation.
The BET equation (1938), which is the most widely used model in food systems, was first
proposed by Brunauer, Emmett and Teller and it represents a fundamental milestone in the
interpretation of multi-layer sorption isotherms, particularly the types II and III. It is reported
to be an effective method for estimating the amount of bound water in specific polar sites of
dehydrated food systems. The BET model is usually presented as follows:
=
Where:
M = water content on a dry basis at equilibrium
Xm =water content when each sorption site contains one water molecule (monolayer)
aw = water activity
C = sorption constant which is related to the energy interaction between the first and further
sorbed molecules at the individual sorption site.
An important issue regarding BET model is that its assumptions are expected to hold only for
small values of aw, up to 0.4–0.5. However, for some food materials the BET model has been
shown to produce reasonable agreement with experimental data over the whole range of
water activity (Cassini et al., 2006; Mulet et al., 1999; Thys et al., 2010). Another interesting
feature of the BET model is the fact that it includes the monolayer moisture content (Xm),
University of Ghana http://ugspace.ug.edu.ghUniversity of Ghana http://ugspace.ug.edu.gh

17
which is a parameter of interest in dried foods. The value of the monolayer is of particular
importance because it indicates the amount of water that is strongly adsorbed in specific sites,
and it is considered to be the value at which a food product is the most stable (Andrape et. al
2011)
2.7.2 Guggenheim-Anderson-de Boer (GAB) model:
The term GAB model comes from the names Guggenheim, Anderson and De Boer, who
independently derived the equation in 1966, 1946and 1953, respectively (cited by Andrape et.
al 2011). The model can be stated as follows:
=
Where:
Xm = water content when each sorption site contains one molecule (monolayer)
aw = water activity
M = water content on a dry basis at equilibrium
C and K = sorption constants that are related to the energy interaction between the first and
further sorbed molecules at the individual sorption site.
The GAB model has been used due to its theoretical bases, it describes the sorption behavior
in a wide range of aw (0 - 0.9). The major advantages of the GAB model are reported to be
that it has a viable theoretical background since it is a further refinement of Langmuir and
BET theories of physical adsorption and also it provides a good description of the sorption
behaviour of almost every food product (aw-0.9) (Andrape et al 2011).
University of Ghana http://ugspace.ug.edu.ghUniversity of Ghana http://ugspace.ug.edu.gh

18
2.8 Rheological properties of composite flour
Mechanical and rheological properties of dough play an important part in governing the
quality of baked products. Wheat flour contains the viscoelastic gluten which gives specific
rheological properties to the dough and in turn influences the final quality of the baked
product. Addition of another component which lacks the gluten to wheat, like in composition
of composite flours is expected to affect or influence the rheological properties of the
resultant dough. This is majorly from the dilution effect of partially replacing some of the
wheat component. In a study on wheat-cassava composite flours, Khalil et al. (2000) reported
that there was a progressive reduction in water absorption of flours with an increase in
substitution with cassava flour, possibly due to reduced protein content of the composite
flours. Mixing time, stability, and strength of the composite doughs also increased as the
proportion of cassava flour increased. From the results obtained by (Saleh et. al., 2012) it was
observed that increasing the substitution levels in the blends from 5 to 15% of either the
defatted soy flour or the chickpea flour, the water absorption was found to be increased in all
blends as compared to the control, (100%) wheat flour. The dough development time on the
other hand was observed to decrease as the level of defatted soy flour was increased in the
blend from 5 to 15%, the dough development time was not different for all the blends of the
chickpea flour from 5 to 15%.
2.8.1 Pasting properties
Adunni and Olaposi (2010) observed soybean substitution to reduce the peak value and
holding strength values in a blend of banana flour with defatted soybean flour. Banana flour
was reported to have higher binding capacities and could better form viscous gel in hot
condition than the substituted samples. Many studies have confirmed that protein and
hydrolyzed protein can also influence the pasting properties of starch by affecting thermal
University of Ghana http://ugspace.ug.edu.ghUniversity of Ghana http://ugspace.ug.edu.gh

19
transition, the network of gel, and competition of available water. Ikegwu et al. (2010)
attributed the interaction of starch with protein and fat as factors that influenced the pasting
characteristics, which decrease peak viscosity, trough, setback and final viscosity of
Bracheytegiaeurycoma. Devi and Haripriya (2012) observed the same behavior of reduced
pasting potentiality of wheat when replaced by soy that was observed by Adunni and Olaposi
(2010) when substituting banana with soy flour. The decreased peak and breakdown viscosity
of the starch in the flours could be correlated to the high protein content (Ayo et al., 2007).
2.9 Biscuits
In earlier times some dough products were baked twice, once to set the structure of the
product and again to further reduce the moisture content so the product acquired a long shelf
life. This was convenient for travelers, soldiers, and sailors. Only a few products are baked
twice nowadays and these are rusks, biscotti, croutons, and Melba toast while most biscuits
and cookies are baked only once (Birt, 2011). Urbanization and the increased number of
women working have put the rate of snack food consumption on the rise. Biscuits hold an
important position in snack foods due to variety in taste, ready-to- eat nature, crispiness and
digestibility. Biscuits have become one of the most desirable snacks for both youth and
elderly people due to their low manufacturing cost, convenience, long shelf-life, and ability to
serve as a vehicle for important nutrients (Akubor, 2003; Honda and Jood, 2005).
The success of biscuits and cookies can be attributed to four key factors which include their
relatively long shelf life, the human liking and weakness for sugar and chocolate and finally
their relatively good value for money.
Aleem et al. (2012) found that thickness of biscuits increased with increase in concentration
of defatted soy flour. The reduction of spread ratio of biscuits was attributed to better binding
strength of soy protein, also resulting in increase of thickness. The defatted soy flour
University of Ghana http://ugspace.ug.edu.ghUniversity of Ghana http://ugspace.ug.edu.gh

20
incorporated biscuits were reported to have lower hardness and this may be due to high water
binding capacity of defatted soy flour.
2.10 Physical properties of biscuits
Aleem et al. (2012) reported a linear decrease in total weight, diameter, spread ratio and
hardness of biscuits as the level of defatted soy flour incorporation was increased. Biscuit
thickness was reported to increase with the increase of incorporation. Similarly, the authors
observed a gradual decrease in weight when defatted soy flour or chickpea flour was
incorporated to wheat flour and cited Yadav et al. (2012) and Aleem et al. (2012) who
respectively related it to low oil absorption properties of chickpea flour or good binding
properties of defatted soy flour
2.11 Sensory evaluation of biscuits
Sensory analysis on biscuits is conducted in order to evaluate if some wheat may be replaced
by legume flour without a significant change in the sensory profile.
Aziah et al. (2011) work showed that cookies prepared from chickpea and mung were rated
high in flavour, crispiness, aftertaste, colour and overall acceptability with significant
difference (p<0.05) as compared to the control. There was a pronounced aftertaste in the
mung bean and chickpea cookies but these cookies were still significantly preferred over the
control. They concluded that the addition of mung bean and chickpea flour did not change the
functional properties but rather increased the protein content and the acceptability of cookies.
Aleem et al., (2012) pointed out that the colour characteristics of biscuits became darker with
the increase in concentration defatted soy flour, the grainy appearance of the biscuits from
incorporated formulation was more acceptable but the excessive grainy appearance was not
as accepted. A slight improvement in crispness was also noted in the biscuits from the
University of Ghana http://ugspace.ug.edu.ghUniversity of Ghana http://ugspace.ug.edu.gh
21
defatted soy flour incorporated formulation. They concluded that the incorporation of
defatted soy flour to the level of 20% is superior to all other treatments including the control.
Work done by Shahzad et al., (2006) on the other hand showed that increasing the level of
flaxseed flour resulted in the significant decrease in the sensory attributes of the biscuits as
the biscuits made from wheat flour had a better score for overall acceptability than those
made from 5% full fat flaxseed flour.
This work aims at using underutilized legume to make composite flours with wheat flour, the
crop is nutritious but the downside is that it grows in the wild though efforts to grow it are
underway but in the meantime the source remains unreliable. The use of defatted flour is
advantageous since it is regarded to have a better shelf life and defatted flour is believed to be
more nutritious but at the same time the process of removing the oil could be tedious and
expensive. Addition of legume to wheat flour to form composite will definitely alter the
particle size distribution of the resulting flour. The particle size distribution affects the
hydration properties of the flour and thus should be known so as to know which food system
the flour would be more suited. Protein is responsible for the gelling properties, this is
important in water holding and retaining flavours. It is thus relevant to determine the gelling
properties of flours. The sorption isotherm helps determine the behavior of flours in different
conditions, humidity, temperatures and can also be used to help choose the kind of package
for the flour given how it behaves. The next step would be to determine the isotherms in
different temperatures to see how the flour behaves in different conditions as only one
temperature was used here. Finally the consumers have much say on the final product, its
appearance, taste, smell and overall. The consumers are the ones that are going to utilize the
product so should be given chance to decide if it is something that they would be interested
in.
University of Ghana http://ugspace.ug.edu.ghUniversity of Ghana http://ugspace.ug.edu.gh

22
3.0 MATERIALS AND METHODS
3.1 Experimental design
A 2x2x4 factorial experimental design was used and the principal factors were:
1. Type of wheat; soft and hard
2. Pre treatment of morama; full fat and defatted
3. Substitution level of morama; 10%, 20%, 30% and 40%.
3.2 Material acquisition
Morama beans were acquired from National Food Technology Research Center (Kanye) in
Botswana. They were kept in a cool dry place at 25-30°C.
3.3 Production of full fat and defatted morama flour
The process for obtaining full fat and defatted morama bean flour is as outlined in Figure 3.1.
Figure 3.1 Flow chart of sample preparation of full fat and defatted morama bean flour
Morama beans
Shelling
Sorting
Milling
Sieve
Full fat flour
Package and store
Solvent extraction using n-hexane
oven dry at 50°C
Sieve
Defatted flour
Package and store
University of Ghana http://ugspace.ug.edu.ghUniversity of Ghana http://ugspace.ug.edu.gh

23
3.4 Production of composite flours
Both soft and hard wheat flours were purchased from a local flour milling company (Irani
Brothers Ltd) in Tema near Accra. Sixteen composite flours were prepared according to the
design of the study, by substituting soft and hard wheat flour with full fat and defatted
morama bean flour in the percentage proportions of 0:100, 10:90, 20:80, 30:70 and 40:60%
respectively.
University of Ghana http://ugspace.ug.edu.ghUniversity of Ghana http://ugspace.ug.edu.gh
24
90 80 70 60 90 80 70 60
Figure 3.2: Flow diagrams of composite flour blends
10
Defatted morama
Defatted morama
10
10 20 30 40
40 30 20 20
10 20 30 40
30 40
Full fat morama Full fat morama
University of Ghana http://ugspace.ug.edu.ghUniversity of Ghana http://ugspace.ug.edu.gh

25
3.5 Proximate Analysis
3.5.1 Determination of protein content
Protein content was determined using the Kjeldahl procedure as described in AOAC (2000).
The nitrogen content obtained was multiplied by a factor of 6.25 to obtain protein content in
the sample.
3.5.2 Determination of fat content
Crude fat was extracted in a Soxhlet extractor with petroleum ether as described in AOAC
(2000).
3.5.3 Determination of ash content
Ash content was determined according to AOAC (2000).
3.5.4 Determination of moisture content
Moisture content was determined following the procedure (AOAC, 2000) using the air-oven
at 105°C for 3hours.
3.6 Determination of particle size distribution
The particle size distribution of flour samples obtained from the blends of wheat and morama
bean flour was carried out using a sieve analysis technique with the aid of Endecotts Test
Sieve Shaker (model 1 MK11-11381, London, UK) as described by Bolade and Buraimoh
(2006). Different sieves with varying apertures (that is 35, 50,106,150 and 300 µm) were
arranged on top of each other with the one having the biggest aperture on the topmost level
and then arranged in decreasing order of aperture. The sieves were fastened into a rigid
University of Ghana http://ugspace.ug.edu.ghUniversity of Ghana http://ugspace.ug.edu.gh

26
position using a fastening screw after a standard quantity of the flour sample (50g) was
already placed inside the topmost sieve. The sieve shaker was then switched on for 10 min
after which the quantity of flour retained on each sieve was collected and weighed.
Calculation:
% recovered =
Where: W sieve is the weight of the aggregate in the sieve
W total is the weight of the total aggregate.
3.7 Functional Properties
3.7.1 Determination of Bulk density
Bulk density was followed according to the method of Asoegwu et al. (2006) with slight
modifications. Fifty grams (50g) samples were placed in a 100 ml graduated cylinder and
packed by gently tapping the cylinder on the bench top to attain a constant volume and the
volume of the sample was recorded. The procedure was repeated three times for each sample
and the bulk density was computed as g/ml of the sample.
=
3.7.2 Determination of Water absorption and oil absorption
Water absorption capacity was determined using the method of Sathe and Salunkhe, (1981) as
modified by Adebowale et al. (2005), with some modifications. Twenty milliliters of
University of Ghana http://ugspace.ug.edu.ghUniversity of Ghana http://ugspace.ug.edu.gh
27
deionized water was added to 5.0 g of the sample in a centrifuge tube. The suspension was
stirred using a magnetic stirrer for 5min. The suspension obtained was thereafter centrifuged
at 3000 rpm for 30 min and the supernatant measured in a 20mL graduated cylinder. The
density of water was taken as 1.0gcm-3
. Water absorbed was calculated as the difference
between the initial volumes of water added to the sample and the volume of the supernatant.
3.7.3 Determination of emulsifying properties
The method modified by Yasumatu et al (1992) was followed where 3.0g of flour was
suspended in 50mL of Viking (vegetable oil) oil. The mixture was emulsified in a blender at
high speed for 1min. Emulsion obtained was put into 15mL centrifuge tubes and centrifuged
at 1500 rrpm for 5 minutes.
=
The emulsion stability was also determined following the methods described by Okeczie and
Bello (1988). The same type of mixture was employed but heated at 80C for 30 minutes in a
water bath. The mixture was cooled under running tap water for 15 minutes and centrifuged at
1500rrpm for 5 minutes. The emulsion stability was calculated using the same method used
for emulsion activity. Triplicate determinations were carried out and the mean results taken.
3.7.4 Determination of Least gelation concentration
Least gelation concentration was determined using the method described by Coffman and
Gracia (1977). Sample suspensions of 2-20% were prepared in distilled water. Ten milliliter
of each of the prepared dispersions was transferred into a test tube. It was heated in a boiling
University of Ghana http://ugspace.ug.edu.ghUniversity of Ghana http://ugspace.ug.edu.gh

28
water bath for 1 h, followed by rapid cooling in a bath of cold water. The test tubes were
further cooled at 4°C for 2 h and then left to stay at 4°C overnight. The least gelation
concentration was determined as the concentration when the sample from the inverted test
tube did not slip or fall. All the results were mean of triplicate determinations.
3.7.5 Determination of foaming properties
The Foam capacity (FC) and foam stability (FS) were determined according to the method of
Lawhon et al. (1972). Sample (3 g) was dispersed in 100 ml of distilled water and pH adjusted
to 7.0 using either 1M HCL or NaOH. The contents were transferred to a mixer blender
whipped at high speed for 5 min. The contents, along with the foam, were poured into a 250
ml measuring cylinder and the foam volume was recorded after 30 seconds. FC was expressed
as percentage increase in volume. After 30 min, the volume of foam was measured and
expressed as FS.
=
=
3.8 Sorption Isotherm analysis
A static gravimetric method was used for the experiment (Greenspan, 1977). Duplicate
samples of one gram each of wheat-morama bean flour were placed in small dishes inside
University of Ghana http://ugspace.ug.edu.ghUniversity of Ghana http://ugspace.ug.edu.gh
29
bottles containing saturated salts solutions (LiCl, CH3COOK, MgCl2, K2CO2, NaCl and KCl)
which provided constant relative humidity environments ranging from 11 to 85%. The bottles
were kept in a controlled oven at a constant temperature of 30°C. The samples were weighed
at intervals of two days using a digital balance until constant weight was obtained after three
consecutive recordings, when the samples were assumed to be at equilibrium.
The dry mass was determined by the oven drying method for 6- 10 hours at 105°C (AOAC
2000).
The time to reach equilibrium ranged from 15 to 20 days depending on the water activity in
each bottle. Those at higher water activities reached equilibrium faster than those with lower
water activities. The equilibrium moisture contents were calculated as averages of the
triplicates from which the moisture sorption isotherms were determined.
The data for the water adsorption were fitted to the GAB and BET equations to describe their
moisture sorption behavior.
3.9 Determination of pasting properties
Pasting characteristics were determined using the Brabender Visco-Amylograph. For each
flour sample, slurry containing 8% solids (w/v) was prepared. The weight of flour to achieve
the 8% solids was calculated on the dry matter basis. The slurry was heated at a rate of 1.5 °C/
min from 50 to 90°C with a holding time of two minutes, and then cooled at a rate of -1.5°C /
min to 50°C.
University of Ghana http://ugspace.ug.edu.ghUniversity of Ghana http://ugspace.ug.edu.gh

30
3.10 Biscuits production
Biscuits were prepared using the traditional creamy method described by Whitley (1970) with
modifications. The ingredients used were margarine (25%), sugar (25%), baking powder and
composite flour (50%).
The margarine and sugar were creamed in a Kenwood mixer for 15 minutes until light and
fluffy. After sieving the flour with baking powder, they were slowly introduced into the
mixture. The flour and margarine and sugar were mixed at a high speed until the mixture did
not stick to the sides of the mixer anymore. The dough obtained was then rolled out on a flat
pastry board using a wooden rolling pin. Flour was sprinkled on the dough during rolling to
aid in obtaining a uniform thickness.
A biscuit cutter was used to cut the dough into shapes which were placed on a well greased
baking tray.
Biscuits were baked in an electric oven at 150°C for 15 minutes. The cooked biscuits were
pale brown in colour.
3.11 Physical parameters of biscuits
Biscuits were analyzed for width, thickness and spread ratio according to the procedure
described in the AOAC (2000).
a. Width - (W) -six biscuits were placed horizontally (edge to edge) and their average
diameter taken using the vernire calipers with 0.01 mm accuracy.
b. Thickness - six biscuits were placed one another and their average thickness was taken
using the venire calipers
c. Spread ratio - the spread ratio was calculated as the average diameter/thickness.
University of Ghana http://ugspace.ug.edu.ghUniversity of Ghana http://ugspace.ug.edu.gh

31
3.12 Colour analysis
The colour of biscuits was measured in accordance with CIE L*a*b* colour space system
based on the tristimulus value .The lightness (L), redness(= +ve a), yellowness (+ve b) and the
magnitude of total colour difference values were measured by placing the samples on the port
of the colour measuring system (Lab Scan XE Hunter Lab instruments). A positive value of
a* indicates the magnitude of reddish component, while its negative value shows that of
greenish component. A positive value for b* shows yellowish component while its negative
indicates the bluish component. The L*, a*, b* values were recorded.
3.13 Sensory evaluation
The method described by Iwe (2002) was used for the sensory analysis. Biscuits samples
made from soft wheat and morama bean flour were tasted by panelist of 65 students randomly
selected from the students of University of Ghana, Legon, Accra, Ghana. Biscuits samples
made from soft wheat flour served as the control.
The nine samples were put on trays on different coded dishes and served to the panelists.
Quality attributes of appearance, colour, crispiness, texture, taste and overall acceptance of the
biscuits were scored on the 9-point hedonic scale. The degree of likeness was expressed as
follows, Like extremely-9, Like very much -8, Like moderately-7, Like slightly-6, Neither
like nor dislike-5, Dislike slightly-4, Dislike moderately-3, Dislike very much-2, Dislike
extremely-1
University of Ghana http://ugspace.ug.edu.ghUniversity of Ghana http://ugspace.ug.edu.gh

32
4.0 RESULTS AND DISCUSSION
4.1 Proximate analysis of the flours
Proximate analysis of wheat and legume flours was carried out.
4.1.1 Protein content of whole flours
The protein content of soft wheat was 10.47 and that for hard wheat was 12.86% (Table 4.1).
These findings are not too far from Nwosu (2013) who reported the protein content of wheat
flour to be 13.24%. The differences could be from variations among cultivars.
The protein content of the full fat morama bean flour was 26.83% whereas the defatted
morama bean flour had a protein content of 47.31%. The difference in the protein content
between the full fat morama bean and defatted morama bean flour suggests that defatting
significantly affects the protein content of the morama bean flours positively. This can be
explained by the fact that extraction of oil makes more protein available in the same quantity
of the flour. Jideani et.al (2009) reported the protein content of morama bean to range
between 29.6 and 41.8%, whereas Nepolo et.al (2010) reported theirs at 43%.
4.1.2 Fat content of whole flours
The fat content of soft and hard wheat was 0.64 and 0.51% respectively whilst full fat morama
bean flour showed a fat content of 39.25%. After defatting the fat content reduced to 9.29%.
The oil content of full fat morama agrees with what Jideani et al., (2009) reported to range
between 32.1-45.3%.
University of Ghana http://ugspace.ug.edu.ghUniversity of Ghana http://ugspace.ug.edu.gh

33
4.1.3 Ash content of whole flours
The ash content usually means the total mineral oxides in a food. Data in Table 4.1show the
ash content of soft and hard wheat to be 0.34 and 1.73% respectively. Nwosu (2013) reported
ash content of wheat flour to be 0.70%.
Full fat morama bean flour showed ash content higher than that of wheat flours at 2.71% and
defatted morama bean flour had 3.89% ash content. Jideaniet.al (2009) found the ash content
of morama bean flour to be 2.9% while Diana et. al., (2006) found reported 3.08%
4.1.4 Moisture content of whole flours
The moisture content of the flour is important for two reasons, firstly the higher the moisture
content the lower the dry solids in the flour and secondly, flours with moisture content greater
than 14% are not stable at room temperature. Organisms naturally present in flour will start to
grow at high moistures producing off odours and flavours.
The data on Table 4.1 show moisture contents for soft wheat to be 12.82 and hard wheat had a
moisture content of 13.43%. Nwosu (2013) found the moisture content of wheat flour to be
12%.
Full fat morama bean flour on the other hand showed moisture content of 5.16% and defatted
morama bean flour showed moisture content of 6.89%. Even after the oil was extracted from
the full fat morama bean flour the moisture content still remained low but a little higher than
that of full fat morama flour. Jideani 2009 et al found the moisture of morama bean flour to be
between 6.4 and 6.9% while Diana et.al (2006) found the moisture content to be 3.5%.
University of Ghana http://ugspace.ug.edu.ghUniversity of Ghana http://ugspace.ug.edu.gh

34
Table 4.1: Proximate composition of the wheat and morama bean flours (dry matter per
100g sample)
Protein Fat Ash Moisture
Soft wheat 10.47±0.32 0.62±0.31 0.34±0.37 12.82±0.1
Hard wheat 12.86±0.21 0.51±0.02 1.73±1.93 13.43±0.3
Full fat morama 26.83±2.37 39.25±3.66 2.71±0.34 5.16±0.6
Defatted morama 47.31±1.88 9.29±2.20 3.89±0.42 6.89±0.26
4.2 Analysis of the Wheat Flour and composite flours
Flour is known to be a homogenous mixture of particles of different shapes and densities
(Sonaye et. al., 2012). Particle size distribution of flour shows the different ranges of particle
sizes present in the flour and that information helps to determine the texture or mouth feel of
the end product. The grittiness, fineness or coarseness all depend on the size distribution of
particles in the flour. (Sonaye et. al., 2012) suggested that the particle size of certain flours
were related to different characteristics like protein content, maltose, ash content, and gassing
power.
4.2.1 Particle size distribution of whole flours
Figure 4.1 shows the particle size distribution of whole flours (soft and hard wheat, full fat
and defatted morama bean flour). The data show that soft wheat flour and defatted morama
flour have finer particles (averaging about 75µm) than full fat and hard wheat flour. The
University of Ghana http://ugspace.ug.edu.ghUniversity of Ghana http://ugspace.ug.edu.gh

35
particle size distribution of hard wheat was generally wider with a particle size range of 75,
106 and 150µm as well as 300µm.Full fat morama bean flour showed a high retention of
coarse particles of 150µm and 300µm. This was probably because it contained high amounts
of oil, which formed a layer around particles and also bound the particles together to form
larger particles.
Figure 4. 1: Particle size distribution of the wheat , full fat morama bean and defatted
morama bean flours.
a) SOFT WHEAT
4.2.2 Soft wheat and full fat morama blends
Soft wheat flour showed a predominant particle size distribution of about 75 µm (Figure 4.2),
Substitution with 10% full fat morama bean flour shifted the average particle size from 75µm
to 106µm. Substitution of wheat flour with 30 and 40% full fat morama bean flour further
shifted the particle size to 150µm.
University of Ghana http://ugspace.ug.edu.ghUniversity of Ghana http://ugspace.ug.edu.gh

36
From Figure 4.2, it is clear that as the content of full fat morama bean flour was increased the
particle size distribution shifted towards the coarse or larger particles. The presence of the oil
in the full fat morama could be responsible for the large particle size as oil can form a layer
around the particle and make it appear big or bind two or more particles together. From these
results it shows that the composite of soft wheat and 10 percent level of morama bean flour
have the closest particle size distribution to the 100 percent soft wheat.
Figure 4.2: Particle size distributions for soft wheat and full fat morama composite
flours
4.2.3 Soft wheat and defatted morama blends
The effects of defatted morama bean flour on the particle size distribution with soft wheat
blends were different than with full fat flour. At the 10 percent level of substituting wheat
flour with defatted morama bean flour, the particle size distribution was not different from
100% soft wheat flour (Figure 4.3). Higher levels of substitution of soft wheat with defatted
morama bean flour broadened the particle size distribution towards larger particle sizes. The
University of Ghana http://ugspace.ug.edu.ghUniversity of Ghana http://ugspace.ug.edu.gh

37
20 and 30 percent level of morama bean flour retained 50% of the weight of particles within
the size 106 µm. Unlike for the full fat morama bean flour blends with wheat, all the
composite flours with defatted morama bean flour had less than 20% of the weight of particles
as large as 150 µm. Extraction of oil from the morama flour helped to reduce the particle sizes
of the defatted composite flours.
Figure 4.3 shows that soft wheat and defatted morama bean composite flours showed a shift
of particle size distribution towards the finer particles. At 10 percent defatted morama bean
the flour had more of the 75µm particles and 40 percent of defatted morama bean flour too
showed an apprecible amount of 75µm particles. The 20 and 30 percent level of substitution
had a higher amount of 106 µm and for all the composites there were very little amount of
coarse particles.
Figure 4.3: Particle size distributions for soft wheat and defatted morama bean
composite flours
University of Ghana http://ugspace.ug.edu.ghUniversity of Ghana http://ugspace.ug.edu.gh

38
b) HARD WHEAT
4.2.4 Particle size distribution of Hard wheat and full fat morama flour blends
Hard wheat flour (100%) showed a broader particle size distribution than that of soft wheat
flour (100%). The particle size of hard wheat ranged from fine particles of less than 75µm to
coarse particles of 500µm (Figure 4.4). At 10 percent level of full fat morama bean flour more
of the 106 µm particles had been retained whereas 20 and 30 percent level of full fat morama
bean flour retained more of the 150 µm particles. The 40 percent had more of the 300 and 150
µm particles.
Hard wheat generally has coarse particles, and as full fat morama bean flour was added to it a
clear shift towards the coarse particles was shown. A higher retention of finer particles
(106µm) was observed in 10 percent level of full fat morama bean flour, while 20 and 30
percent level of full fat morama bean flour showed 150µm whereas 40 percent shifted the
distribution to much coarser particle sizes and showed a higher retention of 300 µm particles.
University of Ghana http://ugspace.ug.edu.ghUniversity of Ghana http://ugspace.ug.edu.gh

39
Figure 4.4: Particle size distributions for hard wheat and full fat morama bean
composite flours
4.2.5 Particle size distribution of Hard wheat and defatted morama flour blends
Blending defatted morama bean flour with hard wheat flour had the effect of shifting the
particle size distribution towards finer flour (Figure 4.5). The 40 percent level of defatted
morama bean flour showed the highest retention (about 50 %) of the 75 µm particles followed
by the 30 percent level of defatted morama bean flour, followed by 10, then 20 percent level
of defatted morama bean flour. All the composite flours had less than 20% of the 150µm
particles. When the level of defatted morama bean flour was increased in hard wheat
composites, the particle size distribution was similar to that of 100% soft wheat flour. The
results also show clearly the effect of oil extraction. At 40% level of substitution of defatted
marama bean flour to hard wheat, the amount of fine particles (ie 75µ or below) was high,
while at the same level of substitution of full fat bean flour the amount of coarse particles (ie
300µ and above) was high.
University of Ghana http://ugspace.ug.edu.ghUniversity of Ghana http://ugspace.ug.edu.gh

40
4.3 Moisture content of composite flours
The data in Table 4.2 show the moisture content of composite flours. The moisture contents of
soft and hard wheat were relatively high at 12.82 and 13.43% respectively. On the other hand
the moisture content of full fat and marama bean flours were relatively low at 5.16 and 6.89%
respectively.
The moisture content of all the composite flours ranged between 10.24-12.51%. The moisture
contents of composites, both for soft and hard wheat and for full fat and defatted morama bean
flour decreased as the substitution level of morama bean flour (full fat or defatted) increased
in the composites. In all substitutions with morama bean flour, the moisture content seemed to
increase because wheat flour, which had relatively higher moisture content, was always of
higher proportions.
Figure 4.5 Particle size distributions for hard wheat and defatted morama bean
composites
University of Ghana http://ugspace.ug.edu.ghUniversity of Ghana http://ugspace.ug.edu.gh

41
4.4 Functional Properties
The term "functional property" is defined as any property, aside from nutritional attributes,
that influences the ingredient's usefulness in food. Most functional properties play a major
role in the physical behaviour of foods or food ingredients during their preparation,
processing, or storage (Fennema 1985). The application of ingredients in specific food
systems depend on their functionality in those systems.
Table 4.2 Moisture contents of the different composite flours
Soft wheat Hard wheat
10% Full fat morama 11.52±0.09 12.04±0.19
20% Full fat morama 11.25±0.13 11.15±0.3
30% Full fat morama 10.95±0.39 10.69±0.06
40% Full fat morama 10.24±2.39 10.33±0.19
10% Defatted 12.21±0.15 12.51±0.3
20% Defatted 11.96±0.23 12.3±0.05
30% Defatted 11.24±0.09 11.75±0.66
40% Defatted 10.90±0.33 11.1±0.2
University of Ghana http://ugspace.ug.edu.ghUniversity of Ghana http://ugspace.ug.edu.gh

42
4.4.1 Bulk Density of the flours
Bulk density of the flour is important in the raw material handling, determination of the
package material requirements and for transportation considerations. Flours with high bulk
density have been known to be good for mixing purposes whereas those with lower bulk
density may find a better usage in baby food industry. The bulk densities of both soft and hard
wheat flour were significantly high in comparison with the morama bean flours (Table 4.3).
Full fat morama bean flour showed a higher bulk density than defatted morama bean flour.
Their densities were at 60 and 55g /ml respectively. Defatting reduced the bulk density of the
morama bean flour.
Table 4.3: Bulk densities of wheat and morama flours
Sample Bulk density(g/ml)
Soft wheat 78.6 ± 1.4
Hard wheat 76.5 ± 0.67
Full fat morama 59.5 ± 0.7
Defatted morama 53.4 ± 0.3
Table 4.4 show the bulk density of the composites of both soft and hard wheat flours. At 10
and 20 percent level of full fat morama bean flour in soft wheat the bulk density was higher
(73 g/ml),and went down as the level of full fat morama bean flour were increased. Hard
wheat and full fat morama bean flour composites showed lower bulk densities. There was a
slight decrease (from 70 to 68.5g/ml) as the level of full fat morama was increased in the
composites.
University of Ghana http://ugspace.ug.edu.ghUniversity of Ghana http://ugspace.ug.edu.gh

43
For soft wheat and defatted morama bean flour 10 and 20 percent levels of substitution still
had higher bulk densities followed by 30 and 40 percent level of defatted morama flour with
the bulk density of 67g/ml. Hard wheat flour and defatted morama bean flour showed a clear
decrease (ranging between 74 and 65 g/ml) as the level of defatted morama bean flour added
to the hard wheat increased
The results in Table 4.4 suggest that addition of morama bean flour to either wheat(i.e soft or
hard wheat) flour reduced the bulk density of composite flours. The substitution at 20%
levels of morama bean flours ( full fat and defatted) in soft wheat flour showed a bulk
density that was still low and close to that of 100 % soft wheat.
Table 4.4: Bulk densities of composite flours
Full fat
morama
Defatted
morama
Soft wheat Hard wheat Soft wheat Hard wheat
10% 73.6± 2.6 70.1± 1.1 10% 73.3± 0.7 73.5± 1.1
20% 73.9± 1.2 69.5± 1 20% 74.3± 0.6 70.1± 0.6
30% 71.8± 0.6 69.1± 0.5 30% 71.8± 0.6 68.2± 0.5
40% 70.8± 0.6 68.2± 0.5 40% 67.3± 0.5 65.4± 0.3
4.4.2 Water absorption
Water absorption capacity of flours plays an important role in the dough preparation process
because it influences other functional and sensory properties. The extent of application of
flours as food ingredients is dependent to a large degree on their interaction with water
University of Ghana http://ugspace.ug.edu.ghUniversity of Ghana http://ugspace.ug.edu.gh

44
Generally there were no significant differences in the amount of water absorbed by the soft
and hard wheat flour at 25°C. At that temperature however, the water absorption capacity by
both full fat and defatted morama bean flour were significantly higher than both hard and soft
wheat flours (Figure 4.6).Soft wheat and defatted morama bean flour composites showed no
significant difference in water absorption capacity at 25°C.The results indicate that in the
presence of full fat morama bean flour at 25°C the water absorption was not significantly
changed.
Defatted morama bean flour’s capacity was clearly higher and this is due to the fact that oil
was extracted from the flour and thus the protein cake could accommodate more water.
Maruatona et al. (2009) reported a water absorption capacity of 1.5 g/g of defatted unheated
morama which was much lower than the results in Figure 4.6. Many factors could have
contributed to the difference, conditions and the type of morama used i.e. one used in this
research grows in South Africa and this grows in Botswana.
Starch is responsible for the behavior of the flours in the presence of water at high
temperatures.
University of Ghana http://ugspace.ug.edu.ghUniversity of Ghana http://ugspace.ug.edu.gh

45
Figure 4.6: Water absorption of wheat-morama bean flour composites and whole flours
at 25°C
Wheat flours have high amounts of starch but morama bean flours do not have starch.
Consequently as the temperature was increased to 70°C, the wheat starches absorbed water
and swelled up at temperatures close to gelatinization. Soft wheat has less protein in
comparison to hard wheat, thus has more starch and showed a higher water absorption
capacity.
Figure 4.7 shows the water absorption behaviours of soft and hard wheat composites together
with the flour at 70°C.The behavior of soft and hard wheat flour was different when the
temperature was raised to 70°C. At that temperature soft wheat showed more capacity to
absorb water than hard wheat flour. The water absorption capacity of both full fat and defatted
morama bean flour at 70°C was significantly lower than the wheat flours.
University of Ghana http://ugspace.ug.edu.ghUniversity of Ghana http://ugspace.ug.edu.gh

46
A sharp increase was observed when the temperature was raised to 70°C. At the high
temperature conditions composite flour with 10 and 20 percent level of full fat morama bean
flour showed higher water absorption than blends with 30 and 40 percent full fat morama bean
flour .
A significant increase in water absorption was observed in soft wheat and defatted morama
bean flour when temperature was increased to 70°C. The10 percent level of defatted morama
bean flour showed a higher water absorption and 20, 30 and 40 percent were a little lower
with no significant difference among them.
Addition of defatted morama bean flour to soft wheat improved the water absorption at 70°C.
It is clear that the presence of oil in the morama bean inhibited the water absorption. This was
observed in full fat morama bean flour composites, where the water absorption went down as
the content of full fat morama bean flour was raised.
Figure 4.7: Water absorption of wheat-morama bean flour composites and whole fours
at 70°C
University of Ghana http://ugspace.ug.edu.ghUniversity of Ghana http://ugspace.ug.edu.gh
47
The composite flours showed no significant difference in water absorption at 25°C when full
fat morama bean flour was used in hard wheat substitution. As the temperature was increased
to 70°C there was a significant increase in water absorption. When the level of full fat
morama bean flour was increased there was a significant decrease in water absorption
capacity of the composite flours ranging from 15 to 10 g of water absorbed per 100g of dry
sample. The difference between 30 and 40 percent levels was not significant.
The water absorption capacity of composites made using hard wheat flour and defatted
morama bean flour at all substitution levels showed no significant difference at 25°C (Figure
4.6). At higher temperatures (70°C) the water absorption capacities of all composite flours
(hard wheat with defatted morama bean flour) increased. Increasing the level of defatted
morama bean flour in the composite flour with hard wheat decreased the water absorption
capacity at 70°C.
The decrease in water absorption with the increase of morama bean flour was more profound
with hard wheat composites than with soft wheat composites (Figure 4.7). The major chemical
compositions that enhance the water absorption of flours are proteins and carbohydrates,since
these constituents contain hydrophillic parts, such as polar or side charged chains (Lawal and
Adebowale 2004).
4.4.3 Oil absorption
Oil absorption capacity of any food is important because it relies mainly on its capacity to
entrap oil by a complex capillary attraction process. The ability of a food component to entrap
oil is a good characteristic because oil acts as a flavour enhancer, a consistency trait and an
important enhancer of mouth feel (Khattab and Arntfield, 2009).
University of Ghana http://ugspace.ug.edu.ghUniversity of Ghana http://ugspace.ug.edu.gh

48
The oil absorption capacities of soft and hard wheat flours were not significantly different
(Figure 4.8). The wheat flours showed a higher oil absorption capacity than full fat morama
bean flour. Full fat morama bean flour showed a much lower oil absorption capacity than all
the other flours. Full fat morama bean flour has a high content of fat (28%) as shown in Table
4.1, and consequently did not absorb more oil. Defatted morama bean flour, from which much
of the oil has been extracted, absorbed more oil than all the flours. Maruatona et al. (2009)
obtained 2.7 g/g for oil absorption capacity of defatted unheated morama bean flour. The
results were lower than what the findings on Figure 4.8 show.
Figure 4.8: Oil absorption capacity of whole flours and wheat-morama composites flours
Addition of full fat morama bean flour at all levels (10-40%) did not have any significant
effect on the oil absorption capacity of the soft and hard wheat composite flours. There was a
change in trend in oil absorption when defatted morama bean flour was substituted with soft
wheat. Soft wheat with defatted morama bean flour composites showed more affinity to oil
University of Ghana http://ugspace.ug.edu.ghUniversity of Ghana http://ugspace.ug.edu.gh

49
than hard wheat with defatted morama bean flour. Both soft wheat and defatted morama bean
flour have finer particle sizes (Figure 4.1). They therefore both provide a larger surface area
which allows for more oil sorption. Wheat proteins are generally hydrophilic, and soft wheat
has fewer amounts of proteins than hard wheat flour. Consequently soft wheat flour will
absorb more oil than hard wheat flour, when substituted with defatted morama bean flour as
shown in Figure 4.8.
Chowdhury et al., (2012) reported that the high oil absorption suggests the hydrophobic
structure of jackfruit seed protein in protein subunits and also added that the oil absorption of
jackfruit seed flour and its blends suggested that it could find useful application in bakery
products like cake and cookies.
4.4.4 Emulsifying properties (emulsifying capacity and emulsifying stability)
4.4.4.1 Emulsifying capacity
Emulsion properties play a significant role in many food systems where the protein has the
ability to bind fat such as in meat product, batter, dough and salad dressing (Sathe and
Salunkhe, 1981; Odeleke and Odedeji, 2010).
Soft wheat and hard wheat flours in Figure 4.9 showed no significant difference in their
emulsifying capacities.
Full fat morama bean flour had a higher emulsifying capacity compared to defatted morama
bean flour and the wheat flours. Maruatona et al. (2009) found the emulsifying capacity of
defatted unheated morama to be 59.9%. Figure 4.9 shows a higher emulsifying capacity
(about 70%) for defatted morama bean flour compared to that reported by Maruatona et al
(2009).
University of Ghana http://ugspace.ug.edu.ghUniversity of Ghana http://ugspace.ug.edu.gh

50
Figure 4.9: Emulsifying capacity of whole flours and wheat-morama composites
Addition of full fat morama bean flour improved the emulsifying capacities of both soft and
hard wheat flours (Figure 9). The emulsifying capacities of soft and hard wheat flours were 76
and 74 ml/gm respectively. The composites of soft wheat showed a capacity above 80. Soft
wheat and full fat morama bean flour composites showed better emulsifying capacities than
hard wheat and full fat morama bean flour.
Addition of defatted morama bean flour showed a more improved emulsifying capacity with
soft wheat than with hard wheat. Increasing the level of defatted morama bean flour did not
significantly affect the emulsifying capacity of the composite flours for both soft and hard
wheat. Hard wheat flour and defatted morama bean flour had a lower emulsifying capacity
than soft wheat with defatted morama bean flour but generally, addition of morama bean flour
to wheat flour improved the emulsifying capacity of the composite flours. Ali et al., (2012)
University of Ghana http://ugspace.ug.edu.ghUniversity of Ghana http://ugspace.ug.edu.gh
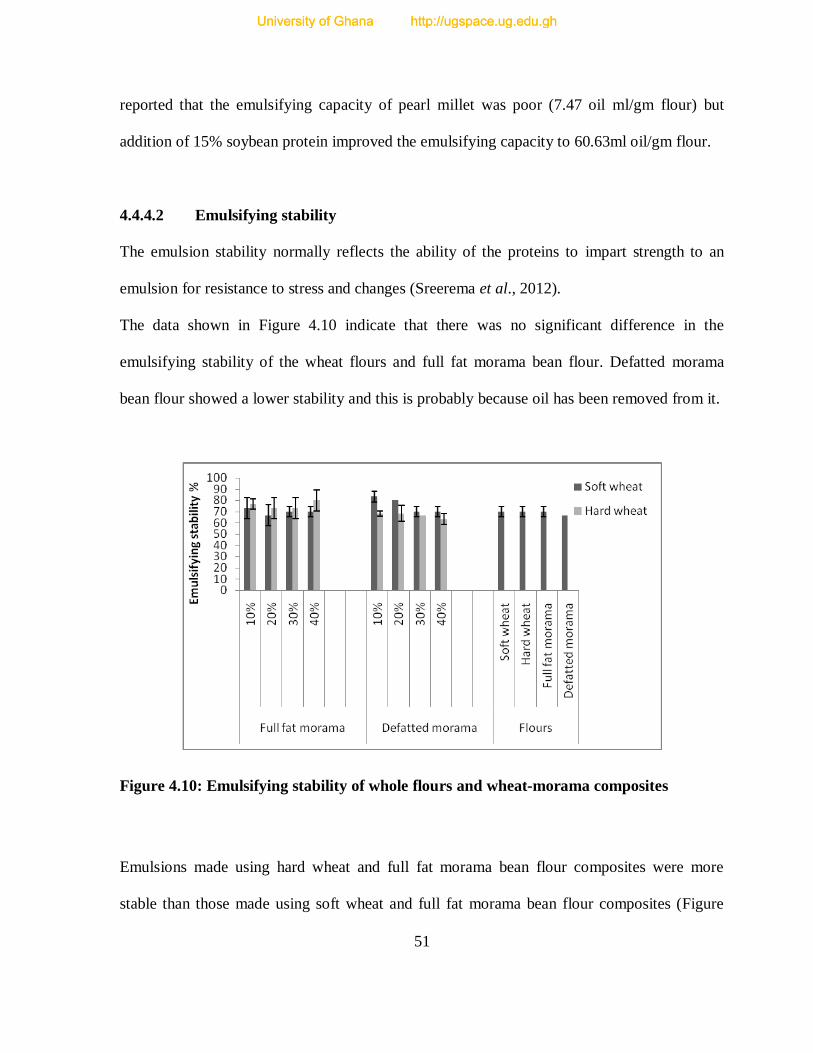
51
reported that the emulsifying capacity of pearl millet was poor (7.47 oil ml/gm flour) but
addition of 15% soybean protein improved the emulsifying capacity to 60.63ml oil/gm flour.
4.4.4.2 Emulsifying stability
The emulsion stability normally reflects the ability of the proteins to impart strength to an
emulsion for resistance to stress and changes (Sreerema et al., 2012).
The data shown in Figure 4.10 indicate that there was no significant difference in the
emulsifying stability of the wheat flours and full fat morama bean flour. Defatted morama
bean flour showed a lower stability and this is probably because oil has been removed from it.
Figure 4.10: Emulsifying stability of whole flours and wheat-morama composites
Emulsions made using hard wheat and full fat morama bean flour composites were more
stable than those made using soft wheat and full fat morama bean flour composites (Figure
University of Ghana http://ugspace.ug.edu.ghUniversity of Ghana http://ugspace.ug.edu.gh
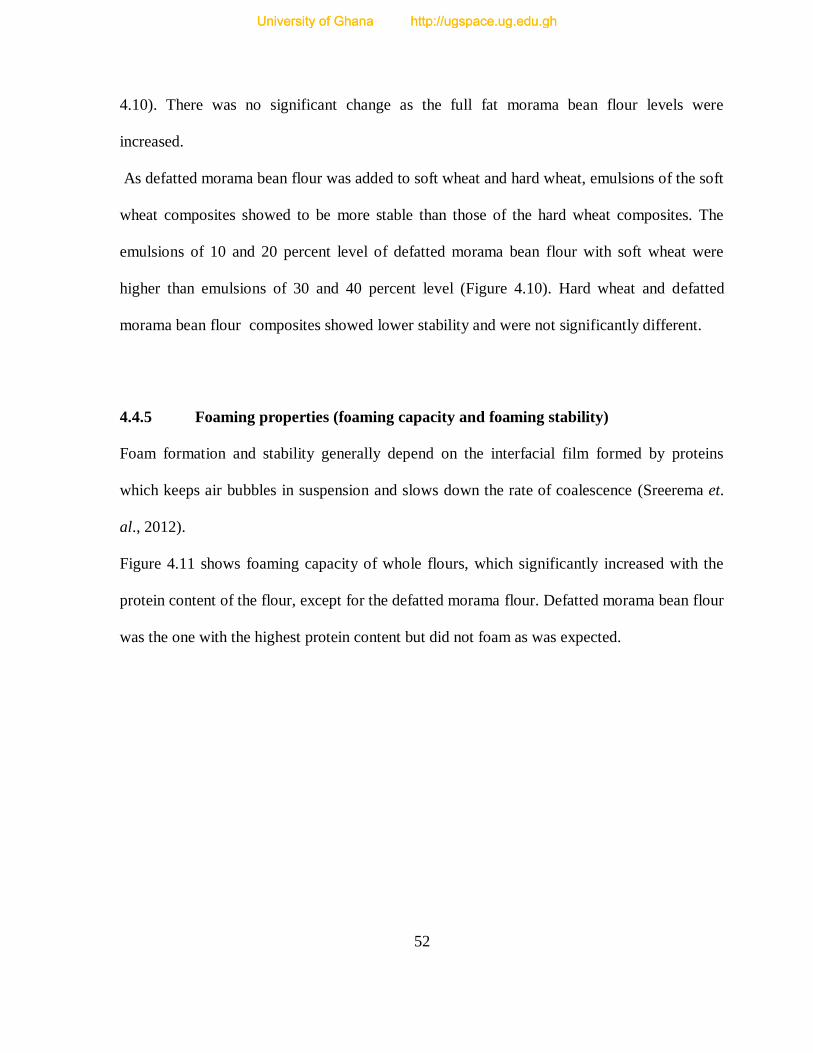
52
4.10). There was no significant change as the full fat morama bean flour levels were
increased.
As defatted morama bean flour was added to soft wheat and hard wheat, emulsions of the soft
wheat composites showed to be more stable than those of the hard wheat composites. The
emulsions of 10 and 20 percent level of defatted morama bean flour with soft wheat were
higher than emulsions of 30 and 40 percent level (Figure 4.10). Hard wheat and defatted
morama bean flour composites showed lower stability and were not significantly different.
4.4.5 Foaming properties (foaming capacity and foaming stability)
Foam formation and stability generally depend on the interfacial film formed by proteins
which keeps air bubbles in suspension and slows down the rate of coalescence (Sreerema et.
al., 2012).
Figure 4.11 shows foaming capacity of whole flours, which significantly increased with the
protein content of the flour, except for the defatted morama flour. Defatted morama bean flour
was the one with the highest protein content but did not foam as was expected.
University of Ghana http://ugspace.ug.edu.ghUniversity of Ghana http://ugspace.ug.edu.gh

53
Figure 4.11: Foaming capacity of whole flours and wheat-morama bean flour composites
The defatted morama bean flour showed the least foaming capacity probably because the
proteins being largely hydrophobic were less soluble.
The results in Figure 4.11 show that addition of full fat morama bean flour to soft wheat
flour increased its capacity to foam.The increase of full fat morama bean flour in the blend
seemed to increase the foaming capacity, though there were no significant differences among
the composite flours. Hard wheat flour with full fat morama bean flour foamed more
especially at the 10 and 20 percent level of substitution but were not signifiicantly different.
The foaming capacity reduced when full fat morama bean flour level in hard wheat was
increased but still foamed more than the soft wheat composites.Addition of defatted morama
bean flour to both soft and hard wheat showed a significant increase in foaming capacities and
University of Ghana http://ugspace.ug.edu.ghUniversity of Ghana http://ugspace.ug.edu.gh

54
this was the case for all the composites. Hard wheat flour composites foamed more and
seemed not affected by the increment of defatted morama bean flour content.
Figure 4.12: Foaming stability of wheat-morama bean flour composites and whole
flours
The stability of foams (Figure 4.12) showed that the composite flours that formed more foam
were also more stable as well. Composites from full fat morama bean flour formed more
stable foam.
Foams obtained from soft wheat and fulll fat morama bean flour composites were less stable
in comparison with that obtained from the hard wheat composites.
With defatted morama bean composites,the soft wheat still formed less stable foams while
hard wheat composites were more stable. The stability of foams obtained from both
composites (i.e soft and hard wheat) increased with the increasing level of defatted morama
University of Ghana http://ugspace.ug.edu.ghUniversity of Ghana http://ugspace.ug.edu.gh

55
bean flour.In general all composites,especially hard wheat composites depicted high foam
stability and may find applications in baked and confectionery products, especially those
requiring high and stable foams.
4.4.6 Least gelation concentration
Least gelation concentration can be defined as the lowest protein concentration at which gel
remained in the inverted tube was used as index of gelation capacity (Eltayeb et al., 2011)
Whole flours of wheat showed a least gelation concentration of 2 percent while full fat
morama bean flour and defatted morama bean flour had a least gelation concentration of 10
and 8 percent respectively.
At 10, 20, and 30 percent level of full fat morama bean flour blends with soft wheat the least
gelation concentration was not affected, and remained at 2 percent. However at 40 percent
level of full fat morama bean flour the least gelation concentration was raised to 8. For blends
of soft wheat and defatted morama bean flour the least gelation concentration went up at 30
and 40 percent level of defatted morama bean flour to 6 and 8 percent respectively.
At 10, 20 and 30 percent level of full fat morama bean flour substitution with hard wheat
flour, the least gelation concentration was not affected. An increase was however observed at
40 percent level of full fat morama bean flour. Substitution of hard wheat flour with 10 and 20
percent defatted morama bean flour did not affect the least gelation concentration but at 30
and 40percent level of substitution the least gelation increased to 6 percent.
It was observed in Table 4.3 that the composites with full fat morama bean flour were only
affected at 40 percent level and for composites with defatted morama bean flour a change was
observed at 30 and 40 percent. The results obtained by Ali et al. (2012) indicated that pearl
University of Ghana http://ugspace.ug.edu.ghUniversity of Ghana http://ugspace.ug.edu.gh

56
millet flour level of concentration for gelation was significantly (P ≤ 0.05) lower than that of
soybean flour, because pearl millet flour contained starch, which induced gelation due to
starch-starch and/or starch-protein interactions.
4.5 Sorption isotherms for soft wheat and morama bean flour at 30°C
The moisture sorption isotherm of a product is usually valuable information on its storage
stability as well as prediction of shelf life since they give information about the humidity–
water activity relation, at a given temperature (Al-Muhtaseb et al., 2004; Ayranci and Duman,
2004). In the water activity interval from 0.1 to 0.8, the equilibrium moisture content values
increased with an increase in water activity at constant temperature. The behavior of the flours
has been shown in Figure 4.13. The Figure4.13 shows that the equilibrium moisture content of
composite flours made using full fat morama bean flours in soft wheat were more stable to
changes in water activity than those made using defatted morama bean flour at 30ºC. The least
stable composite flour was the one obtained with 40% defatted flour and soft wheat.
At the minimal change of water activity from 0.4 to 0.5 the equilibrium moisture content
rapidly increased from 4% to 9%. This sorption behavior reflects some amount of
hygroscopicity of the composite flour made using defatted morama bean flour, and will
require stricter storage regimes and packaging than the full fat composites. The observed
sorption behavior could be explained on the basis of differential particle size distribution as
discussed in Figure 4.1. The defatted morama bean flours had finer particle size distribution
than the full fat flours. Consequently they also had a larger surface to volume ratio, and would
therefore adsorb more moisture at a given water activity and temperature than the full fat
flour.
University of Ghana http://ugspace.ug.edu.ghUniversity of Ghana http://ugspace.ug.edu.gh
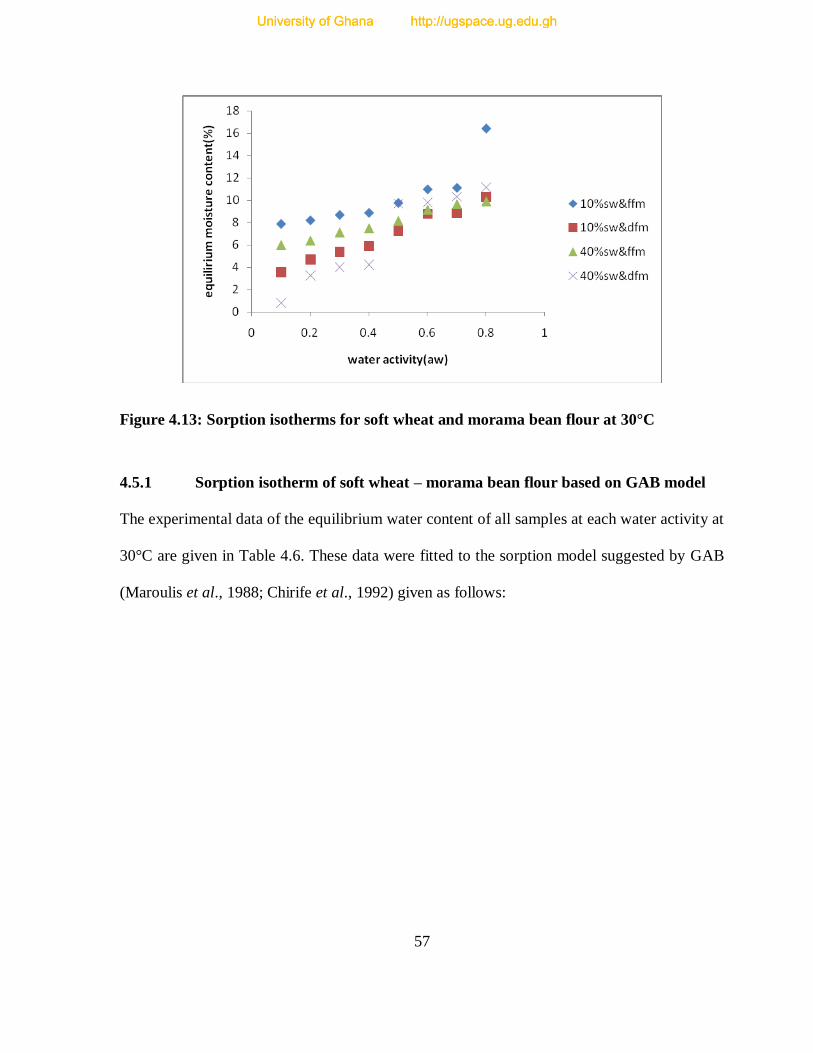
57
Figure 4.13: Sorption isotherms for soft wheat and morama bean flour at 30°C
4.5.1 Sorption isotherm of soft wheat – morama bean flour based on GAB model
The experimental data of the equilibrium water content of all samples at each water activity at
30°C are given in Table 4.6. These data were fitted to the sorption model suggested by GAB
(Maroulis et al., 1988; Chirife et al., 1992) given as follows:
University of Ghana http://ugspace.ug.edu.ghUniversity of Ghana http://ugspace.ug.edu.gh

58
Table 4.5 Least gelation capacity of whole flours and composite flours
Sample Least Gelation Concentration (%)
Flour
Soft wheat 2
Hard wheat 2
Full fat morama 10
Defatted morama 8
Soft wheat composites
10% Full fat morama 2
20% Full fat morama 2
30% Full fat morama 2
40% Full fat morama 8
10% Defatted morama 2
20% Defatted morama 2
30% Defatted morama 6
40% Defatted morama 8
Hard wheat composites
10% Full fat morama 2
20% Full fat morama 2
30% Full fat morama 2
40% Full fat morama 4
10% Defatted morama 2
20% Defatted morama 2
30% Defatted morama 6
40% Defatted morama 6
University of Ghana http://ugspace.ug.edu.ghUniversity of Ghana http://ugspace.ug.edu.gh

59
=
aw
= the water activity
M = the water content on a dry basis at equilibrium
Xm = water content when each sorption site contains one molecule (monolayer)
C and K = sorption constants that are related to the energy interaction between the first and
further sorbed molecules at the individual sorption site
After introducing the parameters the GAB equation then takes the form
(aw/M) = α a
w2 + β.a
w + ƴ
Where:
α= (K/Xm).[(1/C)-1]
β= (1/Xm) [1-(2/C)]
ƴ=1/ (Xm C.K)
The experimental data was fitted to the GAB model and the isotherm obtained is shown in
Figure 4.14 for 40% full fat morama bean and soft wheat flour at 30°C.
University of Ghana http://ugspace.ug.edu.ghUniversity of Ghana http://ugspace.ug.edu.gh
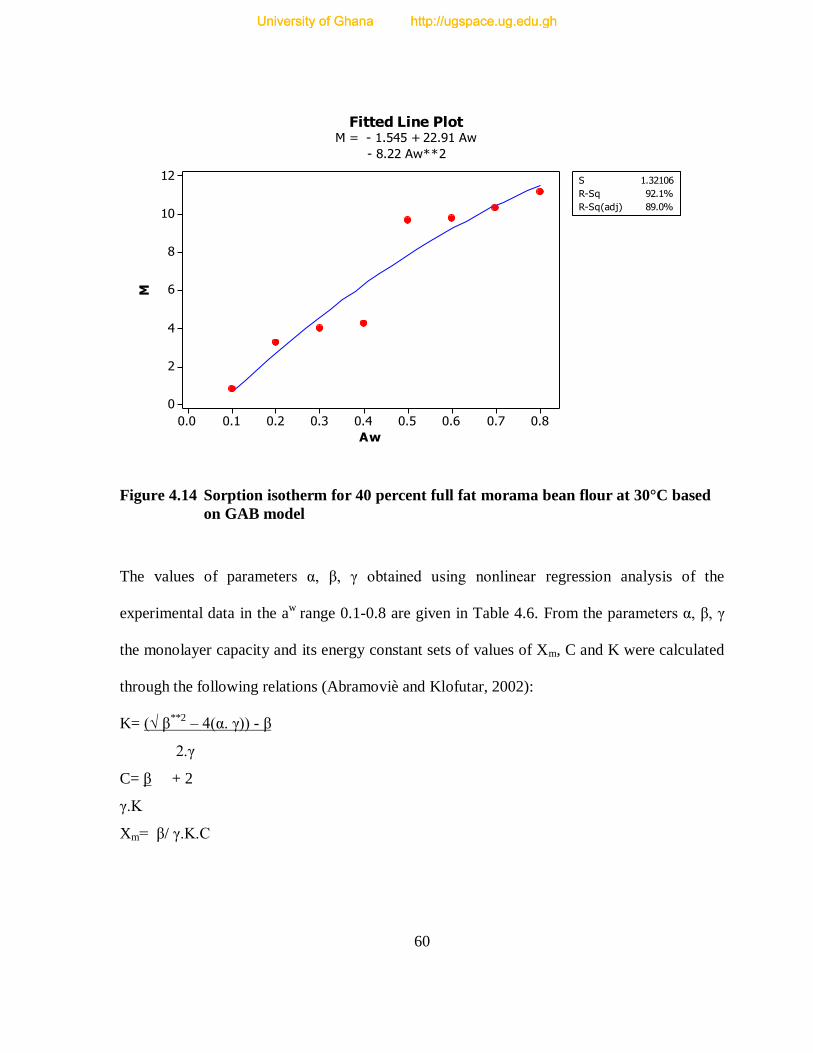
60
0.80.70.60.50.40.30.20.10.0
12
10
8
6
4
2
0
Aw
M
S 1.32106
R-Sq 92.1%
R-Sq(adj) 89.0%
Fitted Line PlotM = - 1.545 + 22.91 Aw
- 8.22 Aw**2
Figure 4.14 Sorption isotherm for 40 percent full fat morama bean flour at 30°C based
on GAB model
The values of parameters α, β, γ obtained using nonlinear regression analysis of the
experimental data in the aw
range 0.1-0.8 are given in Table 4.6. From the parameters α, β, γ
the monolayer capacity and its energy constant sets of values of Xm, C and K were calculated
through the following relations (Abramoviè and Klofutar, 2002):
K= (√ β**2
– 4(α. γ)) - β
2.γ
C= β + 2
γ.K
Xm= β/ γ.K.C
University of Ghana http://ugspace.ug.edu.ghUniversity of Ghana http://ugspace.ug.edu.gh

61
The results in Table 4.6 show that as the full fat morama bean flour level was increased (10
and 40 percent full fat morama bean flour) the monolayer moisture content also increased
(0.3823 to 0.9416).
An increase in monolayer moisture content was also observed when the level of the defatted
morama bean flour was increased (from 0.9021-1.0522). The monolayer moisture content of
defatted composites was higher than that of the full fat morama bean flour composites and this
could be explained by the fact that the oil has been extracted and thus there is more surface
area for sorption. To further explain this, defatted morama bean flour has finer particles (this
was observed in Figure 4.1) and it has been reported by Hebrard (2003) that the finer the
particles sizes the faster their sorption kinetics.
The (non-linear) regression of water activity (aw)on moisture content for soft wheat- full fat
morama bean flour at 40 percent level of substitution at 30ºC was adequate with an R2=0.99.
Similarly, the non-linear regression of water activity on moisture content for soft wheat-
defatted morama bean flour at 10 percent level of substitution at 30ºC was adequate with R2=
0.98. All the flours showed an R2higher than 90% (Table 4.6).
4.5.2 Sorption isotherm of soft wheat – morama bean flour based on BET model
The experimental data of the equilibrium water content of all samples at each water activity at
30ºC (Table 4.6) were fitted to the BET equation (Anderson, 1946; Iglesias and Chirife, 1976)
given as: =
Where:
M= water content on a dry basis at equilibrium
University of Ghana http://ugspace.ug.edu.ghUniversity of Ghana http://ugspace.ug.edu.gh

62
Xm=water content when each sorption site contains one water molecule (monolayer)
aw= water activity
C= sorption constant which is related to the energy interaction between the first and further
sorbed molecules at the individual sorption site.
Table: 4.6 Values of parameters α, β, γ of the GAB equation and their regression
coefficients.
Flour α β ƴ K C Xm R2 SE
10SW&FFM 22.16 10.18 9.179 0.896 3.237783 0.382293 0.9 0.365362
10SW&DFM 1.289 8.355 2.782 0.163 20.42476 0.90208 0.98 0.127951
40SWandFFM 0.191 5.842 5.325 0.034 34.26733 0.941635 0.99 0.072726
40SWandDFM -8.22 22.91 -1.545 0.368 -38.2948 1.052226 0.92 0.467044
SW = soft wheat
FFM= full fat morama bean flour
DFM = defatted morama bean flour
The equation takes the following form after introducing the parameters
Where:
α = (1/Xm .C)
β=(C-1)/Xm.C
University of Ghana http://ugspace.ug.edu.ghUniversity of Ghana http://ugspace.ug.edu.gh

63
The experimental data were fitted to the BET model and the isotherm obtained is shown in
Figure 4.15 for 40% full fat morama bean and soft wheat flour at 30°C.
Figure 4.15: Sorption isotherm for 10 percent full fat morama bean flour at 30°C based
on BET model
The values of the parameters were obtained from the linear analysis after log transformation
of the BET model. The monolayer moisture content and the energy value were calculated
using the following relations:
Xm = 1/(α+β)
C= (α+β)/α
In the water activity interval from 0.1 to 0.5, the equilibrium moisture content values
increased with an increase in water activity at constant temperature.
0.50.40.30.20.1
10
8
6
4
2
0
Aw
Aw
/(1
-Aw
)M
S 0.931951
R-Sq 94.7%
R-Sq(adj) 93.0%
Fitted Line PlotAw/(1-Aw)M = - 2.026 + 21.65 Aw
University of Ghana http://ugspace.ug.edu.ghUniversity of Ghana http://ugspace.ug.edu.gh

64
Data in Table 4.7 show that the monolayer moisture content of soft wheat- full fat morama
bean flour increased (0.04222 – 0.0494) with increase in the full fat morama bean flour
level(10 and 40%). However, the pattern was broken for soft wheat- defatted morama bean
flour as the monolayer moisture content decreased as the content of defatted morama bean
flour was increased.
Both the full fat morama bean flour composites (10 and 40%) showed the best fit with the
(R2= 0.95) followed by the soft wheat- defatted morama bean flour at 10 percent level of
substitution at 30°C at (R2 = 0.92). The 40 percent level of substitution of defatted morama
bean flour was not a good fit compared to other flours (R2 = 0.76).
4.5.3 Monolayer Moisture Content
Modelling of sorption data of wheat-morama bean flour using BET and GAB equations
allows the determination of monolayer moisture content values, (Xm), which are the measure
of sorption capability of the food material. The monolayer moisture content calculated from
the BET and GAB models ranged between 0.040-0.054 g/g (dry basis) and 0.382-1.052 g/g
(dry basis), respectively, at 30°C. Lomauro et al. (1985) reported that the monolayer moisture
content values (Xm) of starchy foods generally ranged from 0.032 to 0.160 g/g.
University of Ghana http://ugspace.ug.edu.ghUniversity of Ghana http://ugspace.ug.edu.gh
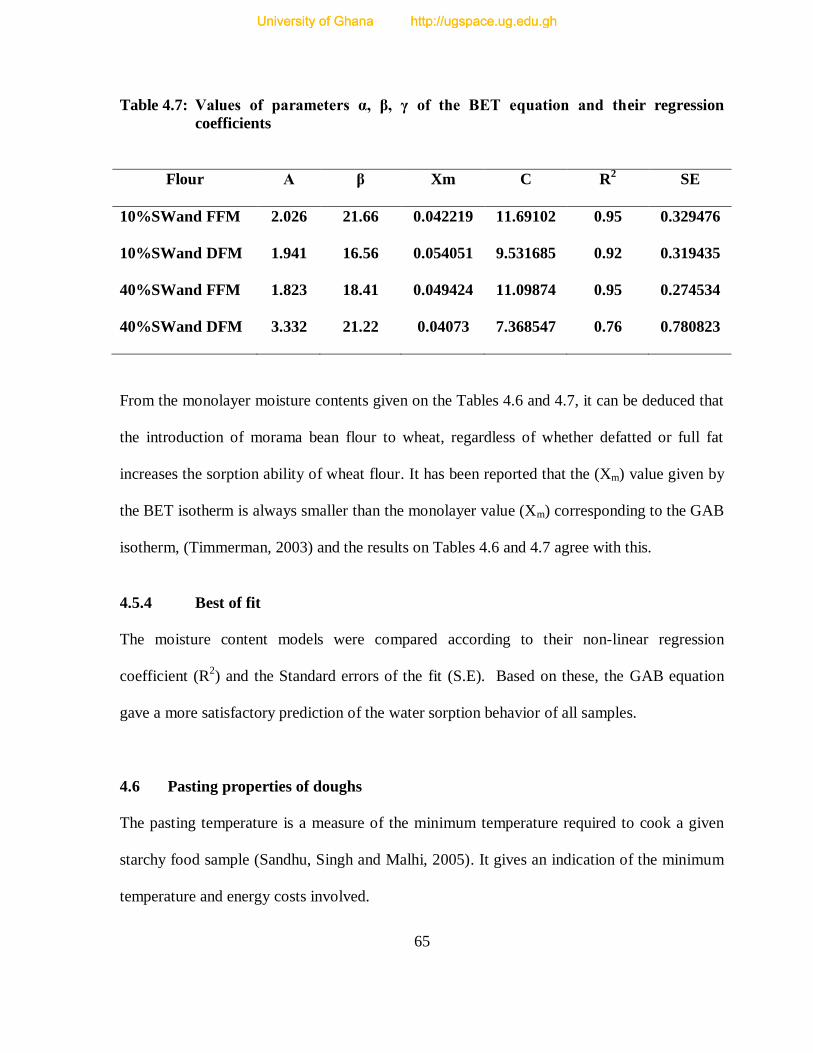
65
Table 4.7: Values of parameters α, β, γ of the BET equation and their regression
coefficients
Flour Α β Xm C R2 SE
10%SWand FFM 2.026 21.66 0.042219 11.69102 0.95 0.329476
10%SWand DFM 1.941 16.56 0.054051 9.531685 0.92 0.319435
40%SWand FFM 1.823 18.41 0.049424 11.09874 0.95 0.274534
40%SWand DFM 3.332 21.22 0.04073 7.368547 0.76 0.780823
From the monolayer moisture contents given on the Tables 4.6 and 4.7, it can be deduced that
the introduction of morama bean flour to wheat, regardless of whether defatted or full fat
increases the sorption ability of wheat flour. It has been reported that the (Xm) value given by
the BET isotherm is always smaller than the monolayer value (Xm) corresponding to the GAB
isotherm, (Timmerman, 2003) and the results on Tables 4.6 and 4.7 agree with this.
4.5.4 Best of fit
The moisture content models were compared according to their non-linear regression
coefficient (R2) and the Standard errors of the fit (S.E). Based on these, the GAB equation
gave a more satisfactory prediction of the water sorption behavior of all samples.
4.6 Pasting properties of doughs
The pasting temperature is a measure of the minimum temperature required to cook a given
starchy food sample (Sandhu, Singh and Malhi, 2005). It gives an indication of the minimum
temperature and energy costs involved.
University of Ghana http://ugspace.ug.edu.ghUniversity of Ghana http://ugspace.ug.edu.gh
66
The results in Table 4.8 show that the pasting temperature of the wheat-morama bean
composite flours increased as the level of morama bean flour increased. The pasting
temperature of the composites ranged from 75.6°C to 85°C.
Peak viscosity, is the maximum viscosity during the heating cycle. The data show that the
wheat flours had the highest peak viscosity of 360 and 351 for soft and hard wheat flour
respectively. A maximum viscosity of 263 was observed when 5 percent level of full fat
morama flour was added to soft wheat and a maximum of 20 when the level of full fat
morama bean was increased to 40 percent.
During the 95°C hold period the viscosities of both the soft and hard wheat flour as well as the
composites decreased. It is an indication of the stability of the starch gel during cooking
(Zaidhul et al., 2006).The ability of a mixture to withstand heating and shear stress that is
usually encountered during processing is an important factor for many processes especially
those requiring stable pastes. The final part of the cycle was the cooling from 95°C to 50°C
(Table 4.8). The viscosity at the cooling stage indicates the ability of the starch based food to
form a gel or paste after cooking and during cooling. This ranged between 310 and 298 BU
for soft and hard wheat and 237 and 20 BU for wheat –morama bean composite flours.
The viscosity after cooling to 50°C represents the setback or the viscosity of the cooked paste.
The soft wheat and hard wheat showed higher setback viscosities (130 and 154) and this may
be attributed to the high content of starch in wheat as compared to morama bean and thus
explains its behavior in gel formation (ranges from 0 to 112).
Higher values of breakdown are associated with higher peak viscosities which in turn are
related to the degree of swelling of starch granules during heating (Ragaee and Abdel-Aal,
2006).
University of Ghana http://ugspace.ug.edu.ghUniversity of Ghana http://ugspace.ug.edu.gh

67
The low peak viscosity, breakdown value and set back value of the wheat morama composites
indicate that the flour would be more stable when compared with wheat flour. The high
setback value of wheat is desirable especially in bread making.
Table: 4.8 Pasting properties of the whole flours and composite flours
GT(°C) PV(BU) V 95°C(BU) V 50°C(BU) SV(BU)
Soft wheat 44.8 360 180 310 130
Hard wheat 68.9 351 144 298 154
5% undefatted morama 77.5 263 125 237 112
10% undefatted morama 75.6 117 44 56 12
10% defatted morama 80.3 51 47 20 0
40% undefatted morama 85.9 20 6 20 14
40% defatted morama 81.7 26 21 26 5
GT= gelation temperature, PV= peak viscosity, V= viscosity, SV= setback viscosity
Figure 4.16 show the pasting behaviour of the wheat flours and the composite flours.
Substantial decreases were observed in all of the pasting properties of the soft wheat flour as
the level of full fat morama bean flour increased.
University of Ghana http://ugspace.ug.edu.ghUniversity of Ghana http://ugspace.ug.edu.gh

68
Figure 4.16: Pasting behavior of whole flours and composite flours
4.7 Biscuit Dough formation
Dough forms an important transitional product between flour and biscuits. Mixing is one of
the key stages in biscuit making. The gluten network that is formed during the mixing stage is
responsible for the viscoelastic properties of the dough and determines its machinability as
well as the final quality of the biscuits (Contamine et al., 1995).
The dough should be sufficiently extensible to be easily sheeted without being so elastic that it
prevents the biscuits from retracting after cutting. The absence of retraction is considered a
good factor in the quality of biscuits. It determines the potential of biscuits for packaging.
Contamine et.al (1995) concluded his findings that biscuit dough must be poorly elastic but
sufficiently supple and extensible to allow an easy and stable shaping of the material.
Of the sixteen composite flours samples, only nine were used in the biscuits making. This is
due to the fact that some of the flours were forming doughs that were not suitable for biscuits.
University of Ghana http://ugspace.ug.edu.ghUniversity of Ghana http://ugspace.ug.edu.gh

69
They were either too elastic or crumbly and thus got eliminated. Composites of defatted
morama bean flour and hard wheat (10 and 20%) were too elastic and sticky, whereas 30 and
40% were too dry and crumbly forming a very hard ball of dough. Composites of hard wheat
and full fat morama bean flour became soggy as the content of morama bean flour was
increased and eventually giving a soft dough which is not suitable for rolling and shaping to
make biscuits
4.8 Physical analysis of the biscuits
The thickness of the biscuits increased as the level of morama bean flour was increased.
Generally the spread ratio decreased as the protein content was increased (Table 4.9). This
was more pronounced with the samples prepared from defatted morama bean flour. When
comparing the biscuits made from soft wheat (control) with those made from soft wheat and
defatted morama bean flour, the spread ratios of those made from soft wheat and defatted
morama bean flour were low. At 40 percent level of defatted morama in the mixture the ratio
observed was 45.3. The spread ratio for soft wheat biscuits were at 58.23.
Similar results were reported by Atuonwu et al., (2010) for cookies supplemented with
defatted pumpkin (Cucurbita pepo) seed flour. For the composite flours, the increasing
numbers of hydrophilic sites available due to increased protein content compete for the
limited free water in dough (Zucco et al., 2011). Rapid partitioning of free water of these
hydrophilic sites occurs during dough mixing and increases dough viscosity, thereby limiting
cracker biscuits spread and top grain formation during baking (Eissa et al., 2007).
University of Ghana http://ugspace.ug.edu.ghUniversity of Ghana http://ugspace.ug.edu.gh

70
Table 4.9 Physical analysis of biscuits
4.9 Colour analysis of biscuits
The colour of the biscuits was described by the parameters L, a and b where L
represents lightness, a redness and b yellowness of the biscuits. It was observed that for both
the full fat composites and defatted composites, lightness of the biscuits decreased as the
content of morama bean flour was increased in the composite. The yellowness increased as
the whiteness decreased. The L* values for soft wheat and full fat morama bean flour
composites ranged between 88.7 and 83. 2 whereas those for soft wheat and defatted morama
bean flour composites were ranging between 99.26 and 91.99.
The data in Table 4.10 show an increase in b* values as the L* values were decreasing. For
the full fat morama bean composites the range for b* values was between 31.11 and 44.54.
Width (mm)
Thickness
(mm) Spread ratio
10% Full fat morama 186.33 32 58.23
20% Full fat morama 178.3 31.67 56.32
30% Full fat morama 185.67 33.33 55.7
40% Full fat morama 178.67 34.67 51.52
Soft wheat* 178.67 30.67 58.26
10% Defatted morama 177 36.67 48.27
20% Defatted morama 174.33 37 47.25
30% Defatted morama 178 37.667 47.25
40% Defatted morama 173.67 38.33 45.3
University of Ghana http://ugspace.ug.edu.ghUniversity of Ghana http://ugspace.ug.edu.gh

71
For defatted morama bean flour composites the b* values ranged from 39.8 to 42.2. The
results suggest that the presence of the oil in the flour was responsible for the colour
magnitudes that were observed and there were differences between samples with defatted
morama bean flour and those with full fat morama bean flour.
Table 4.10: Colour of wheat-morama composite flour biscuits
Sample L a b
10% Full fat morama 88.72±0.03a 8.23±0.08
i 31.11±0.09
c
20% Full fat morama 88.24±0.03b 8.46±0.06
g 41.31±0.09
e
30% Full fat morama 85.98±0.03c 9.22±0.03
e 42.47±0.06
f
40% Full fat morama 83.27±1.02c 10.39±0.07
f 44.54±0.17
h
Soft wheat* 92.99±0.09e 7.46±0.09
d 43.95±0.05
g
10% Defatted morama 99.26±0.01f 3.3±0.04
a 39.83±0.04
a
20% Defatted morama 95.75±0.04g 5.27±0.01
c 41.53±0.10
b
30% Defatted morama 93.89±0.02h 4.59±0.08
b 42.08±0.08
d
40% Defatted morama 91.99±0.03d 9.83±0.04
h 42.21±0.09
e
4.10 Sensory evaluation of biscuits
Biscuits prepared from soft wheat and wheat-morama bean composite flour in various
combinations were subjected to sensory evaluation for appearance, colour, crispiness, texture,
taste and overall acceptance.
University of Ghana http://ugspace.ug.edu.ghUniversity of Ghana http://ugspace.ug.edu.gh

72
For the purpose of biscuits making the behavior of doughs were evaluated. , some would not
mix well; some would become too sticky to work with. It is from these factors that some
doughs were rejected and remained with just eight composites that were well suited with the
recipe of biscuits. Composites of hard wheat and defatted morama bean flour were elastic and
dry (10 and 20%) requiring more flour so as not to stick to rolling pin,30 and 40% were too
dry and crumbly requiring more shortening so they can be rolled our easily. Composites of
hard wheat with full fat morama bean flour were too soft, even softer as the content of full fat
morama bean flour was increased, requiring more flour to thicken them and roll them out
evenly to make biscuits. It is these eight samples (composites of soft wheat and full fat
morama bean flour and composites of soft wheat and defatted morama bean flour 10,20 30
and 40%) plus the control that were later used for sensory evaluation.
4.11 Appearance
Data on the appearance of biscuits show that they were significantly different. Table 4.11
show that at 40 percent level of defatted morama bean flour the biscuits were more favored,
followed by the 20 percent level of full fat morama bean flour. The appearance of biscuits was
judged based on the smoothness of the biscuits, if the biscuits have cracks and if they were
appealing to the eye. The biscuits made from soft wheat and defatted morama bean flour at 20
and 30 percent level though received the lowest scores of 4.90 and 4.95 respectively
4.12 Colour
The analysis of variance for the sensory scores of colour of the biscuits made from different
levels of morama revealed that there was a significant difference in the colour of biscuits. The
University of Ghana http://ugspace.ug.edu.ghUniversity of Ghana http://ugspace.ug.edu.gh

73
biscuits from 40% defatted morama bean flour substitution were scored highest (6.85) in
terms of colour as seen in Table 4.11 which basically meant it is the kind of colour a
consumer would be more likely to buy when found in store.
4.13 Crispiness
Results in Table 4.11 show that the biscuits prepared from soft wheat and full fat morama
bean flour were generally well accepted for crispiness with the ones at 20 percent level of
substitution receiving the highest score of 6.7. The soft wheat and defatted morama bean flour
composites were less favored
The biscuits from soft wheat and full fat morama bean flour may be crispier because of the oil
content of morama which is already high and the rolling which thinned them out, the defatted
with less oil content thus just remained hard and difficult to break or crumble.
4.14 Texture
The same pattern that was observed with crispiness, were observed for texture, since crispness
is a textural attribute. Soft wheat and defatted morama bean flour biscuits were less favored
and the ones from soft wheat and full fat morama bean flour well received and the 20 percent
level of full fat morama bean flour being scored the highest (6.6). All the composites were
treated the same (that is same time for mixing, same amount of ingredients and same baking
time) regardless of the pre treatment of the flour and the defatted morama bean composites
clearly showed they needed more fat during biscuits making and thus resulted in biscuits that
are hard. Biscuits from composites that had 40 percent defatted morama bean flour were
scored the least (4.7) in terms of texture which meant were probably too hard.
University of Ghana http://ugspace.ug.edu.ghUniversity of Ghana http://ugspace.ug.edu.gh

74
4.15 Taste
Data in Table 4.11 showed that biscuits from soft wheat and 20 percent level of full fat
morama bean flour were the most favored with a score of 6.6.The soft wheat and 40 percent
level of defatted morama bean flour substitution was least scored at 4.7 but all other biscuits
were accepted for taste.
4.16 Overall acceptance of the biscuits
Although all the treatments were accepted, biscuits made from soft wheat and 20 percent level
of full fat morama bean composite flour were best accepted by the panel (Table 4.11). The
observation was that the overall acceptance was not a different quality parameter on its own; it
might have been affected by individual trends like texture, crispiness.
University of Ghana http://ugspace.ug.edu.ghUniversity of Ghana http://ugspace.ug.edu.gh

75
Table 4.11: Sensory acceptability ratings of biscuits made from soft wheat- morama
bean composite flour
Appearance Colour Crispiness Texture Taste
Overall
Acceptance
10% Full fat
morama 6.015±1.94a 5.815±2.291
a 5.692±2.433
a 6.600±1.902
ab 6.415±2.015
ab 6.431±1.785
ab
20%Full fat
morama 6.785±1.85b 6.554±2.187
ab 6.662±1.906
b 6.631±1.917
ab 6.631±1.917
ab 6.615±1.974
a
30%Full fat
morama 5.923±2.056a 6.200±2.181
ab 6.431±1.620
b 6.185±1.776
ab 6.200±1.864
ab 6.062±1.886
ab
40%Full fat
morama 5.123±2.260c 5.385±2.460
c 5.892±2.047
ab 6.031±2.099
b 6.200±1.938
ab 5.769±2.082
bc
Soft wheat 6.308±1.819ab
5.985±2.388ac
6.369±1.892b 5.954±1.948
b 6.615±1.924
a 6.400±1.703
ab
10%
Defatted
morama 5.877±2.019a 6.692±1.686
ab 5.277±2.183
a 6.538±1.532
ab 6.600±1.487
ab 6.246±1.458
ab
20%Defatted
morama 4.908±2.170c 4.908±2.383
c 4.292±2.435
c 5.492±2.173
bc 5.446±2.208
bc 5.431±2.236
bc
30%Defatted
morama 4.954±2.308c 5.262±2.056
c 3.338±2.181
d 5.769±2.324
b 5.708±2.310
b 5.051±2.246
c
40%Defatted
morama 6.846±2.279b 6.846±2.071
b 5.231±2.120
a 4.708±2.234
c 4.692±2.249
cd 5.154±2.470
c
Means followed by different letters are significantly different 9-point hedonic scale
1= dislike extremely 2= dislike very much 3= dislike moderately
4= dislike slightly 5= neither like nor dislike 6= like slightly
7=like moderately 8= like very much 9= like extremely
University of Ghana http://ugspace.ug.edu.ghUniversity of Ghana http://ugspace.ug.edu.gh

76
5.0 CONCLUSIONS AND RECOMMENDATIONS
5.1 Conclusion
Composite flours of wheat and morama bean flour showed varied physical and functional
properties depending on whether the morama beans were defatted or not. The type of wheat
flour also influenced some of the functional behavior of the composite flour.
Addition of full fat morama bean flour to both soft and hard wheat shifted the particle
distribution to the coarse particles whilst defatted morama bean flour shifted it to finer
particle distribution.
Functional properties (bulk density, foaming properties, water and oil absorption,
emulsifying properties) of composite flours were related to the protein content, oil content
and the particle size distribution of the flours.
For all the flours there was a significant effect of water activity on the equilibrium moisture
sorption in the range of the water activity studied. The equilibrium moisture content of full
fat morama bean composite flour was more stable than the defatted composite flours with
changes in water activity. Composite flours made using defatted morama flour were
relatively more hygroscopic. The presence of morama bean flour in wheat composite flours
increased the monolayer value of the flour. The GAB model was more suitable for describing
the relationship between the equilibrium moisture content and the water activity, for the soft
wheat-morama bean flour at 30°C.
The amount of morama bean flour influenced the gelation and the viscosity characteristics of
composite flours. Pasting characteristics were reduced as the morama bean flour was
increased.
University of Ghana http://ugspace.ug.edu.ghUniversity of Ghana http://ugspace.ug.edu.gh

77
Soft wheat flour can only be substituted up to 20 percent with full fat morama bean flour
without changing its organoleptic properties. This composite gave the best combination for
biscuits making.
These findings show that morama bean flour has a good potential in food applications. Such
successful food applications of morama bean flour will enhance its utilization and improve
food and nutrition security especially for the people in areas where it grows.
5.2 Recommendations
1. Studies on dehulling characteristics of morama bean seeds should be taken into
consideration as shelling takes most of the time and if the product goes commercially would
be a big setback. Shelling increases the oil extraction efficiency and reduces wear in the
expeller as the husks are abrasive, and the morama shells are particularly harder. A wide
range of manual and mechanical decorticators are available and one can be designed for
morama too.
2. More work on nutritional quality of morama bean protein and the efficacy should be
looked into as little is known on this.
3. More work on sorption isotherm modelling at different temperatures for wheat-morama
bean composites should be considered since the storage and transportation temperatures are
never stable.
4. Wheat morama composites can find use in the baby industry, complementary foods
because of the paste that they produce and the protein content they will bring into the blends
which is desirable, I recommend that this be considered and also from the functional
University of Ghana http://ugspace.ug.edu.ghUniversity of Ghana http://ugspace.ug.edu.gh

78
properties morama bean flour composites showed good foaming properties and maybe might
be useful in the making of foamy products like fudges.
University of Ghana http://ugspace.ug.edu.ghUniversity of Ghana http://ugspace.ug.edu.gh

79
REFERENCES
Ase, Hansen. (2010). Overview,Morama Bean. Journal of Food Composition and Analysis ,
Vol 23 pg 648-657.
Abramovic, H., &Klofutar, C. (2006). Water Adsorption Isotherms of some Gellam Gum
Samples. Journal of Food Engineering , Vol 77 (3) pp 514-520.
Abramovie, H., & Klofutar, C. (2002). Water Adsorption Isotherms of Some Maltodextrins
Samples. Acta Chimica Slovenica , Vol 149 pp85-844.
Adebowale, Y., Adeyemi, I., & Oshodi, A. (2005). Functional and Physicochemical
Properties of Flours of six Mucuna species. African Journal of Biotechnology , Vol 4 (12)pp
1461-1468.
Adeleke, R., & Odedeji, J. (2010). Functional Properties of Wheat and Sweet Potato Flour
Blends. Pakistan Journal of Nutrition , Vol 9 pp 935-938.
Akpata, M., & Akubor, P. (1999). Chemical Composition and Selected Functional Properties
of Sweet Orange(citrus sinensis) Seed Flour. Plant Foods for Human Nutrition , Vol 10 pp
123-127.
Aleem, M., Genitha, T., & Hashmi, S. (2012). Effects of Defatted Soy Flour Incorporation on
Physical,Sensorial and Nutritional Properties of Biscuits. Food Processing Technology ,
Vol.3(149) doi:10.4172/2157-7110.1000149
Ali, M. A., El Tinay, A., Elkhalifa, A. E., Mallasy, L. O., & Babiker, E. E. (2012). Effect of
Different Supplementation Levels of Soybean Flour on Pearl Millet Functional Properties.
Food and Nutrition Sciences , Vol 3 pp 1-6.
University of Ghana http://ugspace.ug.edu.ghUniversity of Ghana http://ugspace.ug.edu.gh

80
Al-Muhtaseb, A., McMinn, W., & Magee, T. (2004). Water Sorption Isotherms of Starch
Powders Part 1:Mathematical Description of Expermental Data. Journal of Food
Engineering , Vol 61 pp 297-307.
Amarjeet, K., Bhupendar, S., & Sindhu, J. (1993). Studies on Bread and Durum Wheat
Blends. Chem. Mikroiol,Technol.Lesbensm , Vol 15 pp 35-40.
Amonsou, E. O., Taylor, J. R., Beukes, M., & Minaar, A. (2012). Composition of Marama
Bean Protein. Food Chemistry , Vol 130(3) pp 638-643.
Anderson,R.B., (1946). Modifications of the Branuer,Emmett and Teller Equation. Journal
of the American Chemical Society , Vol 68 pp 686-691.
Andrape P, R. D., Lewus M, R., & Perez C., C. E. (2011). Models of Sorption Isotherms for
Food; Uses and Limitations. ISSN 0121-4004/ISSNe2145-2660 , Vol 18 (3) pp 325-334.
AOAC. (2000). Official Methods of Analysis. Rockville,Maryland Association of Official
Analytical Chemists , 17th ed.
Armateifio, J., & Moholo, D. (1998). The Chemical Composition of Four Legumes
Consumed in Botswana. Journal of Food Composition and Analysis. , Vol 11 pg 329-332.
Asoegwu, S., Ohanyere, S., Kanu, O., & Iwueke, C. (2006). Physical Properties of African
Oil Bean Seed(pentonclethra nacrophylla). Agricultural Engineering International;the CIGR
E Journal , Vol 8.
Atuonwu, A., & Akobundu, E. (2010). Functional and Pasting Properties of
Pumpkin(cucurbita pepo) Seed Products. Journal of Agricultural and Veterinary Sciences ,
Vol 2.
Ayenor, G. (1976). Particulate Properties and Rheology of Pregelled Yam (D.rotundata)
Products. Journal of Food , Vol (41) pp 180-182.
University of Ghana http://ugspace.ug.edu.ghUniversity of Ghana http://ugspace.ug.edu.gh

81
Ayo, J., Nkama, V., & Adewori, R. (2007). Physicochemical, In-vitro Digestibility and
Organoleptic Evaluation of 'Acha' Wheat Biscuits Supplemented with Soybean Flour .
Nigerian Food Journal. , Vol 25(1) 77-89.
Ayranci, E., & Duman, O. (2004). MoisturSorption Isotherms of Cowpea (Vigna
unguniculata L. Walp) and its Protein Isolate at 10, 20 and 30C. Journal of Food Engineering
, Vol 61 pp 192- 209.
Banureka, V., & Mahendran, T. (2009). Formulation of Wheat -Soy bean Biscuits and their
Quality Characteristics . Tropical Agricultural Research and Extension , Vol 12(2)pp.14-18.
Bojnanska, T., Francakova, H., & Tokar, M. (2012). Legumes- The alternative Raw
Materials for Bread Production. Journal of Microbiology,Biotechnology and Food Sciences ,
pp 876-886.
Bongiwar, D., Padwal, D. S., & Sreenivasan, A. (1979). Development of High Protein Ready
to Eat Foods from Defatted Groundnut and Soybean by Extrusion Cooking. Indian Food
Packer , Vol 33 pp 37-53.
Bower, N., Hertel, K., Oh, J., & Storey, R. (1988). Nurtitional Evaluation of Marama
Bean(Tylosema esculentum,fabaceae) Analysis of the Seed. Economic Botany , Vol 42 (4) pp
533-540.
Branuauer, S., Emmet, P., & Teller, E. (1938). Adsorption of Gases in Multimolecular
Layers. Journal of the American Chemical Society , Vol 60 (2) pp 309-319.
Butt, M. S., & Batool, R. (2010). Nutritional and functional Properties of Some Promising
Legumes Protein Isolates. Pakistan Journal of Nutrition , Vol 9(4) pp 373-379.
Cassini, A., Marczak, L., & Norena, C. (2006). Water Adsorption Isotherms of Texturized
Soy Protein. Journal of Food Engineering , Vol 77 (1) pp 194-199.
Castro, S., Silveira, P., Pereira-Continho, A., & Figueiredo, E. (2005). Systematic Studies in
Tylosema(Leguminosae) . Botanical Journal of Linnean Society , Vol 147 pg 99-115.
University of Ghana http://ugspace.ug.edu.ghUniversity of Ghana http://ugspace.ug.edu.gh

82
Chinma, C. E., Ingblan, E., & Akpapunam, M. (2007). Processing and Acceptability of Fried
Cassava Balls ("Akara-akpu")with Melon and Soybean flours. Journal of Food Processing
and Preservation , Vol 31 (2) pg 143-156.
Chowdhury, A. R., Bhattacharyya, A., & Chattopadhyay, P. (2012). Study of Functional
Properties of Raw and BlendedJackfruit seed flour(a non-conventional source) for Food
Application. Indian Journal of Natural Products and Resources , Vol 3 (3) pp 347-353.
Coffman, C., & Gracia, V. (1977). Functional Properties and Amino Acid Content of Protein
Isolate from Mung Bean Flour. Journal of Food Technology , Vol 12 pp 473.
Devi, K., & Haripriya, S. (2012). Pasting Behaviour of Soy - Enriched Composite Flours on
Quality of Biscuits . Journal of Food Processing and Preservation .
Afoakwa E.O (n.d.). Storage Characteristics and Quality Evaluation of Cowpea-Fortified
Traditional Foods. BSc Dissertation Department of Nutrition and Food Science.University of
Ghana.Legon-Accra, Ghana .
Edema, O., Sanni, O., & Sanni, I. (2005). Evaluation of Maize- Soybean Flour for Sour
Maize Bread Production in Nigeria. African Journal of Biotechnology , Vol4(9)pp. 911-918.
Egbekun, M., & Ehieze, M. (1997). Proximate Composition and Functional Properties of Full
Fat and Defatted Beniseed (sesamum indicum) Flour. Plant Food for Human Nutr , Vol 51
pp 35-41.
Eissa, A., Hussein, A., & Mostafa, B. (2007). Rheological Properties and Quality Evaluation
of ungerminated and Germinated Legume Seeds or Mushrooms. Polisg Journal of Food
Nutrition Science , Vol 57 (4) pp 487-496.
Eltayeb, a. R., Ali, A. O., Abou-Arab, A. A., & Abu-Salem, F. M. (2011). Chemical
Composition and Functional Properties of Flour and Protein Isolate from Bambara
Groundnut(Vigna subterranean). African Journal of Food Science , Vol.5(2)pp. 82-90.
University of Ghana http://ugspace.ug.edu.ghUniversity of Ghana http://ugspace.ug.edu.gh

83
FAO. (1995). Sorghum and Millets in Human Nutrition. FAO Food and Nutrition Series , No
27.
Fekria, A., Isam, A., Suha, O., & Elfadil, E. (2012). Nutritional and Functional
Characterization of Defatted Seed Cake Flour of Two sudanes Groundnut(Arachis
hypogaea)Cultivars. International Food Research Journal , Vol19(2) pp. 629-637.
Fennema R.O.,M Dekker., (1985)Technology & Engineering pp 991
Giami, S., & Bekebian, D. (1992). Proximate Composition and Functional Properties of Raw
and Processed Full Fat Fluted Pumpkin (telfairia occidentalis) Seed Flour. Journal of the
Science of Food and Agriculture , Vol 59 pp 321-325.
Greenspan L. (1977). Humidity Fixed points of Binary Saturated Solutions. Journal of
Research of National Bureau of Standards, Vol 1 pp 89-96.
Gulagjamun Awadhesh, Kumar Singh,Dettatreya Mahadev,Mili Saxena & R.P. Singh (2009)
African Journal of Biochemistry Research.Vol 3 (4) pp 130-135
Hartley, L., Tshamekang, E., & Thomas, S. (2002). Functional heterostyly in Tylosema
esculuntum (Caesalpiniodeae). Annals of Botany, Vol 89 pg 67-76.
Holse, M., Husted, S., & Hansen, A. (2010). Chemical Composition of Marama
Bean(Tylosema esculentum)- A Wild African Bean with Exploited Potential. Journal of
Food Composition and Analysis , Vol 28 pp 648-657.
Honda, S., & Jood, S. (2005). Organoleptic and Nutritional Evaluation of Wheat Biscuits
Supplemented with Untreated and Treated Fenu Greek Flour. Food Chemistry , Vol 90 pp
427-435.
Houssou, P., & Ayenor, G. (2002). Appropriate Processing and Food Functional Properties
of Maize Flour. African Journal of Science and Technology , Vol 3(1)pp126-131.
University of Ghana http://ugspace.ug.edu.ghUniversity of Ghana http://ugspace.ug.edu.gh

84
Hussain, S., Anjum, F. M., Butt, M. S., & Sheikh, M. A. (2008). Chemical Composition and
Functional Properties of Flaxseed Flour. Journal of Agriculture , Vol 24(4).pp 649-653
Husssain, S., Anjum, F., Butt, M., Issa, M., & Asghar, A. (2006). Physical and Sensoric
Attributes of Flaxseed Flour Supplemented Cookies. Turkish Journal of Biology , Vol 30
pp.87-92.
Hartley L.M. (1997). Breeding Systems and Genetic Variation in Tylosema esculentum.
Falmer.Sussex University .
Iglesias, H., & Chirife, J. (1985). BET Monolayer Values n Dehydrated Foods and Food
Components . Leb-ensmittel-Wissenschaft und-Technologie , Vol 9 pp 107-113.
Ikegwu, O., Ikechukwu, P., & Ekumankana, E. (2010). Physico-Chemical and Pasting
Characteristics of Flour and Starch from Achi Brachystegia eurycoma seed. Journal of Food
Technology , Vol 8(2)pp 58-66.
Ikpeme, C., Osuchukwo, N., & Oshiele, L. (2010). Functional and Sensory Properties of
Wheat(Aestium triticium) and taro flour (Colocasia esculanta)Composite Bread. Africa
Journal of Food Science , Vol14(5)pp. 248-253.
Iwe M.O (2002). Handbook of Sensory Methods and Analysis . 1st edt.Enugu:Rejoint
Communication Ltd , pp71.
Inoue, Y., Sapirstein, H., & Bushuk, W. (1995). Effect of Shortening Systems on Baking and
Rheological Properties . Cereal Che lesegoolm , Vol.72(2) pp.221-226.
Jackson, J. C., Duodu, K. G., Holse, M., Lima de Faria, M. D., Juidaan, D., Chingwaru, W.,
et al. (2010). The Morama Bean(Tylosema esculuntum):A Pontential Crop for Southern
Africa. Advances in Food and Nutrition Research , Vol 61 pages 187-246.
University of Ghana http://ugspace.ug.edu.ghUniversity of Ghana http://ugspace.ug.edu.gh
85
Jideane, V., Van Wyk, J., & Cruywagen, M. (2009). Physical Properties of Tylosema
Esculentum and the Effect of Roasting on the Functional Properties of its Flour. African
Journal of Agricultural Research , Vol.4 (11) pp 1208-1219.
Jitngarmkusol, Hongsuwankul, J., & Tananuwong, K. (2008). Chemical Composition,
Functional Properties and Microstructure of Defatted Macademia Nuts . Food Chemstry , Vol
110 pp 23-30.
Kadam M.L,Salve R.V, Mehrajfatema, Z.M & More S.G. (2012). Development and
Evaluation of Composite Flour for Missiroti/chapatti. Journal of Food Processing and
Technology , Vol 3:1.
Kerr, W., Ward, C., McWatters, K., & Ressurreccion, A. (2001). Milling and Particle Size of
Cow Pea Flour and Snack Chip Quality. Food Research International , Vol 34(1) pp 39-45.
Ketshajwang, K. K., Holmback, & Yeboah, S. (1998). Quality and Compositional Studies of
some Edible Seed Oils in Botswana. Journal of American Oil Chemists' Society , Vol 75 pg
741-743.
Khalil, A., Mansour, E., & Dawood, F. (2000). Influence of Malt on Rheological and Baking
Properties of Wheat- Cassava Composite Flours. Lebensmettel Wissenchaf Technol , Vol 33
pp159-164.
Khattab, R., & Arnfield, S. (2009). Functional Propereties of Raw and Processed Canola
Meal. Food Science and Technology , Vol 42 pp 1119-1124.
Kohajdova, Z., Karovicova, J., & Magala, M. (2011). Utilisation of Chickpea Flour for
Crackers Production Acta Chimita Slovata, Vol4(2) pp.98-107.
Lawal, O., & Adebowale, K. (2004). Effect of Acetylation and Succinylation on Soluility
Profile,Water Absorption Capacity,Oil Absorption Capacity and Emulsifying Properties of
Mucuna Bena(Mucuna pruten) Protein Concentrate . Nahrung/Food , Vol 48 (2) pp 129-136.
University of Ghana http://ugspace.ug.edu.ghUniversity of Ghana http://ugspace.ug.edu.gh

86
Lawal, O., Adebowale, K., & Adebowale, Y. (2007). Functional Properties of Native and
Chemically Modified Protein Concentrates from Bambara Groundnut. Food Research
International , Vol 40 pp 1003-1011.
Lawhon, J., Cater, C., & Mattil, K. (1972). A Comparative Study of Whipping Potential of an
Extract from Several Oil Seed Flours. Cereal Science Today , Vol 12 pp 473.
Lawlor, D. (2004). Improvement of Marama Bean (Tylosema esculentum) An Underutilized
Grain and Tuber Producing Legume for Southern Africa. ICA 4-CT 2000-30010 Rothamsted:
European Union .
Lomauro, C., Bakshi, A., & Labuza, T. (1985). Evaluation of Moisture Sorption Isotherm
Equations:Part 1,Fruit,Vegetables and Meat products . Leb-ensmittel-Wissenschaft und-
Technologie , Vol 18 pp 111-117.
Malomo Olu,Ogunmoyela O.A.B.,Adekoyeni O.O.,Oluwajoba S.O.,Sobanwa M.O (2012)
International Journal of Food Science and Nutrition Engineering.Vol 2 (6) pp 101-107
McWatters K.H. (1978). Cookie Baking Properties of Defatted Peanut Soybean and Field
Pea Flours. Cereal Chemistry , Vol 55 pp 853-863.
Maroulis, Z., Tsami, D., & Marinos-Kouris, D. (1988). Application of the GAB moisture to
the Moisture Sorption Isotherm for Dried Fruits. Journal of Food Engineering , Vol 7 pp 63-
78.
Maruatona, G., Duodu, K., & Minaar, A. (2009). Physicochemical, Nutritional and
Functional Properties of Marama Bean Flour . Food Chemistry , Vol 121 pg 400-405.
Menkov, N. D., & Durakova, A. G. (2007). Moisture Sorption Isotherms of Sesame Flour at
several Temperatures. Food Technol. Biotechnol , 45(1) 96-100.
Menninger,Edwin Arnold.,(1970) Lowering vines of the World;An Encyclopedia of
Climbing PlantsISBN 10;0820800635
Michaelsen, K., & Henrik, F. (1998). Complementary Feeding:A Global Perspective.
Nutrition , Vol 14 (10) pp 763-766.
University of Ghana http://ugspace.ug.edu.ghUniversity of Ghana http://ugspace.ug.edu.gh
87
Mmonatau, Y. (n.d.). Flour from Morama Bean: Composition and Sensory Properties in a
Botswana Perspective. University of Stellenbosch,South Africa.MSc Thesis,Consumer Sci .
Moiraghi, M., Vanzetti, L., Bainotti, C., Helguera, M., Leon, A., & Perez, G. (n.d.).
Relationship Between Soft Wheat Flour Physicochemical Composition and Cookie Making
Perfomance. Cereal Chemistry , Vol 88(2) 130-136.
Mosele, M., Hansen, A., Schulz, A., & Martens, H. (2011). Proximate Composition,
Histochemical Analysis and Microstructure Loclisation of Nutrients in Inmature and Mature
Seeds of Marama Bean(Tylosema Esculentum)-An underutilized Food Legume . Food
Chemistry , Vol 127 pp 1555-1561.
Mosele M. (2012). Chemical and Structural Characterisation of Marama Bean (Tylosema
esculuntum) Carbohydrates. Phd Thesis .
Mpotokwane, S., Tlhong, T., Mthombeni, F., Gaditlhatlhelwe, E., Phokoje, O., & Jackson, J.
(2013). Effect of Pre-processing on the Physico-Chemical Properties of Morama
bean(Tylosema esculentum). African Journal of food,Agriculture,Nutrition and
Development, Vol 13 (1) pp 7105-7121.
Mujoo, R., Trinh, T., & Ng, K. (2003). Characterization of Storage Proteins in Different
Soybean Varieties and their Relationship to Tofu Yield and Texture. Food Chemistry , Vol
82 pp 265-273.
Mulet, A., Gracia-Reverter, J., San juan, R., & Bon, j. (1999). Sorption Isosteric Heat
Determination by Thermal Analysis and Sorption Isotherms. Journal of Food Engineering ,
Vol 64 (1) 64-68.
Museler, D. L., & Schonfeldt, H. (2006). The Nutrient Content of the Marama
Bean(Tylosema esculentum) an Underutilized Legume from Southern Africa. AGRICOLA ,
pp 2-8.
University of Ghana http://ugspace.ug.edu.ghUniversity of Ghana http://ugspace.ug.edu.gh

88
Nepolo, E., Takundwa, M., Chimwamurombe, P., Cullis, C., & Kunert, K. (2009). A Review
of Geographical Distribution of Marama Bean[Tylosema esculentum (Burchel) Schreiber]
and Genetic Diversity in the Namibian Germplasm. African Journal of Biotechnology , Vol
108(10) pp 2088-2093.
Noor, A. A., Mohamad, N. A., & Ho, L.-H. (2012). Physicochemical and Organoleptic
Properties of Cookies Incorporated with Legume Flour. International Food Research
Journal,Vol.19(4) pp.1539-1543.
Nwosu, J. N. (2013). Production and Evaluation of Biscuits from Blends of Bambara
Groundnut (Vigna Subterranae) and Wheat (Triticum Eastrum) Flours. International Journal
of Food and Nutrition Science , Vol 2 (1).
Ogunbusola, M., Fagbemi, N., & Osundahunsi, F. (2012). Chemical and Functional
Properties of Full Fat and Defatted White Melon(Cucumeropsis mannii) Seed Flours. Journal
of Food Science and Engineering , pp691-696.
Okezie O.B & A.B Bello (1988) Physio-Chemical and Functional Properties of Winged Bean
Flour and Isolate compared with Soy Isolate. Journal of Food Science. Vol 53 (2) 450-454
Okpala, L., & Okoli, E. (2011). Formulation and Evaluation of Cookies Containing
Germinated Pigeon Pea,Fermented Sorghum and Cocoyam Flour Blends using Mixture
Response Methodology. Advance Journal of Food Science and Technology , Vol 3(5)
pp.366-375.
Oluwamukomi, M., & Jolayemi, O. (2012). Physico-Thermal and Pasting properties of Soy-
Melon-Enriched "gari" semolina from cassava. Agriculture and Engineering
International:CIGR Journal , 14(3) pg105-116.
Peter I. Akubor. (2003). Fuctional Properties and Performance of Cowpea/Plantain/Wheat
Flour Blends in Biscuits . Journal Plant Food Nutrition , Vol 58 pp 1-8.
University of Ghana http://ugspace.ug.edu.ghUniversity of Ghana http://ugspace.ug.edu.gh

89
Preedy, V., Vatson, R., & Plate, V. (2011). Legume Composites Flour and Baked
Goods.Flour and Breads and their Fortification in Health and Disease Prevention. pp.196-
198.
Ragaee, S., & Abdel-Aal, E. (2006). Pasting Properties of starch and Protein in Selected
Cereal. Food chemistry , Vol 95 (1) pp 9-18.
Saad,M.,Gaianic C.,Scher,J.,Cuq B.,Ehrhardt,J.J.,&Desobry S. (2009) Impact of Re-grinding
on Hydration Properties and Surface Composition of Wheat Flour.Journal of Cereal
Science.Vol 49 pp 134-140
Saleh, A. M., Salama, A. E.-D., Beider, S. H., & Abd-Elazim, E. I. (2012). Effect of Partial
Substitution of Wheat with Either Defatted Soy Flour or Chickpea Flours at Different Ratios
on Rheological and Physical Properties of Dough and Quality Characteristics of Biscuits .
Journal of Applied Sciences Research , Vol 8(12) pp.5806-5817.
Salunkhe, S., & Kadam, S. (1989). Handbook of World Food Legumes . Nutritional
Chemistry,Processing Technologies and Utilization, Vol 1 & 2.
Sandhu, K., Singh, N., & Mahli, N. (2005). Physicochemical and Thermal Properties of
Starches Separated from Corn from Crosses of Two Germ Pools . Food Chemistry , Vol (89)
259-267.
Sathe, S., & Salunke, S. (1981). Functional Properties of Great Northern Beans. Journal of
Food Science, Vol 46 pp 71-75.
Shahzadi, N., Butt, M. S., Rehman, S. U., & Sharif, K. (2005). Rheological and Baking
Perfomance of Composite Flours. International Journal of Agriculture and Biology , Vol 1
pp 100-104.
Shahzard, H., Anjum, F. M., Butt, M. S., Khan, M. I., & Asghar, A. (2006). Physical and
Sensoric Attributes of Flaxseed Flour Supplemented Cookies. Turkish Journal of Biology ,
Vol 30 pp 87-92.
University of Ghana http://ugspace.ug.edu.ghUniversity of Ghana http://ugspace.ug.edu.gh

90
Siddhuraju, P., Vijayakumari, K., & Janardhanan, K. (1996). Chemical Composition and
Protein Qualityof the Little Known Legume Velvet bean (mucuna pruriens). Journal of
Agricultural and Food Chemistry , Vol 44 pg 2636-2641.
Singh, A. K., Kadam, D. M., Saxena, M., & Singh, R. (2009). Efficacy of Defatted Soy Flour
Supplement in Gulabjamum. African Journal of Biochemistry Research , Vol 3 (4) pg 130-
135.
Singh, A., Kadam, D., Saxena, M., & Signh, R. (2009). Efficacy of Defatted Soy Flour
Supplement in Gublabjamun . African Journal of Biochemistry Research , Vol.3(4) pp.130-
135.
Sonaye, S., & Baxi, D. (2012). Particle Size Measurement and Analysis of Flour.
International Journal of Engineering and Applications , Vol 2 (3) pp 1839-1842.
Staudt, P., Kechinski, C., Tesarro, I., Marczak, L., Soares, R. d., & Cardozo, N. (2013). A
New Method for Predicting Sorption Isotherms at Different Temperatures Using BET Model.
Journal of Food Engineering , Vol 114 pp 139-145.
Thys, R., Norena, C., Marczak, L., Aires, A., & Cladera-Olivera, F. (2010). Adsorption
Isotherms of Pinhao(Arancaria agustifolia seeds) Starch and Thermodynamics Analysis.
Journal of Food Engineering , Vol 100 (3) pp 468-473.
Timmerman. (2000). Multilayer Sorption Parameters;BET or GAB Values.
Trust, Birt. I. (2011). Biscuits and Cookies Information Sheel , Vol 10.
Ubbor, S., & Akobundu, E. (2009). Quality Characteristics of Cookies from Composite
Flours of Watermelon Seed,Cassava and Wheat. Pakistan Journal of Nutrition , Vol.8(7) pp.
1097-1102.
University of Ghana http://ugspace.ug.edu.ghUniversity of Ghana http://ugspace.ug.edu.gh
91
Uzor-Peters, P., Arisa, N., Lawrence, C., Osondu, N., & Adelaja, A. (2008). Effect of
Partially Defatted Soybeans of Groundnut Cake Flours on Proximate and Sensory
Characteristics of Kokoro. African Journal of Food Science , Vol 2()pp. 098-101.
Vadahally, S. N., Vadakkoot, S. B., Vishwas, P. M., & Vasudeva, S. (2012). Nutrients and
antinutrients of Cowpea and Horse Gram Flours in Comparison to Chickpea
Flour;Evaluation of their Flour Functionality.Food Chemistry, Vol 131 (2) pp 462-469.
Van der Mansen, L. (2006). "T.esculentum (Burch) A Schreib in PROTA1. Cereals and
Pulses-M. Brink and G.Belays,eds. Wageningen,The Netherlands PROTA .
Venkatachalam, M., & Sathe, S. (2006). Chemical Composition of Selected Edible Nut
Seeds. Journal of Agricultural and Food Chemistry , Vol 54 pp 4705-4714.
Wagner J.R, Gueguen J. (1999) Surface Functional of Native, Acid-treated,and Reduced Soy
Glicinin 2.Emulsifying Properties. Journal of the Science of Food and Agriculture, 47 pp
2181-2187
Whitely P.R. (1970). Development of High Protein Biscuits from Green Gram flour
Manufactures . Applied Science Publisher Ltd.London U.K .
Zaidhul, I., Hiroaki, Y., Sun-Ju, K., Naoto, H., & Takahiro, N. (2006). RVA Study on the
Mixture of Wheat Flour and Potato Starches with Different Phosphorus contents. Food
Chemistry , doi.101016.
Zucco, F., Borsuk, Y., & Arntfield, S. (2011). Physical and Nutritional Evaluation of wheat
Cookies Supplemented with Pulse Flours of Particle Sizes . LWT-Food.Science and
Technology .
University of Ghana http://ugspace.ug.edu.ghUniversity of Ghana http://ugspace.ug.edu.gh

92
APPENDICES
Appendix 1
ISOTHERMS BASED ON GAB EQUATION
10% SOFT WHEAT AND FULL FAT MORAMA
0.80.70.60.50.40.30.20.10.0
17
16
15
14
13
12
11
10
9
8
Aw
M
S 1.03343
R-Sq 90.0%
R-Sq(adj) 86.1%
Fitted Line PlotM = 9.179 - 10.18 Aw
+ 22.16 Aw**2
The regression equation is
M = 9.179 - 10.18 Aw + 22.16 Aw**2
S = 1.03343 R-Sq = 90.0% R-Sq(adj) = 86.1%
Analysis of Variance
Source DF SS MS F P
Regression 2 48.2539 24.1269 22.59 0.003
Error 5 5.3399 1.0680
Total 7 53.5937
Sequential Analysis of Variance
Source DF SS F P
Linear 1 40.0059 17.67 0.006
Quadratic 1 8.2480 7.72 0.039
University of Ghana http://ugspace.ug.edu.ghUniversity of Ghana http://ugspace.ug.edu.gh

93
2. 10% SOFT WHEAT AND DEFATTED MORAMA
Polynomial Regression Analysis: M versus Aw The regression equation is
M = 2.782 + 8.355 Aw + 1.289 Aw**2
S = 0.361976 R-Sq = 98.3% R-Sq(adj) = 97.6%
Analysis of Variance
Source DF SS MS F P
Regression 2 38.0532 19.0266 145.21 0.000
Error 5 0.6551 0.1310
Total 7 38.7083
Sequential Analysis of Variance
Source DF SS F P
Linear 1 38.0253 334.02 0.000
Quadratic 1 0.0279 0.21 0.664
0.80.70.60.50.40.30.20.10.0
11
10
9
8
7
6
5
4
3
Aw
M
S 0.361976
R-Sq 98.3%
R-Sq(adj) 97.6%
Fitted Line PlotM = 2.782 + 8.355 Aw
+ 1.289 Aw**2
University of Ghana http://ugspace.ug.edu.ghUniversity of Ghana http://ugspace.ug.edu.gh

94
3. 40% SOFT WHEAT AND FULL FAT MORAMA
0.80.70.60.50.40.30.20.10.0
10
9
8
7
6
Aw
M
S 0.205664
R-Sq 98.6%
R-Sq(adj) 98.1%
Fitted Line PlotM = 5.325 + 5.842 Aw
+ 0.191 Aw**2
Polynomial Regression Analysis: M versus Aw The regression equation is
M = 5.325 + 5.842 Aw + 0.191 Aw**2
S = 0.205664 R-Sq = 98.6% R-Sq(adj) = 98.1%
Analysis of Variance
Source DF SS MS F P
Regression 2 15.1875 7.59377 179.53 0.000
Error 5 0.2115 0.04230
Total 7 15.3990
Sequential Analysis of Variance
Source DF SS F P
Linear 1 15.1869 429.62 0.000
Quadratic 1 0.0006 0.01 0.909
University of Ghana http://ugspace.ug.edu.ghUniversity of Ghana http://ugspace.ug.edu.gh

95
4. 40% SOFT WHEAT AND DEFATTED MORAMA
0.80.70.60.50.40.30.20.10.0
12
10
8
6
4
2
0
Aw
M
S 1.32106
R-Sq 92.1%
R-Sq(adj) 89.0%
Fitted Line PlotM = - 1.545 + 22.91 Aw
- 8.22 Aw**2
Polynomial Regression Analysis: M versus Aw The regression equation is
M = - 1.545 + 22.91 Aw - 8.22 Aw**2
S = 1.32106 R-Sq = 92.1% R-Sq(adj) = 89.0%
Analysis of Variance
Source DF SS MS F P
Regression 2 102.147 51.0733 29.26 0.002
Error 5 8.726 1.7452
Total 7 110.873
Sequential Analysis of Variance
Source DF SS F P
Linear 1 101.011 61.46 0.000
Quadratic 1 1.136 0.65 0.456
University of Ghana http://ugspace.ug.edu.ghUniversity of Ghana http://ugspace.ug.edu.gh

96
SORPTION ISOTHERM BASED ON BET EQUATION
10% SOFT WHEAT AND FULL FAT MORAMA
Regression Analysis: Aw/(1-Aw)M versus Aw The regression equation is
Aw/(1-Aw)M = - 2.026 + 21.65 Aw
S = 0.931951 R-Sq = 94.7% R-Sq(adj) = 93.0%
Analysis of Variance
Source DF SS MS F P
Regression 1 46.8769 46.8769 53.97 0.005
Error 3 2.6056 0.8685
Total 4 49.4825
0.50.40.30.20.1
10
8
6
4
2
0
Aw
Aw
/(1
-Aw
)M
S 0.931951
R-Sq 94.7%
R-Sq(adj) 93.0%
Fitted Line PlotAw/(1-Aw)M = - 2.026 + 21.65 Aw
University of Ghana http://ugspace.ug.edu.ghUniversity of Ghana http://ugspace.ug.edu.gh

97
10% SOFT WHEAT AND DEFATTED MORAMA
Regression Analysis: Aw/(1-Aw)M versus Aw The regression equation is
Aw/(1-Aw)M = - 1.941 + 16.56 Aw
S = 0.903597 R-Sq = 91.8% R-Sq(adj) = 89.1%
Analysis of Variance
Source DF SS MS F P
Regression 1 27.4195 27.4195 33.58 0.010
Error 3 2.4495 0.8165
Total 4 29.8690
0.50.40.30.20.1
8
7
6
5
4
3
2
1
0
Aw
Aw
/(1
-Aw
)M
S 0.903597
R-Sq 91.8%
R-Sq(adj) 89.1%
Fitted Line PlotAw/(1-Aw)M = - 1.941 + 16.56 Aw
University of Ghana http://ugspace.ug.edu.ghUniversity of Ghana http://ugspace.ug.edu.gh

98
40% SOFT WHEATAND FULL FAT MORAMA
Regression Analysis: Aw/(1-Aw)M versus Aw The regression equation is
Aw/(1-Aw)M = - 1.823 + 18.41 Aw
S = 0.776455 R-Sq = 94.9% R-Sq(adj) = 93.2%
Analysis of Variance
Source DF SS MS F P
Regression 1 33.9055 33.9055 56.24 0.005
Error 3 1.8086 0.6029
Total 4 35.7141
0.50.40.30.20.1
9
8
7
6
5
4
3
2
1
0
Aw
Aw
/(1
-Aw
)M
S 0.776455
R-Sq 94.9%
R-Sq(adj) 93.2%
Fitted Line PlotAw/(1-Aw)M = - 1.823 + 18.41 Aw
University of Ghana http://ugspace.ug.edu.ghUniversity of Ghana http://ugspace.ug.edu.gh

99
40% SOFT WHEAT AND DEFATTED MORAMA
Regression Analysis: Aw/(1-Aw)M versus Aw The regression equation is
Aw/(1-Aw)M = - 3.332 + 21.22 Aw
S = 2.20854 R-Sq = 75.5% R-Sq(adj) = 67.3%
Analysis of Variance
Source DF SS MS F P
Regression 1 45.0190 45.0190 9.23 0.056
Error 3 14.6330 4.8777
Total 4 59.6520
0.50.40.30.20.1
10
8
6
4
2
0
Aw
Aw
/(1
-Aw
)MS 2.20854
R-Sq 75.5%
R-Sq(adj) 67.3%
Fitted Line PlotAw/(1-Aw)M = - 3.332 + 21.22 Aw
University of Ghana http://ugspace.ug.edu.ghUniversity of Ghana http://ugspace.ug.edu.gh

100
Appendix 2
PASTING BEHAVIOR OF THE WHEAT FLOURS AND THE WHEAT –MORAMA
BEAN COMPOSITE FLOURS
University of Ghana http://ugspace.ug.edu.ghUniversity of Ghana http://ugspace.ug.edu.gh
101
Appendix 3. Sensory Ballot sheet
BALLOT SHEET FOR SENSORY ACCEPTABILITY OF WHEAT-MORAMA BEAN
BISCUITS
DEPARTMENT OF NUTRITION AND FOOD SCIENCE
Panelist ……………
UNIVERSITY OF GHANA
Sample: Wheat-Morama biscuits formulation Date ……….…
Instructions:
NOTE: DO NOT ATTEMPT THIS EVALUATION IF YOU ARE ALLERGIC TO
NUTS
You have been presented with 9 coded samples of Wheat-Morama cookies formulations
made from flours of wheat and Morama bean. Please assess the attributes of the various
biscuits formulations. Rinse your mouth with water after evaluating each sample. Please rank
the intensity of your liking for each attribute of the cookie formulation by using the
9-point hedonic scale given:
1= dislike extremely
2= dislike very much
3= dislike moderately
4= dislike slightly
5= neither like nor dislike
6= like slightly
7= like moderately
8= like very much
9= like extremely
University of Ghana http://ugspace.ug.edu.ghUniversity of Ghana http://ugspace.ug.edu.gh

102
A. APPEARANCE
Please look at the samples and indicate your liking for appearance (in terms of smoothness,
cracks on the surface) by writing the codes of the samples in the spaces below and ranking
the score from the 9-point hedonic scale in the space below the code.
Sample ……… ……… ……… ……… ……. …….. ……… ……..
……..
Rank ……… ……… ……… ……… …… ……… ……… ……..
………
B. COLOUR
Please look at the samples and indicate your liking for colour by writing the codes of the
samples in the boxes below and ranking the score from the 9-point hedonic scale in the space
below the code.
Sample ……… ……… ……… ……… ……… ……… ……… ………
………
Rank ……… ……… ………. ………. ………. ……… ………. ………
……...
C. AROMA
Please take a sample and place it very close to your nose, take a sniff and indicate your liking
for aroma by writing the codes of the samples in the boxes below and the score from the 9-
point scale in the space below the code.
D. CRISPINESS (firm but easily broken or crumbled; brittle)
Please break the sample with your hands, and indicate your liking for crispiness by writing
the codes of the samples in the boxes below and ranking the score from the 9-point hedonic
scale in the space below the code.
University of Ghana http://ugspace.ug.edu.ghUniversity of Ghana http://ugspace.ug.edu.gh

103
Sample ……… …..… ……… ……….. ……… ……… …….. ……..
………
Rank ……… …….. ……… …….... ……… ………. ……… ………
………
E. TEXTURE
Please break a small piece of the sample, put it in the mouth and indicate your liking for
texture as you chew by writing the codes of the samples in the boxes below and ranking the
score from the 9-point hedonic scale in the space below the code.
Sample ……… …..… ……… ……….. ……… ……… ……… ……. ……..
Rank ……… …….. ……… …….... ……… ……. ………. ……… ………
F. TASTE
Please chew the sample and indicate your liking for taste (sweetness, off taste, aftertaste) by
writing the codes of the samples in the boxes below and ranking the score from the 9-point
hedonic scale in the space below the code.
Sample ……… ………. ……… ……… ……. ……. ……… ……… ………
Rank ……… ………. ……… ……… ………. ……… ……… …….. ……..
G. OVERALL ACCEPTANCE
Please indicate your overall liking by writing the codes of the samples in the boxes below
and ranking the score from the 9-point hedonic scale in the space below the code.
Sample ……… ……… …….. ……… ……. …….. ……… ……… ………
Rank ……… …...… ……… ……… ……… ……. ……… ………. ……….
University of Ghana http://ugspace.ug.edu.ghUniversity of Ghana http://ugspace.ug.edu.gh

104
Comments
…………………………………………………………………………………………………
…………………………………………………………………………………………………
…………………………………………………………………………………………………
…………………………………………………………………………………………………
Thank you for your time
University of Ghana http://ugspace.ug.edu.ghUniversity of Ghana http://ugspace.ug.edu.gh