Embed Size (px)
Citation preview

10/20/2005
Careers in Statistics
The Role of a Biostatistician
Presentation at Central College
Pella, Iowa
10/20/2005
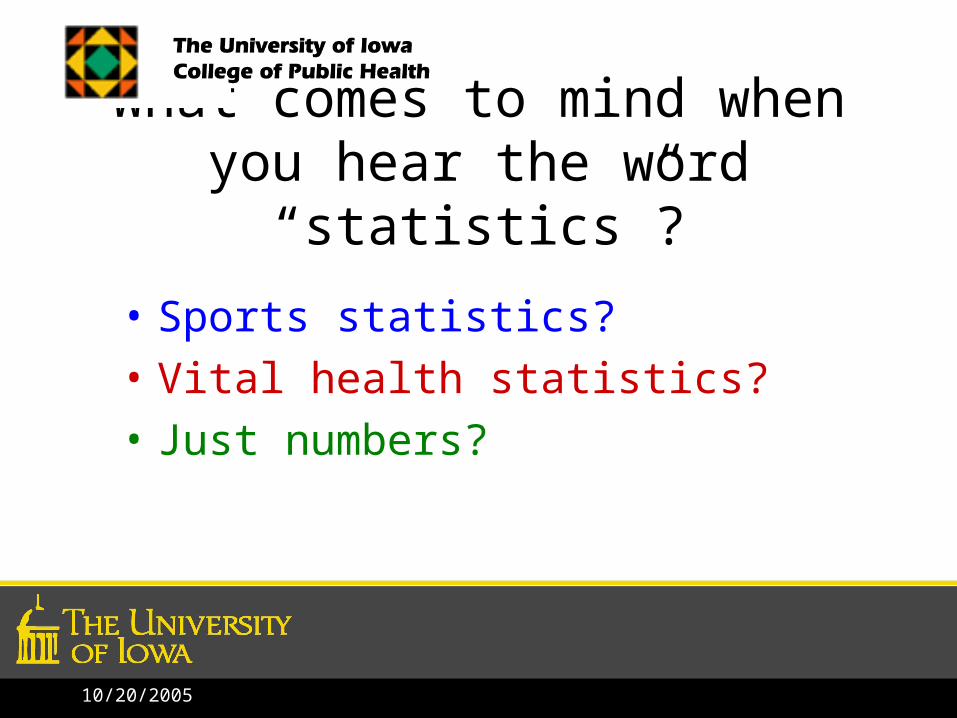
What comes to mind when you hear the word “statistics”?
• Sports statistics?
• Vital health statistics?
• Just numbers?
10/20/2005
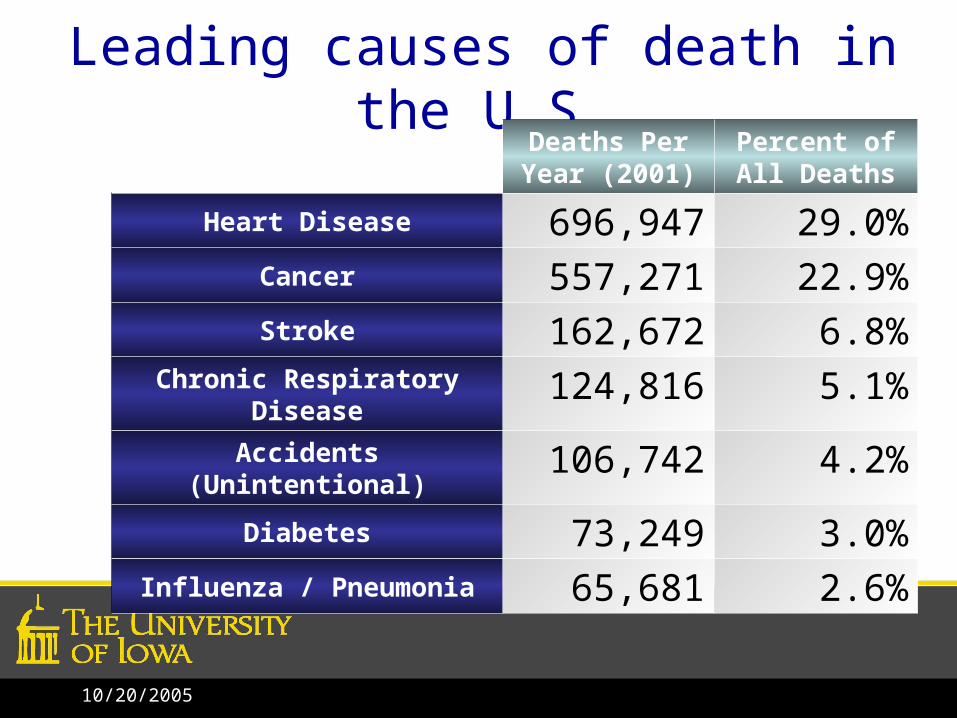
Leading causes of death in the U.S.Deaths Per Year (2001)
Percent of All Deaths
Heart Disease 696,947 29.0%Cancer 557,271 22.9%Stroke 162,672 6.8%
Chronic Respiratory Disease 124,816 5.1%Accidents (Unintentional) 106,742 4.2%
Diabetes 73,249 3.0%Influenza / Pneumonia 65,681 2.6%

10/20/2005
Cancer Death Rates*, for Men, US, 1930-2000
0
20
40
60
80
100
1930
1935
1940
1945
1950
1955
1960
1965
1970
1975
1980
1985
1990
1995
2000
Rate Per 100,000Lung
Stomach
Colon & rectum
Prostate
Pancreas
LiverLeukemia
10/20/2005
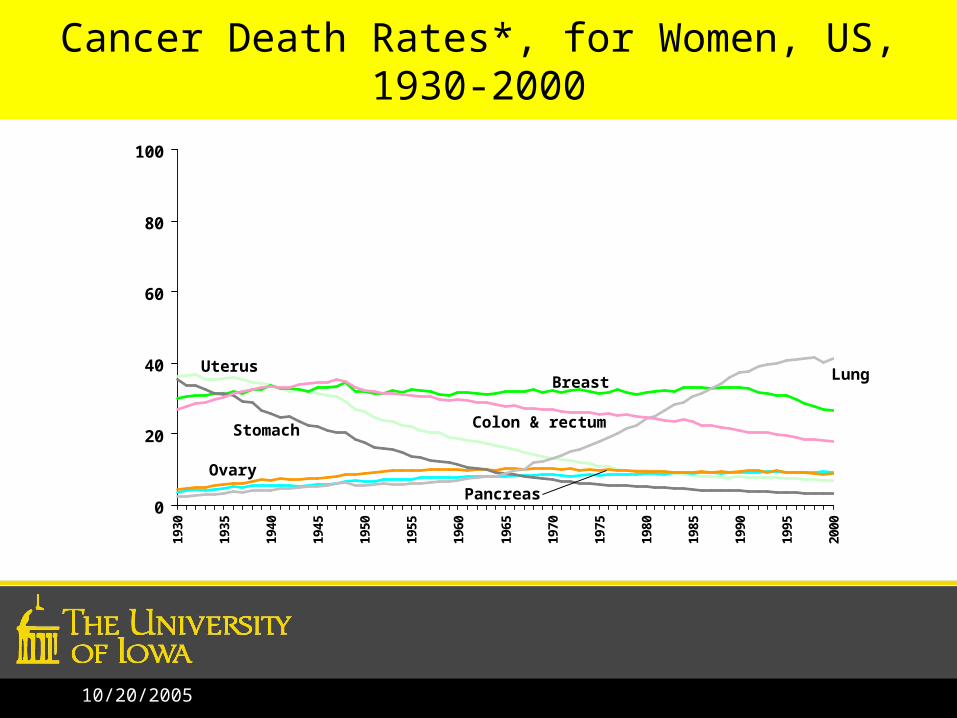
Cancer Death Rates*, for Women, US, 1930-2000
0
20
40
60
80
100
1930
1935
1940
1945
1950
1955
1960
1965
1970
1975
1980
1985
1990
1995
2000
UterusBreast Lung
Colon & rectumStomach
Ovary
Pancreas

10/20/2005
Tobacco Use in the US, 1900-2000
0
500
1000
1500
2000
2500
3000
3500
4000
4500
5000
1900
1905
1910
1915
1920
1925
1930
1935
1940
1945
1950
1955
1960
1965
1970
1975
1980
1985
1990
1995
2000
Year
Per
Cap
ita
Cig
aret
te C
on
sum
pti
on
0
10
20
30
40
50
60
70
80
90
100
Ag
e-A
dju
sted
Lu
ng
Can
cer
Dea
th
Rat
es*
Per capita cigarette consumption
Male lung cancer death rate
Female lung cancer death rate

10/20/2005
Trends in Overweight* Prevalence (%), Adults 18 and Older, US, 1992-2002
Less than 50% 50 to 55%
More than 55%
State did not participate in survey
*Body mass index of 25.0 kg/m2or greaterSource: Behavioral Risk Factor Surveillance System, CD-ROM (1984-1995, 1998) and Public Use Data Tape (2002), National Center for Chronic Disease Prevention and Health Promotion, Centers for Disease Control and Prevention, 1997, 2000, 2003.
1992 1995
1998 2002
10/20/2005
Discipline of Statistics
• The statistics presented here involve massive efforts to collect the data, followed by simple calculations.
• We see differences, but are they meaningful? Could they have happened by chance?
• If we see trends that we do not like, what can we do to effect change?
10/20/2005
Discipline of Statistics
• Numbers carry information, but we need numerical reasoning to make their meaning clear.
• The discipline of statistics uses mathematical tools to quantify uncertainty and assign a likelihood that what we see could have happened by chance.
• Biostatistics is just statistics applied in the health sciences.
• Mathematics and math logic play critical roles.

10/20/2005
Typical Research Questions
• We rely heavily on medications to treat diseases and medical conditions.– How do we know that they work (are
efficacious) and are safe?
• Heart disease is the #1 cause of death. – How can we assess if an intervention is
effective in reducing a person’s risk?
10/20/2005
Competing Possible Errors• Any research study has the possibility of making
one of two types of errors:
– Type I: Declaring a significant effect when in fact there is none.
– Type II: Failing to find a significant difference when there is one.
• In statistics, we use mathematical theory and modeling to find optimal decision rules and choose sample sizes which will reduce the likelihood of these errors to acceptable levels.
10/20/2005
Example: Clinical Trials
• One type of research design to address such questions is known as a clinical trial.
• In a clinical trial, patients are randomly assigned to either the new drug/treatment or “standard care”.
• When possible, both patients and doctors are blinded to the assignment.

10/20/2005
Clinical Trials
IHAST2 Trial
Intraoperative
Hypothermia for
Aneurysm Surgery Trial
Michael Todd MD, Bradley Hindman MD, Michael Todd MD, Bradley Hindman MD, William Clarke PhD, James Torner PhDWilliam Clarke PhD, James Torner PhD
University of IowaUniversity of Iowa and the IHAST2 Investigators.and the IHAST2 Investigators.
Supported by NIH RO1 NS38554Supported by NIH RO1 NS38554
10/20/2005
IHAST1• Hypothermia was first used in neurosurgery in 1955.
• Based on research experience with animals, it was believed that cooling the body before neurosurgery would be protective against central nervous system (CNS) insults.
• At present, at least 50% of current open neurovascular cases are cooled (Pemberton, 2003).
• However, this was being done without a rigorous assessment of outcomes.

10/20/2005
IHAST1• In 1999, U. of Iowa researchers published the results
of a small pilot clinical trial on this*.
• They randomly assigned 114 patients with and without acute aneurysmal subarachnoid hemorrhage (SAH) to either cooling or normal body temperature before surgery– Cooling = target body temperature of 33.5 C – Normal = body temperature 37C
Hindman, Todd, et al. Neurosurgery. 1999 Jan;44(1):23-32; discussion 32-3.
10/20/2005
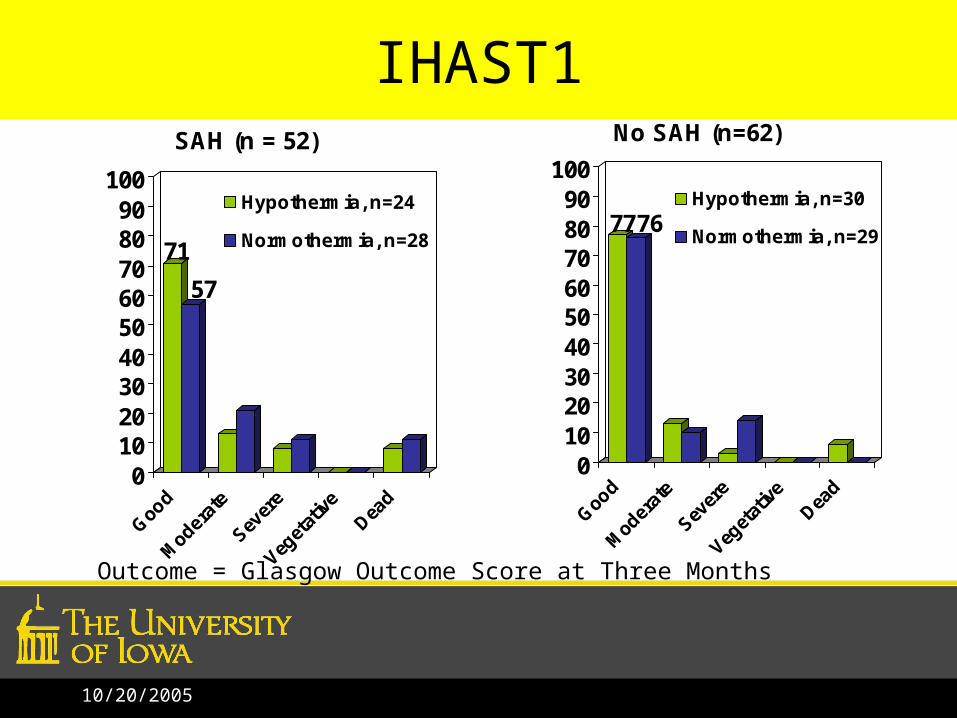
IHAST1
71
57
0102030405060708090
100
Goo
d
Mod
erat
e
Sever
e
Veget
ativ
eDea
d
SAH (n = 52)
Hypothermia, n=24
Normothermia, n=28
Outcome = Glasgow Outcome Score at Three Months
7776
0102030405060708090
100
Good
Mod
erat
e
Sever
e
Veget
ative
Dead
No SAH (n=62)
Hypothermia, n=30
Normothermia, n=29

10/20/2005
IHAST1• Is it beyond reasonable doubt that hypothermia
is working?
• SAH patients (n=52) : 71% vs. 57% =“good” – Looks like hypothermia is helping.
• No SAH (n=62): 77% vs. 76% = “good”– Looks like little effect of hypothermia.
10/20/2005
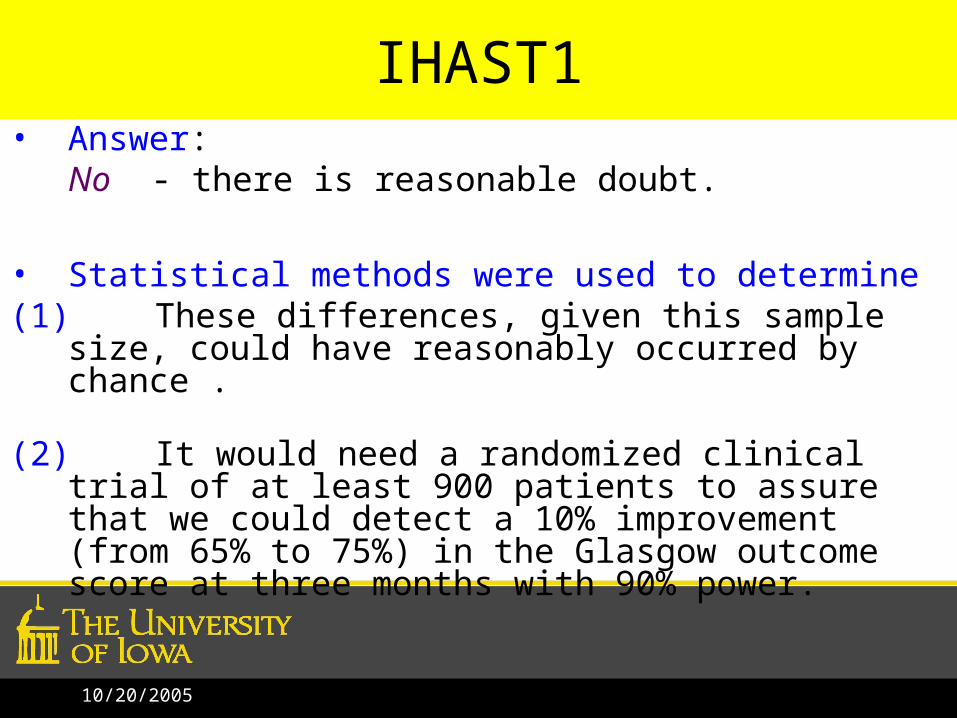
IHAST1• Answer:
No - there is reasonable doubt.
• Statistical methods were used to determine(1) These differences, given this sample size, could
have reasonably occurred by chance .
(2) It would need a randomized clinical trial of at least 900 patients to assure that we could detect a 10% improvement (from 65% to 75%) in the Glasgow outcome score at three months with 90% power.

10/20/2005
IHAST2• The follow-up International, multi-center
randomized clinical trial was funded by NIH (IHAST2).
• 1000 SAH patients undergoing craniotomies for aneurysm clipping were randomized to either hypothermia or normal body temperature.
• Primary outcome measure: Glasgow Outcome Score (GOS) at 3 months
10/20/2005
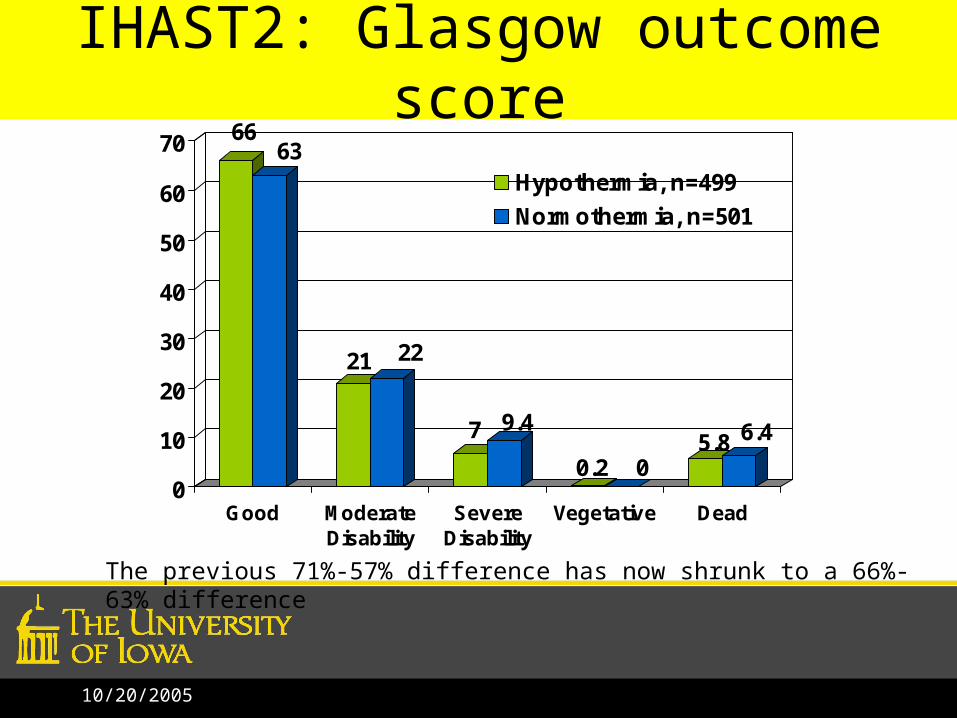
IHAST2: Glasgow outcome score66
63
21 22
7 9.4
0.2 05.8 6.4
0
10
20
30
40
50
60
70
Good ModerateDisability
SevereDisability
Vegetative Dead
Hypothermia, n=499
Normothermia, n=501
The previous 71%-57% difference has now shrunk to a 66%-63% difference

10/20/2005
IHAST2Now, is it beyond reasonable doubt that
hypothermia is working?
• This study had a large enough sample size to find a meaningful difference in “good” outcomes due to hypothermia (should it work) with high probability.*
Beyond reasonable doubt, it simply does not work as believed.
* Many other outcomes were also tested. All consistently showed no benefit.

10/20/2005
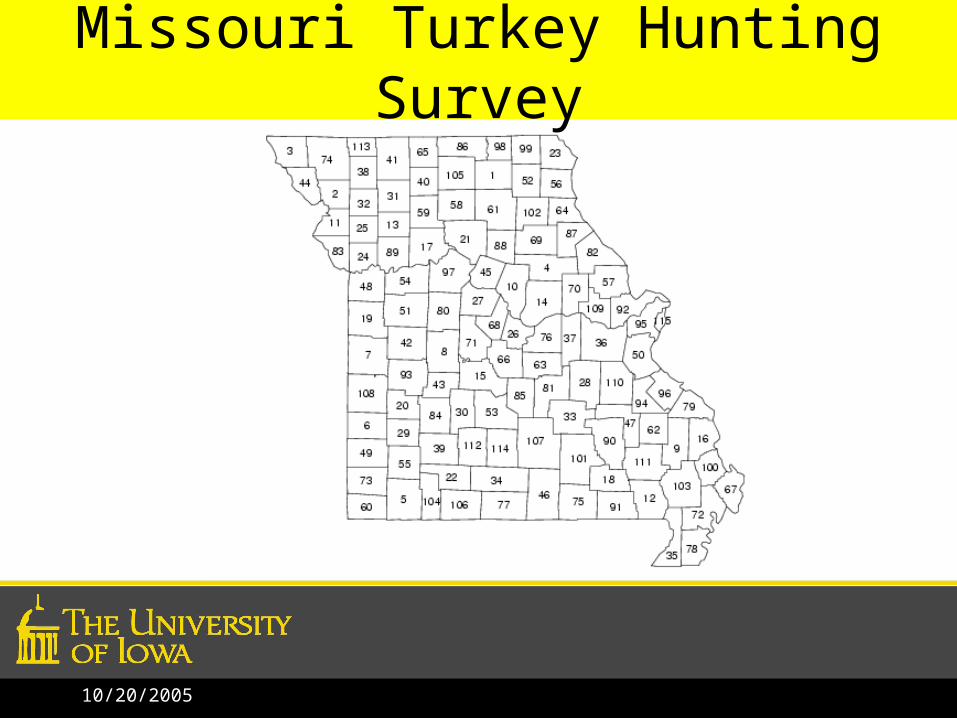
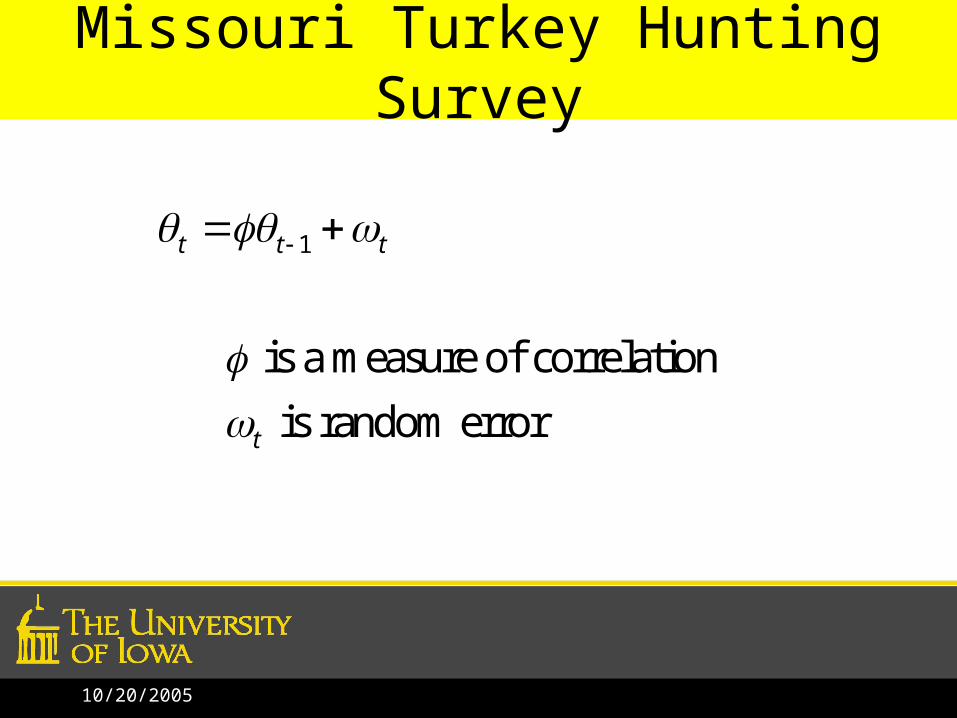
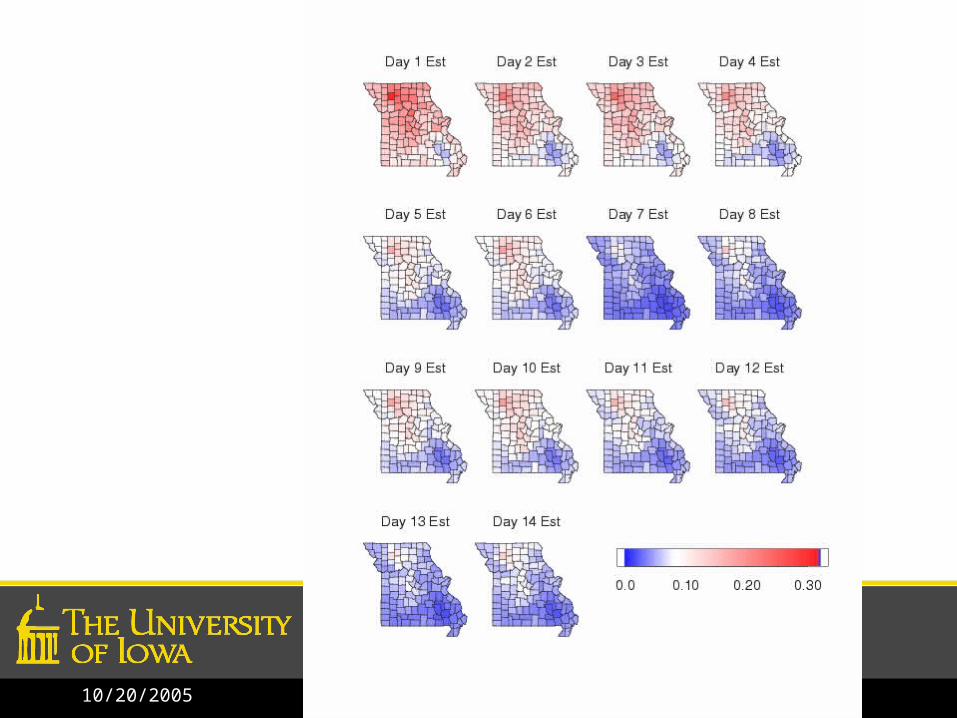
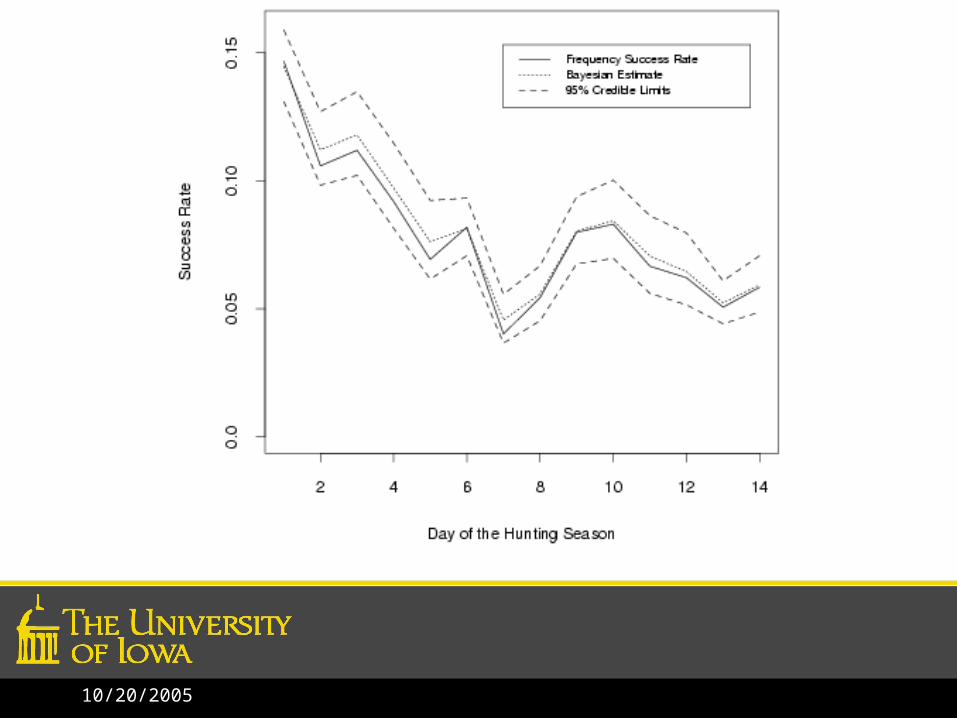
Missouri Turkey Hunting Survey
• The Missouri Department of Conservation is interested in turkey hunting success rates.
• Can we obtain an estimate of the hunting success rate in every county on every day of the hunting season even if we don’t have a sample from that county?(small area estimation)
10/20/2005
Missouri Turkey Hunting Survey
10/20/2005
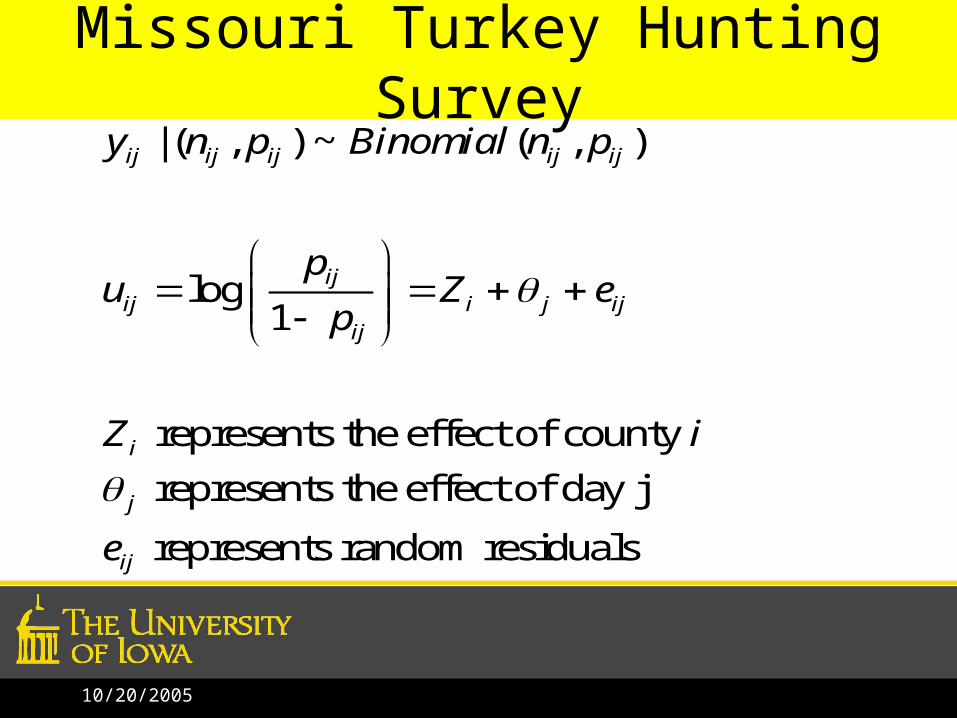
Missouri Turkey Hunting Survey| ( , ) ~ ( , )
log1
represents the effect of county
represents the effect of day j
represents random residuals
ij ij ij ij ij
ijij i j ij
ij
i
j
ij
y n p Binomial n p
pu Z e
p
Z i
e
10/20/2005
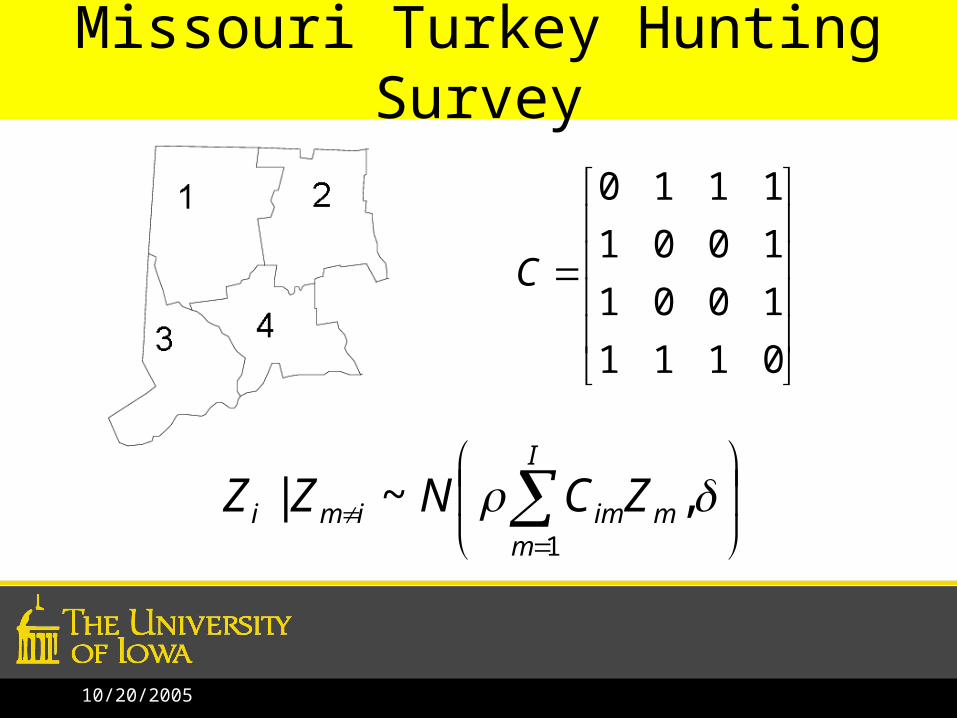
Missouri Turkey Hunting Survey
0111
1001
1001
1110
C
I
mmimimi ZCNZZ
1
,~|
10/20/2005
Missouri Turkey Hunting Survey
1
is a measure of correlation
is random error
t t t
t

10/20/2005
10/20/2005
10/20/2005

10/20/2005

10/20/2005
What do statisticians do?• Surveys
– political surveys– National Health and Nutrition Examination Survey
• Government Operations– Census Bureau– FDA
• Scientific Research– Cancer trends– Survival probability– Genetics
• Business and Industry– Pharmaceuticals
Source: http://www.amstat.org

10/20/2005
EnvironmentAgriculture,
Ecology, Forestry,Animal Populations
GovernmentCensus, Law,
National Defense
PhysicalSciences
Astronomy,Chemistry, Physics
Areas where STATISTICS
are used
Health & Medicine
Genetics, Clinical Trials,Epidemiology,Pharmacology
BusinessEconomics, Engineering,
Marketing,Computer Science
Source: http://www.amstat.org

10/20/2005
Roles of a Biostatistician• Guardian of the science.
– Help write the proposal to get this study funded.
– Maintain an unbiased perspective.
– Determine which data needed to be collected.
– Determine what methods would be used.
– Anticipate how proposed changes in the program would affect ability to make inferences and argue against them when needed.
– Develop new methods when needed.

10/20/2005
• Keeper of the Data.• Work with different state and federal agencies to obtain
data.
• Check data for recognizable errors.
• Merge data from different sources.
• Maintain and secure the project database.
• Work with others (e.g., national evaluators, statistical coordinating centers) to blend your data with other data.
Roles of a Biostatistician

10/20/2005
• Analytic Support• Investigate the data from many angles.
• Assess assumptions of proposed models.
• Fit statistical models.
• Interpret results of the models for the research team.
• Make sure that the investigators do not draw conclusions beyond what can be supported by the data.
• Author (Write up results / provide graphics.)
Roles of a Biostatistician

10/20/2005
What About Salaries?
• Annual (median) salary with 0-1.9 years of experience for
Masters PhD
- Statistician 60,000 83,000
- Male Statistician 56,500 83,000
- Female Statistician 62,000 83,000
- Assistant Professor (4 year college) 53,000
- Assistant Professor (Research) 63,000
- Pharmaceutical statistician 73,000 83,000
Source: http://www.amstat.org

10/20/2005
Life as a Graduate Student
• What do you do as a graduate student?– Classwork– Teaching assistants– Research assistants– Go to football games!

10/20/2005
Variety of scientific projects
As you can tell, people work on various different projects. The following are brief excerpts from some recent projects.

10/20/2005
Driving Simulator (NADS)
http://www.nads-sc.uiowa.edu/
A shared-use research facility operated by The University of Iowa, The NADS was created to conduct research which will help save lives, reduce the costs of vehicle crashes, and lead to better and safer vehicles, roadways, and drivers.
10/20/2005
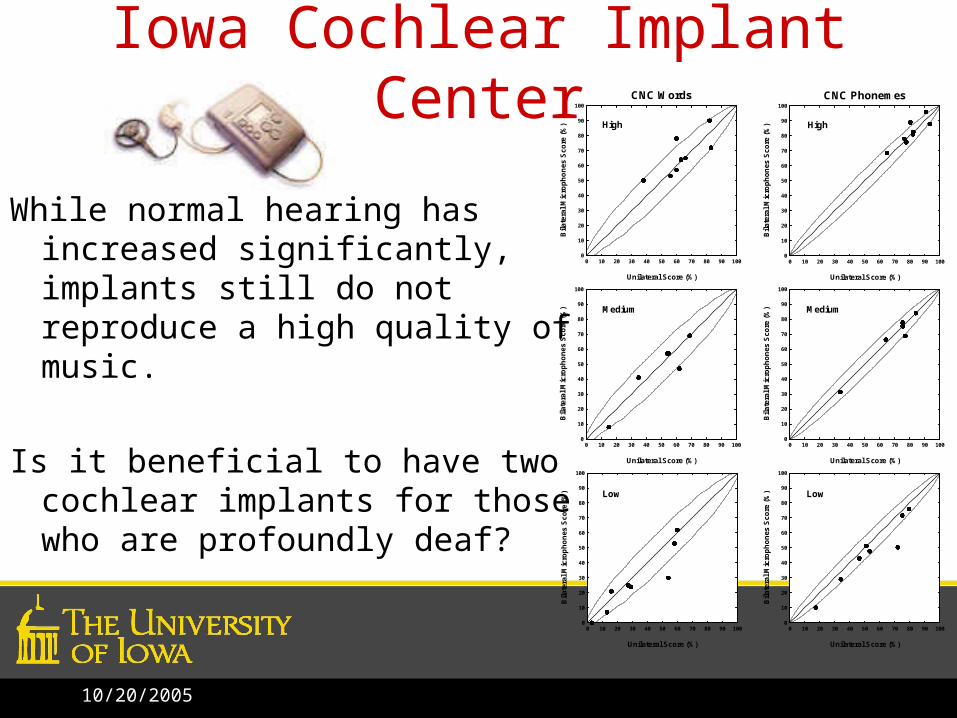
Iowa Cochlear Implant Center
While normal hearing has increased significantly, implants still do not reproduce a high quality of music.
Is it beneficial to have two cochlear implants for those who are profoundly deaf?
CNC Words
Unilateral Score (%)
0 10 20 30 40 50 60 70 80 90 100
Bil
ater
al
Mic
rop
ho
nes
Sco
re (
%)
0
10
20
30
40
50
60
70
80
90
100
Unilateral Score (%)
0 10 20 30 40 50 60 70 80 90 100
Bil
ater
al
Mic
rop
ho
nes
Sco
re (
%)
0
10
20
30
40
50
60
70
80
90
100
Unilateral Score (%)
0 10 20 30 40 50 60 70 80 90 100
Bil
ater
al
Mic
rop
ho
nes
Sco
re (
%)
0
10
20
30
40
50
60
70
80
90
100
High
Medium
Low
CNC Phonemes
Unilateral Score (%)
0 10 20 30 40 50 60 70 80 90 100
Bil
ater
al
Mic
rop
ho
nes
Sco
re (
%)
0
10
20
30
40
50
60
70
80
90
100
Unilateral Score (%)
0 10 20 30 40 50 60 70 80 90 100
Bil
ater
al
Mic
rop
ho
nes
Sco
re (
%)
0
10
20
30
40
50
60
70
80
90
100
Unilateral Score (%)
0 10 20 30 40 50 60 70 80 90 100
Bil
ater
al
Mic
rop
ho
nes
Sco
re (
%)
0
10
20
30
40
50
60
70
80
90
100
High
Medium
Low
10/20/2005
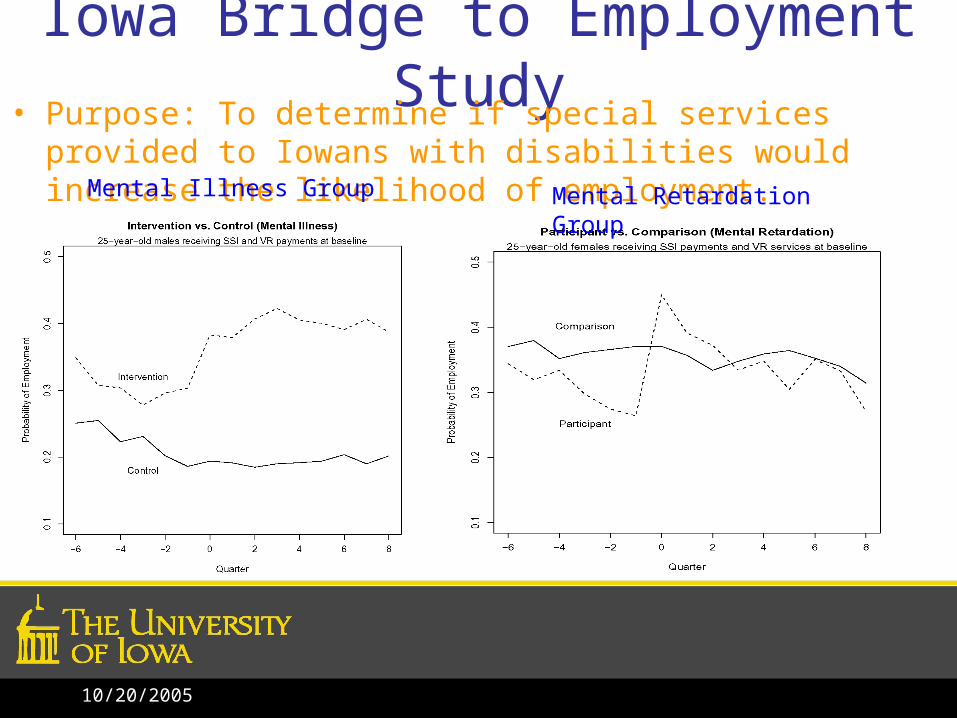
Iowa Bridge to Employment Study• Purpose: To determine if special services provided to Iowans
with disabilities would increase the likelihood of employment.Mental Retardation GroupMental Illness Group
10/20/2005
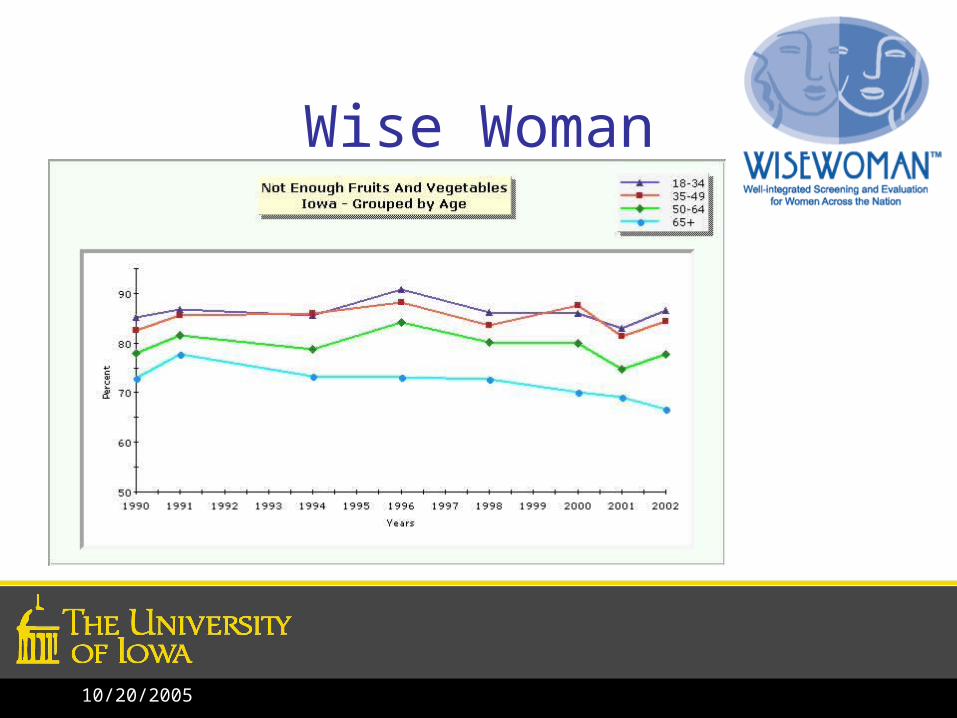
Wise Woman
10/20/2005
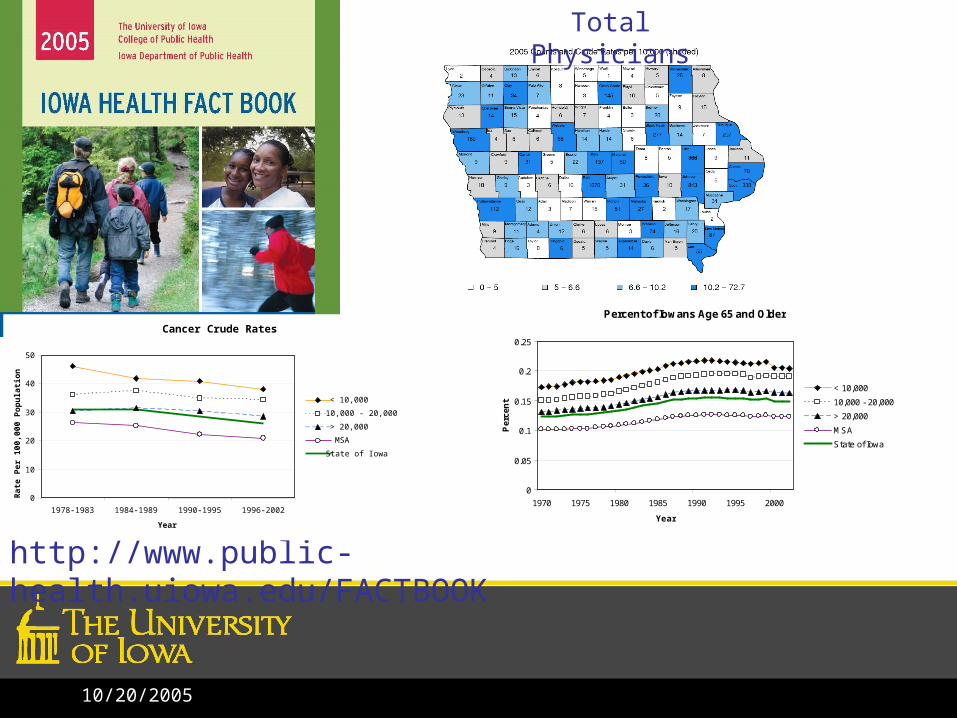
Percent of Iowans Age 65 and Older
0
0.05
0.1
0.15
0.2
0.25
1970 1975 1980 1985 1990 1995 2000
Year
Per
cen
t
< 10,000
10,000 - 20,000
> 20,000
MSA
State of Iowa
http://www.public-health.uiowa.edu/FACTBOOK
Cancer Crude Rates
0
10
20
30
40
50
1978-1983 1984-1989 1990-1995 1996-2002
Year
Ra
te P
er
100,
000
Po
pu
lati
on
< 10,000
10,000 - 20,000
> 20,000
MSA
State of Iowa
Total Physicians

10/20/2005
Holden Comprehensive Cancer Center
0 5 10 15 20 25 30
02
00
04
00
06
00
0
Time (days)
Tu
mo
r V
olu
me
(cm
3 )ControlVaccineGITR+Vaccine
Tumor growth curve estimates from a mixed linear models analysis.
Groups n Mean Tumor Size (cm3) p-value Group Comparisons
Control (1) 17 1390.2
0.0006 (1, 23)Vaccine (2) 35 692.0
GITR + Vaccine (3)
38 444.0
Group comparisons indicate differences between specific groups at the 5% level of significance.
10/20/2005
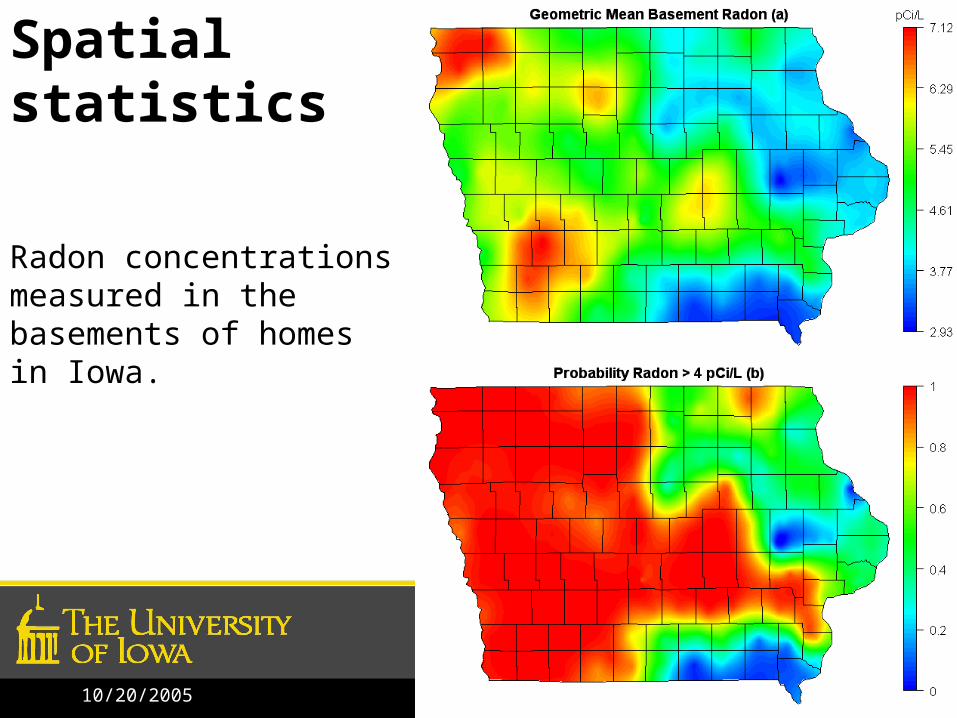
Radon concentrations measured in the basements of homes in Iowa.
Spatial statistics

10/20/2005
Thank you!
Jake OlesonCentral Collegeclass of 1997