Embed Size (px)
Citation preview

10.1177/0193841X04272555EVALUATION REVIEW / APRIL 2005Briggs / META-ANALYSIS: A CASE STUDY
META-ANALYSIS
A Case Study
DEREK C. BRIGGSUniversity of Colorado, Boulder
This article raises some questions about the usefulness of meta-analysis as a means of reviewingquantitative research in the social sciences. When a meta-analytic model for SAT coaching isused to predict results from future studies, the amount of prediction error is quite large. Interpre-tations of meta-analytic regressions and quantifications of program and study characteristicsare shown to be equivocal. The match between the assumptions of the meta-analytic model andthe data from SAT coaching studies is not good, making statistical inferences problematic.Researcher subjectivity is no less problematic in the context of a meta-analysis than in anarrative review.
Keywords: meta-analysis; literature review; SAT coaching; statistical inference
Literature reviews play a critical role in research. Through the analysisand evaluation of past research on a particular topic, the stage is set for newtheoretical and empirical contributions. Since the publication of Meta-Analysis in Social Research (Glass, McGaw, and Smith 1981) and StatisticalMethods for Meta-Analysis (Hedges and Olkin 1985) in the early 1980s, themeta-analysis has become an accepted and, in many instances, a preferredmethodological approach for the review of quantitative research studies ineducational research. A search for the keyword meta-analysis in the Educa-tional Resources Information Center (ERIC) between 1980 and 2003 turnsup well more than 1,000 citations of articles from peer-reviewed researchjournals or conference presentations. Meta-analysis has been used to reviewtopics such as the effects of rewards on intrinsic motivation, the relationshipbetween educational resources and achievement, the effectiveness of phonicsinstruction, and the effectiveness of bilingual education. In the textbookExperimental and Quasi-Experimental Design for Generalized Causal Infer-ence, the authors describe meta-analysis as “one of the most important social
87
AUTHOR’S NOTE: The author thanks David Freedman and Lorrie Shepard for helpful com-ments on earlier versions of this article.
EVALUATION REVIEW, Vol. 29 No. 2, April 2005 87-127DOI: 10.1177/0193841X04272555© 2005 Sage Publications

science developments in the second half of the 20th century” (Shadish, Cook,and Campbell 2002, 446).
The use of meta-analysis has been criticized on statistical grounds in thepast (Oakes 1986; Wachter 1988; Berk 2004; Berk and Freedman 2003).Indeed, the potential for the misuse of meta-analysis has been well recog-nized even by those who have done the most to develop it as a methodology(Hedges 1990; Kulik and Kulik 1988). A key issue, and one that I revisit here,is whether the fundamental assumptions of the meta-analytic model arelikely to hold for the data under review. The primary purpose in this article isto raise some empirically grounded questions about the usefulness of themeta-analytic approach. I will suggest that a meta-analysis is ultimately notthat much different from a systematic narrative review, but with the unfortu-nate distinction that the role of human judgment in the meta-analysis is moreeasily obscured.
This article is not a meta-meta-analysis but a case study of a specific appli-cation of meta-analysis in a review of educational research. In this article, Icritique a meta-analysis used to synthesize evidence about the effectivenessof coaching programs for the SAT. Meta-analyses are inherently difficult tocritique for two reasons: (a) the prohibitive cost of reading and reviewing allthe studies that form the basis of the meta-analysis and (b) a lack of new stud-ies available to test the validity of the meta-analytic model. Because I havegathered, read and evaluated virtually1 every published and unpublishedstudy of SAT coaching that has been the subject of previous reviews as back-ground for a different project (Briggs 2001, 2002b, 2004a, 2004b), andbecause many new studies have been conducted since the last major review ofthe SAT coaching literature, I find myself in a good position to evaluate themerits of the meta-analytic approach in this restricted context. There is nostatistical basis for generalizing the context-specific findings here to allmeta-analyses, but I believe that the sort of data examined here are typical ofthe sort found in other social science research contexts. And although thecontext and methods for a meta-analysis may vary, the basic steps of theapproach tend to be the same. In all likelihood, the issues raised in this articleare ones that any meta-analysis would need to address.
There are four principal sections to this article. In the first section, I pro-vide the necessary context for my case study. I give some background on SATcoaching studies and provide a frame of reference for the interpretation ofestimated coaching effects. I next introduce a widely cited and well-regardedmeta-analysis of SAT coaching studies conducted by Betsy Jane Becker in1990. In the second section, I evaluate Becker’s meta-analytic regressionmodels by using them to predict the results of 24 new studies that were notincluded in the 1990 review. In the third section, I analyze the way that
88 EVALUATION REVIEW / APRIL 2005

studies have been quantified in Becker’s meta-analysis. I present the funda-mental assumptions behind Becker’s meta-analytic model and consider theplausibility of these assumptions relative to the data found in the underlyingstudies. In the fourth section, I compare the conclusions reached by Becker’smeta-analysis to those one might reach after conducting a systematic narrativereview.
SAT COACHING AND META ANALYSIS
BACKGROUND ON SAT COACHING
Coaching can be defined as systematic test preparation for a student orgroup of students that involves the following: content review, item drill andpractice, and an emphasis on specific test-taking strategies and general testwiseness. (For more detailed discussions, see Pike 1978; Anastasi 1981;Cole 1982; Messick 1982; Bond 1989). Coaching is commonly offered forthe SAT, one of the most widely known college admissions tests in the UnitedStates. The SAT has traditionally consisted of two sections administered overtwo and a half hours, with items that measure, respectively, verbal (SAT-V)and mathematical (SAT-M) reasoning ability.2 The SAT is designed to mea-sures reasoning abilities that are developed gradually over the years of pri-mary and secondary schooling that precede college (Messick 1980; Anastasi1981). Companies such as Kaplan and The Princeton Review claim they canimprove a student’s SAT performance through coaching programs that areshort term in nature.
The SAT is reported on a scale ranging from 200 to 800 points per test sec-tion. Because the SAT scale has no absolute meaning, the best way to inter-pret the effect size of a coaching treatment is relative to the standard deviation(SD) of each test section, which is about 100 points. Hence, a 10-point coach-ing effect on one section of the SAT would be equivalent to an effect size of0.1 of an SD, a relatively small effect. A coaching effect of 60 points, on theother hand, is equivalent to an effect size of 0.6 of an SD, a relatively largeeffect.
Between 1953 and 1993, there were about 30 reports on the effectivenessof SAT coaching. Twelve reviews of coaching reports were written between1978 and 1993. Nine of them are narrative reviews (Pike 1978; Messick1980; Slack and Porter 1980; Anastasi 1981; Messick and Jungeblut 1981;Cole 1982; Messick 1982; Bond 1989; Powers 1993). The other 3 reviews aremeta-analyses (DerSimonian and Laird 1983; Kulik, Bangert-Drowns, and
Briggs / META-ANALYSIS: A CASE STUDY 89

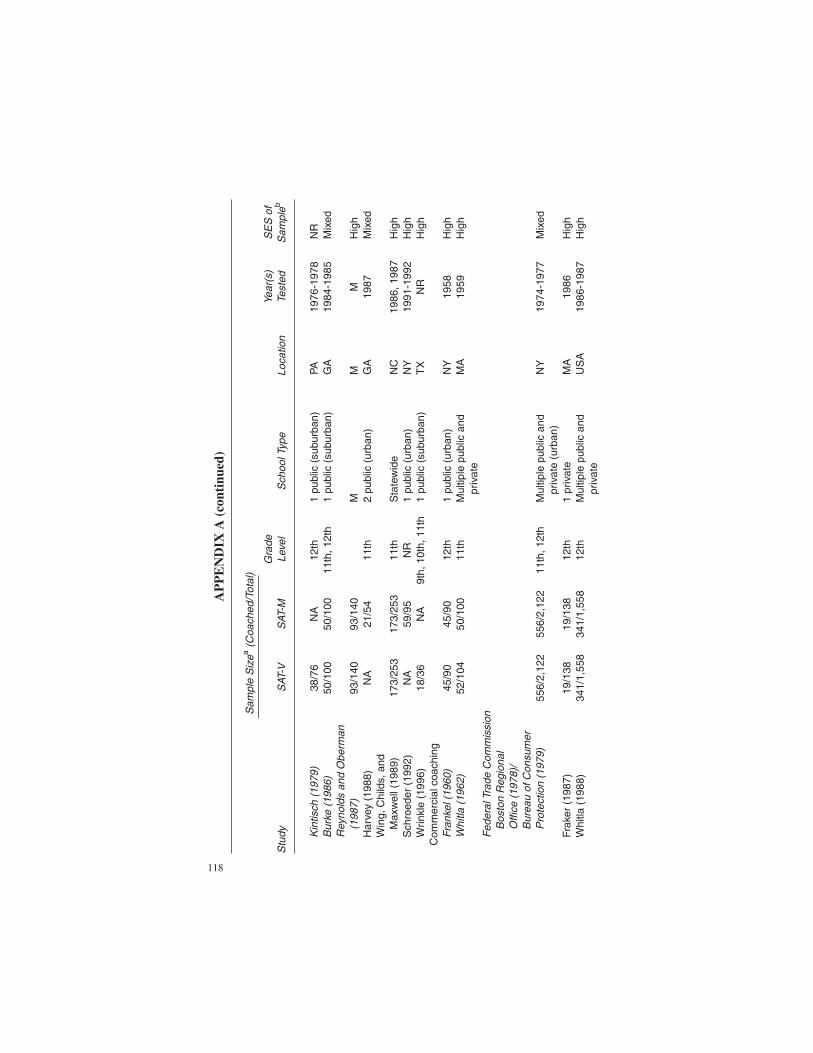
Kulik 1984; Becker 1990). Becker’s (1990) review stands out from thecrowd. This review involved the synthesis of 25 reports on SAT coachingdrawn from academic journals, doctoral dissertations, institutional reports,and conference papers. (Key characteristics of the reports that form the basisfor Becker’s review, as well as 16 others that were not, are summarized inAppendix A.) Becker’s encompassing retrieval of coaching reports waspaired with state-of-the-art meta-analytic techniques. Since its publication,Becker’s review has been cited in more than 20 other published articles onrelated topics.
AN OVERVIEW OF BECKER’S META-ANALYSISOF SAT COACHING STUDIES
Meta-analysis starts with a collection of summary data from a series ofstudies, each of which is considered a replication of the same basic experi-ment. As defined here, a study constitutes any single estimate of the effect ofcoaching on either the SAT-M or SAT-V. Multiple studies (usually at leasttwo) are typically found within what I will term a report on SAT coaching. Iwill index reports with the subscript h. Within each report h, I find one ormore studies, indexed by the subscript i. In Becker’s 1990 review, there are atotal of 25 reports that contain 70 studies. Students are indexed by the sub-script j. The treatment of interest is whether student j gets coached after tak-ing the SAT a first time. Let X hij
C andYhijC represent the SAT scores for coached
student j in study i within report h. This student takes the SAT twice andreceives coaching in between testings (“C”). On the other hand, let X hij
U andYhij
U represent the SAT scores for uncoached student j in study i within reporth. This student takes the SAT twice but never receives coaching (“U”).
The outcome variable in the meta-analysis is the effect size of the coach-ing treatment. To calculate this, Becker first computes the standardized meanchange in SAT scores for coached and uncoached students. For each group,the standardized mean change is simply the difference between meanposttest and pretest SAT scores divided by the posttest standard deviation:
( )g
Y X
SD YhiC hi
ChiC
Chi
=−
.(1)
( )g
Y X
SD YhiU hi
UhiU
Uhi
=−
.(2)
90 EVALUATION REVIEW / APRIL 2005

From this, Becker computes the effect size estimate3
�∆hi hiC
hiUg g= − . (3)
Using this approach, one way to get an overall estimate of the coaching ef-fect would be to calculate a weighted average of �∆ hi . I refer to this as ModelA. In Becker’s meta-analysis, three other regression models are to adjust ef-fect size estimates for differences across studies. I refer to these as Models B,C, and D. Below is a summary of the central features of these models. (Thespecific variables used in Models C and D are presented in more detail later.)
Model A: No predictor variablesModel B: One predictor variable indicating whether the study was based on math
or verbal SAT scoresModel C: Set of predictor variables intended to characterize the nature of coaching
in the studyModel D: Set of predictor variables intended to characterize the design of the
study
TESTING BECKER’S SAT COACHINGMETA-ANALYSIS WITH NEW STUDIES
A good way to test the usefulness of a model is to attempt to validate itwith new data. Another 16 coaching reports have come to light sinceBecker’s meta-analysis was published.4 I found these reports by searchingthrough the Web, academic journals, and the University Microfilms index ofdissertation abstracts using combinations of the keywords SAT, coaching,and test preparation. For narrative summaries of these reports, see Briggs(2002a). From each of these new reports, one can get one or more estimatesof a coaching effect from studies within the report. Each of these studies islisted in the rows of Table 1. I coded each of these studies using the same vari-ables Becker created for her meta-analysis (see Appendixes B and C fordetails). The last four columns of Table 1 give the coaching effect predictedfor each study as a function of its coaching content and design characteristics,using the specifications represented by Models A through D.
Table 2 summarizes the prediction error for Models A through D using theroot mean square error (RMSE). The lowest RMSE for studies estimatingcoaching effects for either section of the SAT is about 14 points (Model A),the highest is about 29 (Model D). These prediction errors are about the same
Briggs / META-ANALYSIS: A CASE STUDY 91

92
TAB
LE
1:
Ob
serv
ed a
nd
Pre
dic
ted
Eff
ects
Fro
m N
ew C
oac
hin
g S
tud
ies
Pre
dict
ed C
oach
ing
Effe
ct F
rom
Bec
ker
(199
0)
Rep
ort
Stu
dyC
oach
ing
Effe
ctM
odel
AM
odel
BM
odel
CM
odel
D
Hop
mei
er (
1984
)S
AT-V
5730
11.6
–12.
924
.5S
AT-M
3730
25.5
–1.2
35.8
Frak
er (
1987
)S
AT-V
–16
3011
.61.
90.
8S
AT-M
1630
25.5
13.6
12.1
Har
vey
(198
8)S
AT-M
2130
25.5
–14.
58.
1W
hitla
(19
88)
SAT
-V11
3011
.62.
70.
5S
AT-M
1630
25.5
14.4
11.8
Sne
deco
r (1
989)
SAT
-V0
3011
.62.
7–0
.2S
AT-M
1530
25.5
14.4
11.1
Win
g, C
hild
s, a
nd M
axw
ell (
1989
)S
AT-V
430
11.6
–0.7
–0.6
SAT
-M33
3025
.511
10.7
Sm
yth
(199
0)S
AT-V
930
11.6
2.7
–0.9
SAT
-M18
3025
.514
.410
.4S
haw
(19
92)
SAT
-V21
3011
.6–2
7.3
17.8
SAT
-M6
3025
.5–1
5.6
29.1
Sch
roed
er (
1992
)S
AT-M
4630
25.5
–3.8
–11
Hol
mes
and
Kef
fer
(199
5)S
AT-V
3930
11.6
–26.
215
.2W
rinkl
e (1
996)
SAT
-V31
3011
.644
.727
.8P
ower
s an
d R
ock
(199
9)S
AT-V
630
11.6
2.7
–23.
7S
AT-M
1830
25.5
14.4
–12.
4B
riggs
(20
01)
SAT
-V11
3011
.62.
7–5
.3S
AT-M
1930
25.5
14.4
6K
apla
n (2
002)
SAT
-M (
Year
1)
3730
25.5
8.6
–7.5
SAT
-M (
Year
2)
5930
25.5
12.1
–4.5
NO
TE
:Mod
el A
= C
olum
n 1
in B
ecke
r’s T
able
7;M
odel
B =
Col
umn
2;M
odel
C =
Col
umn
3;M
odel
D =
Col
umn
4.

magnitude as most of the coaching effects estimated in individual studies. Itseems that Becker’s meta-analysis does poorly when it comes to predictingthe results of new studies.5 To make this more concrete, when Model D isused to predict the results of new coaching studies, one must expect predic-tions of SAT-V coaching effects to be off on average by +/–17 points. Predic-tions of SAT-M effects, using the same model, will be off on average by +/–29points. Note that the RMSE does not decrease once treatment and designcharacteristics of the studies are controlled. This is cause for concern,because the reason these sorts of regression adjustments are made is to betterpredict the effect of coaching. The next section shows why such adjustmentsfall short.
INTERPRETING META-ANALYTICREGRESSIONS AND QUANTIFYING STUDIES
INTERPRETING META-ANALYTIC REGRESSIONS
Table 3 presents the results from Models A through D, estimated usinggeneralized least squares. These results correspond to Table 7 of Becker’s1990 review (p. 393). For ease of interpretation, I have translated the esti-mated regression coefficients from effect size units back into SAT scores. (Iassume that the relevant SD for each section of the SAT is 100 points.)
Models C and D include predictor variables meant to control for differ-ences in coaching studies. In Model C, the emphasis is on controlling for dif-ferences in coaching programs. The model includes predictor variables thatindicate whether coaching emphasized verbal instruction, math instruction,alpha instruction,6 item practice, test practice, test-taking skills, other prepa-ratory activities, homework, and computer instruction. Model C also
Briggs / META-ANALYSIS: A CASE STUDY 93
TABLE 2: Average Prediction Error From Becker’s (1990) Meta-Analytic Models
Root Mean Square Error forPredicted Coaching Effect
Meta-Analytic Model SAT-V SAT-M
A: No Predictors 24.0 13.6B: Math/Verbal Difference 21.6 17.3C: Coaching Content 27.7 28.5D: Study Design 17.4 28.6
includes dummy variables that indicate whether a study involved a controlgroup of uncoached students (“Control Group”), whether the control groupderived from a wait-list of students interested in receiving the coaching treat-ment (“Wait-List Control”), and whether the control group received an alter-nate form of coaching (“Alternate Control”).7 The only continuous variablemeasures the duration of the coaching treatment in hours.
In Model D, the emphasis is on controlling for differences in studydesigns. However, there is overlap between the variables specified here andthe variables specified in Model C. Among the new variables are predictorsindicating the year the SAT coaching report was completed and whether the
94 EVALUATION REVIEW / APRIL 2005
TABLE 3: Becker’s (1990) Meta-Analytic Regressions for 70 Coaching StudyOutcomes
Model A Model B Model C Model D
No Math/Verbal Coaching StudyPredictor Predictors Difference Content Design
Grand mean 30.0* 25.5* –38.8* 40.9*SAT-M 11.6* 11.7 11.3*Control group –2.6 –1.0Duration 0.7* 0.6*Verbal instruction 16.3* 20.2*Math instruction –4.1Alpha instruction 0.8Item practice 23.5*Test practice –2.0Test-taking skills –0.9Other activities –3.4Homework 0.0Computer instruction –7.5Wait-list control 8.3Alternative control –6.9Year –0.7*Publication type 0.4Use of matching 1.5Use of randomization 23.8*ETS sponsorship –19.8Selectivity –3.3Voluntariness –0.4
SOURCE: Becker (1990), Table 7.NOTE:Effect sizes have been placed on the SAT scale assuming population SDs of 100points.*Slope coefficients for predictors are statistically significant at α = .05.

report had been published, made use of random assignment to treatment con-ditions, employed statistical matching, and was sponsored by EducationalTesting Service (ETS). Ordinal variables ranging in values from 0 to 2 wereincluded for sample selectivity (“Selectivity”) and motivation (“Voluntari-ness”). For Selectivity, 0 represents a study sample comprised of studentswith low academic ability, 1 represents a sample of students with mixed aca-demic ability, and 2 represents a sample of students with high academic abil-ity. For Voluntariness, 0 represents compulsory participation in a coachingprogram, 1 represents participation in a coaching program possible with littlecost, and 2 represents participation in a coaching program that is voluntary.Studies with higher values on the Voluntariness variable are those wherecoached students are better motivated.
In Model A, no predictor variables are included in the regression. Thecoefficient for the grand mean, 30, is the weighted average of coachingeffects across all studies, for both SAT-V and SAT-M. The total effect ofcoaching on the SAT is predicted to be 60 points. In Model B, a dummy vari-able is included for SAT-M. The results suggest that the SAT-V coachingeffect is about 26 points, whereas the SAT-M effect is about 37 points. Again,the total effect of coaching appears to be about 60 points.
According to Model C, coaching duration, verbal instruction, and itempractice are significant predictors of effect size. Imagine that there are twocoaching studies that only differ on these three variables. The first studyinvolves a coaching program that is 10 hours long with no verbal instructionor item practice. By contrast, a second coaching study involves a coachingprogram 20 hours long with verbal instruction and item practice. UsingModel C, the predicted SAT-V and SAT-M coaching effects for the secondcoaching study would be 46 and 47 points higher than those predicted for thefirst coaching study. Should one conclude that coaching of longer durationwith verbal instruction and item practice is demonstrably more effective thancoaching of shorter duration without verbal instruction and item practice?According to the regression model, the answer is yes. However, if one looksmore closely at the underlying data, it turns out that almost all coaching pro-grams under review involve item practice and verbal instruction. There are 70studies represented in Table 3. Of these 70 studies, only 2 come from pro-grams that did not involve item practice; only 6 come from programs that didnot involve verbal instruction. Only one study (Coffman and Parry 1967) hadneither verbal instruction nor item practice. It is this last study that is drivingthe results of the regression model. The treatment in the Coffman and Parry(1967) study was in fact a speed-reading course offered to university fresh-men, making it a remarkably atypical SAT coaching study to drive theseresults.
Briggs / META-ANALYSIS: A CASE STUDY 95
Model D is meant to control for differences in study designs. According toModel D, all else held constant, the predicted coaching effect on either sec-tion of the SAT is 24 points higher for studies with randomized experimentaldesigns than for studies with nonrandomized designs. There are five reportswith randomized designs in Becker’s review. The estimated coaching effectsin these reports are listed in Table 4. By inspection, the estimated coachingeffects are not especially large, with the exception of Zuman (1988). Themedian estimated SAT-M and SAT-V coaching effects for studies with ran-domized designs are only 12 and 14 points. There appear to be substantial dif-ferences between these observed coaching effects and the effects predicted byBecker’s Model D.
Becker (1990) explains this discrepancy as follows:
Although randomized studies showed smaller raw (absolute) effects, they had other char-acteristics that were more generally associated with smaller effects (such as simply thepresence of a control group). Once adjustments for these other characteristics were made,the randomized studies had larger effects than would have been expected. (P. 396)
The sort of adjustment being referenced is accomplished in meta-analysis byincluding the sorts of “control” variables found in Model D. To see whyadjustments might be necessary, one can compare the average characteristicsfor randomized and nonrandomized studies. These characteristics are summa-rized in Table 5.
As Table 5 indicates, the characteristics of randomized studies are consid-erably different from those of nonrandomized studies. Randomized studiesare much more likely to be published and to be sponsored by ETS. Nonran-domized studies involve coaching that is more than twice as long in durationas in randomized studies. They are typically not sponsored by ETS. Thesedifferences in the characteristics of the two groups of studies may serve toconfound any comparisons between the two, so it might seem sensible tohold these characteristics constant. Unfortunately, it is rather easy to losesight of the empirical assumptions required when we hold confounding vari-ables constant. Figure 1 brings this into sharper relief.
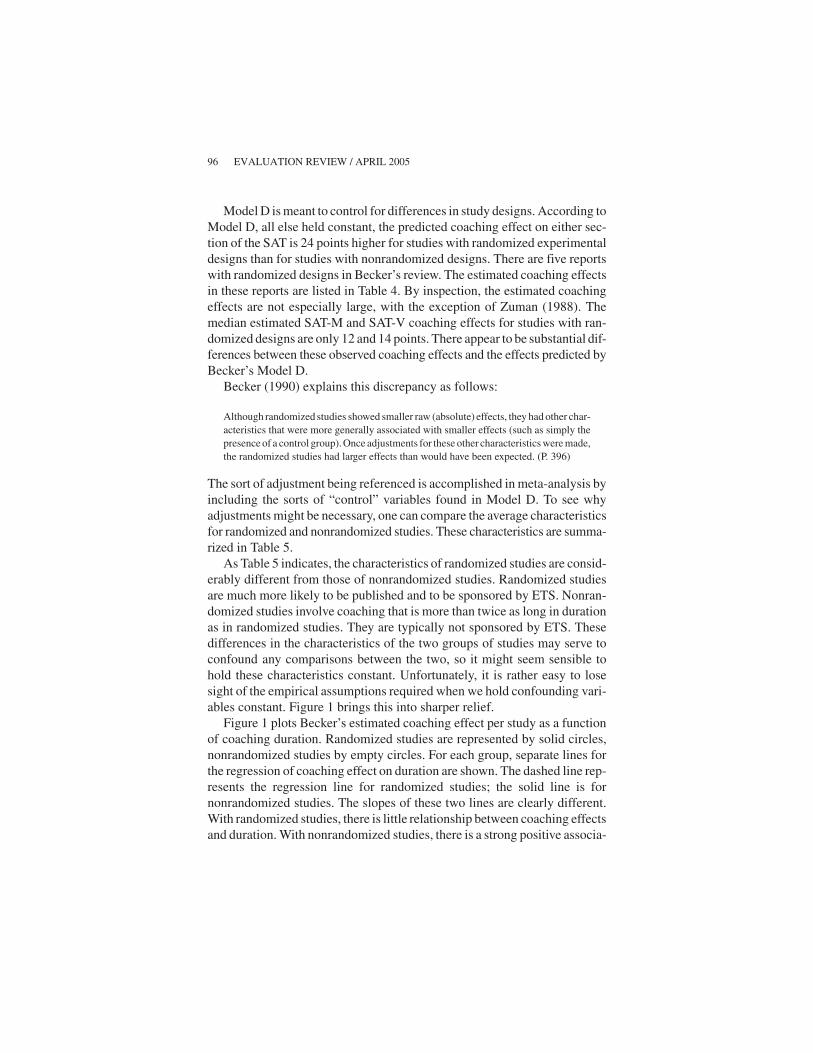
Figure 1 plots Becker’s estimated coaching effect per study as a functionof coaching duration. Randomized studies are represented by solid circles,nonrandomized studies by empty circles. For each group, separate lines forthe regression of coaching effect on duration are shown. The dashed line rep-resents the regression line for randomized studies; the solid line is fornonrandomized studies. The slopes of these two lines are clearly different.With randomized studies, there is little relationship between coaching effectsand duration. With nonrandomized studies, there is a strong positive associa-
96 EVALUATION REVIEW / APRIL 2005

tion.8 The grand mean for coaching duration among all studies is about 30hours (represented in Figure 1 by a vertical dashed line). With the exceptionof one study, the duration of coaching for randomized studies is less than 30hours. The regression adjustment of Model D is based on the assumption
Briggs / META-ANALYSIS: A CASE STUDY 97
TABLE 4: Estimated Coaching Effects in Randomized Studies
Report and Study SAT-M SAT-V
Alderman and Powers (1980)School A 22School B 9School C 14School D 14School E –1School F 14School G 18School H 1
Evans and Pike (1973)Group A 12Group B 25Group C 11
Laschewer (1985) 8 0Roberts and Openheim (1966)
School A 17School B 12
Zuman (1988) 51 14Median effect estimate 12 14
TABLE 5: Design Characteristics for Randomized and Nonrandomized Coach-ing Studies
Randomized NonrandomizedDesign Characteristic Studies Studies
Control group 100% 70%Mean duration 15.6 hours 36.2 hoursVerbal instruction 65% 96%Mean year study released 1978 1974Published 70% 22%Matching 0% 22%Educational Testing Service sponsorship 80% 38%Selectivity (0-2) 1.15 1.44Voluntariness (0-2) 1.75 1.34Number of studies 20 50

that, once other design characteristics are held constant, the two regressionlines in Figure 1 will be parallel, with the line for the randomized grouphigher than that of the nonrandomized group. The adjustment in Model Dwill fall short if there is an interaction between duration and study design, andFigure 1 suggests that this is the case. The problem here is that there is essen-tially no data to compare the coaching effects for randomized and nonran-domized studies once duration goes beyond 25 hours. To the extent that sucha comparison can be controlled using just the main effect of duration, it isbeing made on the basis of extrapolating the regression line through imagi-nary data. These sorts of extrapolations become even more extreme as regres-sion adjustments become multivariate (i.e., controlling for all the variableslisted in Table 3). The specified model also assumes that the effect of coach-ing is linearly related to duration. However, one of the principal contributionsof a review by Messick and Jungeblut (1981) was to demonstrate that therelationship is nonlinear, a finding consistent with Figure 1. All this helpsexplain why the predicted results of Model D are so at odds with what isactually observed in coaching studies.
98 EVALUATION REVIEW / APRIL 2005
120100806040200
100
80
60
40
20
0
-20
-40
Coa
chin
g E
ffec
t (SA
T p
oint
s)
Coaching Duration (hours)
Random Design?
YesRsq = 0.0089
NoRsq = 0.3705
Figure 1: Coaching Effects by Duration for Randomized and NonrandomizedDesigns

The specifications of Becker’s meta-analytic models raise issues germaneto the use of meta-analysis in other contexts. I summarize three importantones below:
1. Choice of variables included and excluded from the model. Are the variablesspecified in meta-analytic regression models included for substantive or sta-tistical concerns? In the example here, it seems clear that statistical, ratherthan substantive, concerns are the driving force behind model selection.
2. Bias due to omitted variables and errors in variables. It is highly likely thatthe estimated coefficients for meta-analytic regression models will be biaseddue to both omitted variables that confound the observed partial associationsand variables that have been poorly measured. If the estimated coefficients arebiased, interpretations based upon them become dubious.
3. Interactions. Meta-analytic regressions are typically specified withoutincluding interactions terms. For example, none of the models in Becker’smeta-analysis take into account probable interactions between treatment andstudy characteristics. It is precisely these sorts of complicated interactionsthat make SAT coaching studies so difficult to summarize quantitatively.
Ultimately, the answers to these sorts of questions can only be settled byrelying on the judgment of the researcher. It seems to me that we delude our-selves if we think that researcher subjectivity is any less of a threat to the find-ings from a meta-analysis than it is to the findings of the narrative literaturereview. In the next section, I provide examples of subjective decisions thatinfluenced the findings from Becker’s meta-analysis.
QUANTIFYING STUDIES IN META-ANALYSIS
Missing important details: The Federal Trade Commission (FTC) report.The findings from a meta-analysis depend upon how the meta-analystdecides to quantify studies under review. These decisions range from the wayeffect sizes are calculated, and sometimes imputed, to the way that treatmentand design characteristics are coded. This process is subjective and mistakesare easily made. By way of illustration, I will discuss the FTC report. In 1976,the FTC initiated a study of commercial coaching companies. The FTC sub-poenaed enrollment data for courses at three coaching companies in the NewYork area between 1975 and 1977. PSAT9 and SAT scores for these studentswere subpoenaed from the College Board. FTC staff selected a control groupof SAT test-takers at random from high schools in the same geographic areas.Demographic and academic background characteristics for coached anduncoached students were taken from the Student Descriptive Questionnaire,
Briggs / META-ANALYSIS: A CASE STUDY 99

filled out by students before they take the SAT. Coaching at Company A con-sisted of a 10-week course with 4 hours of class per week split between prep-aration for the SAT-V and SAT-M. At Company B. coaching was shorter induration, spanning 24 hours of classroom instruction on both sections of thetest. Coaching at Company C was not analyzed by the FTC because of thesmall number of students involved.
The initial report on the FTC study was released as a staff memorandumby the FTC’s Boston Regional Office (1978). Although this memo reportedSAT-V and SAT-M coaching effects at Company A as large as 55 and 40points, it was strongly criticized by the central administration of the FTC onthe basis of flaws in the data analysis. The central administration suspectedthat the estimated coaching effects were biased. Coaching effects had beenestimated by comparing coached and uncoached students that were, on aver-age, not equivalent with respect to variables such as socioeconomic statusand academic background.
The data were subsequently reanalyzed by the FTC’s Bureau of Con-sumer Protection (1979), and this reanalysis was later published bySesnowitz, Bernhardt, and Knain (1982). Coaching effects were reestimatedfor Companies A and B using linear regression models, where academicbackground, demographic characteristics, and test-taking experience wereheld constant. Coaching had statistically significant SAT-V and SAT-Meffects of 30 points per section for Company A but small and statisticallyinsignificant effects for Company B.
The Bureau of Consumer Protection’s (BCP’s) reanalysis of the FTC datawas subject to further critique. ETS researchers joined the fray with two dif-ferent statistical analyses (Rock 1980; Stroud 1980). Stroud (1980) used alarger set of covariates, made adjustments for missing data, and allowed forinteraction effects between coaching and other variables. Nonetheless, Stroud’sbasic findings supported those of the BCP. Rock (1980) focused on the BCPfinding that coaching by Company A was as effective for the SAT-V as it wasfor the SAT-M. Rock was skeptical because previous studies had suggestedthe SAT-M was more susceptible to coaching than the SAT-V (Dyer 1953;Dear 1958; Evans and Pike 1973). This seemed intuitively plausible becausethe SAT-M had closer ties to the typical high school curriculum. The BCPestimates had been made under the assumption that after controlling forcovariates, the coaching effect could be calculated as the difference in rates oflearning between coached and uncoached students. Rock posed a question.Suppose coached students were more motivated and academically able.Would they learn faster than uncoached students, even without coaching? Ifstudents who get coached are simply faster learners, the effect estimated inthe FTC study would be too high. Rock’s analysis considered students who
100 EVALUATION REVIEW / APRIL 2005

took the PSAT once and the SAT twice but who received coaching after tak-ing the SAT for the first time. After calculating PSAT-V to SAT-V gains,Rock found evidence that the SAT-V scores of the “to be coached” studentswere already growing at a significantly faster rate than those of control stu-dents. A similar pattern was not found for SAT-M scores. Taking thesegrowth rates into account, Rock estimated Company A’s SAT-V coachingeffect as 17 points. No such adjustment was proposed for the SAT-M coach-ing effect.
The FTC investigation was a landmark event. It was by far the largestcoaching study to be conducted, with total samples of 556 coached and 1,566uncoached students. It was the first study to focus extensively on the effectsof commercial coaching programs. It was the first case of multiple research-ers employing a variety of statistical approaches with the hope of reducingbias in estimated effects. It was one of the first controlled studies to suggestsizeable effects from a coaching program (Company A).
These sorts of fascinating details are lost in Becker’s meta-analysis. More-over, some of the coding seems to be wrong. The FTC report is coded asunpublished, suggesting a report of lower quality that has “not undergone thereview process typical of most academic journals” (Becker 1990, 397). Butthis report was subsequently published in an academic journal (Sesnowitz,Bernhardt, and Knain 1982). And it is the most peer-reviewed analysis in thehistory of SAT coaching reports. In addition, only data from Company A isincluded in Becker’s meta-analysis.
Calculating effect sizes for meta-analytic regressions. In meta-analysis,the decision of how to compute comparable effect sizes across studies isoften a subjective one. There are three key issues here. First, whetheradjusted or unadjusted effect sizes should be computed. Second, how effectsizes should be computed when means and standard deviations are notreported in primary studies. Third, how effect sizes should be computed forstudies with no control groups. Below I examine how these issues are dealtwith in Becker’s meta-analysis.
The effect sizes Becker calculates do not take into account any statisticaladjustments. The effect is simply the mean difference in SAT score changesbetween coached and uncoached groups. But when comparisons between thetwo groups are confounded by omitted variables, researchers are likely tomake statistical adjustments to their effect estimates in an attempt to take thissource of bias into account.10 In fact, three different SAT-V coaching effectswere estimated for the FTC study of Company A. The FTC Boston RegionalOffice (1978) estimate was 55 points. The adjusted estimate from the FTCBCP (1979) and Stroud (1980) reanalysis was 30 points. The adjusted
Briggs / META-ANALYSIS: A CASE STUDY 101

estimate in the reanalysis by Rock (1980) was 17 points. Which effect esti-mate should be used in the meta-analysis? Becker’s analysis uses the unad-justed 55-point estimate, but a different meta-analyst might make an equallycompelling case for using the 17-point estimate.
Becker’s calculation of effect sizes requires that for each coaching studywithin a report, one has the mean and standard deviation of SAT scores forboth coached and uncoached groups (recall Equations 1 and 2). A number ofcoaching studies do not report these sorts of descriptive statistics. In suchcases, the descriptive statistics have been estimated by Becker. For example,in the coaching study by Kintisch (1979), standard deviations are notreported. They are estimated from the data as a function of the observed rangeof SAT scores and a test-retest correlation provided by ETS. A similar sort ofstrategy is adopted for other studies that fail to report the descriptive statisticsnecessary to calculate effect size measures. A different meta-analyst, ofcourse, might employ a different strategy for estimating descriptive statistics.
Effect sizes must also be computed for studies that do not include controlgroups. In Becker’s meta-analysis, there are five reports with no controlgroup (Marron 1965; Pallone 1961; Coffman and Parry 1967; Coffin 1987;Johnson 1984). These reports provide 13 different measures of mean SATscore changes for coached students (ghi
C ), but no comparable measures foruncoached students (ghi
U ). It would seem that for 13 of the 70 studies underreview, there is no available measure for coaching effect size. Instead, forthese studies estimates of ghi
U were imputed by Becker as a weighted averagefrom all other uncontrolled coaching studies. It is worth noting that 11 of the13 studies with no control groups derive from three reports conductedbetween 1960 and 1967 on special samples of students (Marron 1965;Pallone 1961; Coffman and Parry 1967):
• Pallone (1961) used a sample of boys from a private college preparatory highschool in Washington, D.C., including a number of high school graduates com-pleting a year of post-high-school study to prepare for entrance into U.S. gov-ernment academies.
• Marron’s (1965) sample consisted of male students at 10 well-known prepara-tory schools that specialized in preparing high school seniors and graduates foradmission to service academies and selective colleges.
• Coffman and Parry (1967) used a small sample of students already enrolled in apublic university.
Is the imputation of ghiU for these samples a plausible procedure? Consider
two of the largest reports that serve as sources of data for the imputation.Alderman and Powers (1980) and FTC Boston Regional Office (1978)
102 EVALUATION REVIEW / APRIL 2005

involved samples of both private and public, male and female high schoolstudents. So in effect, for the imputation of ghi
U in the studies missing controlgroups, one is taking the score change in two SAT testings for Jennifer Smith,a 16-year-old student enrolled in a public New York high school in 1978, andsubstituting this for the unobserved score change of Alfred Buckley III, an18-year-old student enrolled in a private Washington, D.C., prep school in1959.
Coding predictor variables for meta-analytic regressions. The coding ofvariables that measure treatment characteristics and study quality is probablythe most controversial stage of any meta-analysis. As Becker (1990) noted indescribing the limitations of her meta-analysis,
Many of the values of important predictors could not be determined from the reports ofcoaching studies. Duration was not explicitly reported in 9 of 23 reports. . . . Conse-quently, the measures of instructional activities and emphases (e.g., alpha instruction) inthis review are, at best, crude indicators of the content of the coaching interventions. (P.403)
This seems like a fair assessment. Coaching studies typically give sparsedetail about the instructional nature of the treatment. But when the indicatorsare crude, the likelihood for coding errors is high. Is it sensible to use thesesorts of indicators to build a statistical model?
Even aspects of study quality that appear straightforward to code mayraise further questions about model specification. Coding a study with adummy variable for use of randomization may not seem controversial. Butmany randomized studies lose subjects through attrition. Where is thedummy variable that makes this distinction? One can certainly distinguishbetween randomized, observational and uncontrolled studies, but should oneignore obvious and not so obvious distinctions within these groupings? Itparticular, the practice of grouping studies according to whether they arepublished is likely to be a weak indicator of quality. In the context of coach-ing studies, distinctions of quality on the basis of publication status are likelyto be either meaningless, or, as in the FTC example, misleading. Most coach-ing studies are made public through peer-reviewed journals, institutionalresearch reports, and doctoral dissertations. In each of these categories, it isrelatively easy to find examples of both high- and low-quality study designs.
Consider two reports used in Becker’s meta-analysis, one by Kintisch(1979) and one by Burke (1986). The former report was published in theJournal of Reading; the latter comes from a doctoral dissertation completedat Georgia State University. Both reports were similar in that they evaluatedthe effect on SAT-V scores of a school-based reading program offered over
Briggs / META-ANALYSIS: A CASE STUDY 103

the course of a semester. The coding of design characteristics for the tworeports by Becker is virtually identical. The only code that seemingly distin-guishes the two study designs is that one was published and the other was not.Yet based on the respective study designs described by the authors, the studyby Burke appears to be of much higher quality than the study by Kintisch.Burke analyzed separate samples of 11th- and 12th-grade students whohad taken one semester of her reading program; Kintisch grouped togetherall 12th-grade students who had taken her elective course over a 3-yearperiod. Burke took great pains in her study to demonstrate empirically thatstudents in both coached and uncoached conditions were equallymotivated to perform well on the SAT, making it less likely that thevalidity of her effect estimates is threatened by selection bias; Kintisch pro-vided no such demonstration.
My point in this section is not so much to take Becker’s meta-analysis totask for many subjective decisions with which I disagree but to note that thesesorts of equivocal decisions come with the meta-analytic territory. They areto be expected when one seeks to quantify the nuances of studies into a work-able set of continuous and categorical variables. One might expect to see sim-ilar questionable groupings and errors in study interpretation from a narrativereview. But in the latter context, such decisions are likely to be discussed aspart of the narrative, not buried within the machinery of the meta-analyticapproach. It is certainly possible to salvage meta-analytic interpretations bybetter coding decisions and model specifications. Codings and model speci-fications are after all, adjustable. But first one must consider the statisticalassumptions upon which the meta-analysis depends. These assumptions arenot adjustable when they are violated.
ASSUMPTIONS OF THE META-ANALYTIC MODEL
The statistical foundation of meta-analytic models is seldom given suffi-cient attention.11 This foundation requires one to accept a certain set ofassumptions about the way the data underlying a meta-analysis have beengenerated. These assumptions are often at odds with what is known about thestudies under review. It is helpful to put these assumptions into a groundedcontext, where one can contrast them with the data we actually observe. Inthe context of SAT coaching studies, the following assumptions are assumedto be true.
Within each coaching study (i),
104 EVALUATION REVIEW / APRIL 2005

I. SAT scores are independent within coached and uncoached student groups,and
II. SAT scores are independent across coached and uncoached student groups.
Across each report (h),
III. estimated coaching effects are independent.
Assumption I means that for any given study sample, how any onecoached student performs on the SAT is unrelated to how any other coachedstudent performs on the SAT. Likewise, the performance of any uncoachedstudent is unrelated to the performance of any other uncoached student. As-sumption II means that the performance of uncoached students on the SAT isunrelated to that of coached students. Assumption III maintains that the re-sults from one report have no influence on the results from another report.One assumes further that within coached and uncoached groups, SAT scoreshave identical normal distributions with a common mean and variance. Re-call that X and Y represent first and second testings on the SAT. For coachedstudents,
( ) ( )X N and Y NhijC
hiC
hi hijC
hiC
hi~ , ~ ,µ σ ν σ2 2 , (4)
and for uncoached students,
( ) ( )X N and Y NhijU
hiU
hi hijU
hiU
hi~ , ~ ,µ σ ν σ2 2 . (5)
The variance term σ hi2 is presumed to be constant across testings for both
coached and uncoached students. The parameters µ ν µ νhiC
hiC
hi hiU, , , ,U and σ hi
2
are all unobservable population-level quantities. But what, exactly, are thetarget populations? Within coaching studies, there are several possibilities,from the most general to the more specific:
1. Anyone in the United States who could take the SAT.2. Anyone in the United States who did take the SAT.3. High school students in the United States who plan to attend college and take
the SAT.4. High school seniors in private schools in the northeastern United States who
planned to attend college and took the SAT twice between 1955 and 1974.
Briggs / META-ANALYSIS: A CASE STUDY 105

In Becker’s meta-analysis, the target populations are not explicitly defined.None of the students in the coaching studies analyzed derive from probabilitysamples drawn from any defined population.
Without random sampling, statistical inference leans heavily upon theassumptions of independence, represented above by I, II, and III.12 How plau-sible are these assumptions in the coaching literature? Consider firstAssumption I: SAT scores within treatment groups are independent. In manystudies, coached students are exposed as a group to instruction from a singleteacher (Dyer 1953; French 1955; Dear 1958; Kintisch 1979; Burke 1986;Zuman 1988). It follows that SAT scores are likely to be dependent acrossstudents. If students form study groups, that is another source of correlation.Now consider Assumption II: SAT scores across treatment groups are inde-pendent. The use of retired SAT exams and delayed treatment conditions in anumber of randomized coaching studies make independence across coachedand uncoached groups unlikely (Roberts and Openheim 1966; Alderman andPowers 1980; Zuman 1988). In these studies, some students were initiallyassigned to control groups that were tested twice with retired versions of theSAT. Surprisingly, mean SAT scores often decreased from one testing to thenext for the control groups. Knowing that they were not taking an officialSAT examination, it appears the control students may have been less moti-vated to do their best on the test relative to coached students taking two offi-cial administration of the SAT. In this scenario, knowledge by the controlgroup that the treatment group was both getting coached and taking anofficial administration of the SAT influenced their test performance.
In assessing the plausibility of Assumption III (independence acrossreports),
Investigators are trained in similar ways, read the same papers, talk to one another, writeproposals for funding to the same agencies, and publish the findings after peer review.Earlier studies beget later studies, just as each generation of Ph.D. students train the next.After the first few million dollars are committed, granting agencies develop agendas oftheir own, which investigators learn to accommodate. Meta-analytic summaries of pastwork further channel this effort. There is, in short, a web of social dependence inherent inall scientific research. Does social dependence compromise statistical independence?Only if you think that investigators’ expectations, attitudes, preferences and motivationsaffect the written word—and never forget those peer reviewers! (Berk and Freedman2003, 12)
The “web of social dependence” Berk and Freedman (2003) described isespecially relevant in the context of SAT coaching reports. Many of thesereports built explicitly upon the designs of previous reports (Dyer 1953; Dear1958; French 1955). The care given to the definition of the coaching
106 EVALUATION REVIEW / APRIL 2005

treatment (Alderman and Powers 1980) also changed after a spate of coach-ing reviews were published during the 1980s, reviews that were themselvesprompted by key reports and reviews (Pallone 1961; Marron 1965; Evansand Pike 1973; FTC Boston Regional Office 1978; Slack and Porter 1980;Jackson 1980).
Certain adjustments to meta-analytic assumptions are sometimes made.Becker’s meta-analytic regressions derive from a fixed effects model. Oneadjustment to the model would be to assume that effect size estimates derivefrom some population of random or mixed effects. In a random-effectsmodel, each coaching effect from a study is assumed to be drawn as a randomsample from some population of coaching effects. Now the task is to estimatethe mean of these random effects. In the mixed-effects formulation, eachcoaching effect has both a fixed component and an intrinsic random errorcomponent. Had a random- or mixed-effects model been employed for theSAT coaching meta-analysis, one would need to consider the population ofreports to which meta-analytic inferences are to be drawn. An immediateproblem emerges, because with the exception of a few reports that Beckerwas unable to obtain, the reports under review are the full population of SATcoaching studies. One may invent a superpopulation of hypothetical studiesthat could have been conducted, but the assumption that the reports underreview are a random sample from this superpopulation is a tough pill toswallow.
Many statements in meta-analysis are couched in the inferential languageof significance testing. One must be clear about the interpretation of p valuesassociated with regression coefficients in a meta-analysis. Say one runs ameta-analytic regression and estimate the parameter �b with an associated pvalue of .05. Assuming the population parameter of interest, b, is really zero,if a limitless number of independent random samples were drawn from thesame population, one would expect to estimate a parameter as large as �b 5%of the time. This sort of thought experiment does not correspond to the waydata are actually being generated both within and across studies under reviewby the meta-analyst. Samples of studies are usually best characterized as thefull population; samples within studies are typically selected as a function ofconvenience. As Berk and Freedman (2003) wrote,
The moment that conventional statistical inferences are made from convenience samples,substantive assumptions are made about how the social world operates. Conventional sta-tistical inferences (e.g. formulas for the standard error of the mean, t-tests, etc.) dependon the assumption of random sampling. This is not a matter of debate or opinion; it is amatter of mathematical necessity. When applied to convenience samples, the randomsampling assumption is not a mere technicality or a minor revision on the periphery; theassumption becomes an integral part of the theory. (P. 2)
Briggs / META-ANALYSIS: A CASE STUDY 107

What are the consequences when independence assumptions are vio-lated? Using simulated data, Berk and Freedman (2003) have shown thateven very simple forms of positive dependence can lead to standard errorsthat are 50% larger than those that would calculated using conventional for-mulas. In real data sets, more complex forms of dependence are just as likely,with potential consequences for standard errors that may be considerablyworse. If estimated standard errors are wrong, then inferences based upon pvalues and confidence intervals will be misleading. The reporting of confi-dence intervals and p values for synthesized effects (common practice inalmost all meta-analyses) provide an illusory sense of statistical authority.
If one takes these sorts of criticisms seriously, the inferential use of meta-analysis may be doomed from the start, regardless of how well one quantifiesstudies and specifies one’s model. Indeed, Gene Glass (2000), who firstcoined the term meta-analysis, seemed to come to the same conclusion whenhe wrote that “inferential statistics has little role to play in meta-analysis”(p. 14).
COMPARING BECKER’S CONCLUSIONS TOTHOSE REACHED BY A NARRATIVE REVIEW
The principal conclusions reached by Becker in her SAT coaching reviewcan, I believe, be fairly represented as follows:
1. Summaries of coaching effects should be conditional on whethera. the study was published andb. involved a control group.2. The association between coaching duration and coaching effect is con-
founded by study design.3. Regardless of study design, coaching effects for the SAT-M are consistently
larger than those for the SAT-V.4. A number of unusually high coaching effect estimates can be found among
studies with no control groups, and among studies that are unpublished, evenafter holding constant other design characteristics.
5. The best summary of the overall coaching effect comes from published stud-ies with control groups: 19 points on the SAT-M, 8 points on the SAT-V.
A reasonable question to ask is whether a narrative review (cf. Briggs 2002b)of this same set of meta-analyzed studies would come to different conclu-sions about the effectiveness of SAT coaching. In addition, one might ask
108 EVALUATION REVIEW / APRIL 2005

whether these conclusions seem to be supported after reviewing the newreports that have appeared since Becker’s meta-analysis.
Conclusion 1a, that coaching effect summaries should be conditional onwhether a study involves a control group, was well established in priorreviews by Pike (1978), Messick (1980), Messick and Jungeblut (1981),Cole (1982), and Bond (1989). In fact, these reviews typically groupedcoaching effect summaries by those studies with no control group, those witha control group assigned randomly, those with a matched control group, andthose with nonequivalent control groups. With respect to Conclusion 1b, Ihave already argued that the categorization of studies by whether they havebeen published should not constitute a primary grouping for coaching effectsummaries. The aim of the reviewer should be to evaluate the quality of allavailable studies, published or not. Depending on the criteria chosen for eval-uation, some unpublished studies may be considered high quality, just assome published studies may be considered low quality. I would suggest thatthe best grouping of coaching effects is by the primary categories of studydesign (no control, observational control, randomized control) and mode ofcoaching delivery (school-based, commercial-based, computer-based). Thefull collection of coaching reports categorized by these criteria are summa-rized in Table 6. What becomes clear is that although the total number ofcoaching reports, 36, is sizeable, once reports are grouped by the primary cat-egories of coaching mode and study design, the average number of reportsper cell is rather small. The typical coaching study evaluates commercial orschool-based coaching with an observational design.
Conclusion 2, that the association between coaching duration and effect isconfounded by study design, was an important contribution of Becker’sreview. However, this conclusion could just as easily be reached without con-ducting a meta-analysis. Messick and Jungeblut (1981) analyzed this rela-tionship by calculating the rank correlation between program hours andcoaching effect by test section. In estimating Spearman rank correlationsrather than Pearson product moment correlations, less weight is placed uponthe specific point estimates of coaching effects. This mitigates the fact thatthe point estimates may well be biased to some extent. Under the rank corre-lation, studies with large and small effects have less influence, as the set ofstudy effects are compared only in an ordinal sense. Messick and Jungeblutfound strong correlations of .77 and .71 between program duration and effectfor 19 and 14 SAT-V and SAT-M coaching studies, respectively.
In Table 7 I have replicated the Messick and Jungeblut (1981) analysiswith three different collections of coaching studies. The first collection ofstudies is identical to those used by Messick and Jungeblut in their review.My results using these studies should be identical to those found by Messick
Briggs / META-ANALYSIS: A CASE STUDY 109

110
TAB
LE
6:
Stu
die
s by
Co
ach
ing
Mo
de
and
Des
ign
Met
hodo
logi
cal D
esig
n
Coa
chin
g Ty
peR
ando
miz
ed C
ontr
olO
bser
vatio
nal C
ontr
olN
o C
ontr
ol
Sch
ool-b
ased
Rob
erts
and
Ope
nhei
m (
1966
)E
vans
and
Pik
e (1
973)
Ald
erm
an a
nd P
ower
s (1
980)
Sha
w (
1992
)
Dye
r (1
953)
Fren
ch (
1955
)D
ear
(195
8)K
eefa
uver
(19
76)
Kin
tisch
(19
79)
John
son
(San
Fra
ncis
co s
ite)
(198
4)a
Bur
ke (
1986
)R
eyno
lds
and
Obe
rman
(19
87)
Har
vey
(198
8)W
ing,
Chi
lds,
and
Max
wel
l (19
89)
Sch
roed
er (
1992
)W
rinkl
e (1
996)
Pal
lone
(19
61)
Mar
ron
(196
5)Jo
hnso
n (A
tlant
a, N
ewYo
rk s
ites)
(19
84)a

111
Com
mer
cial
-bas
edFr
anke
l (19
60)
Whi
tla (
1962
)F
eder
al T
rade
Com
mis
sion
stu
dy a
nd r
eana
lyse
sB
osto
n R
egio
nal O
ffice
(19
78)
Bur
eau
of C
onsu
mer
Pro
tect
ion
(197
9)R
ock
(198
0)S
trou
d (1
980)
Ses
now
itz, B
ernh
ardt
, and
Kna
in (
1982
)Fr
aker
(19
87)
Whi
tla (
1988
)Z
uman
(19
88)a
Sne
deco
r (1
989)
Sm
yth
(198
9)S
myt
h (1
990)
Pow
ers
and
Roc
k (1
999)
Brig
gs (
2001
)
Kap
lan
(200
2)
Com
pute
r-ba
sed
Hop
mei
er (
1984
)La
sche
wer
(19
85)
Cur
ran
(198
8)H
olm
es a
nd K
effe
r (1
995)
McC
lain
(19
99)
Cof
fin (
1987
)a
a.D
esig
n in
tent
of t
hese
stu
dies
(ra
ndom
ized
exp
erim
enta
l) co
mpr
omis
ed b
y su
bsta
ntia
l sam
ple
attr
ition
.

and Jungeblut. The second collection of studies adds to the first collection allnew studies with relevant data conducted since the Messick and Jungeblutreview. The third collection of studies considers the same set as the secondcollection but excludes those studies that lacked a control group. Theseresults suggest two conclusions. First, it does not appear that coaching dura-tion and effect have a strong linear association. For both sections of the test,
112 EVALUATION REVIEW / APRIL 2005
TABLE 7: Coaching Duration by SAT Coaching Effect Estimate
Verbal SAT
Messick andMessick and Jungeblut
Messick and Jungeblut (1981)Jungeblut (1981) Updated(1981)a Updated b Subset c
Number of estimates 19 30 24Rank correlation .712 .459 .312
Math SAT
Messick andMessick and Jungeblut
Messick and Jungeblut (1981)Jungeblut (1981) Updated(1981)d Updated e Subset f
Number of estimates 14 25 17Rank correlation .711 .481 .408
a. Basis for correlations: Dyer (1953), French (1955) (two program estimates), Dear(1958), Frankel (1960), Whitla (1962), Alderman and Powers (1980) (five program esti-mates), Pallone (1961) (two program estimates), Marron (1963) (four program esti-mates), FTC (1979) (two program estimates).b. Basis for correlations: All studies and program estimates in Messick and Jungeblutplus Kintisch (1979), Hopmeier (1984), Johnson (1984), Laschewer (1985), Burke(1986), Zuman (1988) (two program estimates), Shaw (1992), Holmes and Keffer(1995), Wrinkle (1996), Powers and Rock (1999).c. Basis for correlations: Excludes all program estimates from uncontrolled studies:Pallone (1961), Marron (1963).d. Basis for correlations: Dyer (1953), French (1955), Dear (1958) (two program esti-mates), Frankel (1960), Whitla (1962), Evans and Pike (1973) (three program esti-mates), Marron (1963) (three program estimates), FTC (1979) (two program esti-mates).e. Basis for correlations: All studies and program estimates in Note d. plus Hopmeier(1984), Johnson (1984), Laschewer (1985), Schroeder (1988), Schroeder (1992),Zuman (1988) (two program estimates), Shaw (1992), Powers and Rock (1999), Kaplan(2002) (two program estimates).f.Basis for correlations:Excludes all program estimates from uncontrolled studies:Mar-ron (1963), Kaplan (2002).

the rank correlation drops by about 30% to 35% when new studies notreviewed by Messick and Jungeblut are included in the calculation. Second,it does appear that study design confounds the association between durationand effect. When new studies are included in the analysis, but uncontrolledstudies are excluded from the calculation, the rank correlations betweenduration and effect decrease.
Conclusion 3, that coaching effects for the SAT-M are consistently largerthan those for the SAT-V, regardless of study design, would almost certainlynot have been reached through a narrative review. There are numerous exam-ples of coaching interventions that produced larger effects on the SAT-V thanon the SAT-M in reports released prior to Becker’s meta-analysis. Hence con-sistency, irrespective of study design, would be tough to establish. The 14new coaching reports not included in Becker’s meta-analysis do lend supportto the notion that on average, the SAT-M is more coachable than the SAT-V.This conclusion is best supported with respect to the estimated effects forcommercial coaching programs with observational designs (cf. Fraker 1987;Whitla 1988; Snedecor 1989; Smyth 1990; Powers and Rock 1999; Briggs2001). The evidence is less conclusive for studies with school-based coach-ing programs and studies with no control groups.
The first part of Conclusion 4, that a number of unusually high coachingeffect estimates can be found among studies with no control groups, andamong studies that are unpublished, is essentially a restatement of the find-ings first emphasized by Slack and Porter (1980) and then later discussedextensively in all subsequent reviews. Indeed, this seems to be the primarybasis for the debate over the effectiveness of SAT coaching. For a recentexample of this debate renewed, see Kaplan (2002) and Briggs (2002a). Thesecond part of Conclusion 4, that unusually high effect estimates are foundeven after holding constant other design characteristics, depends on theassumption that it is sensible to “hold constant” with a meta-analytic regres-sion. I have suggested that there is good reason to be skeptical about this.
Conclusion 5 is the most widely cited finding from Becker’s SAT coach-ing meta-analysis: The best summary of the overall coaching effect is 19points on the SAT-M, 8 points on the SAT-V. To arrive at this conclusion,Becker first separated coaching reports into those that were published andunpublished. After removing studies without control groups from the sampleof published studies, Becker calculates a homogeneous estimate for theeffect of coaching, without the need to control for either coaching programcharacteristics, or design characteristics. For such studies, the fixed effectmeta-analytic model is
�∆ = 8.8 + 6.9(SAT-M).
Briggs / META-ANALYSIS: A CASE STUDY 113

In words, the best meta-analytic model for synthesizing the effects of coach-ing should simply take the weighted average of SAT-V and SAT-M coachingstudy effect estimates, but only for those studies that have been published andinvolve control groups.
Are these results enlightening? For anyone following the debate overcoaching effectiveness since the early 1980s, the answer should be no. Theresults of unpublished studies, and studies with no control groups, typicallysuggest that coaching might produce substantial effects on SAT perfor-mance. It is precisely the ambiguous interpretation of these studies that hasfueled much of the controversy over coaching effectiveness. So it shouldcome as little surprise that once one removes such studies from the meta-analysis, the model returns homogeneous and small estimates of coachingeffects.
In addition, because the largest studies from the largest report in the SATcoaching literature were miscoded in the meta-analysis, the conclusion aboutthe overall size of coaching effects was almost certainly wrong. Given thefairly large effects found in the FTC report, it is likely that had the results forCompany A been correctly included in the meta-analytic evidence base asderiving from a published source, the weighted averages for the overallcoaching effects would be higher.
When new literature on SAT coaching effects is added to the mix, the bestguess for the overall effect of commercial coaching programs may be veryclose to the total effect of about 30 points suggested in the meta-analysis. Ibase this conclusion primarily on the two largest studies of commercialcoaching using nationally representative samples (Powers and Rock 1999;Briggs 2001). However, it seems worth noting that there are also a number ofstudies that suggest coaching may be more effective for certain types of stu-dents (cf. Briggs 2004b) and certain types of programs (cf. Burke 1986;Schroeder 1992; Kaplan 2002). Such findings may indicate a direction forfurther research.
In summary, it seems to me that everything accomplished by Becker’smeta-analysis could have been accomplished as well or better with a narra-tive review. The soundness of the conclusions Becker reaches in her meta-analysis rely upon her judgments as a researcher, not upon the rigor or objec-tivity of the meta-analytic approach. Like a narrative review, these judgmentsare often debatable. Unlike a narrative review, these judgments are more eas-ily disguised by equations and parameter estimates.
114 EVALUATION REVIEW / APRIL 2005

CONCLUSION
The traditional alternative to meta-analysis is the oft-maligned narrativeliterature review. A collection of studies is gathered, read, and evaluated. Thereviewer starts with a set of questions and searches for trends and patternsthat help answer these questions. Finally, the reviewer reports on the trendsand patterns that, to his or her eye, emerge. This is unquestionably very hardwork, and it requires both science and art. For two examples of what I con-sider exemplary narrative reviews (also within the domain of SAT coachingstudies), I would encourage readers to consult Messick (1980) or Messickand Jungeblut (1981). Nuances are explored and insights are provided with-out the need for a single meta-analytic regression.
The process of conducting a narrative review might be criticized as overlysubjective. One of my aims here has been to show that the meta-analysisshares the same inherent subjectivity. The problem with narrative reviews ofpoor quality is typically not that they are biased but that they fail to be system-atic. It seems clear that an unsystematic review will be of poor quality regard-less of the specific methodological approach. For a review to be compelling,the criteria for including and evaluating research reports should be madeexplicit. To the extent that this is a central feature of the meta-analysis, it is afeature that should be duplicated in a narrative review.13
Meta-analyses can be used for both descriptive and inferential purposes.The case study presented here suggests that there are good reasons to be cau-tious even when a meta-analysis is used solely for descriptive purposes.Meta-analytic regressions may imply interpretations that are not warrantedwhen one compares them to the observed findings of the underlying studies.One reason for this is that there is no grounded theory to guide the specifica-tion of meta-analytic regression models. Another reason is that the process ofquantifying studies is problematic. Important details may get lost, just as sub-jective decisions will almost invariably lead to coding errors. The use ofmeta-analysis for inferential purposes rests upon a very uncertain foundationin social science applications. When certain assumptions do not hold, thereporting of confidence intervals and p values for synthesized effects willhave dubious interpretations. In the case study considered here, Becker’smeta-analytic regressions fare poorly when used to predict the outcomes ofnew coaching studies. It would be interesting and informative (though out-side the scope of this study) to apply the same test to other well-establishedmeta-analyses.
There may be very specific research contexts where the use of meta-analysisis reasonable. Such contexts would seemingly require a set of studies with
Briggs / META-ANALYSIS: A CASE STUDY 115

• randomized experimental designs,• carefully defined treatments, and• homogeneous samples from a large but well-defined population of interest.
Petitti (2000) suggested that this sort of context sometimes exists in medicalresearch. In educational research, the sort of context described above isexceedingly rare. Outside of this context, the potential for meta-analysis toobfuscate as much or even more than it enlightens is high.
No single methodological framework can ensure the validity of conclu-sions drawn from a quantitative literature review. As Cronbach (1982, 108)noted some time ago, commenting on a related context, “Validity dependsnot only on the data collection and analysis but also on the way a conclusionis stated and communicated. Validity is subjective rather than objective: theplausibility of the conclusion is what counts. And plausibility, to twist acliché, lies in the ear of the beholder.”
116 EVALUATION REVIEW / APRIL 2005

117
AP
PE
ND
IX A
SAT
Coa
chin
g R
epor
ts, 1
953-
2001
Sam
ple
Siz
ea(C
oach
ed/T
otal
)
Gra
deYe
ar(s
)S
ES
of
Stu
dyS
AT-V
SAT
-MLe
vel
Sch
ool T
ype
Loca
tion
Test
edS
ampl
eb
Unc
ontr
olle
d st
udie
sS
choo
l-bas
ed c
oach
ing
Pal
lone
(19
60)
100
NA
Pre
colle
ge1
priv
ate
(all
mal
e)D
.C.
1959
Hig
hM
arro
n (1
965)
714
715
11th
, 12t
h10
priv
ate
(all
mal
e)D
.C.
1962
Hig
hJo
hnso
n (A
tlant
a an
dN
YC
site
s) (
1984
)11
711
611
thM
ultip
le p
ublic
NY,
GA
1983
-199
4Lo
w(a
ll B
lack
, urb
an)
Com
mer
cial
coa
chin
gK
apla
n (2
002)
NA
1812
thM
ultip
le p
ublic
and
CT
1999
-200
0H
igh
priv
ate
Com
pute
r-ba
sed
coac
hing
Cof
fin (
1987
)18
1811
th, 1
2th
1 pu
blic
(ur
ban)
MA
1986
-198
7Lo
wO
bser
vatio
nal s
tudi
esS
choo
l-bas
ed c
oach
ing
Dye
r (1
953)
225/
418
225/
418
12th
2 pr
ivat
e (a
ll m
ale)
NR
1951
-195
2H
igh
Fren
ch (
1955
)16
1/31
916
1/31
912
th3
publ
icM
I, M
A19
54H
igh
Dea
r (1
958)
60/5
8660
/586
12th
Mul
tiple
pub
lic a
ndN
J, N
Y, P
A19
56-1
957
Hig
hpr
ivat
eLa
ss (
1961
, cite
din
Pik
e 19
78)
38/1
2038
/120
Mix
edK
eefa
uver
(19
76)
16/4
116
/41
MM
MH
igh
(con
tinue
d)
118
Kin
tisch
(19
79)
38/7
6N
A12
th1
publ
ic (
subu
rban
)PA
1976
-197
8N
RB
urke
(19
86)
50/1
0050
/100
11th
, 12t
h1
publ
ic (
subu
rban
)G
A19
84-1
985
Mix
edR
eyno
lds
and
Obe
rman
(198
7)93
/140
93/1
40M
MM
Hig
hH
arve
y (1
988)
NA
21/5
411
th2
publ
ic (
urba
n)G
A19
87M
ixed
Win
g, C
hild
s, a
ndM
axw
ell (
1989
)17
3/25
317
3/25
311
thS
tate
wid
eN
C19
86, 1
987
Hig
hS
chro
eder
(19
92)
NA
59/9
5N
R1
publ
ic (
urba
n)N
Y19
91-1
992
Hig
hW
rinkl
e (1
996)
18/3
6N
A9t
h, 1
0th,
11t
h1
publ
ic (
subu
rban
)T
XN
RH
igh
Com
mer
cial
coa
chin
gFr
anke
l (19
60)
45/9
045
/90
12th
1 pu
blic
(ur
ban)
NY
1958
Hig
hW
hitla
(19
62)
52/1
0450
/100
11th
Mul
tiple
pub
lic a
ndM
A19
59H
igh
priv
ate
Fede
ral T
rade
Com
mis
sion
Bos
ton
Reg
iona
lO
ffice
(19
78)/
Bur
eau
of C
onsu
mer
Pro
tect
ion
(197
9)55
6/2,
122
556/
2,12
211
th, 1
2th
Mul
tiple
pub
lic a
ndN
Y19
74-1
977
Mix
edpr
ivat
e (u
rban
)Fr
aker
(19
87)
19/1
3819
/138
12th
1 pr
ivat
eM
A19
86H
igh
Whi
tla (
1988
)34
1/1,
558
341/
1,55
812
thM
ultip
le p
ublic
and
US
A19
86-1
987
Hig
hpr
ivat
e
AP
PE
ND
IX A
(co
ntin
ued)
Sam
ple
Siz
ea(C
oach
ed/T
otal
)
Gra
deYe
ar(s
)S
ES
of
Stu
dyS
AT-V
SAT
-MLe
vel
Sch
ool T
ype
Loca
tion
Test
edS
ampl
eb

119
Zum
an (
high
-SE
Ssa
mpl
e) (
1988
)21
/55
21/5
511
thM
ultip
le p
ublic
(ur
ban)
NY
1985
-198
6H
igh
Sm
yth
(198
9)20
0/43
820
0/43
812
th8
priv
ate
(sub
urba
n)M
D, D
.C.
1987
-198
8H
igh
Sne
deco
r (1
989)
264/
535
264/
535
12th
10 p
ublic
and
priv
ate
PA19
88-1
989
Hig
hS
myt
h (1
990)
631/
1,13
263
1/1,
132
12th
14 p
rivat
e (s
ubur
ban)
MD
, NJ
1989
Hig
hP
ower
s an
d R
ock
(199
9)42
7/2,
086
427/
2,08
611
th, 1
2th
Mul
tiple
pub
lic a
ndU
SA
1995
-199
6M
ixed
priv
ate
Brig
gs (
2001
)50
3/3,
144
503/
3,14
411
th, 1
2th
Mul
tiple
pub
lic a
ndU
SA
1991
-199
2M
ixed
priv
ate
Ran
dom
ized
stu
dies
Sch
ool-b
ased
coa
chin
gR
ober
ts a
nd O
penh
eim
(196
6)15
4/26
518
8/31
012
th18
pub
lic (
all B
lack
,T
N19
65Lo
wur
ban,
and
rur
al)
Eva
ns a
nd P
ike
(197
3)N
A28
8/41
711
th12
pub
lic (
urba
nN
J, O
H, P
A19
70-1
971
Mix
edan
d su
burb
an)
Ald
erm
an a
nd P
ower
s(1
980)
239/
559
NA
11th
8 pu
blic
and
priv
ate
7 N
ew19
77-1
978
Mix
edE
ngla
ndst
ates
John
son
(San
Fra
ncis
cosi
te)
(198
4)23
/35
23/3
511
thM
ultip
le p
ublic
(al
lC
A19
83-1
994
Low
Bla
ck, u
rban
)S
haw
(19
92)
61/1
2261
/122
12th
3 pu
blic
(su
burb
an)
CA
1988
Mix
edC
omm
erci
al c
oach
ing
Zum
an (
low
-SE
S s
ampl
e)(1
988)
16/3
316
/33
11th
Mul
tiple
pub
lic (
urba
n)N
Y19
85-1
986
Low
(con
tinue
d)

120
Com
pute
r-ba
sed
coac
hing
Hop
mei
er (
1984
)42
/71
61/9
39t
h, 1
0th,
11t
h1
publ
ic (
subu
rban
)F
LN
RM
ixed
Lasc
hew
er (
1985
)13
/27
13/2
711
th1
priv
ate
(sub
urba
nN
YN
RM
ixed
Cat
holic
)C
urra
n (1
988)
204/
408
204/
408
11th
4 pr
ivat
e (C
atho
lic)
MA
1986
-198
7M
ixed
Hol
mes
and
Kef
fer
(199
5)28
/58
NA
12th
1 pu
blic
(ru
ral)
GA
1990
Mix
edM
cCla
in (
1999
)40
/60
40/6
012
thP
ublic
(su
burb
an)
MD
1998
Low
NO
TE
:NA
= n
ot a
pplic
able
;NR
= n
ot r
epor
ted;
M =
mis
sing
dat
a.R
epor
ts in
ital
ics
are
thos
e re
view
ed in
Bec
ker’s
(19
90)
met
a-an
alys
is.
a.S
ampl
es p
rese
nted
her
e ar
e su
mm
ed a
cros
s al
l coa
ched
and
unc
oach
ed s
ubsa
mpl
es c
onsi
dere
d in
giv
en s
tudy
unl
ess
othe
rwis
e no
ted.
b.A
ppro
xim
ate
soci
oeco
nom
ic s
tatu
s (p
aren
tal i
ncom
e, e
duca
tion,
occ
upat
ion)
of s
ampl
e on
ave
rage
acc
ordi
ng to
aut
hor.
AP
PE
ND
IX A
(co
ntin
ued)
Sam
ple
Siz
ea(C
oach
ed/T
otal
)
Gra
deYe
ar(s
)S
ES
of
Stu
dyS
AT-V
SAT
-MLe
vel
Sch
ool T
ype
Loca
tion
Test
edS
ampl
eb

121
AP
PE
ND
IX B
Cod
ing
Tre
atm
ent
Cha
ract
eris
tics
of
New
Stu
dies
Gra
ndC
ontr
olS
tudy
Mea
nS
AT-M
Gro
upD
VI
MI
AI
IPT
PT
SO
AH
WC
IW
CA
C
Hop
mei
er1
11
3.5
11
11
01
00
10
0Fr
aker
11
115
11
01
11
00
00
0H
arve
y1
11
40
11
10
10
00
01
Whi
tla1
11
151
11
11
10
00
00
Sne
deco
r1
11
151
11
11
10
00
00
Win
g, C
hild
s, a
nd M
axw
ell
11
115
11
11
11
10
00
0S
myt
h1
11
151
11
11
10
00
00
Sha
w1
11
41
10
00
10
00
00
Sch
roed
er1
11
160
12
11
11
00
00
Hol
mes
and
Kef
fer
10
18
10
10
00
00
10
0W
rinkl
e1
01
681
02
11
10
00
00
Pow
ers
and
Roc
k1
11
151
11
11
10
00
00
Brig
gs1
11
151
11
11
10
00
00
Kap
lan
Year
11
10
300
12
11
11
10
00
Kap
lan
Year
21
10
300
12
11
11
10
00
NO
TE
:D=
dura
tion
ofco
achi
ngin
hour
s(b
old
valu
esha
vebe
enim
pute
das
inB
ecke
r’s[1
990]
revi
ew),
VI=
verb
alin
stru
ctio
n,M
I=m
ath
inst
ruc-
tion,
AI=
alph
ain
stru
ctio
n,IP
=ite
mpr
actic
e,T
P=
test
prac
tice,
TS
=te
st-t
akin
gsk
ills,
OA
=ot
hera
ctiv
ities
,WC
=w
ait-
listc
ontr
ol,A
C=
alte
rna-
tive
cont
rol.

122
AP
PE
ND
IX C
Cod
ing
Des
ign
Cha
ract
eris
tics
of
New
Stu
dies
Stu
dyYe
arP
ubM
atch
Ran
dE
TS
Sel
Vol
Hop
mei
er82
00
10
12
Frak
er87
00
00
22
Har
vey
880
00
01
2W
hitla
881
00
02
2S
nede
cor
891
00
02
2W
ing,
Chi
lds,
and
Max
wel
l89
00
00
22
Sm
yth
901
00
02
2S
haw
920
01
01
2S
chro
eder
920
00
02
2H
olm
es a
nd K
effe
r95
10
10
22
Wrin
kle
960
10
02
2P
ower
s an
d R
ock
991
00
11
2B
riggs
101
10
00
12
Kap
lan
Year
110
11
00
02
2K
apla
n Ye
ar 2
101
10
00
22
NO
TE
:D=
dura
tion
ofco
achi
ngin
hour
s(b
old
valu
esha
vebe
enim
pute
das
inB
ecke
r’s[1
990]
revi
ew);
VI=
pres
ence
ofve
rbal
inst
ruct
ion;
Year
=pu
blic
atio
nye
ar;P
ub=
publ
ishe
din
peer
-rev
iew
edjo
urna
l;M
atch
=us
eof
mat
chin
g;R
and
=ra
ndom
ized
desi
gn;E
TS
=sp
onso
red
byE
duca
-tio
nal T
estin
g S
ervi
ce;S
el =
sel
ectiv
ity o
f sam
ple,
Vol
= v
olun
tarin
ess
of s
ampl
e.

NOTES
1. There are two exceptions. I was unable to track down two SAT coaching reports:Keefauver (1976) and Reynolds and Oberman (1987). The former is a doctoral dissertation andthe latter is a conference paper.
2. As of 1994, the SAT became the SAT I: Reasoning Test. For simplicity, I use the term SATthroughout.
3. I am skipping one step. Becker makes an adjustment for bias in ghiC and ghi
U (for details, seeBecker 1988). The adjustment has no bearing on the issues being raised here.
4. I will not use the report by McClain (1999) in the subsequent analysis because the paperdoes not provide estimates for each section of the SAT. I also exclude the report by Smyth (1989)because the sample from that report appears to overlap with that used in his more detailed 1990report.
5. Becker also specifies meta-analytic regressions using subsamples of SAT coachingreports, for example, modeling the estimated effects only for published reports, modeling theestimated effects only for unpublished reports. The root mean square error (RMSE) of thesemodels tells a similar story to the one summarized in Table 2.
6. Defined by Bond (1989) as instruction geared toward the latent domain represented bythe test score, that is, the composite of underlying knowledge and reasoning ability developedover a long period of time. Bond contrasted alpha instruction with beta instruction, which hedefined as instruction intended to improve general and specific test wiseness.
7. These dummy variables have obvious overlap with variables intended to control fordesign characteristics. It is unclear why they have been included as part of Model C rather thanModel D.
8. The latter finding is influenced by the seven observations drawn from the same coachingreport by Marron (1965).
9. The PSAT is essentially a pretest of the SAT, administered to most high school students inthe 10th grade. The PSAT has the same format as the SAT, and performance on the PSAT isstrongly correlated with performance on the SAT.
10. In addition to the Federal Trade Commission report, these sorts of statistical adjustmentswere made in the reports by Dyer (1953), French (1955), Dear (1958), Zuman (1988), and Alder-man and Powers (1980).
11. For a more general and detailed presentation of this foundation, see Hedges and Olkin(1985).
12. For a more general presentation of this issue, see Berk (2004, chap. 4).13. This is hardly a new idea. See, for example, Bonde and Magistrate (1987). The impor-
tance of conducting literature reviews that are systematic receives strong emphasis.
REFERENCES
Alderman, D. L., and D. E. Powers. 1980. The effects of special preparation on SAT-verbalscores. American Educational Research Journal 17:239-53.
Anastasi, A. 1981. Coaching, test sophistication, and developed abilities. American Psychologist36 (10): 1086-93.
Briggs / META-ANALYSIS: A CASE STUDY 123

Becker, B. J. 1988. Synthesizing standardized mean-change measures. British Journal of Mathe-matical and Statistical Psychology 41:257-78.
. 1990. Coaching for the Scholastic Aptitude Test: Further synthesis and appraisal.Review of Educational Research 60 (3): 373-417.
Berk, R. A. 2004. Regression analysis: A constructive critique. Thousand Oaks, CA: Sage.Berk, R. A., and D. A. Freedman. 2003. Statistical assumptions as empirical commitments. In
Law, punishment, and social control: Essays in honor of Sheldon Messinger, 2nd ed., ed.T. G. Blomberg and S. Cohen, 235-54. http://www.stat.berkeley.edu/census/berk2.pdf.
Bond, L. 1989. The effects of special preparation on measures of scholastic ability. In Educa-tional measurement, ed. R. L. Linn, 429-44. New York: American Council on Education/Macmillan.
Bonde, L. A., and A. S. Magistrate. 1987. Writer’s guide: Psychology. Lexington, MA: D. C.Heath.
Briggs, D. C. 2001. The effect of admissions test preparation: Evidence from NELS:88. Chance14 (1): 10-18.
. 2002a. Comment: Jack Kaplan’s A new study of SAT coaching. Chance 15 (1): 7-8.. 2002b. SAT coaching, bias and causal inference. Ph.D. diss., University of California,
Berkeley.. 2004a. Causal inference and the Heckman model. Journal of Educational and Behav-
ioral Statistics 29 (4): 397-420.. 2004b. Evaluating SAT coaching: Gains, effects and self-selection. In Rethinking the
SAT: Perspectives based on the November 2001 conference at the University of California,Santa Barbara, ed. by R. Zwick, 217-34. New York: RoutledgeFalmer.
Burke, K. B. 1986. A model reading course and its effect on the verbal scores of eleventh andtwelfth grade students on the Nelson Denny Test, the Preliminary Scholastic Aptitude Test,and the Scholastic Aptitude Test. Ph.D. diss., Georgia State University, Atlanta.
Coffin, G. C. 1987. Computer as a tool in SAT preparation. Paper presented at the Florida Instruc-tional Computing Conference, Orlando, FL.
Coffman, W. E., and M. E. Parry. 1967. Effects of an accelerated reading course on SAT-V scores.Personnel and Guidance Journal 46:292-96.
Cole, N. 1982. The implications of coaching for ability testing. In Ability testing: Uses, conse-quences, and controversies. Part II: documentation section, ed. A. K. Wigdor and W. R.Gardner. Washington, DC: National Academy Press.
Curran, R. G. 1988. The effectiveness of computerized coaching for the Preliminary ScholasticAptitude Test (PSAT/NMSQT) and the Scholastic Aptitude Test (SAT). Ph.D. diss., BostonUniversity.
Cronbach, L. J. 1982. Designing evaluations of educational and social programs. San Francisco:Jossey-Bass.
Dear, R. E. 1958. The effect of intensive coaching on SAT scores. Princeton, NJ: EducationalTesting Service.
DerSimonian, R., and N. M. Laird. 1983. Evaluating the effect of coaching on SAT scores: Ameta-analysis. Harvard Educational Review 53:1-15.
Dyer, H. S. 1953. Does coaching help? College Board Review 19:331-35.Evans, F., and L. Pike. 1973. The effects of instruction for three mathematics item formats. Jour-
nal of Educational Measurement 10 (4): 257-72.Federal Trade Commission, Boston Regional Office. 1978. Staff memorandum of the Boston
Regional Office of the Federal Trade Commission: The effects of coaching on standardizedadmission examinations. Boston: Federal Trade Commission, Boston Regional Office.
124 EVALUATION REVIEW / APRIL 2005

Federal Trade Commission, Bureau of Consumer Protection. 1979. Effects of coaching stan-dardized admission examinations: Revised statistical analyses of data gathered by theBoston Regional Office of the Federal Trade Commission. Washington, DC: Federal TradeCommission, Bureau of Consumer Protection.
Fraker, G. A. 1987. The Princeton Review reviewed. In The Newsletter. Deerfield, MA: DeerfieldAcademy.
Frankel, E. 1960. Effects of growth, practice, and coaching on Scholastic Aptitude Test scores.Personnel and Guidance Journal 38:713-19.
French, J. W. 1955. The coach ability of the SAT in public schools. Princeton, NJ: EducationalTesting Service.
Glass, G. V. 2000. Meta-analysis at 25. http://glass.ed.asu.edu/gene/papers/meta25.html.Glass, G. V, B. McGaw, and M. L. Smith. 1981. Meta-analysis in social research. Beverly Hills,
CA: Sage.Harvey, K. S. 1988. Videotaped versus live instruction as a coaching method for the mathematics
portion of the scholastic aptitude test. Ph.D. diss., University of Georgia, Athens.Hedges, L. V. 1990. Directions for future methodology. In The future of meta-analysis, ed. K. W.
Wachter and M. L. Straf, 11-26. New York: Russell Sage Foundation.Hedges, L. V., and I. Olkin. 1985. Statistical methods for meta-analysis. New York: Academic
Press.Holmes, C. T., and R. Keffer. 1995. A computerized method to teach Latin and Greek root words:
Effect on verbal SAT scores. Journal of Educational Research 89 (1): 47-50.Hopmeier, G. H. 1984. The effectiveness of computerized coaching for Scholastic Aptitude Test
in individual and group modes. Ph.D. diss., Florida State University, Tallahassee.Jackson, R. 1980. The Scholastic Aptitude Test: A response to Slack and Porter’s critical
appraisal. Harvard Educational Review 50 (3): 382-91.Johnson, S. T. 1984. Preparing Black students for the SAT—Does it make a difference? An evalu-
ation report of the NAACP Test Preparation Project. New York: National Association for theAdvancement for Colored People.
Kaplan, J. 2002. A new study of SAT coaching. Chance 14 (4): 1-6.Keefauver, L. W. 1976. The effects of a program of coaching on Scholastic Aptitude Test scores
of high school seniors tested as juniors. Ph.D. diss., University of Tennessee at Knoxville.Kintisch, L. S. 1979. Classroom techniques for improving Scholastic Aptitude Test scores. Jour-
nal of Reading 22:416-19.Kulik, C.-L., and J. A. Kulik. 1988. Meta-analysis: Historical origins and contemporary practice.
Paper presented at the annual meeting of the American Educational Research Association,New Orleans, LA.
Kulik, J. A., R. L. Bangert-Drowns, and C.-L. Kulik. 1984. Effectiveness of coaching for aptitudetests. Psychological Bulletin 95:179-88.
Laschewer, A. 1985. The effect of computer assisted instruction as a coaching technique for thescholastic aptitude test preparation of high school juniors. Ph.D. diss., Hofstra University,Hempstead, NY.
Marron, J. E. 1965. Preparatory school test preparation: Special test preparation, its effect onCollege Board scores and the relationship of affected scores to subsequent college perfor-mance. West Point, NY: Research Division, Office of the Director of Admissions and Regis-trar, United States Military Academy.
McClain, B. 1999. The impact of computer-assisted coaching on the elevation of twelfth-gradestudents’ SAT scores. Ph.D. diss., Morgan State University, Baltimore.
Messick, S. 1980. The effectiveness of coaching for the SAT: Review and reanalysis of researchfrom the fifties to the FTC. Princeton, NJ: Educational Testing Service.
Briggs / META-ANALYSIS: A CASE STUDY 125

. 1982. Issues of effectiveness and equity in the coaching controversy: Implications foreducational and testing practice. The Educational Psychologist 17 (2): 67-91.
Messick, S., and A. Jungeblut. 1981. Time and method in coaching for the SAT. PsychologicalBulletin 89:191-216.
Oakes, M. 1986. Statistical inference: A commentary for the social and behavioral sciences.New York: John Wiley.
Pallone, N. J. 1961. Effects of short- and long-term developmental reading courses upon theS.A.T. verbal scores. Personnel and Guidance Journal 39:654-57.
Petitti, D. B. 2000. Meta-analysis, decision analysis and cost-effectiveness analysis. 2nd ed.New York: Oxford University Press.
Pike, L. W. 1978. Short-term instruction, testwiseness, and the Scholastic Aptitude Test: A litera-ture review with research recommendations. Princeton, NJ: Educational Testing Service.
Powers, D. E. 1993. Coaching for the SAT: A summary of the summaries and an update. Educa-tional Measurement: Issues and Practice 12 (2): 24-39.
Powers, D. E., and D. A. Rock. 1999. Effects of coaching on SAT I: Reasoning test scores. Jour-nal of Educational Measurement 36 (2): 93-118.
Reynolds, A., and G. O. Oberman. 1987. An analysis of a PSAT preparation program for urbangifted students. Paper presented at the annual meeting of the American Educational ResearchAssociation, Washington, DC, April.
Roberts, S. O., and D. B. Openheim. 1966. The effect of special instruction upon test perfor-mance of high school students in Tennessee. Princeton, NJ: Educational Testing Service.
Rock, D. 1980. Disentangling coaching effects and differential growth in the FTC commercialcoaching study. Princeton, NJ: Educational Testing Service.
Schroeder, B. 1992. Problem-solving strategies and the mathematics SAT: A study of enhancedperformance. Ph.D. diss., Teacher’s College, Columbia University, New York.
Sesnowitz, M., K. Bernhardt, and M. D. Knain. 1982. An analysis of the impact of commercialtest preparation on SAT scores. American Educational Research Journal 19 (3): 429-41.
Shadish, W., T. Cook, and D. Campbell. 2002. Experimental and quasi-experimental designs forgeneralized causal inference. Boston: Houghton-Mifflin.
Shaw, E. 1992. The effects of short-term coaching on the Scholastic Aptitude Test. Ph.D. diss.,University of La Verne, La Verne, CA.
Slack, W. V., and D. Porter. 1980. The Scholastic Aptitude Test: A critical appraisal. HarvardEducation Review 50: 154-75.
Smyth, F. L. 1989. Commercial coaching and SAT scores. Journal of College Admissions 123:2-9.. 1990. SAT coaching: What really happens and how we are led to expect more. Journal of
College Admissions 129:7-17.Snedecor, P. J. 1989. Coaching: Does it pay? revisited. Journal of College Admissions 125:15-18.Stroud, T. W. F. 1980. Reanalysis of the Federal Trade Commission study of commercial coach-
ing for the SAT. Princeton, NJ: Educational Testing Service.Wachter, K. W. 1988. Disturbed by meta-analysis? Science 241 (4872): 1407-8.Whitla, D. K. 1962. Effect of tutoring on Scholastic Aptitude Test scores. Personnel and Guid-
ance Journal 41:32-37.. 1988. Coaching: Does it pay? Not for Harvard students. College Board Review 148
(Summer): 32-35.Wing, C. W., R. A. Childs, and S. E. Maxwell. 1989. Some field observations of the impact of test
preparatory programs on high school students’ Scholastic Aptitude Test scores. A report tothe Awards Committee for Education and Wake Forest University, Winston-Salem, NC.
Wrinkle, G. W. 1996. A Scholastic Assessment Test preparation class and its effect on ScholasticAssessment Test scores. Ph.D. diss., University of Houston, TX.
126 EVALUATION REVIEW / APRIL 2005

Zuman, J. P. 1988. The effectiveness of special preparation for the SAT: An evaluation of a com-mercial coaching school. Paper presented at the annual meeting of the American EducationalResearch Association, New Orleans, LA, April.
Derek C. Briggs is an assistant professor specializing in quantitative methods and policy analy-sis in the School of Education at the University of Colorado, Boulder. He teaches courses in sta-tistics and measurement in the Research and Evaluation Methodology program. His researchapplies statistical and psychometric methods to address a wide range of topics in educationalsettings. His areas of specialization include causal inference and item response theory. Hereceived his Ph.D. from the University of California, Berkeley, in 2002.
Briggs / META-ANALYSIS: A CASE STUDY 127