Embed Size (px)
Citation preview

NORTHEAST OHIO REGIONAL SEWER DISTRICT
2009 Cuyahoga River Electrofishing &
Benthic Macroinvertebrate Surveys
Prepared by Water Quality and Industrial Surveillance’s
Environmental Assessment Section
Stonecat Madtom
Pink Heelsplitter

2009 Cuyahoga River Biological, Habitat and Water Quality Survey Results October 26, 2010
-2-
Introduction
The Northeast Ohio Regional Sewer District (NEORSD) has monitored the trends of the Cuyahoga River’s aquatic biota since the early 1990’s. In 2009, NEORSD completed surveys for water chemistry, habitat assessment, fish community assessments, and benthic macroinvertebrate assessments. A study plan (Northeast Ohio Regional Sewer District [NEORSD], 2009a) for the assessments was submitted to the Ohio Environmental Protection Agency (EPA) and approved on May 12, 2009. The purpose of this study was to survey the biological community health in the river, identify sources of impairment, and determine if the system was continuing to show improvement and to document any changes. The locations surveyed were between river miles (RM) 16.20 and 7.00, see Table 1 and Figure 1. All of the locations in the study area are designated warmwater habitat (WWH).
In conjunction with this study, additional projects were completed in the study area to evaluate conditions in the Cuyahoga River. For example, chronic toxicity tests were completed to comply with Southerly Wastewater Treatment Center (WWTC) National Pollution Discharge Elimination System (NPDES) permit (permit number 3PF00002*LD). The chronic toxicity testing is completed on Southerly WWTC treated effluent and up and downstream of the where the flow enters the river four times per year. A chronic toxicity test is used to determine if a sample has any effects on the organisms tested. Effects on the organisms include death, impairment of motor function, and impairment of growth and/or reproduction. Water quality sampling also occurs upstream and downstream of Southerly WWTC twice a month, year around. The locations of the upstream and downstream sampling were chosen to comply with the NPDES permit. The NPDES sampling locations included upstream of Southerly WWTC at RM 10.95 and at two locations downstream of Southerly WWTC at RM 10.45 and 9.70. Sampling for chlorophyll a was completed in anticipation of possible future nutrient criteria. The results for the chlorophyll a are not discussed in this report, but can be found in a separate report titled, “2009 Cuyahoga River Chlorophyll a Sampling Results,” (Northeast Ohio Regional Sewer District [NEORSD], 2009b).

2009 Cuyahoga River Biological, Habitat and Water Quality Survey Results October 26, 2010
-3-
Table 1. Sampling Locations.
Location Latitude Longitude River Mile Description Purpose
Old Riverview Road N41.3678° W81.6139° 16.20
Downstream of the confluence with Tinkers Creek
Reference Site
Upstream of Mill Creek
N41.4123° N41.4123°
W81.6364° W81.6364°
12.101 11.95
Upstream of the confluence with Mill Creek (I-480)
Trend Assessment
Downstream of Mill Creek N41.4179° W81.6446° 11.30
Downstream of the confluence with Mill Creek
Trend Assessment
Upstream of Southerly WWTC N41.4183° W81.6481° 10.95
Upstream of Southerly WWTC effluent discharge
NPDES Permit Required Site
Upstream of Southerly WWTC N41.4196° W81.6547° 10.75
Upstream of Southerly WWTC effluent discharge
Trend Assessment
Downstream of Southerly WWTC
N41.4214° N41.4242°
W81.6590° W81.6638°
10.302 10.10
Downstream of Southerly WWTC effluent discharge
Trend Assessment
Downstream of Southerly WWTC
N41.4199° N41.4271°
W81.6580° W81.6662°
10.45 9.70
Downstream of Southerly WWTC effluent discharge
NPDES Permit Required Site
Upstream of Big Creek
N41.4381° N41.4393° N41.4395°
W81.6680° W81.6713° W81.6754°
8.603 8.302 8.20
Upstream of the confluence with Big Creek
Trend Assessment
Downstream of Big Creek N41.4497° W81.6815° 7.00
Downstream of the confluence with Big Creek
Trend Assessment
1 HD and Water Chemistry Collection Site 2 The site at RM 10.30 has historically been the downstream of Southerly WWTC sampling location. The
site at RM 10.10 was added in 2006 because it is in an area more conducive to macroinvertebrate colonization due to the presence of a functional riffle and is also within the electrofishing zone. Both sites were sampled for macroinvertebrates in 2009.
3 Water chemistry was collected at RM 8.30 for the first two weeks until sampling location was moved to RM 8.60 to make use of functional riffle.

2009 Cuyahoga River Biological, Habitat and Water Quality Survey Results October 26, 2010
-4-
")
!(
!(
!(
!(
!(
!(
!(
!(
!(
!(
!(
!(
West Creek
Mill
Cre
ek
Cuyahoga River
Downstream FromBig Creek (RM 7.00)
Downstream FromSoutherly WWTC
(RM 10.10)
Downstream FromSoutherly WWTC
(RM 10.30)
Upstream FromSoutherly WWTC (RM 10.75)
Downstream FromMill Creek (RM 11.30)
Upstream FromMill Creek (RM 11.95)
Downstream FromTinkers Creek (RM 16.20)
Upstream FromBig Creek (RM 8.20)
Upstream ofBig Creek (RM 8.60)
Upstream ofSoutherly WWTC
(RM 10.95)
Downstream FromSoutherly WWTC
(RM 10.45)
Downstream ofSoutherly WWTC (RM 9.70)
NewburgNewburgHeightsHeights
ParmaParmaSevenSevenHillsHills
IndependenceIndependence
ValleyValleyViewView
GarfieldGarfieldHeightsHeights
ClevelandCleveland
BrooklynBrooklynHeightsHeights
CuyahogaCuyahogaHeightsHeights
GARFIELD
HARVARD
E 4 9 TH
GRANT
HARVARD
SNOW
E 71
ST
E 71
ST
E 93
RD
W 1
4TH
CROSSVIEW
BROADWAY
GRANGER
BRECKSVILLE
GRANGER
WAR
NER
BROADVI EW
BRECKSVILLE
E PLEASANT VALLEY
ROCKSIDE
W
RIDGEWOOD
CHESTNUT
E RIDGEWOOD
MILES
GRANTBROADWAY
HARVARD
E
SCHAAF
HARVARD
HARVARD
W PLEASANT VALLEY
ELL
A
TURNEY
W
SCHAAF
UV14
UV43
UV17
UV176
§̈¦77
§̈¦480
SOUTHERLYSOUTHERLYWWTCWWTC
Figure 1. Map of Cuyahoga River Study Area.
NEORSD Cuyahoga RiverElectrofishing & Benthic
Macroinvertebrate Survey Sites
!( Sample Site
!( NPDES Permit Required Site
Stream
Community−
0 0.3 0.60.15
Miles

2009 Cuyahoga River Biological, Habitat and Water Quality Survey Results October 26, 2010
-5-
Water Chemistry Sampling
Methods The water samples for this study were collected in-stream using two 4-liter
Cubitainers and two 473 mL plastic bottles. All of the bottles were individually filled in-stream. Each of the 473 mL plastic bottles was field preserved with either trace nitric acid or trace sulfuric acid, one of each for each sample. The Cubitainers were left unpreserved. All of the samples were placed into a cooler with a layer of ice in it. Also, the samples were in a locked vehicle when not attended. The samples were relinquished with a chain of custody to an authorized person in the NEORSD Analytical Services sample receiving area.
Field analysis included the use of either a Yellow Springs Incorporated (YSI) 556 MPS Multi-Parameter Water Quality Meter or a YSI 600XL Data Sonde Water Quality Meter, both of which measured dissolved oxygen, water temperature, specific conductance and pH at the time of sampling. A Hanna Meter (HI 98129) was utilized for pH when either of the YSI water quality meters did not meet the required calibration specifications for pH.
During the study, it was determined that the pH was being calibrated once per week and not daily as stated in the Manual of Ohio EPA Surveillance Methods and Quality Assurance Practice (Ohio Environmental Protection Agency [Ohio EPA], 2009). Therefore, some of the samples (most of the samples collected prior to August 14, 2009) have field pH measurements that did not follow the recommended methods, and the pH for those samples was not used for comparison to the WWH Ohio Water Quality Criteria found in Ohio Administrative Code 3745-01 (2002).
Water chemistry sampling was conducted once per week from July 7 to October 12, 2009. A total of forty parameters were analyzed for each sample. Water chemistry sampling was originally scheduled for only the first seven weeks (through August 19); however due to lower than expected fish scores, sampling continued until the end of the field season. For quality assurance purposes, 11 duplicates and field blanks should have been collected. As a result of an oversight during the extended period of sampling, however, only nine sample duplicates and eight field blanks were obtained.
The sample and the sample duplicate results were compared for thirty-eight of the forty individual parameters reported on the Certificate of Analysis. Only hardness and nitrate+nitrite were not compared because they are calculated from other parameters. The individual parameters were compared using the relative percent difference (or RPD) to try to discern any discrepancies between the

2009 Cuyahoga River Biological, Habitat and Water Quality Survey Results October 26, 2010
-6-
primary sample and the secondary (or duplicate) sample. The RPD is calculated using Formula 1:
Formula 1: Where X is the concentration of analyte in the primary sample. Whereas Y is the concentration of analyte in the secondary sample.
After an RPD was calculated for each analyte, differences greater than 30 percent were investigated as to the possible discrepancy. However, if the analyte results were less than ten times the practical quantitation limit, an RPD was not calculated because at very low concentrations slight differences in the concentrations cause the RPD value to be biased high.
The other studies included toxicity testing and year round bi-monthly sampling. Four toxicity tests occurred during 2009 in January, April, July and October. All sampling occurred as stated in the NEORSD Standard Operating Procedures identified as SOP-EA011 and SOP-EA012. The toxicity testing followed the Ohio EPA biomonitoring protocol (Ohio Environmental Protection Agency, 1998) and included sending a split sample to run a parallel test with a contract laboratory, EnviroScience, Incorporated (Stow, Ohio).
Results and Discussion No exceedences of the WWH Ohio Water Quality Criteria were noted during the 2009 water chemistry sampling in the Cuyahoga River. The Surface Water Condition Sampling Field Data Form and Certificate of Analysis sheets can be made available upon request, by contacting the NEORSD Water Quality and Industrial Surveillance (WQIS) department.
When the RPDs were calculated for the sample and sample duplicates, only two discrepancies were noted, see Table 2. The discrepancies could not readily be explained. The results from the sample and the sample duplicate are shown in the table, are considered to be accurate and should be averaged when used. The results from the field blanks appeared to be normal and did not imply any problems with the sample collection or handling methods.

2009 Cuyahoga River Biological, Habitat and Water Quality Survey Results October 26, 2010
-7-
A total of four chronic toxicity tests occurred at the upstream and downstream permit required sites during 2009. Three of the four toxicity tests showed that toxicity is still an impairment upstream from Southerly WWTC, see Table 3. Also interesting is that two of the three tests showed chronic toxicity for Pimephales promelas (Fathead Minnow) in the upstream sample, while the third upstream sample showed chronic toxicity for Ceriodaphnia dubia (Daphnia). This suggests there may have been different toxicants leading to the toxicity during the three tests. However, no exceedences of the WWH water quality criteria were noted during the toxicity testing or the bi-monthly sampling upstream and downstream of Southerly WWTC.
Table 3. The percent of affected organisms from the chronic toxicity testing completed up and downstream of Southerly WWTC.
Upstream Sample Downstream Sample Laboratory Date Test Initiated P. promelas C. dubia P. promelas C. dubia
Chronic Chronic Chronic Chronic Analytical Services January 12, 2009 10 % 100 % 10 % 0 %EnviroScience, Inc. January 12, 2009 5 % 100 % 0 % 0 %Analytical Services April 6, 2009 27.5 % 10 % 35 % 0 %EnviroScience, Inc. April 6, 2009 68 % 0 % 38 % 0 %Analytical Services July 6, 2009 0 % 0 % 0 % 0 %EnviroScience, Inc. July 6, 2009 0 % 0 % 0 % 0 %Analytical Services October 6, 2009 77.5 % 0 % 27.5 % 0 %EnviroScience, Inc. October 6, 2009 18 % 0 % 5 % 0 %
The Total Maximum Daily Loads [TMDL] for the Lower Cuyahoga River (Ohio Environmental Protection Agency [Ohio EPA], 2003) listed the impairments as organic enrichment, toxicity, low dissolved oxygen, nutrients and flow alteration. No observations of low dissolved oxygen were noted at any time during any of the sampling in 2009. As far as organic enrichment, the biological oxygen demand (BOD) results from the sampling conducted in support of the electrofishing and benthic macroinvertebrate surveys were all below 3.5 4 A wet weather day is defined as: greater than 0.10 inches of rain but less than 0.25 inches, samples collected that day and the following day are considered wet weather samples; greater than 0.25 inches, the samples collected that day and the following two days were considered wet weather samples. 5 Units are in micrograms per liter (µg/L).
Table 2. Cuyahoga River water quality discrepancies with results above the Practical Quantitation Limit.
River Mile
Date Collected Parameter Units Sample ID
Sample Result Duplicate ID
Duplicate Result
RPD Value
Wet Weather
Day4
8.60 08/04/09 Iron µg/L5 R-0908030003 1230 R-0908030009 680.8 57.48 No
16.20 09/21/09 Magnesium µg/L R-0909180010 17400 R-0909210002 492100 186.34 Yes

2009 Cuyahoga River Biological, Habitat and Water Quality Survey Results October 26, 2010
-8-
milligrams per liter (mg/L). There are currently no limits applicable for BOD results. The highest result was downstream of Southerly WWTC on April 28, 2009, which had a BOD result of 13.2 mg/L.
The TMDL for the Lower Cuyahoga River (Ohio EPA, 2003) suggested targets based on associations for phosphorus and nitrate+nitrite parameters, which were 0.12 mg/L and 1.42 mg/L, respectively. Only two samples from the upstream bi-monthly sampling met the target for nitrate+nitrite. None of the remaining 176 samples met the target value. The target for phosphorus was met in twenty-one percent of the 97 samples at the sites upstream of Southerly WWTC, and only five percent of the 81 samples collected at sites downstream of Southerly WWTC. These comparisons included all sampling results. Shown in Figures 2 and 3 are results from the Study Plan water chemistry sampling only. Although the graphs demonstrate that the nutrients increase downstream of Southerly WWTC it also indicates that the reference site and the other upstream locations could not meet the targets values set.
Figure 2. 2009 Cuyahoga River Average and Maximum Phosphorus Concentration by River Mile
0.000
0.100
0.200
0.300
0.400
0.500
0.600
6.007.008.009.0010.0011.0012.0013.0014.0015.0016.0017.00
River Mile
Con
cent
ratio
n (m
g/L
)
Average Phosphorus Concentration Maximum Phosphorus Concentration
TMDL Target Value

2009 Cuyahoga River Biological, Habitat and Water Quality Survey Results October 26, 2010
-9-
Habitat Assessment
Methods
To assess the habitat, a Qualitative Habitat Evaluation Index (QHEI) score was obtained for each of the electrofishing zones. The QHEI, developed by Ohio EPA, is used in conjunction with fish community assessments. A description of the QHEI can be found in the Methods for Assessing Habitat in Flowing Waters: Using the Qualitative Habitat Evaluation Index (QHEI) (Ohio Environmental Protection Agency [Ohio EPA], 2006). The index is based on several metrics, which include: stream substrate; in-stream cover; stream channel morphology; riparian and bank condition; pool and riffle quality; and stream gradient. These metrics characterize the physical attributes of a stream as they relate to the fish population and their habitat usage. QHEI sheets and the digital photo catalog for each site evaluated can be made available upon request, by contacting the WQIS department.
The TMDL for the Lower Cuyahoga River (Ohio EPA, 2003) has employed target scores for habitat assessment based upon QHEI scores all over the State of Ohio. A score less than 45 suggests that the habitat does not exist for the fish community to achieve the WWH criteria. A QHEI score of at least 60 suggests that the habitat exists in which the fish community may achieve the WWH criteria.
Figure 3. 2009 Cuyahoga River Average and Maximum Nitrate+Nitrite Results by River Mile
0.00
1.00
2.00
3.00
4.00
5.00
6.00
7.00
8.00
9.00
6.007.008.009.0010.0011.0012.0013.0014.0015.0016.0017.00
River Mile
Con
cent
ratio
n (m
g/L
)
Average Nitrate+Nitrite Concentration Maximum Concentration Nitrate+Nitrite
TMDL Target Value
2009 Cuyahoga River Biological, Habitat and Water Quality Survey Results October 26, 2010
-10-
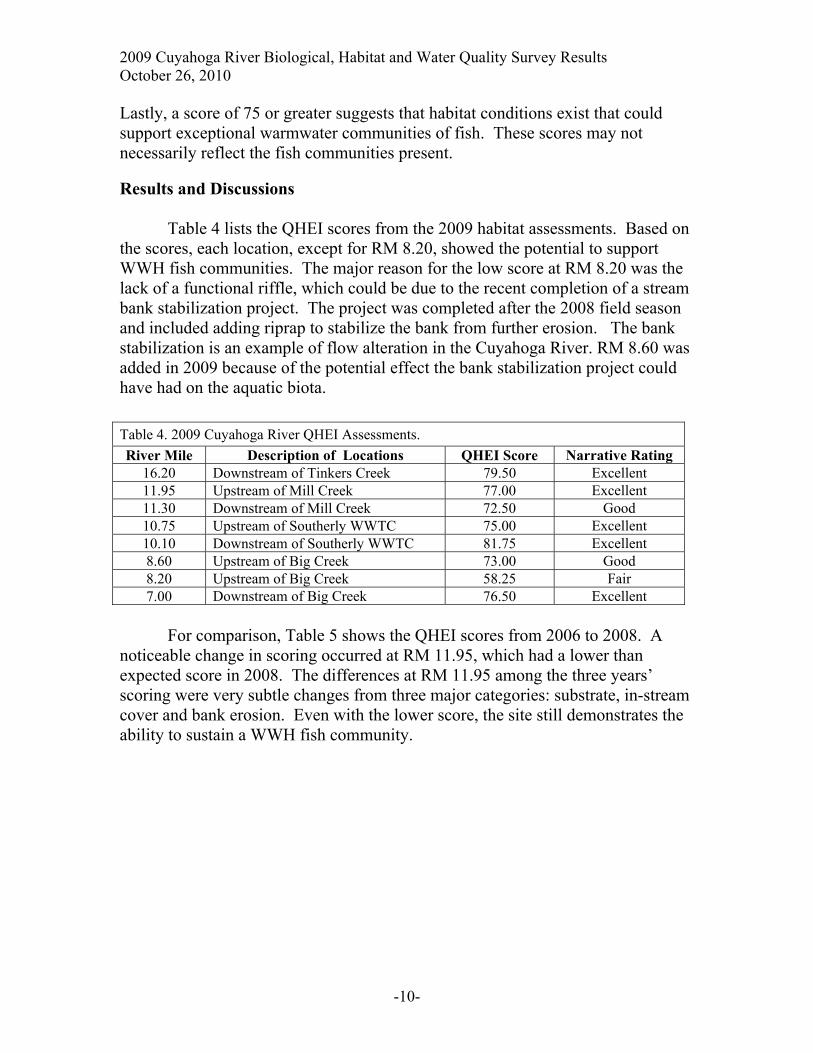
Lastly, a score of 75 or greater suggests that habitat conditions exist that could support exceptional warmwater communities of fish. These scores may not necessarily reflect the fish communities present.
Results and Discussions
Table 4 lists the QHEI scores from the 2009 habitat assessments. Based on the scores, each location, except for RM 8.20, showed the potential to support WWH fish communities. The major reason for the low score at RM 8.20 was the lack of a functional riffle, which could be due to the recent completion of a stream bank stabilization project. The project was completed after the 2008 field season and included adding riprap to stabilize the bank from further erosion. The bank stabilization is an example of flow alteration in the Cuyahoga River. RM 8.60 was added in 2009 because of the potential effect the bank stabilization project could have had on the aquatic biota.
For comparison, Table 5 shows the QHEI scores from 2006 to 2008. A
noticeable change in scoring occurred at RM 11.95, which had a lower than expected score in 2008. The differences at RM 11.95 among the three years’ scoring were very subtle changes from three major categories: substrate, in-stream cover and bank erosion. Even with the lower score, the site still demonstrates the ability to sustain a WWH fish community.
Table 4. 2009 Cuyahoga River QHEI Assessments. River Mile Description of Locations QHEI Score Narrative Rating
16.20 Downstream of Tinkers Creek 79.50 Excellent 11.95 Upstream of Mill Creek 77.00 Excellent 11.30 Downstream of Mill Creek 72.50 Good 10.75 Upstream of Southerly WWTC 75.00 Excellent 10.10 Downstream of Southerly WWTC 81.75 Excellent 8.60 Upstream of Big Creek 73.00 Good 8.20 Upstream of Big Creek 58.25 Fair 7.00 Downstream of Big Creek 76.50 Excellent

2009 Cuyahoga River Biological, Habitat and Water Quality Survey Results October 26, 2010
-11-
Electrofishing Methods To assess the Cuyahoga River fish communities, NEORSD has two boats outfitted with electroshocking equipment. The smaller of the two boats is a 14-foot Alweld Commercial Boat and the larger boat which is a 17-foot Coffelt boat. The boat used at each site was dependent upon the specific site conditions.
The sampling methods consisted of shocking all types of habitats within a zone that was 0.5 kilometers in length. Sampling was completed from upstream to downstream through a section until all habitats were carefully shocked, making sure that at least thirty minutes was spent shocking a site. Sampling was conducted when the river flow was less than 350 cubic feet per second, as recorded at the United States Geological Survey (USGS) gage station in Independence, Ohio (Station ID 04208000) and of uniform clarity. Table 6 below, shows the actual river mean daily flow for each assessment.
A more detailed description of the sampling methods can be found in Ohio EPA’s (1987a; 1987b) Biological Criteria for the Protection of Aquatic Life, Volumes II and III.
Table 5. Historical Cuyahoga River QHEI Scores. River Mile Site Locations 2006 2007 2008
16.20 Downstream of Tinkers Creek -- 78.75 81.75 11.95 Upstream of Mill Creek -- 75.00 67.50 11.30 Downstream of Mill Creek -- 77.50 77.75 10.75 Upstream of Southerly WWTC 75.00 75.75 78.00 10.10 Downstream of Southerly WWTC 71.50 71.00 76.00 8.20 Upstream of Big Creek -- -- 66.00 7.00 Downstream of Big Creek 66.50 73.00 76.50

2009 Cuyahoga River Biological, Habitat and Water Quality Survey Results October 26, 2010
-12-
Table 6. 2009 Dates of Sampling and the Corresponding Cuyahoga River Mean Daily Flow (reported in cubic feet per second)
Site RM Pass 1 Pass 2 Pass 3 Average Flow During Sampling
DS Tinkers Creek 16.20 08/17/09 09/15/09 - 252 257 254.5
US Mill Creek 11.95 08/17/09 09/15/09 - 252 257 254.5
DS Mill Creek 11.30 07/16/09 09/14/09 - 278 268 273
US SWWTC 10.75 07/14/09 09/11/09 10/15/09 328 284 310 307
DS SWWTC 10.10 07/14/09 09/11/09 10/15/09 328 284 310 307
US Big Creek 8.60 - 09/04/09 10/14/09 314 321 317.5
US Big Creek 8.20 07/14/09 09/04/09 10/14/09 328 314 321 321
DS Big Creek 7.00 07/14/09 09/04/09 10/14/09 328 314 321 321
All data is provisional and subject to revision by the USGS * Flows from sampling days were averaged.
During sampling, fish were collected, identified, weighed, and examined for the presence of any deformities, eroded fins, lesions and tumors (DELTs). All fish were then released to the waters from which they were collected, except for vouchers and any specimens that could not be easily identified in the field. The specimens that were difficult to identify were sent to The Ohio State University Museum of Biological Diversity for verification by the Curator and/or Associate Curator of Fish. Field data sheets for sampling are available upon request, by contacting the WQIS department.
The results that were obtained from electrofishing were evaluated using two Ohio EPA indices, the Index of Biotic Integrity (IBI) and the Modified Index of Well Being (MIwb). The IBI is made up of a total of 12 community metrics representing structural and functional attributes. The structural attributes are based upon fish community aspects such as fish numbers and diversity. Functional attributes are based upon fish community aspects such as feeding groups, pollution tolerances and specific disease symptoms. These metrics are individually scored by comparing the data collected at the survey site with values recorded from reference sites located in a similar geographical region. Ohio has a total of five different geographical regions; the Greater Cleveland area is located within the Erie/Ontario Drift and Lake Plain (or EOLP). The summation of the 12 individual metrics equals the IBI score, which corresponds to a narrative rating based upon the geographical region.

2009 Cuyahoga River Biological, Habitat and Water Quality Survey Results October 26, 2010
-13-
HnN
lognN
ie
i= −⎛⎝⎜
⎞⎠⎟
⎛⎝⎜
⎞⎠⎟
⎡
⎣⎢
⎤
⎦⎥∑
MIwb 0.5 lnN 0.5 lnB H(No.) H(Wt.)= + + +
The second index utilized by the Ohio EPA is the Modified Index of Well-being (MIwb). The MIwb, Formula 2 below, incorporates four fish community measures: numbers of individuals; biomass; and the Shannon Diversity Index (Formula 3 below) based on numbers and weight of fish. The result of the mathematical calculation is the MIwb score, which also corresponds to a narrative rating based upon the geographical region.
Formula 2:
N = Relative numbers of all species excluding species designated as highly tolerant, hybrids, or exotics
B = Relative weights of all species excluding species designated as highly tolerant, hybrids, or exotics
H(No.) = Shannon Diversity Index based on numbers H(Wt.) = Shannon Diversity Index based on weight
Formula 3: ni = Relative numbers or weight of species
N = Total number or weight of the sample
Results and Discussions
Table 7 presents the scoring for all sites surveyed during 2009. Lists of species, numbers, weights, pollution tolerances and incidence of anomalies for fish collected during the electrofishing passes at each site can be made available upon request to WQIS. All of the sites were in attainment for the MIwb criterion. Figure 4, shows the trends of the MIwb over the last several years. Only five of the sites met the IBI criterion. Overall, RMs 7.00, 8.20 and 10.10 were only in partial attainment because they failed to meet the IBI criteria.

2009 Cuyahoga River Biological, Habitat and Water Quality Survey Results October 26, 2010
-14-
Figure 4. The MIwb Trend Assessment on the Cuyahoga River 2006-2009
7
7.5
8
8.5
9
9.5
10
67891011121314151617
River Mile
MIw
b Sc
ore
2006 2007 2008 2009
Warmwater Habitat Attainment*
*Non-significant departure (≤0.5 MIwb Units) from applicable criterion
The three most upstream sites (RMs 16.20, 11.95 and 11.30) had only a total of two passes completed during the 2009 field season. This was due to the new 14-foot Alweld Commercial Boat not being ready at the beginning of the field season, which delayed the start of sampling for those sites. Toward the end of the
Table 7. 2009 Cuyahoga River IBI and MIwb Scores IBI Scores MIwb Scores
Site RM Pass
1 Pass
2 Pass
3 Average Pass
1 Pass
2 Pass
3 Average DS Tinkers Creek 16.20 44 46 - 45 9.7 10.0 - 9.9 US Mill Creek 11.95 38 38 - 38 8.9 8.6 - 8.8 DS Mill Creek 11.30 44 44 - 44 9.4 9.6 - 9.5 US SWWTC 10.75 38 40 30 36 9.2 9.5 8.7 9.1 DS SWWTC 10.10 26 34 32 31 8.2 9.7 9.7 9.2 US Big Creek 8.60 - 40 40 40 - 8.9 9.0 9.0 US Big Creek 8.20 24 32 32 29 8.9 9.2 8.6 8.9 DS Big Creek 7.00 24 36 32 31 8.5 9.1 7.9 8.5 bold = meets WWH criterion [IBI ≥40; MIwb ≥8.7] italics = non-significant departure from WWH criterion [IBI ≥36; MIwb ≥8.2]

2009 Cuyahoga River Biological, Habitat and Water Quality Survey Results October 26, 2010
-15-
sampling season, the river conditions (river flow and visibility) did not allow for an additional pass at these sites.
It was noted that the three sites downstream of Southerly WWTC sampled during the first pass had lower scores than any other results obtained during the 2009 sampling. It was never determined what caused the lower scores; the next sampling event showed increases by at least eight IBI units at all three sites. The Southerly WET Test for July 2009, which is when the first electrofishing pass was completed, demonstrated no chronic toxicity in the river. The habitat may have lead to the lower early IBI scores at RM 10.10 and 8.20, which both lacked a functional riffle. According to the River Continuum Concept (RCC), changes to the stream, such as temperature, riparian influence, substrate, flow or food can create a shift of the biological communities (Vannote, Minshall, Cummins, Sedell, & Cushing, 1980). Specific changes in the study area include the habitat modification at RM 8.30 and the improvement of biological communities at the mouth of Mill Creek, as identified in NEORSD (2010). The recent stream changes in the lower Cuyahoga River may have been enough to create a shift in the fish community which had not yet fully reestablished at the sampling sites. Also, when comparing the first pass of 2008 scoring to the first pass 2009 scoring it was noted that the flow was greater in 2008 and fewer numbers of fish were collected at all three sites. The fish community in the first pass in 2009 also appeared to have a greater number of pollution tolerant fish and a similar amount of pollution sensitive fish as the first pass in 2008.
Figure 5 shows the percent of total fish which were either moderately intolerant or intolerant to pollution for both 2008 and 2009. The 2008 scores also include the Ohio EPA data, as indicated. As the figure suggests, the proportion of sensitive fish in 2009 is in most cases similar to the 2008 data.

2009 Cuyahoga River Biological, Habitat and Water Quality Survey Results October 26, 2010
-16-
Figure 5. NEORSD and Ohio EPA Average Proportion of Fish Moderately Intolerant or Intolerant to Pollution
from 2008 and 2009
0.0
10.0
20.0
30.0
40.0
50.0
60.0
RM 16.20 RM 11.95 RM 11.30 RM 10.75 RM 10.10 RM 8.60 RM 8.20 RM 7.00
River Mile
Perc
ent M
oder
atel
y In
tole
rant
or I
ntol
eran
t Fi
sh S
peci
es
2008 2009* Contains one sample from the Ohio EPA 2008 data
**
*
Noted was a decrease in scores at RM 10.75 for the third electrofishing pass. The third pass occurred in October, just after the chronic toxicity testing. The chronic toxicity test demonstrated potential toxicity for P. promelas in the upstream sample. Although the cause for this toxicity is unknown, it may have had an effect on the electrofishing score. No scores upstream of RM 10.75 were obtained in October, so it could not be determined if the fish communities further upstream were also affected.
Two species of fish were collected on the Cuyahoga River in 2009 that had not been collected in the past. Noturus flavus (Stonecat Madtom) and Gambusia affinis (Western Mosquitofish) were both collected downstream of the Southerly WWTC, at RMs 8.60 and 10.10 respectively. N. flavus was also collected upstream of Southerly WWTC, at RM 11.95. G. affinis is a livebearer that was introduced to Michigan in the late 1940s, whereas N. flavus has a long history throughout Ohio (Trautman, 1981). N. flavus is a common intolerant species that is typically an indicator of a healthy smallmouth bass population, and is noted for being intolerant to silt and solids (Trautman, 1981).
Macroinvertebrate Sampling Methods
Macroinvertebrates were sampled for a six-week period in 2009 using

2009 Cuyahoga River Biological, Habitat and Water Quality Survey Results October 26, 2010
-17-
modified multiplate Hester-Dendy (HD) samplers. A replicate of five artificial substrate samplers were affixed to a cinder block and deployed at each location. The HD sampler was used to conduct a quantitative assessment. A qualitative assessment was also conducted, in accordance with Ohio EPA protocols (OEPA, 1987b). The qualitative assessment was completed during retrieval of the HD, at which time all available habitats were actively sampled with a dip net. A Marsh-McBirney FloMate Model 2000 Portable Flow Meter, which measures velocity in feet per second (fps), was used during deployment and retrieval of the HD to measure stream current.
The overall aquatic macroinvertebrate community was evaluated using Ohio EPA’s Invertebrate Community Index (ICI). The ICI consists of ten community metrics based on drainage, each with four different scoring categories. Metrics 1-9 are based on the quantitative sample, while Metric 10 is based on the number of Ephemeroptera (Mayflies), Plecoptera (Stoneflies) and Trichoptera (Caddisflies) in the qualitative sample. Metric 10 is also referred to as the EPT taxa. The total of the ten individual metric categories determine the ICI score. The higher the ICI score, the less of a deviation from relatively unimpacted reference sites utilized by the Ohio EPA for each eco-region.
Quantitative and qualitative macroinvertebrate samples were shipped to EA Engineering, Science and Technology, Incorporated (EA Engineering), located in Deerfield, Illinois, for identification and enumeration. Specimens were identified to the lowest practical taxonomic level, as defined by Ohio EPA (1987a), when life stage and condition allowed. The taxa lists and enumerations are available upon request to WQIS.
To obtain the most accurate ICI results, some deployment recommendations should be adhered to. Most notably is that during deployment, the current over the HD needs to be greater than or equal to 0.3 fps. This is because the stream flow over the HD has been determined to have one of the greatest influences on the macroinvertebrate community represented, second to only water quality (DeShon, 1995). Also, similar habitats should be selected when deploying the HDs for greater comparability (United States Environmental Protection Agency, 1990). By following these guidelines it allows comparison of the ICI scoring and can help identify trends.
During the 2009 field season, NEORSD changed the methods for installation and retrieval of the HDs to better conform to the methods used by the Ohio EPA. These changes included tying the HDs to the cinder block with sash cord instead of zip-tying the blocks together then zip-tying them to the block. The HDs were also no longer anchored into the sediment with rolled steel. Instead, the block was worked into the sediment and then the sediment was replaced around

2009 Cuyahoga River Biological, Habitat and Water Quality Survey Results October 26, 2010
-18-
the cinder block so that it would stay in place. The final change to the methods was that the HD was not dissembled in the field. The individual HDs were placed directly into a container, preserved and then shipped to EA Engineering for processing.
Results and Discussions The results from the 2009 sampling are summarized in Table 9. All sites were in attainment of the WWH ICI criterion for macroinvertebrates, for the second year in a row. The percentage of sensitive organisms listed in the table is the percentage of intolerant and moderately intolerant organisms in the quantitative sample. The sensitive organisms comprised at least one-third to almost half of the organisms in the sample. It is important to note that flow over all of the HDs was greater than 0.3 fps and the HDs were placed in similar habitats.
Table 9. Summary of 2009 Cuyahoga River Macroinvertebrate Collections.
River Mile
Retrieval Date
ICI Score1
Relative Density
(Organisms per square Foot)
Percentage of Sensitive Organisms
Total Quantitative
Taxa
Total Qualitative
Taxa Notable Collections
16.20 08/18/09 36 1852.4 49% 17 43 Boyeria grafiana 11.95 08/18/09 38 1005.4 36% 27 34 11.30 08/17/09 36 1275.8 33% 27 30 Chimarra obscura 10.75 08/17/09 42 1809.0 38% 32 39 Potamilus alatus 10.30 08/14/09 40 1860.6 44% 28 35 10.10 08/17/09 38 1734.8 39% 29 32 8.60 08/27/09 36 1418.0 36% 34 41 8.30 08/14/09 34 1174.8 33% 37 21 7.00 08/14/09 42 1146.4 42% 26 35 Polycentropus sp.
1 The ICI Criterion for WWH is ≥ 34 units.
The modifications to the sampling methods may have had a significant
effect on the densities of the organisms obtained on the quantitative samples. Although the NEORSD 2008 scores were still comparable with the 2008 Ohio EPA scores using the previous methods, the densities were not. At all comparable sites, the 2008 Ohio EPA densities were at least double the 2008 NEORSD densities. The density differences between the samples collected by NEORSD in 2009 were, on average, 252 percent greater than in 2008. This comparison is limited since that it can not account for any changes between the two years, such as: slight variations in sampling location; the number of wet weather days; retrieval dates; and the community structure.

2009 Cuyahoga River Biological, Habitat and Water Quality Survey Results October 26, 2010
-19-
The community structure is shown in the Figure 6. The figure shows that each sample had at least 64 percent Ephemeroptera, Trichoptera and the Tribe Tanytarsini (Midges). Since these taxa typically dominate the reference site samples, this indicates the continuation from the 2008 scores of a healthy benthic macroinvertebrate community. Five of the sites had lower ICI scores in 2009 than in 2008, and only two sites had an increase in scores. However, between 2008 and 2009, none of the sites had a difference in scores of more than four ICI units, which is considered non-significant departure in scores between samples.
Figure 6. Benthic Macroinvertebrate Community Composition for the Cuyahoga River 2008 and 2009
0%
10%
20%
30%
40%
50%
60%
70%
80%
90%
100%
7.008.308.6010.1010.3010.7511.3012.1016.20
River Mile
Perc
ent
Percent Mayflies Percent Caddisflies Percent Tanytarsini Midges Percent Other Organisms
The notable macroinvertebrate collections of 2009 include several different taxonomic groups. Chimarra obscura (Fingernet Caddisfly) and Polycentropus sp. (Tube Maker Caddisfly) were only found at one location each, RM 11.30 and 7.00, respectively, and they are both moderately intolerant to pollution. Boyeria grafiana (Ocellated Darner) was only found at RM 16.20 and is a coldwater taxon that is moderately intolerant to pollution. Potamilus alatus (Pink Heelsplitter) is a freshwater mussel, which is an indicator of good water quality because it tends to be sensitive to pollution and has a complex life cycle. Only two live P. alatus were found during 2009 sampling at RM 10.75; however, some relic shells were also noted at RM 8.60. Part of the mussel’s life cycle includes being parasitic on a fish host species; P. alatus uses Aplodinotus grunniens (Freshwater Drum). A.

2009 Cuyahoga River Biological, Habitat and Water Quality Survey Results October 26, 2010
-20-
grunniens was found at the majority of sites (RMs 16.20, 11.30, 10.75, 10.10, 8.60, 8.20) during the 2009 electroshocking assessments.
Conclusions
Table 10 lists the attainment status, as indicated by NEORSD sampling results. Due to potential habitat limitations at RM 8.20, this was the first sampling season for RM 8.60. The OAC (2002) states that the sampling results of the aquatic biota are a direct measure of attainment. So the sites that are in full attainment meet the WWH criteria. The partial attainment status indicates that one of the aquatic assemblages needs some improvement in order to reach full attainment status.
Although all of the sampling sites for the fish communities were in attainment for the MIwb criteria, the IBI scores at three of the sites were lower than anticipated after the 2008 sampling season. The IBI scores for RM 10.10, 8.30 and 7.00 did not meet the applicable criteria. It was stated that the first pass had lower scores than that of the other passes, however, the sites still would not have been in attainment even if the first passes had been discarded.
The RCC is a possible explanation of why the 2009 fish community results were lower than the 2008 results. The positive and negative alterations within the study area could have displaced the aquatic assemblages and the fish community did not have time to reestablish at the sampling locations. However, the macroinvertebrate communities are quick to respond to environmental changes (Ohio EPA, 1987a), and their quick response may explain why the scoring was similar to the attainment results received in 2008.
Table 10. Attainment Status of the Cuyahoga River Sites in 2009, as indicated by NEORSD sampling results.
River Mile Attainment Status Average IBI Score
Average MIwb Score
ICI Score Relative Location Sampling Reason
16.20 FULL 45 9.9 36 Downstream Tinkers Creek Reference Site
11.95 / 12.10 FULL 38 8.8 38 Upstream Mill Creek Trend Assessment
11.30 FULL 44 9.5 36 Downstream Mill Creek Trend Assessment
10.75 FULL 36 9.1 42 Upstream Southerly WWTC Trend Assessment
10.30 * -- -- 40 Historical Downstream of Southerly WWTC Trend Assessment
10.10 PARTIAL 31 9.2 38 Downstream Southerly WWTC Trend Assessment
8.60 FULL 40 9.0 36 Downstream Southerly WWTC Initial Year
8.30 / 8.20 PARTIAL 29 8.9 34 Upstream Big Creek Trend Assessment
7.00 PARTIAL 31 8.5 42 Downstream Big Creek Trend Assessment
Warmwater Habitat Criteria ≥40 ≥8.7 ≥34 Nonsignificant Departure from Criteria ≤4 ≤0.5 ≤4
* Site is in attainment of ICI criterion, however the fish community was not assessed at this location.

2009 Cuyahoga River Biological, Habitat and Water Quality Survey Results October 26, 2010
-21-
The Total Maximum Daily Loads for the Lower Cuyahoga River (Ohio EPA, 2003) lists the primary causes of impairment for the Cuyahoga River as organic enrichment, toxicity, low dissolved oxygen, nutrients and flow alteration. Based on the QHEI scoring, all of the sites, except for RM 8.20, appeared to have sufficient habitat to support WWH populations of aquatic biota. No exceedences of the applicable water quality standards were noted from the water chemistry sampling. This sampling showed that low dissolved oxygen and other tested parameters never exceeded the water quality standards. Habitat degradation is still a problem downstream of the study area within the ship channel. However, all of the QHEI scores in the study area, excluding RM 8.20, met or exceeded the target habitat score. At the sites upstream of the Southerly WWTC, results showed the presence of chronic toxicity, nutrient impairment and, potentially, a slight organic impairment. The chronic toxicity was demonstrated by the percent affected organisms in the testing. The nutrients could potentially be problematic for the entire stream if the results of the sampling are compared to the association target scores (OEPA, 2003). The sites upstream of Southerly WWTC and RM 8.60 results indicate full attainment even with the nutrient results above the target values. This may demonstrate that the nutrients are not the underlying cause of non-attainment, within the study area.
Since 2006 NEORSD has seen more diversity of fish and macroinvertebrates within the study area of the Cuyahoga River. In total, 15 new species of fish and 31 new species of macroinvertebrates have been collected in the last three years within the study area. Including the 2009 notable additions of N. flavus and the P. alatus. But also species like Notropis dorsalis (Bigmouth Shiner), Notropis volcellus (Mimic Shiner), Chimarra obscura (Fingernet Caddisfly), Neureclipsis sp.(Trumpetnet Caddisfly) and Polycentropus sp. (Trumpetnet Caddisfly).
The aquatic assemblages in the study area suggest that the river is in good health, however improvement in the fish community is still needed for full attainment at some of the sampling locations. Chemical monitoring, biological assessments and continued toxicity testing should continue in 2010 to further evaluate the study area. In addition NEORSD is committed to improving its watersheds through environmental stewardship, which includes: an environmental monitoring program, the recent undertaking of becoming a regional stormwater authority, future plant upgrades to Southerly WWTC, and additional plans for the reduction and/or elimination of combined sewer overflows.

2009 Cuyahoga River Biological, Habitat and Water Quality Survey Results October 26, 2010
-22-
References DeShon, J. E. (1995). Development and Application of the Invertebrate
Community Index (ICI). In W. Davis and T. Simon (Ed.), Biological assessment and criteria, tools for water resource planning and decision making (pp. 217-243). Boca Raton, FL: Lewis Publishers.
Northeast Ohio Regional Sewer District. (2009a). 2008 Cuyahoga River
Electrofishing & Benthic Macroinvertebrate Surveys. Cleveland, OH: NEORSD, Water Quality and Industrial Surveillance.
Northeast Ohio Regional Sewer District. (2009b). 2009 Cuyahoga River
Chlorophyll a Sampling Results. Cleveland, OH: NEORSD, Water Quality and Industrial Surveillance.
Northeast Ohio Regional Sewer District. (2010). 2009 Upstream of NEORSD
CSO Areas Biological, Water Quality and Habitat Survey Results. Cleveland, OH: NEORSD, Water Quality and Industrial Surveillance.
Ohio Administrative Code 3745-01. (2002). Ohio Environmental Protection Agency. (1987a). Biological criteria for the
protection of aquatic life: Volume II. Users manual for biological field assessment of Ohio surface waters. Columbus, OH: Division of Water Quality Monitoring and Assessment. (Updated January 1988; September 1989; November 2006; August 2008).
Ohio Environmental Protection Agency. (1987b). Biological criteria for the
protection of aquatic life: Volume III. Standardized biological field sampling and laboratory methods for assessing fish and macroinvertebrate communities. Columbus, OH: Division of Water Quality Monitoring and Assessment,. (Updated September 1989; March 2001; November 2006; and August 2008.)
Ohio Environmental Protection Agency. (1998). Reporting and Testing Guidance
for Biomonitoring Required by the Ohio Environmental Protection Agency. Division of Surface Water. Columbus, OH.
Ohio Environmental Protection Agency. (2003). Total Maximum Daily Loads for
the Lower Cuyahoga River. Columbus, OH: Ohio EPA, Division of Surface. Water Standards and Technical Support Section.

2009 Cuyahoga River Biological, Habitat and Water Quality Survey Results October 26, 2010
-23-
Ohio Environmental Protection Agency. (2006). Methods for Assessing Habitat in Flowing Waters: Using the Qualitative Habitat Evaluation Index (QHEI) (Ohio EPA Technical Bulletin EAS/2006-06-1). Columbus, OH: Division of Surface Water; Division of Ecological Assessment Section.
Ohio Environmental Protection Agency. (2009). Manual of Ohio EPA
Surveillance Methods and Quality Assurance Practice. Columbus, OH: Division of Surface Water; Division of Environmental Services.
Trautman, Milton. (1981). The Fishes of Ohio. Revised Edition. Columbus OH:
The Ohio State University Press. United States Environmental Protection Agency. (1990). Macroinvertebrate Field
and Laboratory Methods for Evaluating the Biological Integrity of Surface Waters (EPA/600/4-90/030). Washington DC: Office of Research and Development.
Vannote, R. L., Minshall, G. W., Cummins, K. W., Sedell, J. R., & Cushing, C. E.
(1980). The river continuum concept. Can. J. Fish. Aquat. Sci. 37, 130-137.