Embed Size (px)
Citation preview

Investor Update
F. Hoffmann-La Roche Ltd 4070 Basel Switzerland
Investor Relations email: [email protected]
Tel. +41-(0)61-688 88 80 Fax +41-(0)61-691 00 14 http://ir.roche.com
1/29
Basel, 22 July 2010
Roche posts good half year results
Operating profit increases significantly faster than sales – double-digit growth for Core Earnings per
share – outlook confirmed
Group
• Group first-half sales up 5% in local currencies (3% in Swiss francs, 7% in US dollars) to 24.6 billion Swiss francs.
• Operating profit (before exceptional items) up significantly, rising 11% in local currencies (10% in Swiss francs) to 8.8 billion Swiss francs — again advancing faster than sales.
• Net income rises 37% compared with first half of 2009; lower exceptional expenses relating to integration of Genentech.
• Core earnings per share up 11% in local currencies, 9% in Swiss francs. • Full-year outlook for 2010 confirmed.
Key figures (January-June) In millions of CHF % change As % of sales
2010 2009 In CHF In LC1 2010 2009
Sales 24,636 24,006 +3 +5 100.0 100.0
Research and development 4,471 4,518 -1 +1 18.1 18.8
Operating profit before exceptional items 8,756 7,970 +10 +11 35.5 33.2
Operating free cash flow 6,426 6,778 -5 -4 26.1 28.2
Net income attributable to Roche shareholders (before exceptional items) 5,653 5,213 +8
Net income 5,565 4,051 +37 22.6 16.9
Core Earnings per share (CHF) 6.91 6.32 +9 +11 1 LC= local currencies
2/29
Pharma
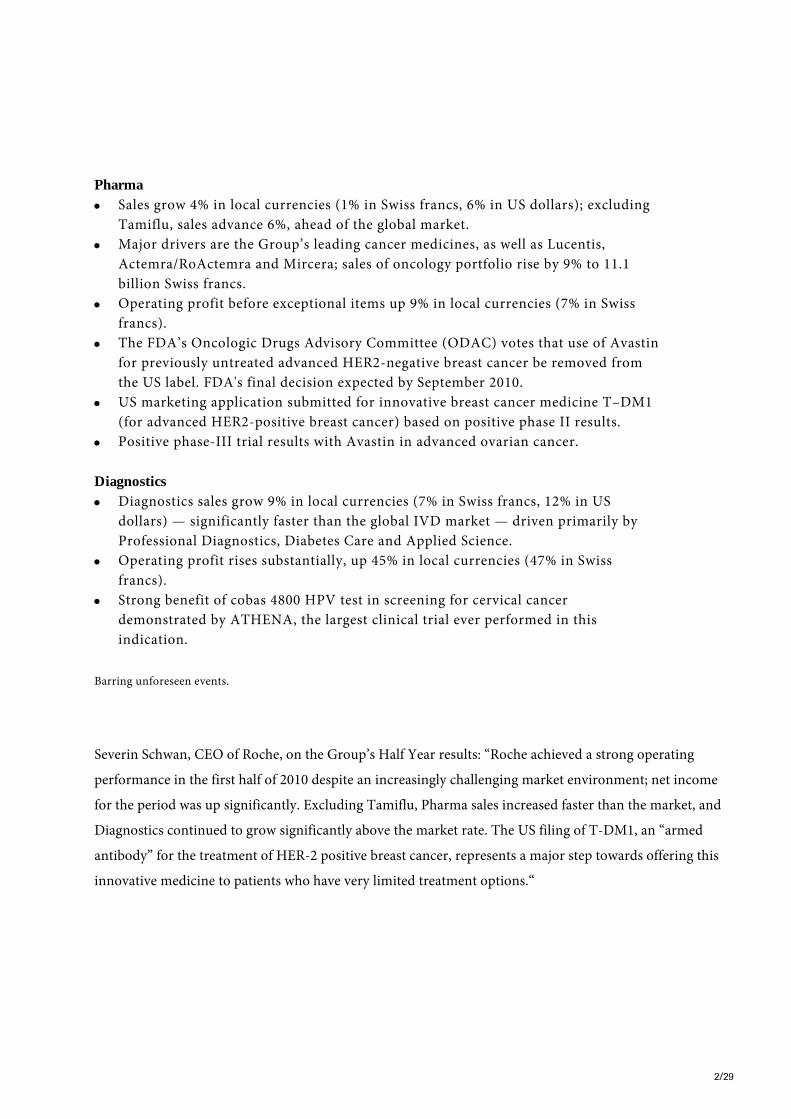
• Sales grow 4% in local currencies (1% in Swiss francs, 6% in US dollars); excluding Tamiflu, sales advance 6%, ahead of the global market.
• Major drivers are the Group’s leading cancer medicines, as well as Lucentis, Actemra/RoActemra and Mircera; sales of oncology portfolio rise by 9% to 11.1 billion Swiss francs.
• Operating profit before exceptional items up 9% in local currencies (7% in Swiss francs).
• The FDA’s Oncologic Drugs Advisory Committee (ODAC) votes that use of Avastin for previously untreated advanced HER2-negative breast cancer be removed from the US label. FDA's final decision expected by September 2010.
• US marketing application submitted for innovative breast cancer medicine T–DM1 (for advanced HER2-positive breast cancer) based on positive phase II results.
• Positive phase-III trial results with Avastin in advanced ovarian cancer. Diagnostics
• Diagnostics sales grow 9% in local currencies (7% in Swiss francs, 12% in US dollars) — significantly faster than the global IVD market — driven primarily by Professional Diagnostics, Diabetes Care and Applied Science.
• Operating profit rises substantially, up 45% in local currencies (47% in Swiss francs).
• Strong benefit of cobas 4800 HPV test in screening for cervical cancer demonstrated by ATHENA, the largest clinical trial ever performed in this indication.
Barring unforeseen events.
Severin Schwan, CEO of Roche, on the Group’s Half Year results: “Roche achieved a strong operating
performance in the first half of 2010 despite an increasingly challenging market environment; net income
for the period was up significantly. Excluding Tamiflu, Pharma sales increased faster than the market, and
Diagnostics continued to grow significantly above the market rate. The US filing of T-DM1, an “armed
antibody” for the treatment of HER-2 positive breast cancer, represents a major step towards offering this
innovative medicine to patients who have very limited treatment options.“

3/29
Roche Group
Good half-year results
The Roche Group posted strong operating results in the first half of 2010. Group sales grew by 5% in local
currencies (3% in Swiss francs; 7% in US dollars) to 24.6 billion Swiss francs. The Pharmaceuticals Division
increased its sales by 4% in local currencies (1% in Swiss francs; 6% in US dollars) to 19.4 billion Swiss
francs. Demand for the cancer drugs Avastin, MabThera/Rituxan, Herceptin, Xeloda and Tarceva
continued to show strong growth. Overall sales of oncology products rose 9% in local currencies in the first
half year, enabling Roche to solidify its leading market position in this segment. Other major growth drivers
in the Pharmaceuticals Division included Lucentis in ophthalmology, Actemra/RoActemra for rheumatoid
arthritis and Mircera for anemia. These positive factors more than offset the expected significant decline in
Tamiflu sales. Excluding Tamiflu, sales growth was 6% in local currencies, again ahead of market growth.
The Diagnostics Division expanded its market leadership as sales reached 5.3 billion Swiss francs in the first
six months of 2010, a 9% growth rate in local currencies (7% in Swiss francs; 12% in US dollars).
This strong growth was led by the Professional Diagnostics unit’s immunoassay business and Diabetes
Care’s Accu-Chek Aviva, Accu-Chek Performa and newly launched Accu-Chek Mobile blood glucose
monitoring systems, followed by Applied Science with strong growth in the cell analysis segment.
The Group’s operating profit before exceptional items increased significantly by 11% in local currencies
(10% in Swiss francs), again substantially above sales growth. This rise was driven by the growth in sales and
by further productivity improvements. The Pharmaceuticals Division improved its operating profit (before
exceptional items) by 9% in local currencies and 7% in Swiss francs to 8.0 billion Swiss francs, due primarily
to higher sales and cost synergies from the Genentech integration. The Diagnostics Division’s operating
profit grew substantially, advancing 45% in local currencies and 47% in Swiss francs to 947 million Swiss
francs, due mainly to strong sales growth and ongoing programmes to increase operational efficiency.
Group net income increased 37% to 5.6 billion Swiss francs, primarily as a result of the much lower
exceptional charges incurred in respect of the Genentech transaction in the first half of 2010 compared with
2009. Excluding exceptional items, Group net income attributable to Roche shareholders rose 8% in Swiss
francs. Core earnings per share, which does not include exceptional items or amortisation and impairment
of intangible assets, increased 11% in local currencies (9% in Swiss francs).
The Group’s operating free cash flow remained very solid at 6.4 billion Swiss francs. Roche is accelerating
repayment of the 48.2 billion Swiss francs borrowed on the capital market to finance the acquisition of all
outstanding shares of Genentech in the first half of 2009. On 30 June 2010, 27% of the notes and bonds had

4/29
already been repaid. Furthermore, in the second half of 2010 Roche will also repay, ahead of
schedule, the 2.5 billion US dollar note due 1 March 2012. By the end of 2010 Roche will thus have repaid
one third of the debt incurred to finance the Genentech transaction.
Full-year outlook for 2010 confirmed
Despite lower Tamiflu sales (expected to total 1 billion Swiss francs in the current year, down from 3.2
billion Swiss francs in 2009) and the more challenging market environment, Roche confirms its full-year
outlook for 2010 on the basis of the positive half-year results.
Barring unforeseen events, Roche expects local currency sales growth in the mid-single-digit range for the
Group and the Pharmaceuticals Division in 2010 (excluding Tamiflu sales). For the Diagnostics Division,
Roche expects to grow significantly above the market.
Roche is also aiming for double-digit growth in core earnings per share at constant exchange rates.
Pharmaceuticals Division
Key figures In millions
of CHF
% change
in CHF
% change in
local currencies
% of
sales
Sales 19,386 1 4 100
– United States 7,372 -2 2 38
– Western Europe 5,044 -3 1 26
– Japan 2,061 -6 -6 11
– International* 4,909 16 14 25
Operating profit before exceptional items 8,009 7 9 41.3
Operating free cash flow 6,123 -6 -4 31.6
Research and development 4,036 -1 2 20.8 *Asia–Pacific, CEMAI, Latin America, Canada, Others
Sales by the Pharmaceuticals Division in the first half-year rose 4% in local currencies (1% in Swiss francs;
6% in US dollars) to 19.4 billion Swiss francs, with the growth of key products more than offsetting

5/29
significantly lower sales of Tamiflu, CellCept and NeoRecormon/Epogin, as well as the initial effects of US
healthcare reforms and European austerity measures. The primary growth contributors were Avastin,
MabThera/Rituxan, Herceptin, Lucentis, Xeloda and Actemra/RoActemra. Excluding Tamiflu, the
division’s sales increased 6% in local currencies, compared with a global pharmaceuticals market growth
rate of almost 5%1.
Sales growth was recorded in all key regions except Japan. An increase of 2%2 in the US reflects significantly
lower sales of CellCept and Tamiflu , and initial healthcare reform impacts affecting all major products.
Slower growth in Western Europe (1%) was due primarily to markedly lower sales of Tamiflu and
NeoRecormon and the effects of the first government austerity measures introduced in Greece, Spain and
other countries in the second quarter. Excluding Tamiflu, sales in the US and Western Europe increased 4%
and 5%, respectively, ahead of the corresponding market growth rates. A decline in sales of 6% in Japan
reflects both lower Tamiflu sales and the impact of revised National Health Insurance reimbursement prices
that came into effect in April; excluding Tamiflu, Japanese sales grew 2% in a flat market. Double-digit sales
growth in the International region (14%, or 11% excluding Tamiflu) was driven by increased demand for
key medicines, especially in emerging markets.
Operating profit before exceptional items again grew faster than sales, advancing 9% in local currencies
(7% in Swiss francs) to 8.0 billion Swiss francs. The corresponding margin increased 2.2 percentage points
to 41.3%, driven by good sales growth and efficiency measures, including synergies from the merger with
Genentech. Excluding impairment of intangible assets, research and development expenses declined 1% in
local currencies versus the prior-year period, despite continued investment in the Group’s strong late-stage
pipeline and costs associated with the discontinuation of the ocrelizumab rheumatoid arthritis programme.
The division’s operating free cash flow in the first half-year remained strong at 6.1 billion Swiss francs. The
decrease of 4% in local currencies compared with the year-earlier period primarily reflects the payment of
certain large year-end 2009 accruals, including employee retention and severance payments in 2010 and
higher royalty payments relating to strong Tamiflu sales in the second half of 2009.
1 Pharmaceutical market growth according to IMS (to end of March 2010). 2Unless otherwise stated, all growth rates are in local currencies.

6/29
The Pharmaceuticals Division is on track to achieve its goal of pre-tax annual synergies of approximately
1 billion Swiss francs by 2011. Synergies of 800 million Swiss francs are expected in 2010.
Sales review - selected key products
Total US Western Europe Japan International
CHF m % CHF
m
% CHF m % CHF
m
% CHF m %
Avastin 3,393 14% 1,732 7% 946 13% 276 52% 439 29%
MabThera/ Rituxan
3,301 9% 1,585 5% 864 10% 122 6% 730 20%
Herceptin 2,806 8% 826 6% 1,097 9% 144 -17% 739 16%
Pegasys 869 5% 208 4% 191 -8% 57 -12% 413 16%
Xeloda 732 19% 270 26% 159 8% 60 82% 243 11%
Tamiflu 710 -31% 201 -34% 3 -99% 142 -53% 364 78%
CellCept 702 -23% 159 -58% 240 1% 28 14% 275 4%
Lucentis 697 27% 697 27% - - - - - -
NeoRecormon/Epogin
677 -13% - - 266 -21% 225 -9% 186 -2%
Tarceva 674 8% 258 6% 232 4% 41 28% 143 14%
Sales of Avastin (bevacizumab), for advanced colorectal, breast, lung and kidney cancer, and for relapsed
glioblastoma (a type of brain tumour), rose 14% to 3.4 billion Swiss francs. Sustained growth in all regions,
particularly in Western Europe (up 13%) and the United States (7%), continued to be driven by uptake in
colorectal, breast and/or lung cancer, the product’s largest indications. Apart from the United States, where
penetration rates are already high, patient share in all three indications continues to grow strongly.
First-half sales by Chugai in Japan were particularly strong (up 52%), driven by sustained growth in
colorectal cancer and the ongoing launch of Avastin for non-small cell lung cancer.
In July the FDA’s Oncologic Drugs Advisory Committee (ODAC) votes that use of Avastin in combination
with paclitaxel for previously untreated advanced HER2-negative breast cancer be removed from t he US
label with FDA expected to make a final decision by September 17, 2010. The ODAC recommendation does
not impact Avastin's approved uses for other cancer types.

7/29
Overall sales (oncology and autoimmune diseases) of MabThera/Rituxan (rituximab), for non-Hodgkin’s
lymphoma (NHL), chronic lymphocytic leukemia (CLL) and rheumatoid arthritis (RA), rose 9% to 3.3
billion Swiss francs. Sustained growth in the oncology segment was driven by further expansion of market
share in all lines of CLL therapy and continued strong use in the product’s core NHL indications.
Sales growth in the RA segment continued to be driven by increased use in patients with an inadequate
response to one or more tumour necrosis factor inhibitors and by six-month repeat treatment intervals.
Global sales of Herceptin (trastuzumab), for HER2-positive breast cancer and advanced stomach cancer,
increased 8% to 2.8 billion Swiss francs in the first half year. Growth was driven by further penetration in
the early and metastatic breast cancer settings, particularly in emerging markets. Solid growth was also
recorded in Western Europe (9%) and the US (6%). First signs of uptake of Herceptin in HER2-positive
advanced stomach cancer are being seen in EU markets following approval of this new indication in
January. Lower sales in Japan (-17%) reflect the impact of revised reimbursement prices that came into
effect in April.
Xeloda (capecitabine), for colorectal, stomach and breast cancer, delivered strong sales growth in the first
six months of 2010, up 19% to 732 million Swiss francs. Sales were driven primarily by strong gains in the
United States (26%) and Japan (82%). Sales in Japan are benefitting from an expanded metastatic colorectal
cancer indication approved in 2009. Growth in China, the product’s second-largest market after the US,
is being fuelled mainly by use of the medicine in advanced stomach cancer.
Sales of Tarceva (erlotinib), for advanced lung and pancreatic cancer, increased 8% to 674 million Swiss
francs in the first half-year, driven primarily by growth in the International region (14%) and the US (6%).
Solid sales growth in Japan (28%) reflects continuing market penetration.
Pegasys (peginterferon alfa-2a), for hepatitis B and C, posted a 5% increase in sales to 869 million Swiss
francs, with the main growth contributions coming from the International region (16%),
especially CEMAI 3 and Asia — Pacific countries. Sales are being driven by new clinical trial data that
further confirm the superiority of Pegasys over other treatment options, increased use in the treatment of
hepatitis B, and higher rates of hepatitis diagnosis and treatment in emerging markets.
3CEMAI: Central and Eastern Europe, Middle East, Africa, Central Asia, Indian Subcontinent.

8/29
Sales of the antiinfluenza medicine Tamiflu (oseltamivir) totalled 710 million Swiss francs in the first six
months, 31% lower than in the prior-year period (1,010 million Swiss francs). Following the exceptional
demand seen from March 2009 onwards due to the worldwide influenza A(H1N1) pandemic, global sales
of Tamiflu have declined consistently since December. Roche has now filled the bulk of government
pandemic orders received in 2009 and early 2010. In addition, with the pandemic in the northern
hemisphere apparently past its peak, retail pharmacy sales have slowed. Based on current estimates, Roche
now expects full-year sales of Tamiflu of up to 1.0 billion Swiss francs in 2010, down from the previous
estimate of approximately 1.2 billion francs.
US sales of Lucentis (ranibizumab), for wet age-related macular degeneration and macular edema following
retinal vein occlusion, rose 27% compared with the first half of 2009 to 697 million Swiss francs.
Robust growth was driven primarily by an increase in the total treated patient population (the number of
new patients receiving treatment, plus the time patients are on treatment with Lucentis). In June Genentech
commenced the US launch of Lucentis for an additional indication, the treatment of patients with macular
edema (swelling in the retina) following retinal vein occlusion. The US Food and Drug Administration
(FDA) approved the new indication after a six-month priority review.
In a highly competitive, price-sensitive market, sales of the renal anemia medication Mircera (methoxy
polyethylene glycol-epoetin beta) rose 72% to 124 million Swiss francs in the first half of 2010, with growth
coming predominantly from the predialysis segment. Combined sales of the Group’s established anemia
medicines, Roche’s NeoRecormon and Chugai’s Epogin (epoetin beta), declined 13% to 677 million Swiss
francs, due primarily to pricing pressure. Despite increasing competition from biosimilars, Roche’s overall
share of the European anemia market continues to grow, due mainly to the strong performance of Mircera
in the major EU countries and a robust market share by volume for NeoRecormon in the renal indication.
Sales of the novel rheumatoid arthritis medicine Actemra (tocilizumab, known as RoActemra in the EU)
continued to develop very well in the first six months of 2010. Further growth was recorded in the product’s
2009 launch markets, including Germany, with contributions also coming from the ongoing rollouts in
France, Spain, Italy, the United States and other countries. Global sales totalled 155 million Swiss francs, an
increase of 198% over the first half of 2009. Initial sales in the United States, where Actemra has been
available since mid-January, have been encouraging. Market uptake in Japan remained strong, with sales up
67% for the half-year. Now launched in some 50 countries, Actemra/RoActemra is continuously gaining
patient share in its approved indications, including use as a first-line biologic treatment.

9/29
Sales of CellCept (mycophenolate mofetil), for the prevention of solid organ transplant rejection, decreased
23% compared with the year-earlier period to 702 million Swiss francs. US sales have declined sharply since
the product’s US patent expired in May 2009, and a 58% decrease was recorded in the first half of 2010.
Continued generic erosion of US sales is being partly offset by solid growth in certain CEMAI region
countries, Japan and other markets.
Development update
In the first half of 2010 the Pharmaceuticals Division filed nine major new marketing applications and
gained eleven major regulatory approvals.
As of 30 June 2010 the division’s clinical development portfolio (phase I to III/registration) included 60 new
molecular entities and 42 additional indications. In the second quarter of 2010 four projects entered phase I,
one entered phase II and three entered phase III development. Five phase I projects were discontinued, of
which two were returned to the respective partner and two to exploratory development; two phase II and
five phase III projects were discontinued. Full details of the Group’s pharmaceutical R&D pipeline are
available at www.roche.com/pipeline.htm.
Major regulatory filings in the first half of 2010 1 Product Clinical data
supporting filing
Indication and/or dosage form Country
Actemra LITHE (2-year data) prevention of structural joint damage and improvement of physical function in adults with moderately to severely active rheumatoid arthritis
USA
Herceptin + Xeloda
ToGA advanced HER2-positive gastric cancer
Japan
Herceptin ToGA advanced HER2-positive gastric cancer
USA
MabThera/ Rituxan
PRIMA advanced follicular lymphoma, first-line maintenance following induction treatment with MabThera/Rituxan plus chemotherapy
EU, USA, Switzerland
Tarceva Emerging data from clinical trials, ongoing
metastatic non-small cell lung cancer with EGFR-activating
EU

10/29
clinical experience mutations, first-line treatment
Trastuzumab–DM1
TDM4374g, TDM4258g HER2-positive metastatic breast cancer, third-line treatment
USA
Xeloda NO16968 (XELOXA) adjuvant colon cancer, combination with oxaliplatin
Switzerland
Major regulatory approvals in the first half of 20101
Product Clinical data
supporting filing
Indication and/or dosage form Country
Actemra/ RoActemra
OPTION, TOWARD, RADIATE, AMBITION,LITHE (6-month data)
rheumatoid arthritis signs and symptoms
USA
LITHE (2-year data) reduction of progression of joint damage, improvement of physical function in rheumatoid arthritis, combination with methotrexate
EU
Avastin AVF 2107, E3200, NO16966 (global); ARTIST (China)
first-line metastatic colorectal cancer China
Herceptin ToGA advanced HER2-positive gastric cancer
EU, Switzerland
Lucentis CRUISE, BRAVO macular edema following retinal vein occlusion
USA
Rituxan REACH relapsed or refractory chronic lymphocytic leukemia
USA
CLL-8 first-line chronic lymphocytic leukemia
USA
Tarceva SATURN non-small cell lung cancer, first-line maintenance after chemotherapy
USA, EU
Xeloda NO16968 (XELOXA) adjuvant colon cancer, combination with oxaliplatin
EU
1 Includes supplemental indications; updated to 7 July 2010
11/29
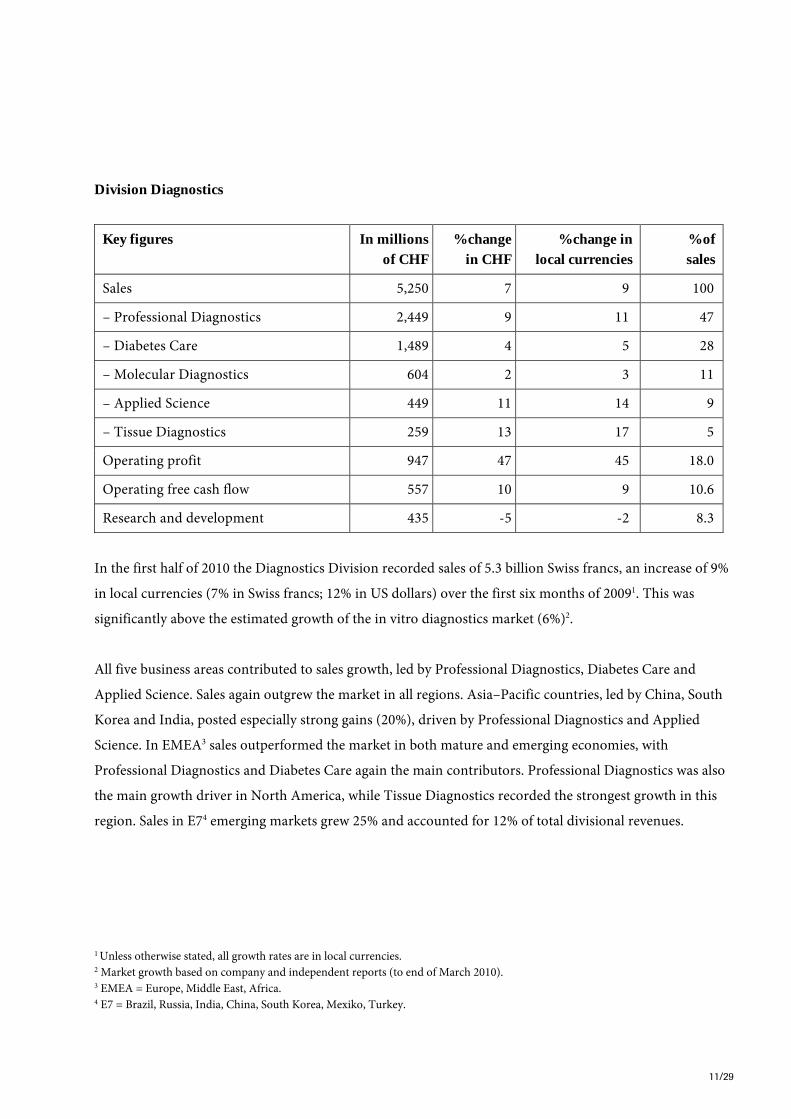
Division Diagnostics
Key figures In millions
of CHF
% change
in CHF
% change in
local currencies
% of
sales
Sales 5,250 7 9 100
– Professional Diagnostics 2,449 9 11 47
– Diabetes Care 1,489 4 5 28
– Molecular Diagnostics 604 2 3 11
– Applied Science 449 11 14 9
– Tissue Diagnostics 259 13 17 5
Operating profit 947 47 45 18.0
Operating free cash flow 557 10 9 10.6
Research and development 435 -5 -2 8.3
In the first half of 2010 the Diagnostics Division recorded sales of 5.3 billion Swiss francs, an increase of 9%
in local currencies (7% in Swiss francs; 12% in US dollars) over the first six months of 20091. This was
significantly above the estimated growth of the in vitro diagnostics market (6%)2.
All five business areas contributed to sales growth, led by Professional Diagnostics, Diabetes Care and
Applied Science. Sales again outgrew the market in all regions. Asia–Pacific countries, led by China, South
Korea and India, posted especially strong gains (20%), driven by Professional Diagnostics and Applied
Science. In EMEA3 sales outperformed the market in both mature and emerging economies, with
Professional Diagnostics and Diabetes Care again the main contributors. Professional Diagnostics was also
the main growth driver in North America, while Tissue Diagnostics recorded the strongest growth in this
region. Sales in E74 emerging markets grew 25% and accounted for 12% of total divisional revenues.
1 Unless otherwise stated, all growth rates are in local currencies. 2 Market growth based on company and independent reports (to end of March 2010). 3 EMEA = Europe, Middle East, Africa. 4 E7 = Brazil, Russia, India, China, South Korea, Mexiko, Turkey.

12/29
The division launched a total of 18 major new tests and instruments in their first markets during the first
half of 2010. Moreover, final data from ATHENA, a large registration trial investigating the benefits of HPV
testing in screening for cervical cancer, and from the randomised STeP trial in diabetes were presented at
major scientific congresses. Both trials demonstrated the high medical value of Roche diagnostic products.
In the second quarter Roche completed the acquisition of Medingo Ltd., the developer of a semi-disposable
insulin patch pump. The acquisition broadens and strengthens Diabetes Care’s portfolio of insulin delivery
technologies, which represent a fast-growing and highly attractive market.
About Roche
Headquartered in Basel, Switzerland, Roche is a leader in research-focused healthcare with combined
strengths in pharmaceuticals and diagnostics. Roche is the world’s largest biotech company with truly
differentiated medicines in oncology, virology, inflammation, metabolism and CNS. Roche is also the world
leader in in-vitro diagnostics, tissue-based cancer diagnostics and a pioneer in diabetes management.
Roche’s personalised healthcare strategy aims at providing medicines and diagnostic tools that enable
tangible improvements in the health, quality of life and survival of patients. In 2009, Roche had over 80’000
employees worldwide and invested almost 10 billion Swiss francs in R&D. The Group posted sales of 49.1
billion Swiss francs. Genentech, United States, is a wholly owned member of the Roche Group. Roche has a
majority stake in Chugai Pharmaceutical, Japan. For more information: www.roche.com
All trademarks used or mentioned in this release are protected by law.
Additional information
- Investor Update including a full set of tables: http://www.roche.com/inv-update-2010-07-22.htm
- Half Year Report 2010: www.roche.com/annual_reports.htm
- Roche Pharmaceuticals pipeline: www.roche.com/pipeline.htm
- Roche Finance Info System: rofis.roche.com/dynasight/rofis.html

13/29
Roche IR Contacts:
Dr. Karl Mahler Dianne Young
Phone: +41 (0)61 687 85 03 Phone: +41 (0)61 688 93 56
e-mail: [email protected] e-mail: [email protected]
Dr. Sabine Borngräber Dr. Nicolas Dunant
Phone: +41 (0)61 688 80 27 Phone: +41 (0)61 687 05 17
e-mail: [email protected] e-mail: [email protected]
Dr. Nina Mojas
Phone: +41 (0) 61 687 13 00
e-mail: [email protected]
Thomas Kudsk Larsen Nina Sachdev
Phone: +1 973 235 3655 Phone: +1 973 562 2793
Mobile phone: +1 973 393 5315 Mobile phone: +1 973 362 5098
e-mail: [email protected] e-mail: [email protected]
Science Support:
Dr. Susan Morris, Diane Schrick, Nadine O'Campo
Phone: +1 650 225 4150
e-mail: [email protected]; [email protected]; [email protected]
Disclaimer: Cautionary statement regarding forward-looking statements This document contains certain forward-looking statements. These forward-looking statements may be identified by words such as ‘believes’, ‘expects’, ‘anticipates’, ‘projects’, ‘intends’, ‘should’, ‘seeks’, ‘estimates’, ‘future’ or similar expressions or by discussion of, among other things, strategy, goals, plans or intentions. Various factors may cause actual results to differ materially in the future from those reflected in forward-looking statements contained in this document, among others: (1) pricing and product initiatives of competitors; (2) legislative and regulatory developments and economic conditions; (3) delay or inability in obtaining regulatory approvals or bringing products to market; (4) fluctuations in currency exchange rates and general financial market conditions; (5) uncertainties in the discovery, development or marketing of new products or new uses of existing products, including without limitation negative results of clinical trials or research projects, unexpected side-effects of pipeline or marketed products; (6) increased government pricing pressures; (7) interruptions in production; (8) loss of or inability to obtain adequate protection for intellectual property rights; (9) litigation; (10) loss of key executives or other employees; and (11) adverse publicity and news coverage. The statement regarding earnings per share growth is not a profit forecast and should not be interpreted to mean that Roche’s earnings or earnings per share for any current or future period will necessarily match or exceed the historical published earnings or earnings per share of Roche.

14/29
Roche Group consolidated income statement for the six months ended 30 June 2010 in millions of CHF
Pharmaceuticals Diagnostics Corporate Group Sales 19,386 5,250 - 24,636Royalties and other operating income 784 94 - 878Cost of sales (4,369) (2,501) - (6,870)Marketing and distribution (3,292) (1,254) - (4,546)Research and development (4,036) (435) - (4,471)General and administration (464) (207) (200) (871)Operating profit before exceptional items 8,009 947 (200) 8,756 Changes in Group organisation (278) - - (278)Operating profit 7,731 947 (200) 8,478 Associates -Financial income 302Financing costs (1,508)Profit before taxes 7,272 Income taxes (1,800)Income taxes on exceptional items 93Net income 5,565 Attributable to - Roche shareholders 5,468- Non-controlling interests 97 Earnings per share and non-voting equity security Basic (CHF) 6.39Diluted (CHF) 6.37
15/29
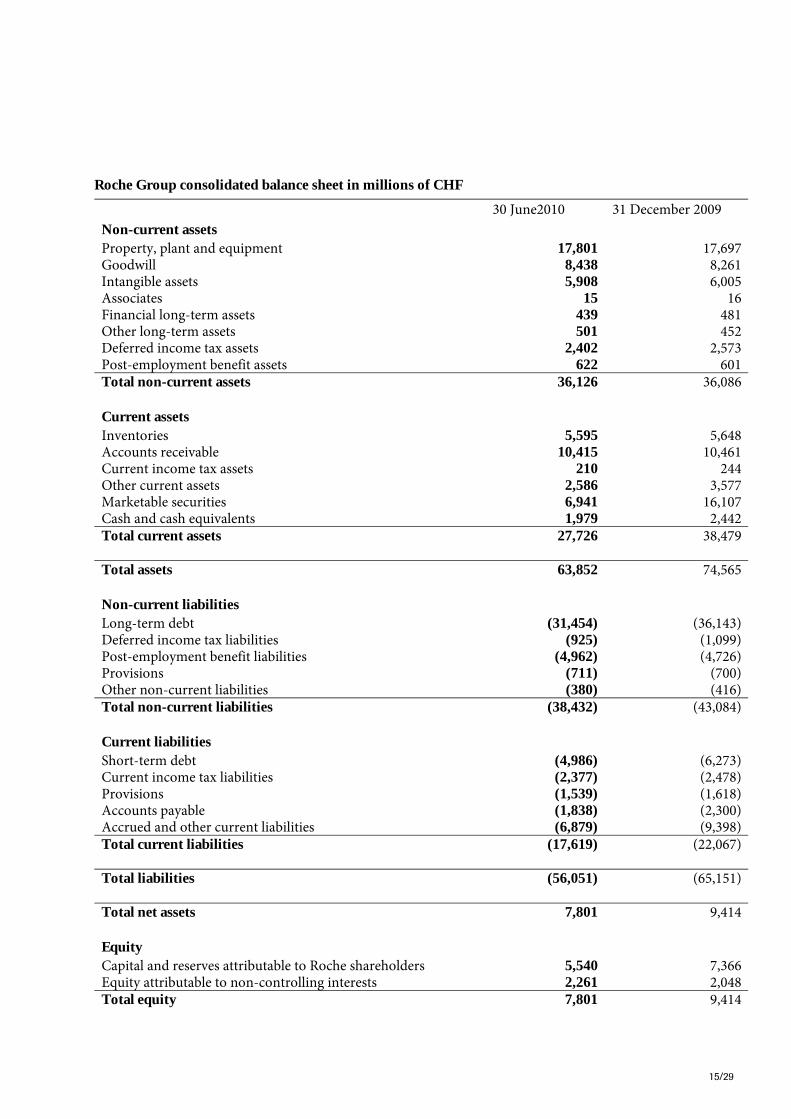
Roche Group consolidated balance sheet in millions of CHF
30 June2010 31 December 2009 Non-current assets Property, plant and equipment 17,801 17,697 Goodwill 8,438 8,261 Intangible assets 5,908 6,005 Associates 15 16 Financial long-term assets 439 481 Other long-term assets 501 452 Deferred income tax assets 2,402 2,573 Post-employment benefit assets 622 601 Total non-current assets 36,126 36,086 Current assets Inventories 5,595 5,648 Accounts receivable 10,415 10,461 Current income tax assets 210 244 Other current assets 2,586 3,577 Marketable securities 6,941 16,107 Cash and cash equivalents 1,979 2,442 Total current assets 27,726 38,479 Total assets 63,852 74,565 Non-current liabilities Long-term debt (31,454) (36,143) Deferred income tax liabilities (925) (1,099) Post-employment benefit liabilities (4,962) (4,726) Provisions (711) (700) Other non-current liabilities (380) (416) Total non-current liabilities (38,432) (43,084) Current liabilities Short-term debt (4,986) (6,273) Current income tax liabilities (2,377) (2,478) Provisions (1,539) (1,618) Accounts payable (1,838) (2,300) Accrued and other current liabilities (6,879) (9,398) Total current liabilities (17,619) (22,067) Total liabilities (56,051) (65,151) Total net assets 7,801 9,414 Equity Capital and reserves attributable to Roche shareholders 5,540 7,366 Equity attributable to non-controlling interests 2,261 2,048 Total equity 7,801 9,414

16/29
Roche Group consolidated statement of cash flows in millions of CHF
Six months ended 30 June 2010 2009
Cash flows from operating activities Cash generated from operations 10,564 9,670 (Increase) decrease in net working capital (2,298) (1,168) Payments made for defined benefit post-employment plans (155) (318) Utilisation of provisions (370) (413) Other operating cash flows - 165 Cash flows from operating activities, before income taxes paid 7,741 7,936 Income taxes paid (1,564) (486) Total cash flows from operating activities 6,177 7,450 Cash flows from investing activities Purchase of property, plant and equipment (1,235) (1,246) Purchase of intangible assets (69) (97) Disposal of property, plant and equipment 53 77 Disposal of intangible assets - - Disposal of products 20 33 Business combinations (178) (84) Divestments of subsidiaries - - Interest and dividends received 38 268 Sales of marketable securities 26,740 13,186 Purchases of marketable securities (17,164) (12,714) Other investing cash flows 78 (322) Total cash flows from investing activities 8,283 (899) Cash flows from financing activities Proceeds from issue of bonds and notes - 48,197 Redemption and repurchase of bonds and notes (5,438) - Increase (decrease) in commercial paper 193 67 Increase (decrease) in other debt (23) (150) Hedging and collateral arrangements (2,711) 2,487 Change in ownership interest in subsidiaries - Genentech 3 - (52,708) - Memory 7 - (6) Equity contribution by non-controlling interests 14 - Interest paid (1,529) (119) Dividends paid (5,214) (4,353) Equity-settled equity compensation plans, net of transactions in own equity instruments (210) (162) Other financing cash flows - - Total cash flows from financing activities (14,918) (6,747) Net effect of currency translation on cash and cash equivalents (5) (1,591) Increase (decrease) in cash and cash equivalents (463) (1,787) Cash and cash equivalents at beginning of period 2,442 4,915 Cash and cash equivalents at end of period 1,979 3,128

17/29
1. Sales January to June 2010 and 2009
2010 2009 % change
January – June CHF m CHF m In CHF In local
currencies
Pharmaceuticals Division 19,386 19,104 +1 +4
United States 7,372 7,516 -2 +2
Western Europe 5,044 5,182 -3 +1
Japan 2,061 2,184 -6 -6
International 4,909 4,222 +16 +14
Diagnostics Division 5,250 4,902 +7 +9
Roche Group 24,636 24,006 +3 +5
2. Quarterly local sales growth by Division in 2009 and 2010
Q3 2009vs. Q3 2008
Q4 2009vs. Q4 2008
Q1 2010 vs. Q1 2009
Q2 2010vs. Q2 2009
Pharmaceuticals Division +15 +8 +10 -2
United States +4 +4 +10 -5
Western Europe +17 +13 +4 -2
Japan +46 +18 -9 -3
International +17 +4 +25 +4
Diagnostics Division +10 +10 +9 +9
Roche Group +14 +8 +9 0

18/29
3. Quarterly sales by Division in 2009 and 2010
CHF millions Q2 2009 Q3 2009 Q4 2009
Q1 2010 Q2 2010
Pharmaceuticals Division 9,888 9,930 9,962 9,727 9,659
United States 3,930 3,641 3,648 3,647 3,725
Western Europe 2,650 2,844 2,801 2,597 2,447
Japan 1,045 1,306 1,275 988 1,073
International 2,263 2,139 2,238 2,495 2,414
Diagnostics Division 2,541 2,463 2,690 2,518 2,732
Roche Group 12,429 12,393 12,652 12,245 12,391

19/29
1. Top 20 Pharmaceuticals Division product sales and local growth YTD June 2010 vs. YTD June 2009:
US, Western Europe, Japan and International
Total United States Western Europe
Japan International
CHF m % CHF m
% CHF m
% CHF m % CHF m
%
Avastin 3,393 14% 1,732 7% 946 13% 276 52% 439 29%
MabThera/Rituxan 3,301 9% 1,585 5% 864 10% 122 6% 730 20%
Herceptin 2,806 8% 826 6% 1,097 9% 144 -17% 739 16%
Pegasys 869 5% 208 4% 191 -8% 57 -12% 413 16%
Xeloda 732 19% 270 26% 159 8% 60 82% 243 11%
Tamiflu 710 -31% 201 -34% 3 -99% 142 -53% 364 78%
CellCept 702 -23% 159 -58% 240 1% 28 14% 275 4%
Lucentis 697 27% 697 27% - - - - - -
NeoRecormon/Epogin 677 -13% - - 266 -21% 225 -9% 186 -2%
Tarceva 674 8% 258 6% 232 4% 41 28% 143 14%
Bonviva/Boniva 544 8% 284 2% 155 10% - - 105 21%
Xolair 324 8% 324 8% - - - - - -
Valcyte/Cymevene 296 11% 143 14% 87 13% - - 66 2%
Pulmozyme 264 8% 151 7% 57 -2% - - 56 29%
Activase/TNKase 227 3% 205 5% - - - - 22 -12%
Nutropin 193 -5% 188 -5% - - - - 5 -5%
Xenical 183 -12% 17 1% 87 -6% - - 79 -20%
Neutrogin 167 -11% - - - - 167 -11% - -
Rocephin 165 2% 3 176% 31 -4% 31 -5% 100 4%
Actemra 155 198% 14 - 60 498% 69 67% 12 943%

20/29
2. Top 20 Pharmaceuticals Division quarterly local product sales growth
Q3 2009vs. Q3 2008
Q4 2009vs. Q4 2008
Q1 2010 vs. Q1 2009
Q2 2010vs. Q2 2009
Avastin 21% 9% 18% 10%MabThera/Rituxan 7% 0% 13% 6%Herceptin 8% 2% 11% 5%Pegasys 13% -11% 15% -4%Xeloda 11% -2% 23% 16%Tamiflu 887% 620% 32% -72%CellCept -26% -45% -28% -15%Lucentis 21% 34% 27% 27%NeoRecormon/Epogin -7% -15% -8% -16%Tarceva 11% 10% 6% 10%Bonviva/Boniva 0% -10% 17% 0%Xolair 9% 8% 5% 10%Valcyte/Cymevene 7% 1% 18% 4%Pulmozyme 8% -1% 17% 0%Activase/TNKase 34% 39% -6% 15%Nutropin -6% -9% -6% -4%Xenical -14% -15% -11% -12%Neutrogin -10% -12% -5% -16%Rocephin -2% -19% 10% -6%Actemra 221% 216% 236% 175%
21/29
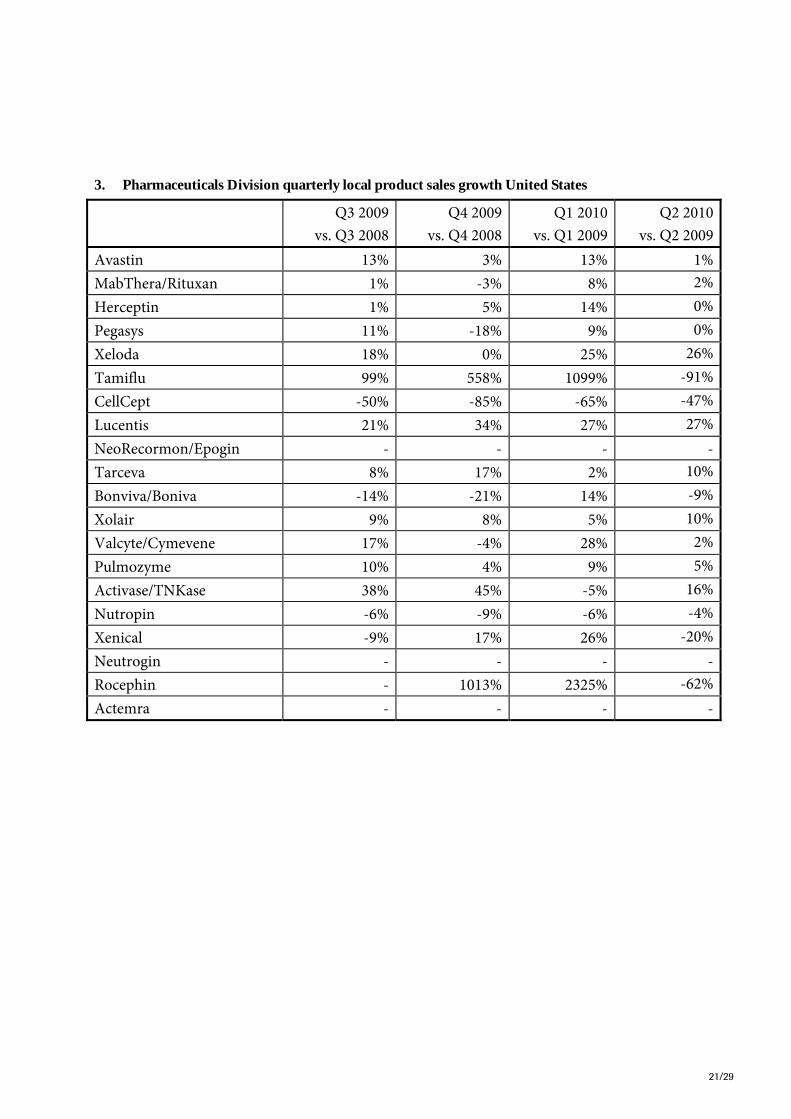
3. Pharmaceuticals Division quarterly local product sales growth United States
Q3 2009vs. Q3 2008
Q4 2009vs. Q4 2008
Q1 2010 vs. Q1 2009
Q2 2010vs. Q2 2009
Avastin 13% 3% 13% 1%MabThera/Rituxan 1% -3% 8% 2%Herceptin 1% 5% 14% 0%Pegasys 11% -18% 9% 0%Xeloda 18% 0% 25% 26%Tamiflu 99% 558% 1099% -91%CellCept -50% -85% -65% -47%Lucentis 21% 34% 27% 27%NeoRecormon/Epogin - - - -Tarceva 8% 17% 2% 10%Bonviva/Boniva -14% -21% 14% -9%Xolair 9% 8% 5% 10%Valcyte/Cymevene 17% -4% 28% 2%Pulmozyme 10% 4% 9% 5%Activase/TNKase 38% 45% -5% 16%Nutropin -6% -9% -6% -4%Xenical -9% 17% 26% -20%Neutrogin - - - -Rocephin - 1013% 2325% -62%Actemra - - - -
22/29
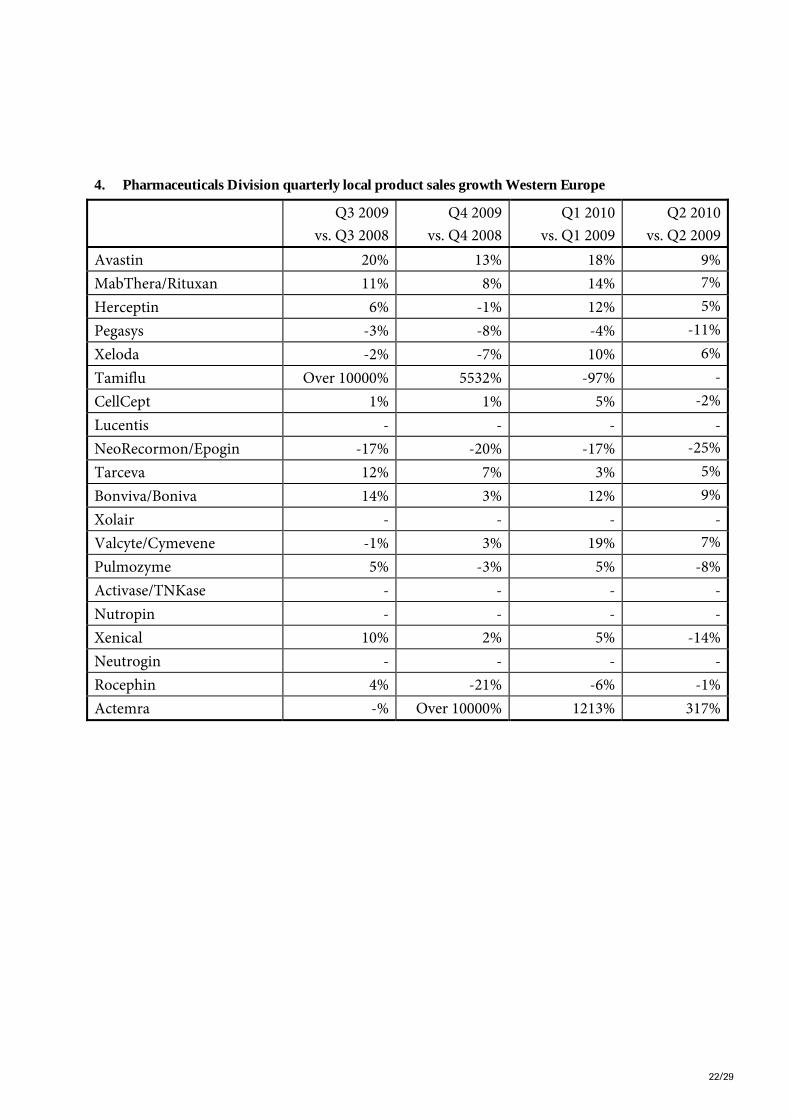
4. Pharmaceuticals Division quarterly local product sales growth Western Europe
Q3 2009vs. Q3 2008
Q4 2009vs. Q4 2008
Q1 2010 vs. Q1 2009
Q2 2010vs. Q2 2009
Avastin 20% 13% 18% 9%MabThera/Rituxan 11% 8% 14% 7%Herceptin 6% -1% 12% 5%Pegasys -3% -8% -4% -11%Xeloda -2% -7% 10% 6%Tamiflu Over 10000% 5532% -97% -CellCept 1% 1% 5% -2%Lucentis - - - -NeoRecormon/Epogin -17% -20% -17% -25%Tarceva 12% 7% 3% 5%Bonviva/Boniva 14% 3% 12% 9%Xolair - - - -Valcyte/Cymevene -1% 3% 19% 7%Pulmozyme 5% -3% 5% -8%Activase/TNKase - - - -Nutropin - - - -Xenical 10% 2% 5% -14%Neutrogin - - - -Rocephin 4% -21% -6% -1%Actemra -% Over 10000% 1213% 317%

23/29
5. Pharmaceuticals Division quarterly local product sales growth Japan
Q3 2009vs. Q3 2008
Q4 2009vs. Q4 2008
Q1 2010 vs. Q1 2009
Q2 2010vs. Q2 2009
Avastin 59% 44% 53% 51%MabThera/Rituxan 6% 0% 6% 5%Herceptin 13% 2% -14% -20%Pegasys 6% -5% -12% -13%Xeloda 29% 52% 81% 84%Tamiflu Over 10000% 204% -47% -76%CellCept 18% 9% 12% 15%Lucentis - - - -NeoRecormon/Epogin 3% 0% -7% -10%Tarceva 19% 23% 19% 35%Bonviva/Boniva - - - -Xolair - - - -Valcyte/Cymevene - - - -Pulmozyme - - - -Activase/TNKase - - - -Nutropin - - - -Xenical - - - -Neutrogin -10% -12% -5% -16%Rocephin -1% -18% -13% 2%Actemra 97% 70% 73% 62%
24/29
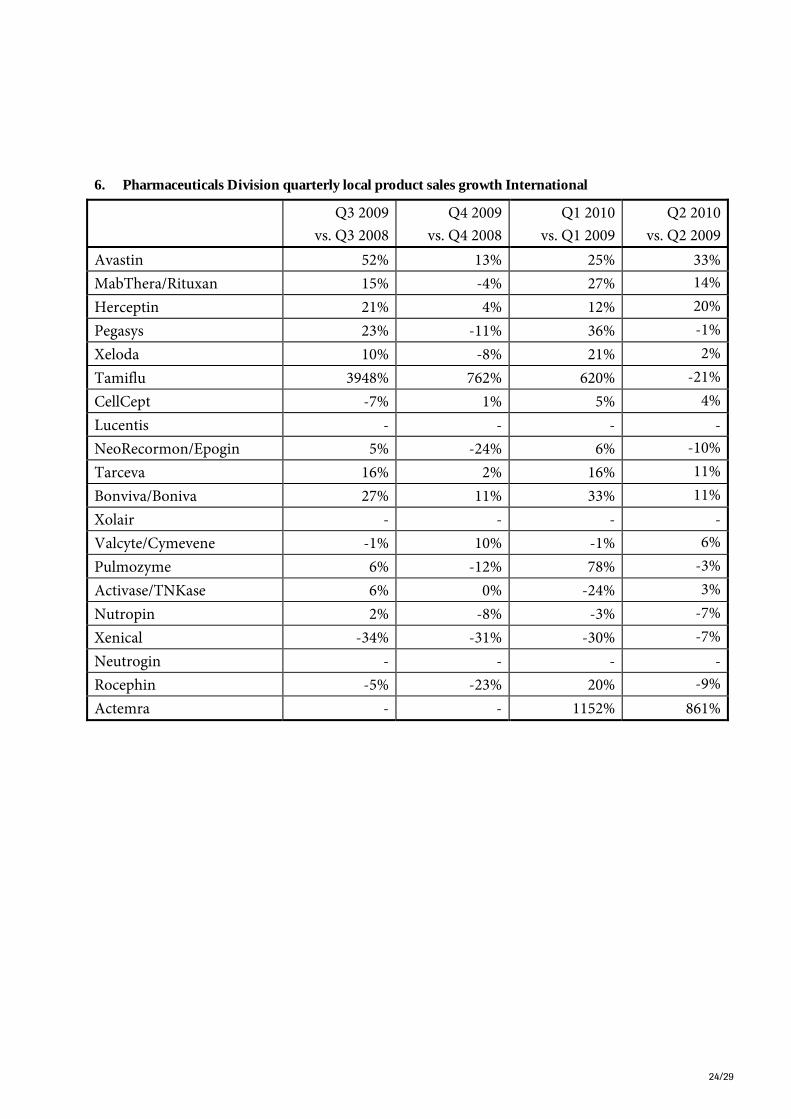
6. Pharmaceuticals Division quarterly local product sales growth International
Q3 2009vs. Q3 2008
Q4 2009vs. Q4 2008
Q1 2010 vs. Q1 2009
Q2 2010vs. Q2 2009
Avastin 52% 13% 25% 33%MabThera/Rituxan 15% -4% 27% 14%Herceptin 21% 4% 12% 20%Pegasys 23% -11% 36% -1%Xeloda 10% -8% 21% 2%Tamiflu 3948% 762% 620% -21%CellCept -7% 1% 5% 4%Lucentis - - - -NeoRecormon/Epogin 5% -24% 6% -10%Tarceva 16% 2% 16% 11%Bonviva/Boniva 27% 11% 33% 11%Xolair - - - -Valcyte/Cymevene -1% 10% -1% 6%Pulmozyme 6% -12% 78% -3%Activase/TNKase 6% 0% -24% 3%Nutropin 2% -8% -3% -7%Xenical -34% -31% -30% -7%Neutrogin - - - -Rocephin -5% -23% 20% -9%Actemra - - 1152% 861%

25/29
7. Top 20 Pharmaceuticals Division quarterly product sales
CHF millions Q2 2009 Q3 2009 Q4 2009
Q1 2010 Q2 2010
Avastin 1,605 1,594 1,538 1,666 1,727MabThera/Rituxan 1,617 1,508 1,481 1,606 1,695Herceptin 1,338 1,327 1,294 1,417 1,389Pegasys 449 438 375 441 428Xeloda 330 326 308 352 380Tamiflu 609 994 1,196 517 193CellCept 410 362 287 357 345Lucentis 294 296 329 327 370NeoRecormon/Epogin 411 391 380 339 338Tarceva 323 319 342 326 348Bonviva/Boniva 276 255 278 277 267Xolair 161 157 150 148 176Valcyte/Cymevene 143 148 142 149 147Pulmozyme 128 125 128 135 129Activase/TNKase 100 107 122 110 117Nutropin 107 100 89 91 102Xenical 106 98 90 91 92Neutrogin 98 101 96 81 86Rocephin 87 73 70 82 83Actemra 32 40 53 66 89

26/29
8. Pharmaceuticals Division quarterly product sales United States
CHF millions Q2 2009 Q3 2009 Q4 2009
Q1 2010 Q2 2010
Avastin 883 851 771 845 887MabThera/Rituxan 809 734 703 763 822Herceptin 420 397 359 408 418Pegasys 107 109 87 102 106Xeloda 118 131 118 123 147Tamiflu 302 189 400 170 31CellCept 140 119 34 83 76Lucentis 294 296 329 327 370NeoRecormon/Epogin - - - - -Tarceva 125 126 142 120 138Bonviva/Boniva 154 132 148 144 140Xolair 161 157 150 148 176Valcyte/Cymevene 72 77 66 70 73Pulmozyme 73 76 77 75 76Activase/TNKase 90 96 111 100 105Nutropin 105 97 87 88 100Xenical 10 9 7 10 7Neutrogin - - - - -Rocephin 1 0 2 2 1Actemra - - - 5 9

27/29
9. Pharmaceuticals Division quarterly product sales Western Europe
CHF millions Q2 2009 Q3 2009 Q4 2009
Q1 2010 Q2 2010
Avastin 453 461 458 484 462MabThera/Rituxan 419 421 408 442 422Herceptin 533 547 528 570 527Pegasys 110 92 91 99 92Xeloda 79 80 77 81 78Tamiflu 96 283 297 3 0CellCept 127 123 125 123 117Lucentis - - - - -NeoRecormon/Epogin 178 172 157 141 125Tarceva 118 121 121 116 116Bonviva/Boniva 74 77 81 79 76Xolair - - - - -Valcyte/Cymevene 41 41 43 46 41Pulmozyme 31 29 29 30 27Activase/TNKase - - - - -Nutropin - - - - -Xenical 51 51 44 44 43Neutrogin - - - - -Rocephin 16 15 17 16 15Actemra 8 14 20 27 33

28/29
10. Pharmaceuticals Division quarterly product sales Japan
CHF millions Q2 2009 Q3 2009 Q4 2009
Q1 2010 Q2 2010
Avastin 100 102 120 120 156MabThera/Rituxan 63 62 67 53 69Herceptin 93 83 88 67 77Pegasys 34 31 33 26 31Xeloda 18 19 25 27 33Tamiflu 50 351 233 126 16CellCept 13 13 14 12 16Lucentis - - - - -NeoRecormon/Epogin 131 131 138 102 123Tarceva 17 16 19 17 24Bonviva/Boniva - - - - -Xolair - - - - -Valcyte/Cymevene - - - - -Pulmozyme - - - - -Activase/TNKase - - - - -Nutropin - - - - -Xenical - - - - -Neutrogin 98 101 96 81 86Rocephin 17 16 15 13 18Actemra 23 26 31 30 39

29/29
11. Pharmaceuticals Division quarterly product sales International
CHF millions Q2 2009 Q3 2009 Q4 2009
Q1 2010 Q2 2010
Avastin 169 180 189 217 222MabThera/Rituxan 326 291 303 348 382Herceptin 292 300 319 372 367Pegasys 198 206 164 214 199Xeloda 115 96 88 121 122Tamiflu 161 171 266 218 146CellCept 130 107 114 139 136Lucentis - - - - -NeoRecormon/Epogin 102 88 85 96 90Tarceva 63 56 60 73 70Bonviva/Boniva 48 46 49 54 51Xolair - - - - -Valcyte/Cymevene 30 30 33 33 33Pulmozyme 24 20 22 30 26Activase/TNKase 10 11 11 10 12Nutropin 2 3 2 3 2Xenical 45 38 39 37 42Neutrogin - - - - -Rocephin 53 42 36 51 49Actemra 1 0 2 4 8