Embed Size (px)
Citation preview

Equivalent fuel consumption optimal controlof a series hybrid electric vehicleJ-P Gao1,2, G-M G Zhu3*, E G Strangas3, and F-C Sun2
1Henan University of Science and Technology, Luoyang, People’s Republic of China2Beijing Institute of Technology, Beijing, People’s Republic of China3Department of Mechanical Engineering, Michigan State University, East Lansing, MI, USA
The manuscript was received on 24 November 2008 and was accepted after revision for publication on 29 April 2009.
DOI: 10.1243/09544070JAUTO1074
Abstract: Improvements in hybrid electric vehicle fuel economy with reduced emissionsstrongly depend on their supervisory control strategy. In order to develop an efficient real-timesupervisory control strategy for a series hybrid electric bus, the proposed equivalent fuelconsumption optimal control strategy is compared with two popular strategies, thermostat andpower follower, using backward simulations in ADVISOR. For given driving cycles, global optimalsolutions were also obtained using dynamic programming to provide an optimization target forcomparison purposes. Comparison simulations showed that the thermostat control strategyoptimizes the operation of the internal combustion engine and the power follower controlstrategy minimizes the battery charging and discharging operations which, hence, reducesbattery power loss and extends the battery life. The equivalent fuel consumption optimal controlstrategy proposed in this paper provides an overall system optimization between the internalcombustion engine and battery efficiencies, leading to the best fuel economy.
Keywords: automotive systems, hybrid powertrain systems, series hybrid electric vehicle,supervisory control strategy
1 INTRODUCTION
Increasing concerns about global climate change
and ever-increasing demands on fossil fuel capacity
call for reduced emissions and improved fuel eco-
nomy. Hybrid electric vehicles (HEVs) attract more
attention because of their inherent advantages of im-
proved fuel economy, reduced harmful emissions,
and better performance compared with conven-
tional vehicles. Among the three basic kinds of HEV
(series, parallel, and split), the series hybrid electric
vehicle (SHEV) predominates as an urban transpor-
tation tool owing to its outstanding transient perfor-
mance and simple architecture.
Improvements in fuel economy and emissions of
HEVs strongly depend on their supervisory control
strategy [1]. At any moment, the supervisory control
strategy needs to determine the power distribution
between the primary energy converter (an internal
combustion engine) and the renewable electrical
storage system (battery), so that the power require-
ment and other constraints are satisfied, and also the
fuel consumption and harmful emissions are mini-
mized. To achieve the above objectives, many kinds
of supervisory control strategy for an SHEV have
been proposed and developed in the past. These
control strategies can be classified into mainly two
groups. One is devoted to global optimization, such
as strategies based upon dynamic programming
(DP) [2–4] and strategies based on optimal control
theories [5, 6]. Because of heavy computation
requirements they are difficult to apply for real-time
control and are usually used for offline simulation
applications. The other group deals with instanta-
neous optimization and is targeted on real-time
control, such as thermostat (on–off) control strategy
[7], power follower strategy [8–11], and power split
*Corresponding author: Department of Mechanical Engineering,
Michigan State University, 148 ERC South, East Lansing, MI
48824, USA.
email: [email protected]
1003
JAUTO1074 F IMechE 2009 Proc. IMechE Vol. 223 Part D: J. Automobile Engineering
at MICHIGAN STATE UNIV LIBRARIES on April 2, 2015pid.sagepub.comDownloaded from

strategy [12, 13], including equivalent fuel consump-
tion control strategy [14, 15] and minimization of
power dissipation control strategy [16].
In this paper, a series hybrid electric transit bus
has been chosen for the hybrid configuration. The
bus powertrain was developed in cooperation with
Michigan State University, Kettering University, and
TransTeq. The project was partially funded by the
Michigan Economic Development Corporation.
For the first prototype bus, thermostat control
strategy (TCS) was used. In order to develop an
efficient control strategy for this hybrid bus, TCS and
power follower control strategy (PFCS) were com-
pared and analysed. Subsequently an equivalent fuel
consumption optimal control strategy (EFCOCS) was
proposed and discussed in this paper.
The equivalent consumption minimization strat-
egy (ECMS) [14] requires many control parameters
to be determined or tuned through simulations and
experiments while, for the proposed EFCOCS, the
optimization problem has been simplified signifi-
cantly, which reduces the required control para-
meters to four. This simplifies the control-para-
meter-tuning process. The other main difference
between ECMS and the proposed EFCOCS is in the
calculation of the equivalent fuel consumption of
electric energy used. In ECMS, the equivalent fuel
consumption is proportional to the electric energy
used, regardless of the powertrain operational con-
ditions; i.e. the conversion efficiency from fuel to
electric energy used is fixed and, most often, the
average efficiency is used. While in the proposed
EFCOCS the equivalent fuel consumption of the
battery energy used is a function of the difference
between the actual battery state of charge (SOC) and
target SOC. The proposed strategy can be imple-
mented in real time by solving a one-dimensional
optimization problem. The proposed control strat-
egy was developed and validated on the basis of a
series powertrain model. Comparison simulation
results of three control strategies (thermostat, power
follower, and proposed equivalent fuel consump-
tion), together with the global optimization solution
[2–4, 12, 17, 18], show that the proposed EFCOCS
not only extends the battery life but also improves
the fuel economy of the hybrid bus.
The paper is organized as follows. In section 2, the
SHEVsystemsare reviewed.Section3discusses theTCS
and PFCS and proposes the equivalent fuel consump-
tion control strategy. The comparison simulation res-
ults of all three control strategies are presented in
section 4. Section 5 adds some conclusions.
2 SERIES HYBRID ELECTRIC VEHICLE SYSTEM
In this section, the architecture and system para-
meters of the series hybrid electric bus are
introduced. Component models of the main power-
train power source (the engine–generator set and the
battery) are presented on the basis of the char-
acteristics of the selected components. The engine–
generator set model was constructed on the basis of
the efficiency map obtained from fuel economy
experiments on the diesel engine and the perfor-
mance experiments of the generator, while the
battery model was built on the basis of an internal
resistance model and calibrated using experimental
data from charging and discharging performance
tests. The basic cost function of the energy manage-
ment problem for the SHEV is introduced on the
basis of the architecture, parameters, and model.
This makes it possible to propose an efficient
supervisory optimal control strategy for the series
hybrid electric bus.
2.1 Basic structure and parameters
Similar to many other SHEVs, the present SHEV bus
utilizes a combination of two energy sources, fuel
and electricity, shown in Fig. 1. This bus has two
different power sources: the main power source (the
Fig. 1 Architecture of an SHEV
1004 J-P Gao, G-M G Zhu, E G Strangas, and F-C Sun
Proc. IMechE Vol. 223 Part D: J. Automobile Engineering JAUTO1074 F IMechE 2009
at MICHIGAN STATE UNIV LIBRARIES on April 2, 2015pid.sagepub.comDownloaded from

engine–generator set) provides main power by
converting the fuel’s chemical energy to mechanical
energy using an internal combustion engine and
then to electric energy using a generator; the
assistant power source (the battery pack) acts as an
electric power equalizer to provide the rest of the
required power (positive or negative) through its
charging and discharging processes.
When a hybrid bus is being driven, based on the
power command from the driver and SOC of the
battery, the supervisory controller needs to calculate
the overall power requirement Pr and the power
requirement of the main power source (engine–
generator set) Pg based upon the specific control
strategy used. The engine controller will adjust its
operation to produce the requested electric power Pg
for the generator, and the battery supplies the
remaining electric power Pb5Pr2Pg. The total
electric power of Pg and Pb is supplied to the electric
motor to drive or break the entire vehicle, so that the
vehicle will reach the desired speed. Note that,
during the control strategy development the SHEV,
the electric drive unit and generator power inverter
dynamics are ignored and their efficiencies are
considered as part of the corresponding electrical
machine and generator efficiencies.
Table 1 lists the main technical parameters of the
SHEV presented here.
2.2 Model of the main components of the SHEV
2.2.1 Engine–generator set model
The electric power Pg generated by the engine–
generator set can be described by the two equations
Pe~vsTs
~ge Ts,vsð ÞPf
~ge Ts,vsð Þ _mmHLHV ð1Þ
Pg~Pegg Ts,vsð Þ~UbusIg ð2Þ
where Ts and vs are the engine output torque and
speed respectively, ge(Ts, vs) and gg(Ts, vs) are the
efficiency maps of the engine and generator respec-
tively, m and HLHV are the fuel mass flowrate and the
corresponding fuel low heating value (a known
constant that is a function of the type of fuel used),
Pf5 mHLHV, Pe5vsTs, and Pg are the fuel power,
engine mechanical power, and generator output
power respectively, and finally Ubus and Ig are the
electric bus voltage and generator current respec-
tively. C(Ts, vs) is defined as the fuel economy of the
engine–generator set in grams per kilowatt hour [1],
where
C Ts,vsð Þ~ _mm
vsTs
~1
ge Ts,vsð ÞHLHV
ð3Þ
Then the total fuel flow wg of the engine can be
expressed in terms of C(Ts, vs) according to
wg~C Ts,vsð ÞPfge Ts,vsð Þ~C Ts,vsð ÞTsvs ð4Þ
where both the engine speed vs and torque Ts
belong to a set V defined by
0¡Ts¡Tmax vsð Þ ð5Þ
max ve,min,vg,min
� �¡vs¡min ve,max,vg,max
� � ð6Þ
where Tmax(vs) is the maximum engine output
torque as a function of the engine speed, ve,min
and ve,max are the minimum and maximum angular
speeds respectively of the engine, and vg,min and
vg,max are the minimum and maximum angular
speeds respectively of the generator.
For a given engine, within the operational space
defined by equations (5) and (6), the engine
efficiency map ge(Ts, vs) can be obtained from
engine fuel economy mapping tests. Figure 2 shows
Table 1 Technical parameters of the SHEV
Item Parameter Value
Vehicle Total mass 16 500 kgCurb mass 14 660 kg
Fuel converter Type DieselRated power 171 kW
Generator Type Brushless permanentmagnet
Rated power 100 kWPeak Power 150 kW
Energy storagesystem
Type Lithium battery packRated voltage 360VRated capacity 90AhVoltage range 300–420V
Motor Type Brushless permanentmagnet
Rated power 200 kWPeak power 300 kWMaximum torque 1300NmSpeed range 0–5000 r/min
Fuel consumption control of a series hybrid electric vehicle 1005
JAUTO1074 F IMechE 2009 Proc. IMechE Vol. 223 Part D: J. Automobile Engineering
at MICHIGAN STATE UNIV LIBRARIES on April 2, 2015pid.sagepub.comDownloaded from
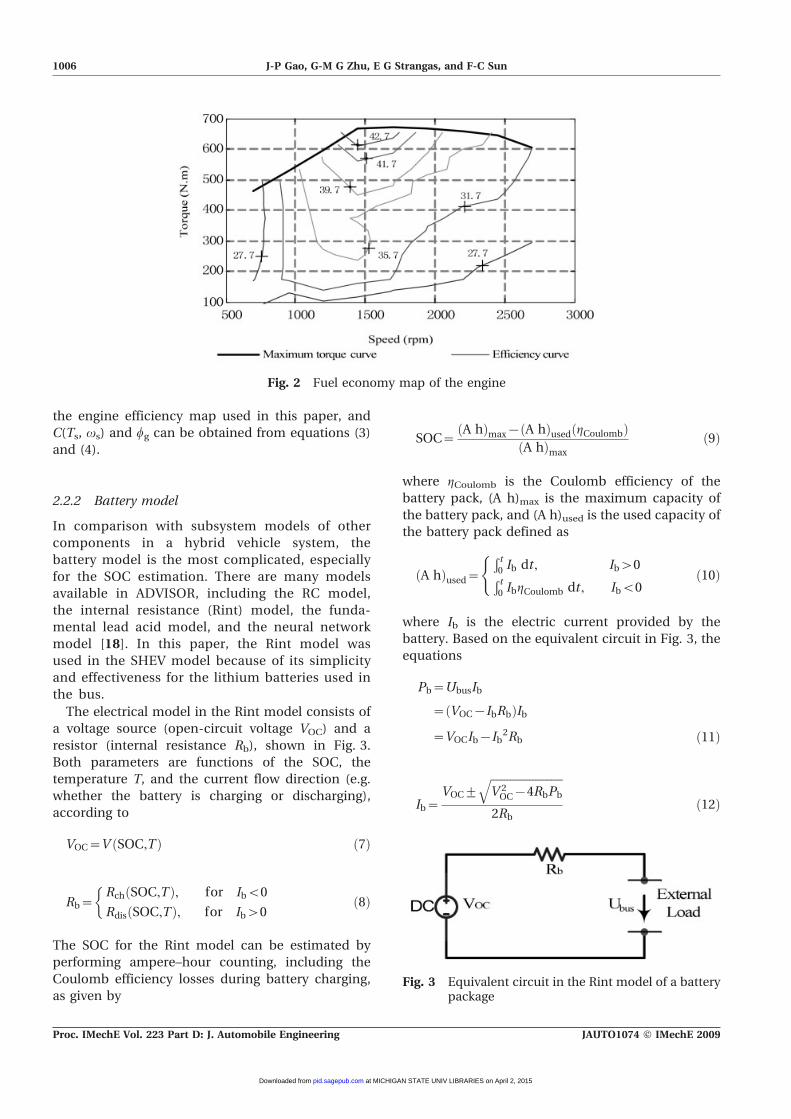
the engine efficiency map used in this paper, and
C(Ts, vs) and wg can be obtained from equations (3)
and (4).
2.2.2 Battery model
In comparison with subsystem models of other
components in a hybrid vehicle system, the
battery model is the most complicated, especially
for the SOC estimation. There are many models
available in ADVISOR, including the RC model,
the internal resistance (Rint) model, the funda-
mental lead acid model, and the neural network
model [18]. In this paper, the Rint model was
used in the SHEV model because of its simplicity
and effectiveness for the lithium batteries used in
the bus.
The electrical model in the Rint model consists of
a voltage source (open-circuit voltage VOC) and a
resistor (internal resistance Rb), shown in Fig. 3.
Both parameters are functions of the SOC, the
temperature T, and the current flow direction (e.g.
whether the battery is charging or discharging),
according to
VOC~V SOC,Tð Þ ð7Þ
Rb~Rch SOC,Tð Þ, for Ibv0
Rdis SOC,Tð Þ, for Ibw0
�ð8Þ
The SOC for the Rint model can be estimated by
performing ampere–hour counting, including the
Coulomb efficiency losses during battery charging,
as given by
SOC~A hð Þmax{ A hð Þused gCoulombð Þ
A hð Þmax
ð9Þ
where gCoulomb is the Coulomb efficiency of the
battery pack, (A h)max is the maximum capacity of
the battery pack, and (A h)used is the used capacity of
the battery pack defined as
A hð Þused~Ð t0 Ib dt, Ibw0Ð t0 IbgCoulomb dt, Ibv0
(ð10Þ
where Ib is the electric current provided by the
battery. Based on the equivalent circuit in Fig. 3, the
equations
Pb~UbusIb
~ VOC{IbRbð ÞIb~VOCIb{Ib
2Rb ð11Þ
Ib~VOC+
ffiffiffiffiffiffiffiffiffiffiffiffiffiffiffiffiffiffiffiffiffiffiffiffiffiffiV 2OC{4RbPb
q2Rb
ð12Þ
Fig. 2 Fuel economy map of the engine
Fig. 3 Equivalent circuit in the Rint model of a batterypackage
1006 J-P Gao, G-M G Zhu, E G Strangas, and F-C Sun
Proc. IMechE Vol. 223 Part D: J. Automobile Engineering JAUTO1074 F IMechE 2009
at MICHIGAN STATE UNIV LIBRARIES on April 2, 2015pid.sagepub.comDownloaded from

where Pb is the electric driving power provided by the
battery. Additionally, in order to protect the battery,
the SOC and charging and discharging current have to
be limited according to
SOCL¡SOC¡SOCU ð13Þ
Ib,min¡Ib¡Ib,max ð14Þ
where SOCU and SOCL are the given upper and lower
bounds respectively of the SOC for the battery, and
Ib,min and Ib,max are the given maximum charge
current and minimum discharge current respectively
for the battery.
2.3 Energy management problem for the SHEV
This section discusses the power balance under
driven and braking conditions and formulates the
corresponding optimization problem.
Figure 4 shows the architecture of the SHEV and
its energy flow. The power balance equation when
the vehicle is being driven is
Pr~PgzPb ð15Þ
and the power balance equation when the vehicle is
braking becomes
Pc~PgzPbg ð16Þ
where Pc and Pbg are the electrical power to be
charged into battery and the electrical power gen-
erated by the electrical machine during braking
respectively.
The energy management problem (or the super-
visory control problem) can be considered as an
optimal control problem that minimizes the cost
function J subject to the constraint equations (15)
and (16) with J given by
min J~ wTs,vsð Þ [V
Ts,vsð Þ ð17Þ
where w is the minimization cost function and V is
the engine operational region defined by equations
(5) and (6). Let w equal wg defined in equation (4),
and the optimization problem becomes minimizing
the engine fuel consumption over the constraint set
V. The cost function can also be used to minimize
the harmful emissions, wasted power, or the combi-
nation of fuel consumption and harmful emissions.
3 CONTROL STRATEGIES FOR THE SHEV
The key control strategy for the SHEV is the power
distribution between the engine–generator set and
the battery under specific power requirement Pr.
When the vehicle is being driven, the propulsion
power distribution is between the engine–generator
set and the battery, shown in equation (15); while the
vehicle is under braking, the power distribution
is between the electrical power charged to battery
and generated through braking regeneration, shown
in equation (16). In order to develop an efficient
supervisory control strategy for the series hybrid
bus, two common control strategies are to be
discussed and analysed, and a new optimal control
strategy is proposed in this section.
3.1 Thermostat control strategy
TCS is also called on–off control strategy. Under this
strategy, the engine operates with a fixed power at its
highest efficiency point, and it turns on and off
based upon the SOC of the battery. Let Sg(t) be the
on–off state of the engine–generator set. The
equation Sg(t)5 1 implies that the engine is on,
and Sg(t)5 0 means that the engine is off. The TCS
Fig. 4 Energy flow in the SHEV
Fuel consumption control of a series hybrid electric vehicle 1007
JAUTO1074 F IMechE 2009 Proc. IMechE Vol. 223 Part D: J. Automobile Engineering
at MICHIGAN STATE UNIV LIBRARIES on April 2, 2015pid.sagepub.comDownloaded from

control logic can be expressed as
Sg tð Þ~0
if SOC t{ð ÞoSOCU or
SOC t{ð ÞwSOCL and Sg t{ð Þ~0
�
1if SOC t{ð Þ¡SOCL or
SOC t{ð ÞvSOCU and Sg t{ð Þ~1
�8>>><>>>:
ð18Þ
The corresponding TCS power distribution is de-
scribed as
Pg tð Þ~ 0, Sg tð Þ~0
Pe Ts,g,vs,g
� �gg Ts,g,vs,g
� �, Sg tð Þ~1
(
ð19Þ
Pb tð Þ~0, SOC tð ÞvSOCL
Pr tð Þ{Pg tð Þ, SOCL¡SOC tð Þ¡SOCU
Pr kð Þ, SOC tð ÞwSOCU
8><>:
ð20Þwhere the pair (Ts,g, vs,g) are the given engine–
generator set operational condition that provides the
best fuel economy.
3.2 Power follower control strategy
The basic idea of the PFCS can be described as follows.
Let the engine–generator set be the main power
source and the supervisory control adjusts the output
power of the engine–generator set to follow the
vehicle’s driving power requirement Pr. The engine–
generator set is active under almost all driving
conditions, except for those conditions when low
driving power is required and the SOC is greater than
SOCU. The state control logic of the engine–generator
set is based upon the thresholds map shown in Fig. 5
and the corresponding power output is determined by
Pg tð Þ~
0, if Sg tð Þ~0
Pg,min,
if Sg tð Þ~1 and
SOC tð ÞwSOCU
ProPg,min
� �8><>:
Pgm tð Þ, if Sg tð Þ~1 and
SOCL¡SOC tð Þ¡SOCU
�
Pg,max,if Sg tð Þ~1 and
SOC tð ÞvSOCL
�
8>>>>>>>>>>>>><>>>>>>>>>>>>>:
ð21Þ
where
Pgm tð Þ~PrzPchSOCUzSOCL
2{SOC tð Þ
� �ð22Þ
where Pch is the selected charge power magnitude,
Pg,min and Pg,max are minimal and maximum electric
power outputs respectively of the engine–generator
set, and Pb,max in Fig. 5 is the given maximum
requested power allowed when the engine–generator
is off.
From equation (21), there are four operation
modes for the engine–generator set. The following
is a detailed discussion associated with the four
operational modes.
Case 1: In this case, Pg(t)5 0 (or Sg(t2)5 0), and the
requested power is less than either Pg,min or Pb,max.
The series hybrid powertrain is operated within the
dark-grey region (see Fig. 5) and the operational
range can be extended to the connected gridded
region due to hysteresis.
Case 2: In this case, the requested power Pr is greater
than either Pg,min or Pb,max. The powertrain is
operated in the grey area where SOC> SOCU and it
can be horizontally extended left to the gridded
region.
Case 3: In this case, the powertrain is operated
within the middle of the grey area between SOCL
and SOCU lines for any requested power Pr.
Case 4: In this case, the powertrain is operated
within the lower grey area (below the SOCL line)
for any requested power Pr.
Note that the gridded area of Fig. 5 is the
hysteresis used to prevent high-frequency on and
off operations of the internal combustion engine,
where Pb,max is the requested power hysteresis limit.
One important factor that needs to be considered is
the dynamics of engine–generator set; i.e. the rate of
engine–generator power output is limited between
Pmin and Pmax according to
_PPmin¡ _PPg tð Þ¡ _PPmax ð23Þ
Fig. 5 PFCS
1008 J-P Gao, G-M G Zhu, E G Strangas, and F-C Sun
Proc. IMechE Vol. 223 Part D: J. Automobile Engineering JAUTO1074 F IMechE 2009
at MICHIGAN STATE UNIV LIBRARIES on April 2, 2015pid.sagepub.comDownloaded from

In order to avoid frequently turning on and off the
engine–generator set, a minimal off-time tmin is
required for the engine–generator set to being
turned on again; i.e. the off-time tg,off should be
greater than the minimal off-time according to
tg,offotmin ð24Þ
In the PFCS, the battery pack works as a power
equalizer through charging or discharging itself. Its
control logic is described as
Pb tð Þ~ Pr tð Þ{Pg tð Þ, Sg~1
Pr tð Þ, Sg~0
�ð25Þ
3.3 Equivalent fuel consumption optimal controlstrategy
The two control strategies discussed above are
derived from basic rules. Their main advantage
is that an exact hybrid powertrain model is not
required for supervisory control and, therefore, they
are simple and robust. On the other hand, they are
not optimized for the best fuel economy.
In order to optimize the power split between the
engine–generator set and battery to achieve the
best fuel economy possible, an EFCOCS is pro-
posed in this paper on the basis of the SHEV
model.
The electric energy discharged from the battery
needs to be recharged back to the battery in the
future. This is equivalent to a certain fuel consump-
tion of the engine–generator set (e.g. positive fuel
consumption). On the other hand, the energy
charged to the battery at any moment will also be
discharged from the battery to drive the vehicle in
the future. This is equivalent to a certain fuel saving
for the engine–generator set (e.g. negative fuel
consumption).
Since the operation conditions of a series hybrid
powertrain in the future are unknown, the equiva-
lent fuel consumption is proposed to be used for
battery charge and discharge operations according
to
wb~CdisPb~CdisVOCIb, Ibw0
CchPb~CchUbusIb, Ib¡0
�ð26Þ
where Cdis and Cch are equivalent fuel economy
coefficients for battery discharging and charging
operations defined by
Cdis~a1 1zb1 SOC{SOCUzSOCL
2
� �� �ð27Þ
Cch~a2 1{b2 SOC{SOCUzSOCL
2
� �� �ð28Þ
where b1> 0 and b2> 0 respectively and a1, b1, a2,
and b2 are weighting coefficients to be selected
on the basis of the characteristics of the hybrid
powertrain system and its operational conditions.
Assuming that both b1 and b2 are zeros, constant
charge and discharge coefficients will be obtained,
where Cdis5 a1 and Cch5 a2. Ideally, a1 is the
equivalent fuel consumption to draw one unit of
electric power from the battery, and, similarly, a2is the equivalent fuel consumption to charge one
unit of electric power back to the battery. In order
to account for the battery power charged by
braking regeneration, a1 can be selected to be
smaller than its definition to make it cheap to
discharge from the battery. For this simulation the
optimized a1 is around 60 per cent of a2 (see
Table 2).
Terms associated with b1 and b2 are used to
optimize the battery operations. Considering equa-
tion (27), when the SOC is equal to the average of
SOCU and SOCL, the second term of equation (27)
is zero. When the SOC is greater than the average
of SOCU and SOCL, the second term is positive,
which encourages battery usage due to high
discharge efficiency, and vice versa. Similarly for
battery charge operation, from equation (28) it can
be seen that, when the SOC is greater than the
average of SOCU and SOCL, the second term is
negative, which discourages battery charging due
to low charge efficiency since the second term is
negative.
Now the total fuel consumption at a given
moment can be expressed as the sum of actual fuel
consumption of the engine–generator set and the
equivalent fuel consumption of the battery pack.
This provides a unified representation of the energy
used from both the fuel and the battery. The
proposed EFCOCS control strategy is the solution
of the minimization problem
Table 2 Charge and discharge coefficients
a1 b1 a2 b2
Initial 0.000 010 1.00 0.000 010 1.00Optimal 0.000 038 1.74 0.000 050 1.00
Fuel consumption control of a series hybrid electric vehicle 1009
JAUTO1074 F IMechE 2009 Proc. IMechE Vol. 223 Part D: J. Automobile Engineering
at MICHIGAN STATE UNIV LIBRARIES on April 2, 2015pid.sagepub.comDownloaded from

minTs,vsð Þ [V
J~ minTs,vsð Þ [V
w Ts,vsð Þ
~ minTs,vsð Þ [V
twg Ts,vsð Þzwb Ts,vsð Þs ð29Þ
where
where equation (4) (wg(Ts, vs)) and equation (12)
(wb(Ts, vs)) are used to obtain equation (30). The
desired electric power of the engine–generator set is
given by
Pg tð Þ~
0if Sg t{ð Þ~0 and
SOC t{ð ÞwSOCU
�
Pg,min
if Sg t{ð Þ~1 and
SOC t{ð ÞwSOCU
�
Ts optvs opt
if Sg t{ð Þ~1 and
SOCL¡SOC t{ð Þ¡SOCU
�
Pg,max
if Sg t{ð Þ~1 and
SOC t{ð ÞvSOCL
�
8>>>>>>>>>>>>><>>>>>>>>>>>>>:
ð31Þ
where Ts_opt and vs_opt are the optimal solutions of
equations (29) and (30).
Note that the constraint set V is defined by
equations (5) and (6), and gg is the generator efficiency
map as a function of both Ts and vs (see equation (2)).
The basic control strategy of EFCOCS, when the
vehicle is driven, is very close to that of PFCS. The
only difference is that, under the conditions that Sg51
and SOCL(SOC(t)(SOCU, the power required to be
provided by the engine–generator set is based upon
the optimization result of equations (29) and (30).
Similar to the PFCS case, the power output rate and
the off-time of the engine–generator set should also be
limited (see equations (23) and (24)), and the battery
supplies the rest of the power to meet the total power
requirement (see equation (25)).
Now consider the optimization problem described
in equations (29) and (30). Note that
C Ts,vsð ÞTsvs~Tsvs
ge Ts,vsð ÞHLHVð32Þ
Define
gp Peð Þ~ minTsvs~Pe, Ts,vs [V
1
ge Ts,vsð ÞHLHVð33Þ
where Pe is the engine power for the given engine
torque output Ts and speed vs. Then, the optimiza-
tion problem, defined in equations (29) and (30), can
be rewritten as
where Cg is the generation coefficient that is
assumed to be a constant over the optimized region
for simplification. In the case when this is not true, a
map gg(Pe) similar to equation (30) can be generated
for gg to replace Cg.
Equation (34) indicates that the proposed two-
parameter optimization problem can be con-
verted into a two-step optimization process; i.e.
the single variable optimization problem defined
in equation (34) can be solved for Pe_opt and
then Ts_opt and vs_opt found along the constant
power line Pe_opt5 Ts_optvs_opt such that the cost
function
1
ge Ts,vsð ÞHLHVð35Þ
is minimized. Therefore, the optimization problem
can be solved using a one-dimensional search
program. Note that the optimal solution of equa-
tion (33) can be solved offline for a given engine,
and only one one-dimensional optimization pro-
blem needs to be solved in real time, which makes
it feasible for real-time implementation. This pro-
cedure complies with these hybrid vehicles with
serial arrangement.
J~ C Ts,vsð ÞTsvszCdis
V 2OC{VOC
ffiffiffiffiffiffiffiffiffiffiffiffiffiffiffiffiffiffiffiffiffiffiffiffiffiffiffiffiffiffiffiffiffiffiffiffiffiffiffiffiffiffiffiffiffiffiffiffiffiffiV 2OC{4Rb Pr{vsTsgg
r2Rb
, if Ibw0
C Ts,vsð ÞTsvszCch Pr{vsTsgg
, if Ib¡0
8>>>><>>>>:
min0¡Pe¡C
Pegp Peð ÞzCdis
V 2OC{VOC
ffiffiffiffiffiffiffiffiffiffiffiffiffiffiffiffiffiffiffiffiffiffiffiffiffiffiffiffiffiffiffiffiffiffiffiffiffiffiffiffiffiffiffiffiffiV 2OC{4Rb Pr{PeCg
� �q2Rb
, if Ibw0
Pegp Peð ÞzCch Pr{PeCg
� �, if Ib¡0
8>><>>:
ð30Þ
ð34Þ
1010 J-P Gao, G-M G Zhu, E G Strangas, and F-C Sun
Proc. IMechE Vol. 223 Part D: J. Automobile Engineering JAUTO1074 F IMechE 2009
at MICHIGAN STATE UNIV LIBRARIES on April 2, 2015pid.sagepub.comDownloaded from

4 SIMULATION RESULTS
Based upon the architecture and design parameters
of the hybrid bus, a backward SHEV simulation
model was built in ADVISOR [19] as shown in Fig. 6.
To evaluate the performance under actual driving
conditions, six driving cycles were selected from a
number of standard cycles in ADVISOR, shown in
Fig. 7, where FTP and IM240 driving cycles have
a high percentage of suburban or highway driving,
1015 and ECE_EUDC_LOW cycles are mainly urban
driving, and NewYorkBus and MANHATTAN driving
cycles represent congested urban driving conditions.
In order to study the fuel economy of various control
strategies under a wide range of driving conditions, a
composite driving cycle is generated, which com-
bines FTP, 1015, and NewYorkBus driving cycles.
The four control parameters (shown in Table 2) for
Fig. 6 Backward simulation model of series hybrid electric bus
Fig. 7 Relevant driving cycles used in this paper
Fuel consumption control of a series hybrid electric vehicle 1011
JAUTO1074 F IMechE 2009 Proc. IMechE Vol. 223 Part D: J. Automobile Engineering
at MICHIGAN STATE UNIV LIBRARIES on April 2, 2015pid.sagepub.comDownloaded from

the proposed EFCOCS control strategy were opti-
mized using the optimization software called the
hierarchical evolutionary engineering design system
(HEEDS) [20], for the global fuel economy mini-
mization during the composite driving cycle, based
upon the ADVISOR model shown in Fig. 6. HEEDS is
a powerful software package developed by Michigan
State University based on genetic algorithms to auto-
mate and expedite the design optimization process.
Initial values in the first row of Table 2 were selected
fromavailable literature.After theHEEDSoptimization,
using the ADVISORmodel, optimal control parameters
wereobtained (see the second rowofTable 2). EFCOCS
strategy simulations were completed using the optimal
coefficients obtained through HEEDS optimization; in
order to have a fair comparison, the other three driv-
ing cycles were used for control strategy evaluation
simulations. They are IM240, ECE_EUDC_LOW, and
MANHATTAN driving cycles.
4.1 Power split between the engine and thebattery
Figure 8 shows the power distribution between the
engine–generator set and the battery for the three
supervisory control strategies evaluated under the
ECE_EUDC_LOW driving cycle.
For the TCS, the output power of the engine–
generator set is either zero or a fixed value
irrespective of the overall power requirement. This
causes the battery’s output power to fluctuate over a
large range (see Fig. 8(a)).
The PFCS adjusts the engine–generator set output
power to follow the power requirement. Therefore,
the battery provides the least output power (see
Fig. 8(b)).
In the case of the proposed EFCOCS, the overall
power requirement will be split into the engine–
generator set and the battery based upon the
Fig. 8 Power distribution comparison: (a) TCS; (b) PFCS; (c) EFCOCS
1012 J-P Gao, G-M G Zhu, E G Strangas, and F-C Sun
Proc. IMechE Vol. 223 Part D: J. Automobile Engineering JAUTO1074 F IMechE 2009
at MICHIGAN STATE UNIV LIBRARIES on April 2, 2015pid.sagepub.comDownloaded from

proposed solution of the optimization problem, and
so the engine–generator set operated at a much
smaller but more efficient region (see Fig. 8(c)).
The averaged charge and discharge powers of
three strategies are listed in Table 3, which indi-
cates that the TCS strategy is the highest and the
PFCS strategy is the lowest, while the EFCOCS
strategy is between the TCS and PFCS strategies.
4.2 Output performance of the engine
Fuel economy and emission performance of an
internal combustion engine mainly depend on their
operation points. This directly affects the fuel
economy and harmful emissions of the hybrid bus.
This section compares the simulation results under
the ECE_EUDC_LOW driving cycle.
In the TCS, shown in Fig. 9(a), the engine
operates at its highest efficiency condition when-
ever it is turned on except for during transient
conditions. This provides the highest engine effi-
ciency possible but may not provide the best
overall system fuel economy and emission perfor-
mance.
In the PFCS, shown in Fig. 9(b), the engine’s
output power follows the desired power possible
to minimize the battery charging and discharging
operation at high currents; i.e. the battery power
efficiency is optimized. Therefore, the engine oper-
ates in a relative large region over the engine
efficiency map.
In contrast, in the EFCOCS, shown in Fig. 9(c), the
efficiency of the overall system (the engine and the
battery) is considered, leading the engine to operate
in a smaller region over its efficiency map than the
PFCS does.
4.3 Output performance of the battery pack
Under the assumption that the power requirement
can be satisfied, a good control strategy should
enable the battery pack to have the following
characteristics.
1. The SOC should be restored to its target quickly.
This not only leads to a highly efficient battery
charge and discharge but also ensures that the
battery always has enough electric energy to meet
the powertrain power requirement in the future.
2. The output voltage of the battery (equal to the bus
voltage) should be close to the rated bus voltage
with as small a fluctuation as possible. This helps
to extend the battery life as well as that of other
electric components.
3. Charging and discharging the battery with a high
current should be avoided owing to the low
charge and discharge efficiency and reduced
battery life.
Under the ECE_EUDC_LOW driving cycle, it is
easy to see that in the first strategy (TCS), the
fluctuations in the battery output voltage and
current are the highest of the three control strategies
Table 3 Averaged charge and discharge powers
Controlstrategy
Averaged chargepower (kW)
Averaged dischargepower (kW)
TCS 67.63 69.18PFCS 55.17 59.42EFCOCS 63.07 65.82
Fig. 9 Comparison of the engine’s operation pointsunder the ECE_EUDC_LOW driving cycle: (a)TCS; (b) PFCS; (c) EFCOCS
Fuel consumption control of a series hybrid electric vehicle 1013
JAUTO1074 F IMechE 2009 Proc. IMechE Vol. 223 Part D: J. Automobile Engineering
at MICHIGAN STATE UNIV LIBRARIES on April 2, 2015pid.sagepub.comDownloaded from

(Figs 10 and 11). For the PFCS case, the fluctuations
are the smallest since the engine–generator set
output power follows the desired power very well.
The fluctuations in the last case (EFCOCS) are
between the other two strategies and are very close
to the second strategy (PFCS).
Fig. 11 Comparison of the bus currents under the ECE_EUDC_LOW driving cycle: (a) TCS; (b)PFCS; (c) EFCOCS
Fig. 10 Comparison of the bus voltages under the ECE_EUDC_LOW driving cycle: (a) TCS; (b)PFCS; (c) EFCOCS
1014 J-P Gao, G-M G Zhu, E G Strangas, and F-C Sun
Proc. IMechE Vol. 223 Part D: J. Automobile Engineering JAUTO1074 F IMechE 2009
at MICHIGAN STATE UNIV LIBRARIES on April 2, 2015pid.sagepub.comDownloaded from

4.4 Fuel economy performance evaluation
The fuel economy performance can be expressed in
terms of the fuel economy and electrical energy
consumption; the fuel economy can be expressed by
the net fuel consumption of the internal combustion
engine, while the electrical energy consumption can be
expressed by DSOC. Figure 12 shows the fuel economy
of this bus with different control strategies evaluated
by this method; the simulation data are obtained by
applying different control strategies under the three
different driving cycles. Global optimized fuel econ-
omy results using DP were also obtained.
From Fig. 12, it can be observed that, under the
IM240 driving cycle, the best fuel economy is the
global optimization strategy followed by EFCOCS,
TCS, and PFCS; under the MANHATTAN driving
cycle, the order changed a little and it becomes
global optimal, EFCOCS, PFCS, and TCS, while,
under the ECE_EUDC_LOW driving cycle, the order
is a function of DSOC. When DSOC is between 20.05
and 0.75, the order is global optimal, EFCOCS, PFCS,
and TCS, and, when DSOC is greater than 0.075, the
order becomes global optimal, EFCOCS, TCS, and
PFCS. Overall, the EFCOCS provide the best fuel
economy of the three control strategies (TCS, PFCS,
and EFCOCS) under three driving cycles.
DSOC sweep simulation allows the fuel economy
performance to be studied for a given control
strategy over a wide range of DSOC values under a
given driving cycle. The so-called classical ‘SOC
correction routine’ reduces the dual performance
criteria to a single criterion; i.e. all real-time control
strategies provide a fixed electric energy consump-
tion DSOC5 SOCend2 SOCstart, where SOCstart and
SOCend are the SOCs at the start and end respectively
of the simulation cycle. DSOC was selected to be zero
to compare the fuel economy performance; i.e. the
total electrical energy consumption over the simu-
lated electrical energy consumption is zero. In this
case, only the fuel consumption needs to be
compared for all simulations. Fuel economy simula-
tion results for all three control strategies (TCS,
PFCS, and EFCOCS) are listed in Table 4, together
with the global optimization results obtained using
DP. From Table 4, it can be seen that TCS provides
good fuel economy performance under the IM240
cycle (with a high percentage of highway driving),
compared with PFCS, while the PFCS performs
well under the ECE_EUDC_LOW and MANHATTAN
cycles (with a high percentage of urban driving),
compared with the TCS, but the EFCOCS provides
the best fuel economy for all driving cycles com-
pared with the TCS and PFCS; i.e. the EFCOCS has
the best fuel economy compared with the TCS and
PFCS for both highway and urban driving con-
ditions. Although the global optimization control
strategy is very difficult to implement for real-time
control, it is useful to compare its simulation results
with those of real-time control strategies to find the
distance between real-time solutions and the global
optimal solution. Comparing the fuel consumptions
of the global optimization control strategy in Table 4
with three real-time control strategies, it is clear that
Fig. 12 Fuel economy versus DSOC for the TCS, PFCS, EFCOCS, and global optimal strategies
Table 4 Comparison between simulation resultsunder different driving cycles
Controlstrategy
Fuel consumption (l/100 km)
IM240 ECE_EUDC_LOW MANHATTAN
TCS 34.7 47.8 63.8PFCS 36.5 45.7 56.5EFCOCS 32.9 42.3 54.7Globaloptimization
30.2 38.5 49.3
Fuel consumption control of a series hybrid electric vehicle 1015
JAUTO1074 F IMechE 2009 Proc. IMechE Vol. 223 Part D: J. Automobile Engineering
at MICHIGAN STATE UNIV LIBRARIES on April 2, 2015pid.sagepub.comDownloaded from

the proposed EFCOCS provides the closest results to
those provided by global optimization. This also
shows that the proposed EFCOCS is capable of
providing good fuel economy under different driving
cycles.
5 CONCLUSIONS
TCS, PFCs, and power split control strategies are the
most popular real-time supervisory control strate-
gies for SHEVs. The EFCOCS, one kind of power split
control strategy, is proposed in this paper. Evalua-
tion simulations of a backward series hybrid bus
model using ADVISOR were conducted for all three
control strategies. Results show that the TCS pro-
vides the best efficiency for the engine–generator set,
leading to good fuel economy performance under
highway driving conditions. The PFCS provides
sustainable SOC regulation with a stable bus voltage.
This improves the battery durability and that of
other electrical components with good fuel economy
performance during urban driving. The proposed
EFCOCS provides a reasonable power distribution
between the engine–generator set and battery pack,
leading to the best overall fuel economy under both
urban and highway driving conditions; it also
provides fuel economy results close to the global
optimization data. Future research will emphasize
the real-time implementation of the EFCOCS to the
HEV.
REFERENCES
1 Pisu, P. and Rizzoni, G. A comparative study ofsupervisory control strategies for hybrid electricvehicle. IEEE Trans. Control System Technol., 2007,15(3), 506–518.
2 Lin, C. C., Peng, H., Grizzle, J. W., and Kang, J. M.Power management strategy for a parallel hybridelectric truck. IEEE Trans. Control Systems Technol.,2003, 11(6), 839–849.
3 Arsie, M. G., Pianese, C., Rizzoni, G., and Sorren-tino, M. Optimization of supervisory controlstrategy for parallel hybrid vehicle with provisionalload estimate. In Proceedings of the SeventhInternational Symposium on Advanced VehicleControl (AVEC ’04), Arnhem, The Netherlands,23–27 August 2004, vol. 8, pp. 483–488.
4 Koot, M., Kessels, J. T. B. A., de Jager, B., Heemels,W. P. M. H., van den Bosch, P. P. J., andSteinbuch, M. Energy management strategies forvehicular electric power systems. IEEE Trans.Vehicular Technol., 2005, 54(3), 771–782.
5 Delprat, S., Lauber, J., Guerra, T. M., and Rimaux,J. Control of a parallel hybrid powertrain: optimalcontrol. IEEE Trans. Vehicular Technol., 2004,53(3), 872–881.
6 Hong, H., Huang, X., Luo, Y., and Zhao, K. Globaloptimization control of a parallel hybrid electricvehicle. J. South China Univ. Technol., 2006, 34(4),28–37.
7 Jalil, N., Kheir, N. A., and Salman, M. A rule-basedenergy management strategy for a series hybridvehicle. In Proceedings of the American ControlConference, 4–6 June 1997, pp. 689–693 (IEEE, NewYork).
8 Barsali, S., Miulli, C., and Possenti, A. A controlstrategy to minimize fuel consumption of serieshybrid electric vehicles. IEEE Trans. Energy Con-version, 2004, 19(1), 187–195.
9 Konev, A., Lezhnev, L., and Kolmanovsky, I.Control strategy optimization for a series hybridvehicle. SAE paper 2006-01-0663, 2006.
10 Wang, Z., Li, W., and Xu, Y. A novel power controlstrategy of series hybrid electric vehicle. In Pro-ceedings of the IEEE/RSJ International Conferenceon Intelligent robots and systems, 29 October–2November 2007, pp. 96–102 (IEEE, New York).
11 He, H., Gao, J., and Zhang, Y. Fuel cell outputpower-oriented control for a fuel cell hybridelectric vehicle. In Proceedings of the AmericanControl Conference, 11–13 June 2008, pp. 605–610(IEEE, New York).
12 Delprat, S., Guerra, T. M., and Rimaux, J. Controlstrategies for hybrid vehicles: synthesis and evalua-tion. In Proceedings of the IEEE 58th VehicularTechnology Conference, 9 October 2003, vol. 5, pp.3246–3250 (IEEE, New York).
13 Perez, L. V. and Pilotta, E. A. Optimal power splitin a hybrid electric vehicle using direct transcrip-tion of an optimal control problem. Math. Comput.Simulation, 2009, 79(6), 1959–1970.
14 Paganelli, G., Delprat, S., Guerra, T. M., Rimaux,J., and Santin, J. J. Equivalent consumptionminimization strategy for a parallel hybrid power-trains. In Proceedings of the IEEE 55th VehicularTechnology Conference, 6–9 May 2002, vol. 4, pp.2076–2081 (IEEE, New York).
15 Pisu, P. and Rizzoni, G. A supervisory controlstrategy for series hybrid electric vehicles with twoenergy storage systems. In Proceedings of the 2005IEEE Vehicle Power and Propulsion Conference, 7September 2005, pp. 65–72 (IEEE, New York).
16 Kleimaier, A. and Schroder, D. An approach forthe online optimized control of a hybrid power-train. In Proceedings of the Seventh InternationalWorkshop on Advanced motion control, 3–5 July2002, pp. 215–220 (IEEE, New York).
17 Jonannesson, L., Asbogard, M., and Egardt, B.Assessing the potential of predictive control forhybrid vehicle powertrains using stochastic dy-namic programming. IEEE Trans. Intell. TranspnSystems, 2007, 8(1), 71–83.
1016 J-P Gao, G-M G Zhu, E G Strangas, and F-C Sun
Proc. IMechE Vol. 223 Part D: J. Automobile Engineering JAUTO1074 F IMechE 2009
at MICHIGAN STATE UNIV LIBRARIES on April 2, 2015pid.sagepub.comDownloaded from

18 Johnson, V. H. Battery performance models inADVISOR. J. Power Sources, 2002, 110(2), 321–329.
19 Markel, T., Brooker, A., Hendricks, T., Johnson,V., Kelly, K., Kramer, B., O’Keefe, M., Sprik, S.,andWipke, K. ADVISOR: a systems analysis tool foradvanced vehicle modeling. J. Power Sources, 2002,110, 255–266.
20 HEEDS (Hierarchical Evolutionary Engineering De-sign System) professional design optimization soft-ware (Red Cedar Technology, East Lansing, Michi-gan), available from www.redcedartech.com/products/heeds_professional, 2009.
APPENDIX
Notation
(A h)max maximum battery capacity
(A h)used used battery capacity
C(Ts, vs) fuel economy map of the engine–
generator set
Cch equivalent fuel economy
consumption coefficient for the
charging battery
Cdis equivalent fuel economy
consumption coefficient for the
discharging battery
Cg constant generation coefficient over
the optimized region for
simplification
HLHV low heating value of fuel
Ib electric current of the battery pack
Ib,max maximum battery charge current
allowed
Ib,min minimum battery discharge current
allowed
Ig generator output current
m fuel mass flowrate
Pb power required from the battery
Pbg electrical power generated during
braking regeneration
Pb,max maximum requested power allowed
when the engine–generator is off
Pc electrical power charged into battery
during braking regeneration
Pch selected charge power magnitude
Pe engine output power
Pf fuel power
Pg power generated by engine–
generator set
Pg,max maximum electric power output of
the engine–generator set
Pg,min minimum electric power output of
the engine–generator set
Pr overall power requirement
Pmax upper limit on output power rate of
change of the engine–generator
Pmin lower limit on the output power rate
of change of the engine–generator
Rb internal battery resistance
SOC state of charge
SOCend state of charge at the end of a
simulation cycle
SOCL minimum state of charge allowed for
the battery pack
SOCstart state of charge at the beginning of a
simulation cycle
SOCU maximum state of charge allowed for
the battery pack
Sg(t) on–off state of the engine–generator
set
tg,off accumulated engine–generator set
off-time since it is turned off
tmin minimal off-time allowed for the
engine–generator set
T temperature
Tmax(vs) maximum engine output torque as a
function of its speed
Ts engine output torque
(Ts_opt, vs_opt) optimal solutions for the
engine–generator set
(Ts,g, vs,g) engine–generator set operational
conditions with the best fuel
economy
Ubus electric bus voltage
VOC open-circuit voltage
a1 weighting coefficient of equivalent
fuel consumption for drawing one
unit of electric power from the
battery
a2 weighting coefficient of equivalent
fuel consumption for charging one
unit of electric power back to the
battery
b1 weighting coefficient used for
maintaining the state of charge
during the discharging operation
b2 weighting coefficient used for
maintaining the state of charge
during the charging operation
DSOC state-of-charge offset from the initial
state of charge during a simulation
cycle
gCoulomb coulomb efficiency of the battery
pack
ge(Ts, vs) engine efficiency map
gg(Ts, vs) generator efficiency map
Fuel consumption control of a series hybrid electric vehicle 1017
JAUTO1074 F IMechE 2009 Proc. IMechE Vol. 223 Part D: J. Automobile Engineering
at MICHIGAN STATE UNIV LIBRARIES on April 2, 2015pid.sagepub.comDownloaded from

wg total fuel flow of the internal
combustion engine
ve,max maximum engine speed allowed
ve,min minimum engine speed allowed
vg,max maximum generator speed allowed
vg,min minimum generator speed allowed
vs engine speed
V engine operational region
1018 J-P Gao, G-M G Zhu, E G Strangas, and F-C Sun
Proc. IMechE Vol. 223 Part D: J. Automobile Engineering JAUTO1074 F IMechE 2009
at MICHIGAN STATE UNIV LIBRARIES on April 2, 2015pid.sagepub.comDownloaded from