Embed Size (px)
Citation preview
City Telecom (H.K.) LimitedDBS Vickers Pulse of Asia ConferenceSingapore
(HKEX:1137.HK / NASDAQ: CTEL)NiQ Lai, [email protected], +852 3145 606813 Jan 2010
1

2
This presentation contains forward-looking statements and information that involve risks, uncertainties and assumptions.Forward-looking statements are all statements that concern plans, objectives, goals, strategies, future events or performanceand underlying assumptions and other statements that are other than statements of historical fact, including, but not limitedto, those that are identified by the use of words such as "anticipates,'' "believes,'' "estimates,'' "expects,'' "intends,'' "plans,''"predicts,'' "projects'' and similar expressions.
Risks and uncertainties that could affect us include, without limitation: changes in technology; changes in the regulatoryenvironment in which we operate, or changes in the rules and polices that government regulators apply to our businesses;increased competition in the international services or fixed telecommunications network services; the benefits we expect toreceive from our continuing capital expenditure on our network; our ability to both maintain growth and successfullyintroduce new products and services; and the continued development and stability of the technological infrastructure we useto provide our telecommunications and Internet services.
Should one or more of such risks and uncertainties materialize, or should any underlying assumption prove incorrect, actualoutcomes may vary materially from those indicated in the applicable forward-looking statements. Any forward-lookingstatement or information contained in this presentation speaks only as of the date the statement was made.
We are not required to update any such statement or information to either reflect events orcircumstances that occur after the date the statement or information is made or to accountfor unanticipated events.
Disclaimer

US$400 million + 10 years later …
Click to watch on youtube: http://www.youtube.com/watch?v=wxuuK8r6T-s
3

Industry leading growth via market share gains. 17.7% growth to 943,000 subscription base for broadband, voice and IP-TV, majority of whom are on secured 24-month service contracts.
Turnover growth of 13.4% to HK$1,478.2 mn. EBITDA Growth of 34.4% to HK$508.1 mn.
Positive free cash flow for the third consecutive year, profit after tax up 70.0% to HK$212.8 mn and a net cash balance sheet.
FY2009 full year dividend per share up 216.7% to HK19 cents, 4.3% yield on stock price of HK$4.40 as of 8 Jan 2010.
Grew homes pass coverage by 140,000 to 1.62 mn and corporate buildings by 530 to 1,230, expanding our base for future growth.
FY09 Key Achievements
4

For the future ... Look to Japan
FTTH: +2.864 mn
DSL: -1.527 mn
CATV: +0.239 mn
12M to 2009/03
5

Agenda
How We Do ItFinancial Review
Management Outlook
6

Hong Kong’s Extreme Density
• Extremely compelling “Addressable Income per Fibre Mile”.
• US$200/Home Pass cost is <1/5th of US and European benchmarks.
Country
GDP/
Capita
(U$)
Pop
(million)
Area
(mi2)
Density
(mi2)
HK 30,755 7 428 16,380
US 46,859 302 3,717,813 80
Japan 38,559 127 145,868 640
IMF 2008 data
View from Victoria Peak
Luxury apartments in Kowloon East
7 7

End-To-End Bypass of Incumbent
End to End Network
• Brand-new fibre network completely bypassing the incumbent.
• When Alexander Graham Bell invented the telephone network system in 1876, it was not designed for computing. CTEL’s network is a computer network.
LAN Switches within
100m of end users
100 meters of Category 5e Copper Wiring
Fibre-To-The-Building
In-building Diagram
8

Can a New Generation Network cost base be structurally lower than the incumbent?
Cost per subscriber = US$1,295 / X, with X = number of subscribers:
If X = 1, cost per subscriber = US$1,295, i.e. relatively expensive.If X = 24, cost per subscriber = US$54, i.e. difficult for xDSL to match.
Above list price example is before bulk purchase discounts.
Furthermore, NGN bandwidth is symmetric at 100 Mbps which is difficult for xDSL to match on a mass scale.
Answer: It depends on network utilization.
Cisco Catalyst 2960 Router with 24 subscriber ports
List Price: US$1,295
9

22x Better Value
Only HKBN offers 80% bandwidth Guarantee of 2x money back AND
22x better vlaue.
Company TechnologyDownload / Upload
Speed
List Price
/Month Cost per Mbps
CTEL Fibre based FTTx 100Mbps / 100Mbps US$13 US$$0.06
IncumbentCopper based
xDSL8Mbps / 0.8 Mbps US$13 US$1.44
1010

The Brand Advantage
2008: Desell – Part II
Alexander Bell visits Broadband Hell to explain that the copper telephone line designed a 100 years ago.
http://www.youtube.com/watch?v=CJmfcFhJsWE
2007: Desell – Part I
Largest network is still providing broadband on old phone lines.
http://www.youtube.com/watch?v=BOceE7j--Oc
2009: “Awesome Speed. For Everyone”
A Lamborghini “SuperCar” experience for everyone.
http://www.youtube.com/watch?v=gj27SOjOn58
11

Wireless Broadband is a not a Substitute
HKBN Fibre Broadband Services Wireless 3.5G
HKBN bb100 Wireless 3.5G
Downlink 100 Mbps 21 Mbps
Uplink 100 Mbps 6 Mbps
Bandwidth Guarantee 80% of Advertise Bandwidth
Not Available
Cost Per Month US$13 US$69
US$/Mbps/Month US$0.06 US$2.60
12

64 content + 24 interactive channels capturing a wide range of interest.
bbNews available cross platforms @ www.youtube.comsince August 2009
bbTV - A Better Value Buffet Alternative
13

Management Mix
Mr. NiQ Lai
Chief Financial Officer and Head of Staff EngagementYears with Co: 5 years
Prior to joining CTEL in 2004, was Director and Head of Asia Telecom
Equity Research for Credit Suisse.
Bachelor of Commerce -University of Western
Australia, EMBA - Kellogg-HKUST, Fellow - CPA
Australia, Fellow - HKICPA and Member - Hong Kong Institute of Independent
Directors
Mr. Paul Cheung
Co-Founder, Vice ChairmanYears with Co: 16 years
Over 27 years experience in telecommunication and
computer industries
Diploma of Advanced Programming and Systems Concepts Design - Herzing
Institute, Canada
Mr. William Yeung
Chief Executive OfficerYears with Co: 4 years
Over 17 years experience in telecommunication
industry including 9 years at SmarTone Vodafone prior to joining CTEL
Bachelor of Arts and Master of Science in
Electronic Commerce and Internet Computing –Hong Kong University, MBA - University of Strathclyde, UK
Mr. Ricky Wong
Co-Founder, ChairmanYears with Co: 16 years
Over 20 years experience in telecommunication and
computer industries
Bachelor’s Degree in Science and EMBA - The
Chinese University of Hong Kong
14

Talent Engagement
“CXO of the Future”
� Management Trainee Program� Develop our future CEO, CFO, CTO
etc in 15-20 years time. � Requires - CFA Level 1, half
marathon, 36 management books, etc.
� 400 applicants, 3 hired in 2009.
“Talent Infinity”
� 75% of top 33 executives have or working towards a post graduate degrees, with company sponsorship of 50-100% of fees.
� These includes programs organized by Kellogg-HKUST, The Chinese University of Hong Kong, Kellogg School of Management and Michigan Ross School of Business.
15

New vertical model optimized for customer engagement BUT requires “smart” Mini-CEOs
Director of Network Development
Director of Customer Service
Director of Sales
Director of Network Maintenance
Ho
ng
Ko
ng
Isla
nd
Ko
wlo
on
East
New
Terr
ito
ries E
ast
Ko
wlo
on
West
New
Terr
ito
ries W
est
Cu
sto
mer
Exp
eri
en
ce
16

Agenda
How We Do It
Financial ReviewManagement Outlook
17

59
(4)
5
61
(18)
10
(26)
5
27
(13)
13
34
(7)(11)
41
7
20
3832
37
PCCW (31 Dec YE) CTI (31 Aug YE) i-Cable (31 Dec YE) HTHK (31 Dec YE)
1H 2007
2H 2007
1H 2008
2H 2008
1H 2009
2H 2009
Net Additions (‘000)
Source: PCCW, i-Cable’s, HTHK Interim Annual Reports; JP Morgan HTHK report dated 12 Aug 2009; HTIL 20-F Filing. Note: PCCW reports “broadband access lines” rather than subscriptions
Broadband: Rapidly winning market share
Subscriptions(‘000)
Most Recent 6 months net unit growth
1,176
324245
306255280 260267 261
350260 250
391
227
1,237
247
1,275
279
1,302
316
1,305
PCCW (31 Dec YE) CTI (31 Aug YE) i-Cable (31 Dec YE) HTHK (31 Dec YE)
1H 2007
2H 2007
1H 2008
2H 2008
1H 2009
2H 2009
18

245.2
353.8378.0
508.1
(92.2)
28.9
125.2
212.8
FY06 FY07 FY08 FY09
EBITDA
Net Profit
948.5 950.4 953.8
683.6
163.3
647.9
396.1
547.3
421.6
221.1
FY05 FY06 FY07 FY08 FY09
Gross Debt
Gross Cash
Note: EBITDA for any period means, without duplication, net income for such period, plus the following to the extent deducted in calculating such net income: net interest expense/ (income), income taxes, depreciation and amortization expense (excluding any such non cash charge to the extent it represents an accrual of or reserve for cash charges in any future period or amortization of a prepaid cash expense that was paid in a prior period not included in the calculation).
Financial Trends
EBITDA and Net Profit Improvement
Net Cash Balance Sheet in FY2009
Positive Free Cash Flow Since FY2007
Achieved net debt free position
245.2
353.8378.0
508.1
323.0
132.3
211.7
286.7
FY06 FY07 FY08 FY09
EBITDA
Total CapexHK$ mn
19

Income Statement
FTNS turnover grew by 21.8% to HK$1,230.9 mn, representing 83.3% of total turnover.
Other income includes net gain of HK$31.4 mn on senior notes buyback and cancellation during FY2009.
Tax includes non-cash deferred taxation of HK$37.1 mn.
Note: * Core EBITDA excludes net gain of HK$31.4 mn from senior notes buyback and cancellation.
HK$ mn FY08 FY09 YoY %
Fixed Telecoms Network Services 1,011.0 1,230.9 21.8%
International Telecoms 292.0 247.3 -15.3%
Turnover 1,303.0 1,478.2 13.4%
Interest income 15.6 4.8 -69.2%
Other income, excluding interest income 9.4 36.7 290.4%
Other revenues 25.0 41.5 66.0%
Network Expenses (178.4) (175.1) -1.8%
Staff Costs (247.5) (302.3) 22.1%
Office Expenses (29.0) (33.8) 16.6%
General and Administration (138.0) (142.6) 3.3%
Advertising and Promotion (341.5) (353.0) 3.4%
Operating Cash Costs (934.4) (1,006.8) 7.7%
EBITDA 378.0 508.1 34.4%
EBITDA Margin 29.0% 34.4%
Core EBITDA* 476.7
Core EBITDA Margin 32.2%
Depreciation (210.1) (206.2) -1.9%
Operating Profit 183.5 306.7 67.1%
Finance Costs (75.1) (55.1) -26.6%
Profit Before Tax 108.4 251.6 132.1%
Tax 16.8 (38.8) -331.0%
Profit After Tax 125.2 212.8 70.0%
Earnings per Share (HK cents/share)
- Basic (HK cents/share) 19.7 32.4 64.5%
- Fully Diluted (HK cents/share) 19.0 31.8 67.4%
Dividend declared (HK cents/share) 6.0 19.0 216.7%
Total Capex 211.7 286.7 35.4%
EBITDA - Capex - net financing cost 106.7 171.1 60.4%20

During FY2009, brought back and cancelled US$68 mn (HK$527.0 mn) of senior notes at below par.
As of 31 Aug 2009, achieved net cash position of HK$57.8 mn on gross cash and cash equivalent balance of HK$221.1 mn.
Additional reserve liquidity secured with committed revolving bank facility of HK$190 mn until July 2011.
Balance Sheet
HK$ mn 31-Aug-08 31-Aug-09
Goodwill 1.1 1.1
Fixed assets 1,231.4 1,302.4
Deferred tax assets 26.3 -
Long term prepayment 5.6 6.0
Long-term portion - deferred expenditure 15.4 12.8
Cash and bank balances 421.6 221.1
Restricted bank deposit 87.3 15.0
Other current assets 291.7 226.6
Current assets 800.6 462.7
Current liabilities (359.4) (377.7)
Employment of capital: 1,721.0 1,407.3
Shareholder funds 1,032.6 1,228.5
Deferred taxation 4.9 15.7
Finance lease 0.3 0.5
8.75% 2015 Senior Notes 683.2 162.6
Funds employed 1,721.0 1,407.3
Gross Debt to EBITDA (x) 1.8 0.3
Net Debt to EBITDA (x) 0.7 Net Cash
21

Increased Dividend Payout Ratio
The Board of Directors recommends a final cash dividend per share of HK16 cents, making a total dividend of HK19 cents for FY2009 (FY2008: HK6 cents).
Since achieving positive adjusted free cash flow (EBITDA-Capex-Net Finance Costs) in FY2007, we have been paying a portion of this metric as our dividend policy.
We raised the payout from around 30% in FY2008 to around 75% in FY2009 due to: - growing portion of our business with service under secured 24 months contracts, - controllable capital expenditure, and - net cash balance sheet.
Going forward, we aim to maintain dividend payout in the range of 50-75%.
Dividend per ordinary share in HK$
217% increase
0.08
0.06
0.19
FY07 FY08 FY09
22
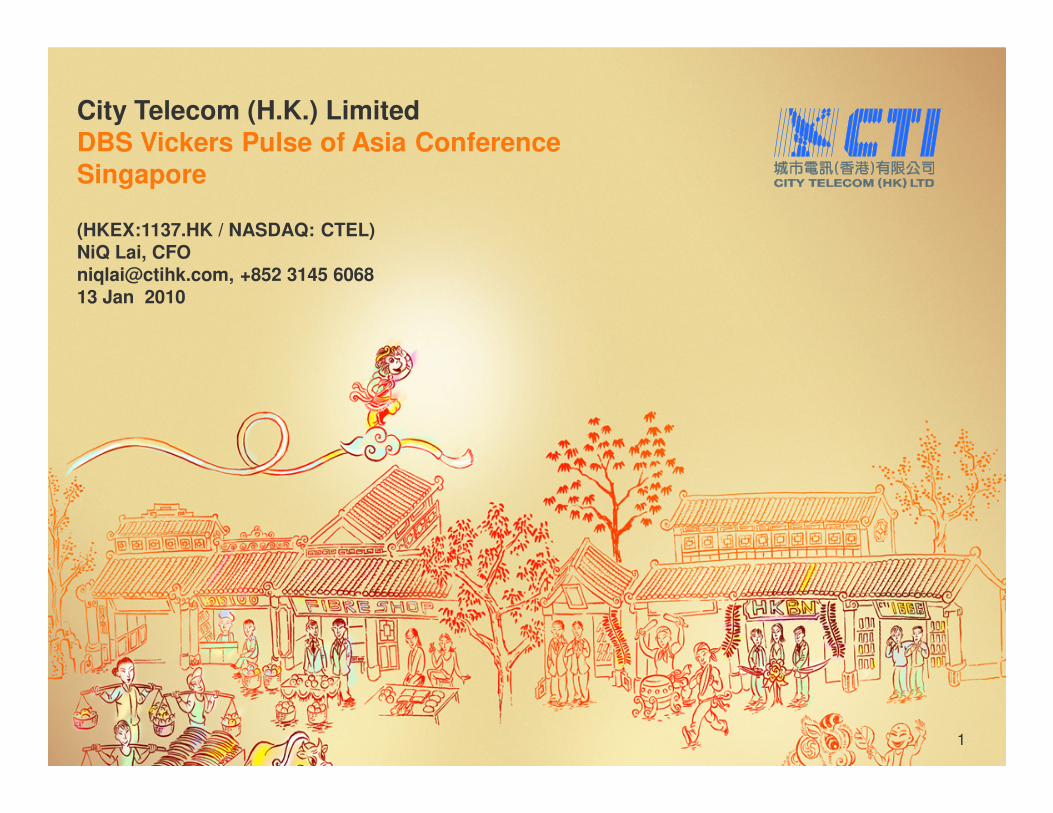
5-Year Financial Summary
FY05 FY06 FY07 FY08 FY09 1H FY08 2H FY08 1H FY09 2H FY09
FTNS Subscriptions ('000)
Broadband 229 220 247 316 391 279 316 350 391
Voice 294 281 308 329 382 311 329 352 382
Digital TV 109 116 128 156 170 136 156 170 170
Total 632 617 683 801 943 726 801 872 943
Broadband Blended ARPU (HK$/month) (Note 1) 108 148 175 191 182 177 191 196 182
IDD Minutes (mn) 947 788 659 574 487 275 275 245 242
Income Statement (HK$ mn)
Fixed Telecom Network Services 604.8 741.3 816.8 1,011.0 1,230.9 536.1 536.1 592.8 638.1
International Telecoms 532.6 418.3 324.5 292.0 247.3 143.1 143.1 128.4 118.9
Turnover 1,137.4 1,159.6 1,141.3 1,303.0 1,478.2 623.8 679.2 721.2 757.0
EBITDA (Note 2) 58.6 245.2 353.8 378.0 508.1 187.1 190.9 232.0 276.1
EBITDA Margin 5.2% 21.1% 31.0% 29.0% 34.4% 30.0% 28.1% 32.2% 36.5%
Profit / (Loss) After Tax (213.3) (92.2) 28.9 125.2 212.8 47.8 77.4 75.3 137.5
Total Capex 419.1 323.0 132.3 211.7 286.7 68.4 143.3 145.9 140.8
Adjusted FCF (EBITDA - Capex - Net Finance Cost) (401.4) (146.0) 156.7 106.7 171.1 88.4 18.4 58.2 112.9
Gross Debt to EBITDA (x) 16.2 3.9 2.7 1.8 0.3 1.8 1.8 1.5 0.3
Net Debt to EBITDA (x) 5.1 2.3 1.1 0.7 Net Cash 1.0 0.7 0.3 Net Cash
Basic EPS (HK cents/share) (34.8) (15.0) 4.7 19.7 32.4 7.6 12.1 11.6 20.8
DPS (HK cents/share) - - 8.0 6.0 19.0 4.0 2.0 3.0 16.0
Notes: 1. For ex it acquistion and contract renew al
Notes: 2. For FY09, EBITDA includes HK$31.4 mn gain on senior notes buyback and cancellation (FY08: HK$2.6 mn)
6 Months12 Months Ended Aug 31
23

Since FY2007, the start of our 10-year Big Hairy Audacious Goal (BHAG) period, we have achieved accelerated growth. Broadband is particularly strong with 23.7% year-on -year growth rate to 391,000, far exceeding the industry growth rate of approximately 2.8% to 2.0 mn.
Note: *includes all registered paid and free, on-net and off-net subscriptions.
FTNS Performance - Triple Play Subscriptions
Subscription (‘000)
229 220 247316
391
294 281308
329
382109 116
128
156
170
FY05 FY06 FY07 FY08 FY09
Digital TV
Voice
Broadband
Start of 10 year BHAG period
24

During FY2009, ARPU fell by 4.7% to HK$182/month as we focused on expanding our customer base for future growth.
During FY2009, Broadband churn rate remained well below 1.0% per month.
*Note: For exit acquisition and contract renewal
Broadband ARPU Trend
Blended ARPU HK$
113
148
175
191182
FY05 FY06 FY07 FY08 FY09
25

Hong Kong Based Acquisition
1,633 Talents^
Guangzhou Based Retention
1,520 Talents^
Two-thirdreduction in
costs
Margin Expansion with transition from Acquisition to Retention
^These refer to the number of talents working in the location indicated. 26

During FY2009, grew homes pass coverage by 140,000 to 1.62 mn and corporate buildings by 530 to 1,230, expanding our base for future growth. Maintain target for Fibre network expansion to 2.0 mn homes pass and 1,800 commercial buildings by end 2011.
Budgeted annual capital expenditure of HK$300-350 mn per year for FY2010-11 and maintain “CAPEX level below EBITDA” policy.
Capital Expenditure
HK$ mn419.1
323.0
132.3
211.7
286.7
FY05 FY06 FY07 FY08 FY09
27

Agenda
How We Do It
Financial Review
Management Outlook
28

Our Passion
Vivid Description“My children will say, “Dad I
love you as my Father””
Big Hairy Audacious Goal (BHAG)
“Be the largest IP provider in Hong Kong
by 2016”
Core Value“To experience the emotion of competition, winning and
crushing competition”
29

Member Get Member: “AWESOME SPEED. FOR EVERYONE”
100Mbps broadband at HK$99/monthInterview with CEO can be viewed at http://www.youtube.com/watch?v=IZqhiziKzZ0
3,000 Talent Town-Hall Meetings
30

Member Get Member:“Turn One Happy Customer into Two.”
Existing Happy Customer(with Bigger Smile!)
bb100 @ HK$99/month+
Note: + Foundation for Value Added Services Upsell, e.g. bbDrive package @ HK$20/month, Voice @ HK$20-40/month, bbTV @ HK$40-70/month, etc.
New Happy Customerbb100 @ HK$99/month+
Existing Happy Customer HK$182/month
31

It’s a Huge Market for CTEL
2008
5% of US$3.6 billion revenue market share
today
2016
BHAG: Hong Kong’s largest IP Service
Provider
PCCW - TSS62%
PCCW - Now TV8%
Hutchison - Fixed9%
Wharf T&T6%
i-Cable7%
Hong Kong Broadband Network
5%
New World3%
3232

Accelerate our broadband growth from 391,000 subscriptions as of 31 August 2009 to exceed 500,000 subscriptions by 31 August 2010
mild revenue growth,
flat core EBITDA of HK$478 million, and
Capital Expenditure at HK$300-350 mn.
Big, Hairy & Audacious Goal (BHAG)
“To be the largest IP provider in Hong Kong by 2016”
Company Vision Statement set in November 2006
FY2010 Guidance
With objective firmly set on achieving our BHAG, we have the following outlook for FY2010:
33

For the four months to 31 Dec 2009 (1st four months of FY2010):
added net 52,000 broadband subscriptions which compares with our full financial year 2010 target of adding net 110,000.
net additions of 13,000/month far exceeds normal versus industry growth of 5,100/month, i.e. HKBN grabbing customers from other broadband providers on mass.
1 Millionth Milestone Achieved in Dec 2009
34
Fixed Telecom Network Services Subscriptions
31 Aug 08 31 Aug 09 31 Dec 09 Broadband 316,000 391,000 443,000
Voice 329,000 382,000 403,000 TV 156,000 170,000 158,000
Total 801,000 943,000 1,004,000

In Dec 2010, filed an application for Free TV license (FTV):
FTV is a incremental HK$210 million (capex and opex) investment to existing IP-TV operations, which has been running for 6 years.
Existing advertising revenues of FTV market estimated at HK$3.7 billion with 75% dominance by TVB.
As our FTV will be delivered by Fibre rather than traditional over the air, this expansion helps to monetize our Fibre investment
Free TV Application
35

Stock Valuation Metrics
1137.HK and CTEL 12 months Stock Price Chart
36
Units SEHK Shares NASDAQ ADR
Stock code 1137.HK CTEL
Currency HK$ US$
Price, 8 Jan 2010 4.40 11.65
ADR Premium / (Discount) NA 2.60%
Average daily stock turnover
(3 months) 000 2,138 63
Number of issued shares millions 680 34
Market Cap millions 2,991 396
Less: Net Debt \ (Net Cash) millions 58 7
Enterprise Value millions 3,049 403
FY2009 DPS 0.19 0.49
Dividend Yield 4.3% 4.2%
FY2009 EBITDA millions 508 66
EV/EBITDA x 6.0 6.2
FY2009 Profit after Tax millions 213 27
Price to Earnings (P/E) x 14.1 14.4

::: END :::
Investor Engagement ContactMr. NiQ Lai
CFO and Head of Talent Engagement Telephone: +852 3145 6068
Email: [email protected]
37