Embed Size (px)
Citation preview
From Biomedical Engineering Principles is Sports, G. Hung and J. Pallis
(Eds)), Kluwer Academic, 2004, pp. 257-287.
257
10
The Rising Fastball and Other Perceptual Illusions of
Batters
Terry Bahill1 and David G. Baldwin
2
1Systems and Industrial Engineering, University of Arizona, Tucson, AZ 85721- 0020; PH: (520)
621-6561; FX: (520) 621-6555; EM: [email protected]
2P.O. Box 190, Yachats, OR 97498, EM: [email protected]
10.1 INTRODUCTION
Sometimes athletes develop effective strategies although their underlying
assumptions are fallacious. Baseball provides an example in which
misunderstood physical and psychological phenomena are the basis of
strategies of both the pitcher and the batter.
With limited knowledge of the physics of a pitch’s trajectory, baseball
players argue that a high, hard fastball will sometimes accelerate and rise
suddenly as it approaches the plate. Batters claim the ball can jump a foot or
more just before the pitch reaches the strike zone. The batter is unable to
adjust to this apparent rapid change in trajectory, as the ball seems to hop
over the bat.
This perceived rise occurs on fastballs that have exceptional speed, are
belt high or higher, and, most often, are on the inside half of the strike zone.
Batters say that the pitcher “pumped it up,” or “put a little extra on that one.”
In describing Dwight Gooden, Tony Gwynn states, “He rears back and
throws you that high-rising fastball whenever he needs a big pitch” (Gwynn
and Rosenthal, 1992). The rising fastball is often referred to as “smoke,”
“cheese,” or “express.”

258 Terry Bahill and David Baldwin.
Pitchers have devised various means for producing and enhancing the
rise effect. The pitch is thrown with an overhand or three-quarter delivery so
that a rapid backspin is imparted to the ball (Seaver and Lowenfish, 1984).
The ball is usually gripped with the index and middle fingers extending
across four seams (House, 1994). Each seam is a ridge that provides high
impedance to the airflow around the ball when the seam is perpendicular to
the direction of flight. Backspin with four seams perpendicular to the
trajectory is thought to give the ball maximum “lift.” In general, pitchers
believe that this lift accounts for the rise experienced by batters (e.g., see
Seaver and Lowenfish, 1984, p. 99 and Flatow, 1988, p. 93). For a literature
review of the rising fastball, see McBeath (1990).
A phenomenon that batters experience far more often than the rising
fastball, however, is a pitch that appears to break sharply downward as it
nears the plate. Several kinds of pitches behave in this way – the overhand or
three-quarter curveball, the sinking fastball (thrown three-quarter or sidearm,
with strong pressure applied by the index finger), the split-finger fastball or
forkball (thrown directly overhand), and several kinds of change ups. We
will refer to these pitches collectively as “breaking pitches.” A breaking
pitch will be defined as any pitch that seems to exhibit an abrupt drop near
the plate.
Batters describe these pitches with phrases such as, “the bottom dropped
out of it” or “it fell off the table.” Gwynn uses the metaphor, “a dead fish.”
He writes that hitting a sinker is “like hitting a rock – it won’t go anywhere”
(Gwynn and Rosenthal, 1992).
Breaking pitches should be thrown very low in the strike zone or even a
little below the knees. If the batter makes contact with such a pitch, he is
most likely to hit the ball on the ground. The objective of an experienced
pitcher is to “take the sting out of the ball,” and forcing the batter to hit a
groundball is the surest way to do that (Curt Simmons, personal
communication).
Nearly all major league pitchers have at least one breaking pitch in their
repertoire. Pitching coaches consider a breaking pitch to be an essential
ingredient for an effective strategy. Unlike the rising fastball, some kind of
breaking pitch can be learned by any pitcher.
Thus, pitchers rely on sudden, rapid vertical movement of their pitches
and batters perceive that movement and must contend with it to be
successful. . Even great batters (e.g., Aaron and Cohen, 1974) and great
pitchers (e.g., Palmer and Cohen, 1975) are convinced that a high fastball
can rise and a breaking pitch can drop sharply. But is it just an illusion?

Chap. 10. The Rising Fast Ball & Other Perceptual Illusions of Batters 259
10.2 THE RISING FASTBALL
According to principles of physics, a rising fastball is impossible. Yet,
most batters claim it exists and can describe their frustration in attempting to
hit this pitch. This widespread belief has persisted in spite of the recognition
by a few coaches that such a pitch cannot occur (House, 1994; Thrift and
Shapiro, 1990; Mike Scioscia quoted by Will, 1990, p. 91). Our simulation
and model explain this contradiction. Although the numbers given in this
paper are for professional baseball players, the simulation and model apply
to all players, right down to Little Leaguers. They can also be extended to
cricket (Regan, 1992). This section on the rising fastball is based on
Karnavas, Bahill and Regan (1990) and Bahill and Karnavas (1993).
The rising fastball could be defined variously as a pitch where the ball (1)
jumps up, right in front of the plate, (2) crosses the plate above the pitcher's
release point, (3) is going upward when it crosses the plate, or (4) falls less
than would be expected due to gravity. By definitions (2) and (3), a rising
fastball could be thrown by a sidearm baseball pitcher or a softball pitcher,
but not with an overhand or three-quarter pitching delivery. For example, an
overhand pitch is released about six feet above the ground; if the ball crossed
the plate higher than this it would not be a strike. And in order for the ball to
be going upward when it crosses the plate, it would have to fall initially, and
then near the end of its flight, experience an upward force that is greater than
that of gravity. A force that opposes gravity is produced by the backspin on
an overhand fastball. However, the maximum spin rate ever measured for a
human pitch, 2300 revolutions per minute (rpm), would only create a force
two-thirds that of gravity (Watts and Bahill, 2000). So, although a fastball's
lift due to backspin may not overcome gravity, it does make it fall less than
would be expected due to gravity, which is definition (4). All fastballs fit
this definition, making it trivially simple and uninteresting. Therefore, for
the rising fastball we will only consider overhand pitches that conform to
definition (1).
10.2.1 The Simulation of the Rising Fastball
Figure 10.1a and Table 10.1 show our simulations of 95 and 90 mile per
hour (mph) fastballs. Our simulations include the effects of gravity and the
aerodynamic forces of lift and drag. In these simulations, both pitches were
launched one degree upward with 1500 rpm of backspin. As shown in Fig.
10.1d, the distance between the front of the pitcher's rubber and the tip of the
plate is 60.5 feet. But the pitcher releases the ball about 5 feet in front of the
rubber. Therefore, for these simulations, the pitcher's release point was 55.5
feet away from the tip of the plate. The bat hits the ball about 1.5

260 Terry Bahill and David Baldwin.
Figure 10.1 (a) Computer simulation of the trajectory of a 95-mph fastball (solid line and
circles) and a 90-mph fastball (dashed line and triangles). The slower pitch takes longer to get
to the plate and therefore drops more. (b) Computer simulation of the trajectory of a 95-mph
fastball (solid line and circles), and the batter's mental model of this trajectory (dashed line and
triangles) when the batter underestimated the speed of the pitch by 5 mph. (c) The same
simulation as Fig. 10.1b, except that when the ball was 20 feet in front of the plate, the "batter"
realized his mental model was wrong and corrected it, thus putting his mental model triangles
on the 95 mph trajectory. (d) Physical dimensions for adult baseball. Adapted from Karnavas
et al. (1990), pg. 924, with permission of © IEEE.

Chap. 10. The Rising Fast Ball & Other Perceptual Illusions of Batters 261
feet in front of the batter's head, which was assumed to be aligned with the
front of the plate. The plate measures 17 inches from the back tip to the front
edge. So, in these simulations the point of bat-ball collision was 3 feet in
front of the tip of the plate, which is represented in the bottom rows of Table
10.1. The pitcher's release point was assumed six feet high. Later, in Table
10.3, we will show how sensitive our conclusions are to these numbers.
10.2.2 The Perceptual Model
The illusion of the rising fastball could be the result of the batter
underestimating the speed of the pitch. For example, suppose the pitcher
threw a 95-mph fastball, but the batter underestimated its speed and thought
it was only going 90 mph. The batter would expect to hit the ball 3.33 feet
above the ground (from the sixth column, 426-msec row of Table 10.1). But
if the batter were to take his eye off the ball (indicated by the absence of
some circles in the actual 95 mph pitch of Fig. 10.1b) and look at his bat in
order to see the expected bat-ball collision, then the next time the batter saw
the ball it would be 3.56 feet above the ground (third column, 404 msec row
of Table 10.1), three inches above his bat. The batter might explain this by
saying, "The ball jumped three inches right in front of the plate." Should the
batter underestimate the speed at 80 mph, the batter would say the ball
jumped one foot. The manager in the dugout, the catcher and the center field
TV camera, having different perspectives, would not see this jump.
Table 10.1. Trajectories of Fastballs
95 mph fastball 90 mph fastball Time
Since
Release
(msec)
Distance
(ft)
Height
(ft)
Speed
(mph)
Distance
(ft)
Height
(ft)
Speed
(mph)
0 55.5 6.00 95.0 55.5 6.00 90.0
50 48.6 5.86 93.3 49.0 5.86 88.5
100 41.8 5.67 91.7 42.5 5.68 87.0
150 35.2 5.43 90.2 36.2 5.44 85.6
200 28.6 5.15 88.6 30.0 5.16 84.3
250 22.2 4.83 87.2 23.8 4.84 82.9
300 15.8 4.46 85.7 17.8 4.47 81.6
350 9.6 4.05 84.4 11.9 4.05 80.4
400 3.4 3.59 83.1 6.0 3.59 79.2
404 3.0 3.56 83.0
426 3.0 3.33 78.6

262 Terry Bahill and David Baldwin.
10.2.2.1 Four Types of Eye Movements
The purpose of the eye-movement systems is to keep the fovea, the
region of the retina with the greatest visual acuity, on the object of interest.
To accomplish this task, the following four types of eye movements work in
harmony: saccadic eye movements, which are used in reading text or
scanning a roomful of people; smooth-pursuit eye movements, used when
tracking a moving object; vergence eye movements, used when looking
between near and far objects; and vestibulo-ocular eye movements, used to
maintain fixation during head movements. These four types of eye
movements have four independent control systems, involving different areas
of the brain. Their dynamic properties, such as latency, speed and bandwidth
are different, and they are affected differently by fatigue, alcohol, drugs and
disease. For simplicity, none of the other neural systems associated with
vision or eye movement will be discussed in this paper.
The specific actions of these four systems can be illustrated by the
example of a duck hunter sitting in a rowboat on a lake. He scans the sky
using saccadic eye movements, jerking his eyes quickly from one fixation
point to the next. When he sees a duck, he tracks it using smooth-pursuit eye
movements. If the duck lands in the water right next to his boat, he moves
his eyes toward each other with vergence eye movements. Throughout all
this, he uses vestibulo-ocular eye movements to compensate for the
movement of his head caused by the rocking of the boat. Thus, all four
systems are continually used to move the eyes.
10.2.2.2 Eye Tracking Strategies
Batters use one of two strategies in tracking the pitch (Bahill and LaRitz,
1984). The optimal learning strategy, which allows the batter to see the ball
hit the bat, is: track the ball over, roughly, the first two-thirds of its trajectory
with smooth pursuit eye movements, make a saccadic eye movement to a
predicted point of bat-ball collision, continue to follow the ball with
peripheral vision letting the ball catch up to the eye, and finally, at the end of
the ball's flight, resume smooth pursuit tracking with the images of the ball
and bat on the fovea. It is called the optimal learning strategy, because the
batter observes the ball, makes a prediction of where it will contact the bat,
sees the actual position of the ball when it contacts the bat, and uses this
feedback to learn to predict better the next time the pitcher throws that pitch.
The optimal hitting strategy, which does not allow the batter to see the ball
hit the bat, is: track the ball with smooth pursuit eye movements and fall
behind in the last five feet. It is called the optimal hitting strategy, because
Chap. 10. The Rising Fast Ball & Other Perceptual Illusions of Batters 263
the batter keeps his eye on the ball longer, which should allow him to make a
more accurate prediction of where the ball will cross the plate. We have no
evidence that batters voluntarily switch between these two strategies.
It is not surprising that batters do not verbalize their strategies. As you
are reading this paper, you typically make three saccades to the right and one
to the left for each line of type. But you are probably not capable of
explaining your scanning patterns to someone else. Likewise, the batter is
probably not capable of stating whether he is using the optimal learning
strategy or the optimal hitting strategy.
With the optimal learning strategy, a batter would perceive more rising
fastballs because his eyes would not be on the ball (which is why we
removed some circles from Fig. 10.1b) when the batter started his swing.
This occurs about 150 msec before bat-ball contact, when the ball is about
20 feet in front of the plate. Therefore, during the pitch the batter could not
discover inaccuracies in his estimation of pitch speed and make adjustments.
Whereas, with the optimal hitting strategy, a batter would perceive fewer
rising fastballs because his eye would be on the ball when it was 15 to 25
feet from the plate. Therefore, the batter could sense inaccuracies in his
speed estimation and, as shown in the last 150 msec of Fig. 10.1c, make an
appropriate correction, such as checking his swing.
The batter performs a different operation in each third of the pitch’s
flight: observe, compute and swing. For the rising fastball, as the batter
observes the ball for the first third of its flight, he underestimates the pitch-
speed and, therefore, miscomputes the height of the bat-ball collision. Then,
at the start of his swing, the batter takes his eye off the ball to look at the
estimated bat-ball collision point. When the ball comes back onto his fovea
it is higher than the batter thought it would be.
In the next section, we develop a neurophysiological model to investigate
the perceptual illusion of the rising fastball. This model of the human visual
processing is based on (Todd, 1981: Regan, 1986: Karnavas, Bahill and
Regan, 1990: Regan, 1992: Bahill and Karnavas, 1993) and uses only
experimentally verified primary visual processes.
10.2.3 The Neurophysiological Model
The batter must precisely predict the location of the ball in four-
dimensional space: t, the time coordinate and the x, y and z spatial
coordinates shown in Fig. 10.2. To hit the ball the batter must predict when
and where it will cross the plate. Bunting the ball is analogous to catching
the ball with a bat. In this act, the batter does not need to predict both when
and where; because when is not important. The batter has only one task:

264 Terry Bahill and David Baldwin.
predicting where the ball will be. And this task is much simpler; thus, most
bunt attempts make contact with the ball.
10.2.3.1 Predicting When
Let us see how the batter who is swinging at a pitch can judge when the
ball will be crossing the plate. In his novel The Black Cloud, Sir Fred Hoyle
(1957) showed that the time until contact with an object moving along the
line-of-sight can be approximated by the equation
Figure 10.2. Visual system parameters used by the batter: (top) angular size of the baseball, ,
the batter has no direct means to sense the distance to the ball (D); (middle) distance of the
ball's image off the batter's fovea, ; and (bottom) horizontal angle of the right and left eyes, R
and L. Adapted from Karnavas et al. (1990), pg. 925, with permission of © IEEE).

Chap. 10. The Rising Fast Ball & Other Perceptual Illusions of Batters 265
time until contact/d dt
(10.1)
where and /d dt are respectively the object's angular size and rate of
change of angular size. Lee (1976) subsequently gave the label tau ( ) to the
right side of the equation and suggested that estimations of time until contact
that are used to control motor actions are based on this variable. For
example, it has been shown that birds use when diving into the water to
catch prey, and athletes use when jumping to hit a dropped ball, adjusting
strides when running hurdles and timing their swings in table tennis; for
these tasks time until contact is judged with an accuracy around 2 to 10
msec. Cricket players time their swings with an accuracy of ±5 msec (Regan,
1992). Top sports players estimate the time until contact of the bat and ball
with an accuracy of better than three msec (Regan, 1997; Gray and Regan,
1998). The batter's calculation of time until contact has three sources of
error. First, Eq. 10.1 is only an approximation because it uses the
approximation Tan = . Second, the ball is not headed directly at the
batter's eye. In our simulations, these two sources produced errors of about
one msec at the start of the swing. The third source of error, which results
from the batter hitting the ball 1.5 feet in front of his eyes, produces a
constant 11 msec of error in underestimating the time of arrival at impact.
The human visual system can implement Eq. 10.1. First, there is
psychophysical evidence that the human brain contains units tuned to size
( ), and size-tuned neurons have been found in monkey visual cortex.
Second, psychological studies have shown that the visual system has
specialized "looming detectors" that compute /d dt independent of the
object's trajectory (Regan and Beverley, 1978, 1980). Furthermore, specific
brain neurons are sensitive to changing-size, /d dt (Regan and Cynader,
1979; Saito et al., 1986). Using these two pools of neurons, the brain could
compute .
Is the movement of the baseball within physiological thresholds? For
objects subtending less than 1.5 deg, /d dt as low as 0.02 deg/sec can be
detected (Regan and Beverley, 1978). Lee (1976) suggested a threshold of
0.08 deg/sec. When the pitcher releases a 95 mph fastball, is deg and
/d dt is 0.66 deg/sec. Therefore /d dt is well above visual threshold
from the moment the ball leaves the pitcher's hand. The value of remains
below 1.5 deg until the ball is ten feet from the tip of the plate. Figure 10.3
shows how and /d dt change during the flight of the ball. The arrows
indicate the points where they cross their thresholds.
In this section, we proposed a model for estimating time until contact.
We showed that the human brain has neuronal circuitry that could do the

266 Terry Bahill and David Baldwin.
needed computations. And we showed that the parameters of a pitch are
within physiological thresholds for these neuronal circuits. Next, we assert
that people can accurately estimate time until contact using Eq. 10.1 alone.
In experiments reported by Gray and Regan (1998), observers using only Eq.
10.1 were able to estimate time until contact with errors of 2 to 12%. As we
have stated before, the pitch can be divided into thirds. During the first third,
the batter gathers sensory information; during the middle third, a
computation is made of where and when the ball will make contact with the
bat; and the final third is the swing of the bat. With this scenario, the batter
would have to use information gathered in the first third of the pitch to
estimate time until contact. For a 95 mph fastball with a duration of 404
msec, this would be 268 msec before contact. A 2% estimation error
corresponds to a temporal error of 5 msec, which is within the required
temporal error of 9 msec computed by Watts and Bahill (2000). The 2%
error is at the low end of the 2 to 12 % range given by Gray and Regan. It
has been shown before (Bahill and LaRitz, 1984) that professional athletes
usually perform at the optimal end of the range of values found in laboratory
experiments. Using other estimators for time until contact might improve
accuracy, as discussed below.
Figure 10.3. Physiological clues to ball position, , /d dt and /d dt , as functions of
distance to the tip of the plate, for a 95 mph fastball. Adapted from Bahill and Karnavas
(1993) with permission of Journal of Experimental Psychology, Human Perception and
Performance.
Time until contact can be estimated using Eq. 10.1. It can also be
estimated using binocular disparity ( ) according to

Chap. 10. The Rising Fast Ball & Other Perceptual Illusions of Batters 267
time until contact/
I
Dd dt (10.2)
where I is the interpupillary separation and D is the distance to the ball (Gray
and Regan, 1998). When a 90 mph fastball is 40 feet from the plate,
/d dt is about 0.8 deg/sec, which is above discrimination threshold. Gray
& Regan (1998) found that estimates of time until contact for a simulated
approaching ball are more accurate when based on a combination of Eqs.
10.1 and 10.2 than for either cue alone suggesting that a hitter might
estimate time until contact of an approaching ball more accurately if both
these sources of information were used. It is not known whether or how they
are combined during baseball batting, however.
We conclude that from the instant the ball leaves the pitcher's hand, the
batter's retinal image contains accurate cues for time until contact, and that
the human visual system is capable of utilizing these cues. Evidentially most
batters estimate when the ball crosses the plate with an accuracy of ± 9
msec, otherwise the ball would be hit foul. Next, we want to consider the
more difficult issue of judging where the ball will be at the time of bat-ball
contact
10.2.3.2 Predicting Where
To hit the ball the batter must predict both when and where it will cross
the plate. Let us now see how the batter can judge where.
It is important to note that the batter has no direct visual access to the x, y
and z spatial coordinates: the batter’s judgments must be based entirely on
retinal image data. The relevant retinal parameters are the angular size of the
ball, , and the angular distance of the ball's image off the fovea, , shown
in Fig. 10.2, and their time derivatives /d dt and /d dt . We assume the
batter's eyes are in the x-y plane as shown in Fig. 10.2, although the
Pittsburgh Pirate studied by Bahill and LaRitz (1984) actually rotated his
head 23° in pitch and 12° in roll.
The batter can estimate the ball's height at contact from the ball's vertical
speed and the time until contact. The batter can estimate the ball's vertical
speed from the retinal velocity and the distance to the ball. The smallest
value of retinal velocity, /d dt , that can be detected is about 0.02 deg/sec.
Over a range of moderate speeds, between about 2 and 64 deg/sec, the
discrimination of differences in /d dt is within 5% (McKee, 1981; Orban
et al. 1984). Figure 10.3 shows that for a 95 mph pitch the value of /d dt
reaches 0.02 deg/sec before the ball has traveled one foot, reaches 2 deg/sec
49 feet from the tip of the plate, and reaches 64 deg/sec 18 feet from the tip

268 Terry Bahill and David Baldwin.
of the plate. Therefore, the batter can make discriminations of /d dt that
diminishes only after the swing has begun. (The swing starts when the ball is
about 19 feet away from the bat-ball contact point.)
Now comes the crucial element in our explanation of the illusion of the
rising fastball. Although retinal image information provides an accurate cue
for the ball's time until contact, it provides poor cues to the absolute distance
to the ball (D in Fig. 10.2a) and for its line-of-sight speed. Classical
stereoscopic depth perception is of little help in this regard: although the
stereoscopic depth system provides a precise indication of relative depth (i.e.
the difference between the x-axis distances of two objects imaged near the
fovea), it provides little indication of absolute distance. In tracking the
pitched ball, the batter has one object, the ball, imaged on his fovea.
Therefore, the batter cannot measure the distance to the ball or the pitch
speed; the batter can only estimate them.
Our psychophysical explanation for the rising fastball is as follows. The
batter can estimate pitch speed and the time since the ball left the pitcher's
hand. The batter can use these data in conjunction with his experience to
estimate the distance to the ball ( D ). The "hat" on top of a symbol indicates
that it is an estimate. The batter can then use this estimate for distance and
the ball's retinal image velocity /d dt to estimate the vertical velocity
ˆ /dz dt . From the vertical velocity and the time until contact ( ) the batter
can estimate how far the ball will fall in the last part of its flight, and
therefore estimate the height of the ball when it crosses the front edge of the
plate. For example, suppose the pitcher enhances the batter's expectations
with a series of 90 mph pitches, and then throws an unusually fast 95 mph
pitch. Assume the batter uses a 90 mph mental model to interpret the retinal
image information about the 95 mph pitch. Suppose the batter tried to
estimate the ball's vertical speed 250 msec after the ball left the pitcher's
hand. If the actual pitch were a 95 mph fastball, it would be 20.7 feet from
his eye, subtracting 1.5 feet (the distance between the tip of the plate and the
batter's eye) from the x distance of 22.2 in Table 10.1. Its vertical velocity of
-8 ft/sec (from velocity = gt) would, at this distance, produce a retinal
velocity of -21 deg/sec. However, if the batter thought the pitch was a 90-
mph fastball, this would translate to 22.3 feet away at 250 msec after release.
At this distance, a retinal image velocity of -21 deg/sec would indicate that
the vertical velocity was about -8.6 ft/sec. So the batter would think the ball
was falling faster than it really was and would probably swing under the ball.
Therefore, if the batter made a saccadic eye movement to a predicted point
of bat-ball contact, this point would be below the ball when the ball caught
up with the eye, and the ball would seem to have jumped upwards, in this
example by three inches. To be sure, this error of visual judgment could be
avoided if the batter had an accurate visual cue to the ball's absolute distance

Chap. 10. The Rising Fast Ball & Other Perceptual Illusions of Batters 269
(D) or its speed, but, as we have seen, the batter is essentially "blind" to
these two important parameters. Blind means he as no direct optical sense
for these two parameters: he must estimate them using other retinal image
data.
This model can be summarized with Fig. 10.4 and Eq. 10.3,
fall 0 sinceReleaseˆ ˆ ˆˆ ( )
/
dz D t s
dt d dt= (10.3)
where fall
z is the estimate of how much further the ball will fall before
contact, 0
D is the estimated distance between the ball and the batter's eye at
the time of release, sinceRelease
t is the estimated time since release, s is the
estimated pitch speed, /d dt the retinal image velocity, is the retinal
image size, and /d dt is the rate of change of retinal image size. The
model of Fig. 10.4 shows how the batter’s brain can predict how much
further the ball will fall before its contact with the bat. Summation (
symbol in a circle), division (÷ sign in a pentagon) and multiplication ( sign
in a pentagon) can be accomplished by brain circuitry. Symbols with hats (^)
are estimates.
PrimaryVisual
Processes
SpeedEstimator
Timer
TimeSinceRelease
TimeUntilContactd /dt
d /dt
Other Sensory Inputs
Memory
EstimatedPitchSpeed
-Ball's
RetinalImage
Ball Spin
D^
zfall
^
D0
^
Figure 10.4. A model for a batter estimating the height of the ball at the time of its collision
with the bat. The input to the system is the ball's retinal image and its output is the estimate of
how much further the ball will fall before contact with the bat. Adapted from Bahill and
Karnavas (1993) with permission of Journal of Experimental Psychology, Human Perception
and Performance.
The first term of Eq. 10.3 is the estimated distance to the ball at the
moment of prediction, D , and the last term is from Eq. 10.1, so Eq. 10.3
can be rewritten as

270 Terry Bahill and David Baldwin.
fall
ˆˆd
z Ddt
= (10.4)
Overestimating any one of these three terms could produce the illusion of
the rising fastball. But, as we have already shown, batters can accurately
perceive /d dt and estimate ; the difficulty is in estimating the distance
to the ball. And in this model, they use estimated pitch speed to estimate the
distance to the ball. That makes the speed estimator in Fig. 10.4 the crucial
element of this model. In order to estimate the height of the ball at the time
of contact, the batter must be able to estimate the pitch speed. But pitch
speed cannot come from the primary visual processes. The speed estimator
receives inputs from the primary visual processes, such as ball spin. The
speed estimator probably uses memory and other sensory inputs such as the
motion of the pitcher’s arms and body, or a sign from a base runner on
second who has stolen the catcher's signals.
The speed estimator might be most accurate just after the pitcher releases
the ball, for at this point, the batter should be able to estimate its distance
0D quite well. And the distance
0D combined with the time until contact
would provide the speed. But at this time, the estimation of the ball's height
at the time-of-contact may still be in error, because retinal image velocity
dtd is inaccurate until the ball is 49 feet from the tip of the plate.
We considered many other signals that might be used to help estimate the
speed of the ball and its distance, but we discarded them because they were
inappropriate. For example, the retinal image could contain a cue to line-of-
sight speed /dD dt because / ( / )( / )dD dt D d dt= . And, as we have
already shown, the batter has visual clues for and /d dt , but
unfortunately the batter has no reliable visual cue to absolute distance D , so
the batter is unable to take advantage of the geometrical fact expressed in
this equation. We considered many techniques for estimating the distance to
the ball. (1) The vergence eye movement system (the difference between L
and R
in Fig. 10.2c) cannot help, because vergence changes do not
contribute to motion-in-depth sensation (Regan et al., 1986). (2) The
differences in the batter's lines-of-sight for the two pitches of Fig. 10.1 do
not differ by one degree until the ball is 6 feet from the batter, and extra-
retinal sensation of eye position is only good to about one degree (Matin and
Kibler, 1966; Steinbach, 1970). (3) Parallax is often used to help judge
distance. However, the batter only starts his translational head movements in
the last third of the ball's flight (Bahill and LaRitz, 1984; Watts and Bahill,
2000) and this is too late to help him. (4) We have already commented that
stereoscopic depth perception only gives clues about the relative depth of

Chap. 10. The Rising Fast Ball & Other Perceptual Illusions of Batters 271
two objects and not about absolute distance to a single object, so it cannot
help and is, in fact, not necessary for good hitting. Indeed, according to Kara
(1990), an ophthalmologist who examined him, Babe Ruth was amblyopic
and never had more than 20/200 vision in his left eye. Therefore, we
conclude once again that the batter has no information to determine
accurately the ball's absolute distance (D) from his eye. We have said before that the batter must predict both when and where the
bat-ball collision will occur. To hit a line drive in fair territory, the batter
must estimate when to within ± 9 msec and where to within ± inch (Watts
and Bahill, 2000). Comparing these numbers to the 22-msec and 2.8 inch
differences between the 90 and 95-mph fastballs, we see that estimating
where requires greater percent accuracy. But batters seem to be more
accurate at estimating when. Indeed few line drives are hit into foul territory
(accurate position but poor timing), whereas many foul tips and pop ups are
hit into foul territory (poor accuracy and poor timing). Fig. 10.4 suggests an
explanation: when ( ) can be computed from primary visual processes,
whereas the pitch speed, and therefore where, can only be estimated. So
where is the crucial parameter: it requires greater precision, yet it cannot be
calculated from primary visual processes, it can only be estimated.
Although we developed this model to explain the illusion of the rising
fastball, it might also be applied to other pitches. For example, the change up
is only effective if it fools the batter and makes him overestimate the pitch
speed. According to our model, this would make the batter swing over the
ball. Our model predicts that effective change ups to right-handed batters
should result in ground balls to the left side of the infield.
The existence of the speed estimator in Fig. 10.4 enables predictions that
(1) large variations in speed from pitch to pitch should lead to large spatial
errors in the swing, (2) unexpectedly fast pitches (e.g., when a fast pitch
follows a sequence of slow pitches or a fast pitch is thrown on an unexpected
count) should cause the batter to swing under the ball, (3) unexpectedly slow
pitches (e.g. a change up) should cause the batter to swing over the ball and
(4) the sequence of recent events should influence performance. All of these
predictions from the model were supported by Gray (2002). They also are
manifest in the philosophies of great pitchers – Warren Spahn is quoted by
Will (1990) as saying, “Hitting is timing. Pitching is upsetting timing.”

272 Terry Bahill and David Baldwin.
10.3 EXPERIMENTAL ASSESSMENT OF THE MODEL
To help assess the performance of the model Bahill and Karnavas (1993)
ran experiments using a mechanical pitching machine. They threw 450
pitches to seven subjects: three adults and four boys aged 9, 11, 11 and 13.
Nominally, the speed of the machine was set for 50 mph, but occasionally it
threw a fast pitch at 55 mph. The number of normal pitches between these
fast pitches was randomly chosen from amongst 3, 4, 5, and 6. An observer
(who did not know the pattern of normal and fast pitches) recorded the
relationship of the bat and ball when the ball crossed the plate. They
averaged the results of the fast pitches and of the two pitches before and
after, as shown in Fig. 10.5. These data show that on the fast pitches the
batters swung below the ball, which is just what would happen if they
underestimated the speed of the pitch. It was statistically significant that
when the unusually fast pitch was thrown, the batters underestimated the
speed and swung under the ball. This is precisely the illusion of the rising
fastball.
Bat under ball
Fly ball
Line drive
Grounder
Bat over ball
Pitchesbefore
Fastpitch
Pitchesafter
Figure 10.5. Averaged data from seven batters showing that when an unusually fast pitch
was thrown most batters swung under the ball. The triangles are the mean values and the
vertical bars are the 95% confidence intervals.

Chap. 10. The Rising Fast Ball & Other Perceptual Illusions of Batters 273
10.4 THE BREAKING CURVEBALL
There is no longer a controversy about whether or not a curveball curves;
it does, because it obeys the laws of physics. These laws say that the spin of
the ball causes the curve (Watts and Bahill, 2000; Fig. 10.6). Should this
spin be horizontal (as on a toy top) the ball curves horizontally (of course it
also drops due to gravity). If it is top spin, the ball drops more than it would
due to gravity alone. Else, if it is somewhere in between, the ball both curves
and drops. In baseball, most curveballs curve horizontally and drop
vertically. The advantage of the drop is that the sweet area of the bat is about
four inches long but only an inch high. Thus, a vertical drop would be more
effective at taking the ball away from the bat's sweet area than a horizontal
curve. We now want to present the principles of physics that explain why the
curveball curves.
From the perspective ofa right-handed pitcher
Curveball
Drop Curve
BackupSlider
Fastball
Slider
The back
side of the
red dot
Flat Curve
Figure 10.6. The axis of rotation for several pitches.
274 Terry Bahill and David Baldwin.
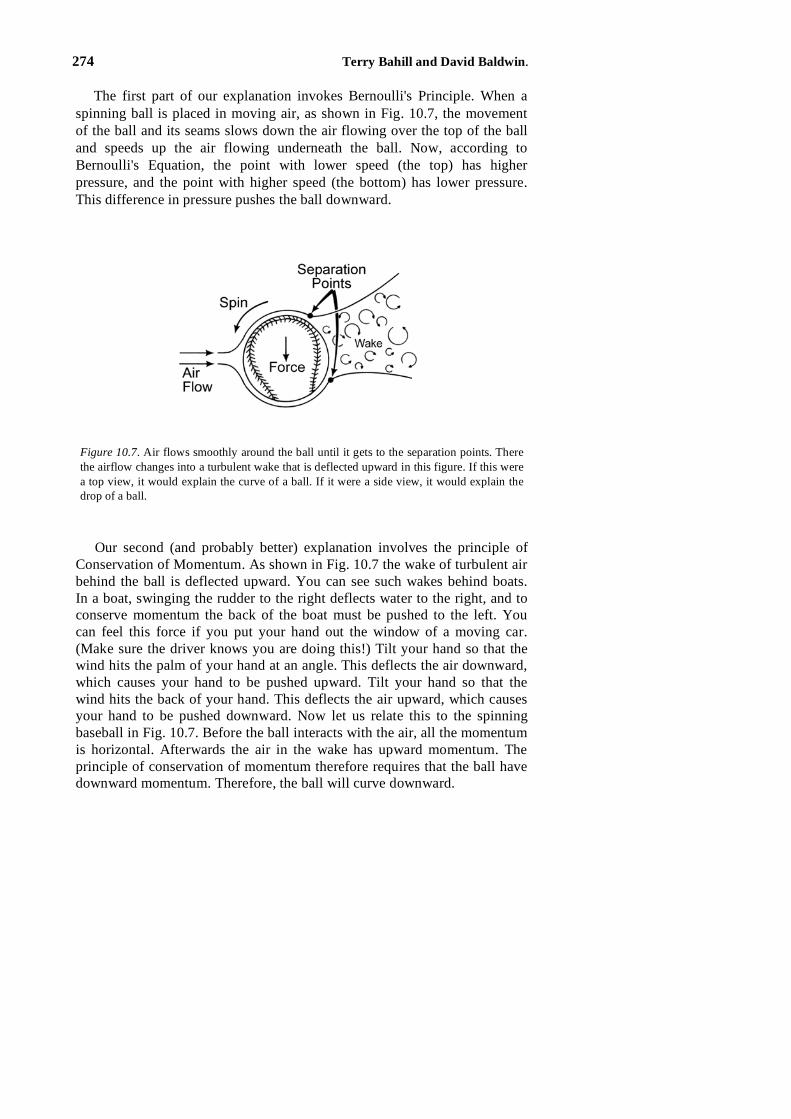
The first part of our explanation invokes Bernoulli's Principle. When a
spinning ball is placed in moving air, as shown in Fig. 10.7, the movement
of the ball and its seams slows down the air flowing over the top of the ball
and speeds up the air flowing underneath the ball. Now, according to
Bernoulli's Equation, the point with lower speed (the top) has higher
pressure, and the point with higher speed (the bottom) has lower pressure.
This difference in pressure pushes the ball downward.
Our second (and probably better) explanation involves the principle of
Conservation of Momentum. As shown in Fig. 10.7 the wake of turbulent air
behind the ball is deflected upward. You can see such wakes behind boats.
In a boat, swinging the rudder to the right deflects water to the right, and to
conserve momentum the back of the boat must be pushed to the left. You
can feel this force if you put your hand out the window of a moving car.
(Make sure the driver knows you are doing this!) Tilt your hand so that the
wind hits the palm of your hand at an angle. This deflects the air downward,
which causes your hand to be pushed upward. Tilt your hand so that the
wind hits the back of your hand. This deflects the air upward, which causes
your hand to be pushed downward. Now let us relate this to the spinning
baseball in Fig. 10.7. Before the ball interacts with the air, all the momentum
is horizontal. Afterwards the air in the wake has upward momentum. The
principle of conservation of momentum therefore requires that the ball have
downward momentum. Therefore, the ball will curve downward.
Figure 10.7. Air flows smoothly around the ball until it gets to the separation points. There
the airflow changes into a turbulent wake that is deflected upward in this figure. If this were
a top view, it would explain the curve of a ball. If it were a side view, it would explain the
drop of a ball.

Chap. 10. The Rising Fast Ball & Other Perceptual Illusions of Batters 275
There are several ways to shift the wake of turbulent air behind a
baseball. The wake is shifted by the spin on a curveball. The friction that
slows down the flow of air over the top of the ball causes the air to separate
from the ball sooner on the top than on the bottom, as shown in Fig. 10.7.
This shifts the wake upward, thus pushing the ball downward. For
nonspinning pitches, such as the knuckle ball and the scuff ball, when the
seams or the scuff are near the bottom separation point they create
turbulence, which delays the separation, as shown in the bottom of Fig. 10.7,
again shifting the wake upward, and pushing the ball downward.
So, when the pitcher puts spin on the ball, the wake of turbulent air
behind the ball is moved to one side, causing the ball to curve, thereby
confounding the poor batter who is trying to hit it.
Now let us return to the breaking curveball. Baseballs (except for
knuckleballs etc.) follow smooth parabolic trajectories. The 90-mph fastball
of Table 10.1 and Fig. 10.1 falls more than two and one-half feet in its flight
to the plate. A plot of this vertical distance as a function of time would be
parabolic. The ball falls 3.8 inches in the first 100 msec, 6.2 inches in the
second 100 msec, 8.3 inches in the third 100 msec, and 10.3 inches in the
fourth 100 msec. The ball drops more in each time period, but it follows a
smooth parabolic trajectory. Now let us see how the ball drops with the
addition of a vertical force due to top spin on the ball. Table 10.2 shows the
results of simulations of 80 and 75-mph drop curves. We are going to use the
term drop curve for a pitch with pure top spin. Both were launched at an
angle of 2.5 degrees up with 1900 revolutions per minute (rpm) of pure top
spin. We used the following formula from Watts and Bahill (2000) for the
downward force due to spin: 3
R vF=? , where is the air density,
R is the radius of the baseball, is its spin rate and v is its velocity.
Let us look at the 75-mph pitch. The ball falls 2.4 inches between 100
and 200 msec, 7.7 inches in the next 100 msec, 12.7 inches in the next 100
msec, and 17.5 inches in the next 100 msec. Once again, the ball drops more
in each time period, but it still follows a smooth parabolic trajectory.
Therefore, this is a gradual curve rather than a sharp break. This conclusion
is shared by Adair (p. 31, 1990) who stated, “Like its cousin, the curve ball,
the hopping fastball follows a smooth arc on its way to the plate, but half of
the hop deviation occurs in the last 15 feet of that flight.” A breaking pitch
would have to drop the same amount as this ball in the early 100-msec
epoch, but more than this in the last 100 msec. It would be impossible to hit
the ball if it really did jump or break just before reaching the plate. For
example, a foul tip changes the ball's trajectory abruptly in the last few feet
before the catcher and the umpire. As a result, these masked men cannot
predict the ball's trajectory and they must wear protective clothing.

276 Terry Bahill and David Baldwin.
We are now ready to explain the apparent abrupt break of some pitches.
Suppose the pitcher threw the 75-mph drop curve of Table 10.2, it would
drop 25 inches in the last 150 msec before contact. However, if the batter
overestimated the pitch speed and thought it was going 80 mph, then the
batter would expect it to fall 21 inches in the last 150 msec before contact.
Thus, if the batter took his eye off the ball 150 msec before the projected
time of contact, and saw it again when it arrived at his bat, he would think
that it broke downward 4 inches. Therefore, we suggest that the apparent,
abrupt-break of some pitches might be a result of the batter's overestimation
of the speed of the pitch in his mental model. This is the opposite of the
explanation for the rising fastball.
Of course, the illusion would be greatly enhanced if the batter made a
mistake in estimating both the speed and the type of the pitch. If the pitch
were a 95 mph fastball with 1600 rpm of backspin and the batter thought it
was a 75 mph drop curve with 1900 rpm of top spin, then the illusionary
jump would be one foot. Similarly, if such a drop curve were mistaken for
such a fastball, then the illusionary break would be one foot.
In summary, we think every pitch (except a nonspinning pitch such as the
knuckle ball) follows a smooth trajectory. The apparent, abrupt jumps and
sharp breaks right before the plate are perceptual illusions, caused by the
batter using the optimal learning strategy of tracking and making mistakes in
Table 10.2. Drop curve Trajectories
80 mph 75 mph
Time
Since
Release
(msec)
Distance
(ft)
Height
(ft)
Distance
(ft)
Height
(ft)
0 55.5 6.00 55.5 6.00
50 49.7 6.20 50.0 6.18
100 44.0 6.28 44.7 6.25
150 38.3 6.24 39.4 6.20
200 32.7 6.09 34.1 6.05
250 27.2 5.83 29.0 5.78
300 21.9 5.47 23.9 5.41
350 16.5 4.99 18.8 4.93
400 11.3 4.41 13.9 4.35
450 6.11 3.73 9.0 3.67
480 3.0 3.27
500 4.2 2.89
513 3.0 2.68

Chap. 10. The Rising Fast Ball & Other Perceptual Illusions of Batters 277
his mental model of the pitch. We think that in the first third of the ball's
flight, batters gather data and form mental models of the pitch. In the middle
third, batters compute when and where the ball will cross the plate. Then
they start their swings. In the last third of the ball's flight, the batters either
observe errors in their mental models so that they can track the next pitch
better (the optimal learning strategy), or they update their mental models and
perhaps check their swings (the optimal hitting strategy).
10.5 THE EFFECTS OF SPIN AND SPEED
Batters say that the ball hops, drops, curves, breaks, rises or tails away.
They say that the pitcher throws a fastball, curveball, drop curve, flat curve,
slider, backup slider, change up, split fingered fastball, splitter, forkball,
sinker, two seam fastball or four seam fastball. This sounds like a lot of
variation. However, no matter how the pitcher grips or delivers the ball, once
it is in the air (excepting the knuckleball), its motion depends only on its (1)
speed, (2) rate of rotation and (3) direction of the axis of rotation. As shown
in Fig. 10.6 and previously discussed, the curveball has top spin and side
spin, so from the perspective of a right-handed pitcher, it drops and curves
right to left. The fastball has predominately backspin, which gives it lift and
decreases the fall due to gravity. But if it were not thrown with an overhand
delivery, then it would also have some lateral deflection. The slider is
thrown like a football, which causes it to spin like a bullet. If its axis of
rotation is coincident with the direction of motion, then the spin causes no
deviation. Therefore, the slider is usually thrown so that the axis of rotation
is pointed up and to the left. This causes the ball to drop and curve right to
left. Rotation about this axis allows the batter to see a red dot on the top-
right-side of the ball. For the backup slider, the axis of rotation is coincident
with the direction of motion: the spin causes no horizontal curve and the
batter sees a red dot right in the middle of the ball. The drop and curve of all
these pitches is infinitely variable depending on the axis of rotation.
The black arrows in Fig. 10.6 indicate the vector moment of the spin.
You can determine the direction of the spin-induced deflection using the
right-hand rule. Point the thumb of your right hand in the direction of the
black arrow and point your index finger in the direction of motion of the
pitch. Bend your middle finger so that it is perpendicular to your index
finger. Your middle finger will be pointing in the direction of the spin-
induced deflection (of course the ball also drops due to gravity).
Besides spin, speed also characterizes the movement of the ball. The
purpose of changing pitch speeds is not to fool the when computer, but rather
to fool the speed estimator and consequently the where computer.

278 Terry Bahill and David Baldwin.
A 90 mph fastball is in the air 426 msec, so it drops 2.8 feet due to
gravity ( at2) but the backspin lifts it 1 foot, producing a total drop of 1.8
feet. Whereas a 75 mph drop curve is in the air 511 msec, so it drops 4 feet
due to gravity and the top spin drops it an additional 1.6 feet, producing a
total drop of 5.6 feet. (These numbers are different from those in Tables 10.1
and 10.2 because here both of these pitches were launched horizontally, that
is with a launch angle of zero.)
So changing from backspin to top spin drops the ball 2.6 feet. Whereas
changing the speed from 90 mph to 75 mph drops the ball 1.2 feet. These are
very large distances compared with the vertical margin of error on the sweet
area of the bat.
For these simulations of Section 10.5, the pitch was launched horizontally
to avoid confounding effects of an upward launch. However, in order to
cross the plate in the strike zone almost all pitches much be launched with an
upward angle. Fastballs by Randy Johnson are possible exceptions. He is tall
enough and fast enough to pitch some fastballs with a downward launch
angle and still have them go through the strike zone. Such fastballs must
seem strange to a batter.
10.6 SENSITIVITY ANALYSES
To help validate our simulation and model we will now investigate how
well our conclusions hold up under parametric sensitivity analyses. First, we
will show the results of a sensitivity analysis of our simulation (Fig. 10.1 and
Tables 10.1 and 10.2), and then we will show the results of a sensitivity
analysis of our model of the human brain (Fig. 10.4).
Each of the eight simulation parameters was varied by ±5%. Then we ran
the simulation and calculated the percentage change for the perceived jump.
The ratio of these two percentages is the relative sensitivity (Karnavas,
Sanchez and Bahill, 1993). These sensitivity values are shown in the top of
Table 10.3.
To understand these numbers, it is helpful to note from our nominal
simulation results (Table 10.1) that the apparent jump of the rising fastball is
0.230 feet. When the horizontal position of the bat-ball collision point was
moved back 5%, the amount of perceived jump increased to 0.231 feet, or by
0.5%, which is -0.1 (the value of the sensitivity coefficient from Table 10.3)
times 5% (the perturbation size). Similarly, when the estimated pitch speed
was decreased 5%, the amount of perceived jump increased to 0.472 feet, or
by 105.4%, which is 21.1 times 5%. Therefore, the simulation is most
sensitive to pitch speed and the estimated pitch speed; in comparison, all
other parameters are insignificant.

Chap. 10. The Rising Fast Ball & Other Perceptual Illusions of Batters 279
It is rewarding to see that the pitch speed and the estimated pitch speed
are the most important parameters of the simulation. The sensitivity analysis
tells us that we should not (1) try to get more accurate values for the other
parameters of the simulation, (2) customize the simulation for individual
players, or (3) try to get more accurate values for the thresholds of the visual
parameters or /d dt , because these parameters are not that important.
The bottom line of this analysis is that our simulation is a good
representation for the pitched baseball.
Next, we did a sensitivity analysis of our neurophysiological model of
Fig. 10.4 for a 90 mph pitch. Each of the six model parameters was varied by
±5%, and we calculated the percentage change in how far the ball dropped
between 250 msec after release and the time of bat-ball contact. The ratio of
these two percentages is the relative sensitivity. These sensitivity values are
shown in the bottom of Table 10.3.
The model is most sensitive to the three parameters that are used to
estimate the distance to the ball. The batter cannot get these parameters from
the primary visual processes. It seems that the model is most sensitive to the
Table 10.3. Results of Sensitivity Analyses
Sensitivity Coefficients for the Simulation
Parameter Value
Horizontal position of the pitcher's release point -0.2
Vertical position of the pitcher's release point 0.0
Release angle 0.0
Horizontal position of the batter's eye 0.0
Vertical position of the batter's eye 0.0
Horizontal position of the bat-ball collision -0.1
Pitch speed 18.9
Estimated pitch speed -21.1
Sensitivity Coefficients for the Model
Parameter Value
0D
, estimated distance to release point -2.57
sinceReleaset
, estimated time since release 1.57
s , estimated pitch speed 1.57
/d dt , retinal image velocity -1.00
, retinal image size -1.00
/d dt, rate of change of retinal image size
0.95

280 Terry Bahill and David Baldwin.
things that are most difficult for the human to compute. Perhaps superior
athletes are superior not because they have superior primary visual
processes, but because of their subsequent processing of this information.
From these studies, we can see that estimating pitch speed is essential for
the batter to achieve what Charley Lau describes as “the sweet spot in time”
– that instant when the sweet area of the bat is in the right place to meet the
sweet spot of the ball (Lau and Glossbrenner, 1984). It seems that a useful
training technique would be to put a speech synthesizer on a radar gun
behind the plate in the batting cage and announce the speed immediately
after every pitch during batting practice. This might help the batter learn to
estimate pitch speed better.
10.7 THE TWO-SEAM AND FOUR-SEAM FASTBALLS
Tom Seaver (Seaver and Lowenfish, 1984) has written that the four-seam
grip is more effective in producing rising fastballs than the two-seam grip.
However, wind tunnel tests have shown no difference in lift between the
two-seam and the four-seam fastballs (Watts and Bahill, 2000, p. 75).
Perhaps the explanation for this apparent contradiction could be based on
psychology instead of physics.
As the frequency of a blinking light increases, it appears to flicker and
then at a certain frequency it appears to be continuously illuminated. This
transition point is called the Critical Flicker Fusion Frequency. For a person
in a baseball park this frequency is probably between 40 and 50 Hz.
Television screens present a new frame sixty times per second (60 Hz);
therefore, their pictures do not flicker, whereas the time indicator on your
VCR probably blinks once a second. This is clearly perceived as blinking.
If a fastball were rotating at 1200 rpm, it would rotate 20 times per
second. For a two-seam fastball, there would be two seams crossing the field
of view on each rotation (or, because the seams are close together, they
might appear as one blip). So, the frequency would be between 20 and 40
Hz, which is below the critical flicker fusion frequency and perhaps the ball
would appear to flicker. Therefore, the batter could detect the spin. He does
not have to compute the spin rate: he just has to determine if it is top spin (a
curveball) or backspin (a fastball). This would help his speed estimator of
Fig. 10.4. In contrast, for a four-seam fastball, the four seams would cross
the field of view symmetrically for each rotation. This would produce a
frequency of 80 Hz, which is above the critical flicker fusion frequency. The
ball would be seen as a blur and the batter would not be able to detect the
direction of spin. Therefore, the batter would have to guess if it were a

Chap. 10. The Rising Fast Ball & Other Perceptual Illusions of Batters 281
curveball or a fastball. If he guesses that it is a curveball, then he will think it
is slower than it is and might perceive a rising fastball.
Almost all pitchers who use an overhand or three-quarter delivery throw
four-seam fastballs and curveballs. The ball is gripped with the index and
middle fingers extending across four seams. They say that each seam is a
ridge that provides high impedance to the airflow around the ball when the
seam is perpendicular to the direction of flight. They say that backspin with
four seams perpendicular to the trajectory gives the ball maximum “lift.”
The four-seam pitch is probably harder to hit than a two-seam pitch. But the
reason may come from Psychology, not Physics. The four seam pitches
produce a flicker frequency that is too high for batters to discern the
movement of the seams.
Some great hitters have stated that they do not see the direction of spin on
the pitch. For example, Tony Gwynn (Gwynn and Rosenthal, 1992) has
stated, “I’m not like a lot of hitters who see the ball spin a certain way on a
particular pitch. I just see the ball.” Frank Robinson (as quoted in Schmidt
and Ellis, 1994) said, “I think the initial reaction [to the ball] coming out of
the hand is an advantage over waiting to see the seams of the ball.” And
Mike Schmidt (Schmidt and Ellis, 1992) wrote, “So many people say that
the hitter sees the spin of the ball, the seams. I don’t believe it. I couldn’t.”
Against pitchers using four-seam grips, batters are forced to determine the
kind of pitch from other cues (such as the pitcher’s release point and the
early trajectory of the ball) rather than the direction of spin (Baker, Mercer,
and Bittinger, 1993).
10.8 STRATEGIES
10.8.1 Strategies, Heuristics and Processes of the Batter
On each pitch, the batter is trying to accomplish some task. To do this he
uses one or more strategies, such as “Predict the Pitch,” “Protect the Plate,”
“Take the Pitch,” “Go for the Long Ball,” “Protect the Base Runner,” “Hit to
the Opposite Field” or “Make Contact.” These strategies provide the
objectives for the batter’s cognitive processes (anticipatory modeling of the
pitch, tracking the pitch, and consequent decision making) and
kinesiological processes (position and movement during the swing – what
coaches refer to as “batting mechanics” and “handling the bat”). The strategy
to be used depends on such factors as the, number of outs, runners on base,
score, count, coaches’ signals and the speed, location and outcome of the
previous pitch (Aaron and Cohen, 1974; Lau and Glossbrenner, 1984). The

282 Terry Bahill and David Baldwin.
batters mental model will be different if he foul tipped the previous pitch or
blasted it over the fence, but just foul.
For a given set of situational factors, the batter uses heuristics to help
select a specific implementation of a strategy (Schmidt and Ellis, 1994).
With zero or one strike, the batter would “Predict the Pitch,” whereas with
two strikes the batter would “Protect the Plate.” Within the “Predict the
Pitch” strategy, the batter uses heuristics to help with the prediction. For
example, with a count of 3 and 0 the batter would expect a fastball, whereas
with a 0 and 1 count the batter might look for a curveball (Williams and
Underwood, 1982). If the previous pitch were a ball, the batter is more likely
to expect a fastball, whereas if the previous pitch were a strike, he is more
likely to predict a breaking pitch, e.g., a curve or a changeup (Gray, 2003).
The basis of these heuristics is the assumption that, when a strike is needed,
most pitchers have the greatest confidence in the fastball.
The batter’s set of cognitive processes includes a speed estimation
process (shown in Fig. 10.4) that could be modeled with a Markov process
or a Kalman filter. The present pitch speed is estimated using a weighted
average of the last one or possibly two pitches (Bahill and Karnavas, 1993:
Gray, 2002). Pitchers believe that the batter’s memory span is 20 seconds.
The speed estimator probably also uses information gathered in the first third
of the pitch. It is not known how this process interacts with the above
strategies and heuristics to help the batter predict when and where the ball
will cross the plate.
10.8.2 Tactics of the Pitcher Versus Batter Confrontation
The battle of pitcher versus batter is the heart of baseball. In this contest,
each participant employs a time-tested tactic: the batter uses mental models
of the pitcher’s previous pitches in order to anticipate the kind and location
of the next pitch and the pitcher attempts to vary his pitches in order to fool
the batter.
The pitcher’s maneuvers are based on two assumptions. First, the
movement, speed and location of a pitch will influence the batter’s
predictive model for the following pitch. For example, a high, inside fastball
sets up the batter for a slow curveball, low and outside, because the batter
cannot help but remember and adjust, at least in some small way, to the
speed and location of the preceding fastball.
The second assumption of the pitcher is that, with respect to preventing
the batter from hitting the ball well, vertical movement of the pitch is more
effective than horizontal movement. The sweet region of the bat (the best
part of the barrel for hitting the ball) is perhaps four inches long or longer
(Seaver and Lowenfish, 1984; Williams and Underwood, 1982) but its depth

Chap. 10. The Rising Fast Ball & Other Perceptual Illusions of Batters 283
(along the transverse axis) is less than an inch. Consequently, the batter’s
margin of error is much smaller along the transverse axis compared with the
longitudinal axis.
When the bat is swung at pitches that are mid-thigh high or higher, the
longitudinal axis of the bat is almost horizontal as it passes through the strike
zone. On a pitch that is knee high and on the outside corner, the angle of the
bat with the horizontal plane is about ten to fifteen degrees, and this angle
increases to about thirty or forty degrees on pitches that are knee high on the
inside corner. For most pitches, then, vertical movement of the ball nearly
parallels the transverse axis of the bat and increases the likelihood that the
sweet region of the bat will pass over or under the center of the ball.
Given these assumptions, the pitcher’s tactic is to select a pitch that will
be different from the batter’s predictive model and to provide adequate
vertical movement of the ball to take advantage of the batter’s vulnerability.
The most important factor in pitch selection is the change of speeds. As a
manager, Ted Williams exhorted his pitchers to never let a batter see
consecutive pitches of the same speed. The great pitching coach, Johnny
Sain, expressed the same maxim. In following this advice, pitchers
exaggerate the speed differences between the overhand fastballs and the
breaking pitches, thereby increasing the perceived vertical movement of the
ball.
Some of baseball’s fastest pitchers, such as Nolan Ryan and Rich
Gossage, have used three speeds of their fastball to “go up the ladder”
against the batter. This technique consists of throwing three high fastballs to
a batter, each pitch faster and a little higher than the last. The batter
experiences a jump on each pitch because of the speed differential. By the
third pitch, the batter is swinging at an explosive fastball that is several
inches out of the strike zone. The pitchers vary the speeds in this series
because they recognize that this confutes the batter’s predictive models, but
few pitchers (if any) realize that this variation of speeds is inducing the
perceptual illusion of the rising fastball.
The reverse technique, “going down the ladder,” can be used on breaking
pitches. Camilo Pascual had a legendary overhand curve that appeared to
dive straight down just before it reached the plate. He would throw it at three
speeds, enticing the batter to swing at progressively lower pitches. On one
occasion, the batter actually broke his bat on home plate in trying to follow
Pascual’s curve.
We can describe other examples of slower speeds enhancing the illusion
of the break on curveballs and on sinkers. Pitchers are advised by coaches to
avoid throwing the curveball too hard (Ryan and House, 1991; Stanley and
Stanley, 1988). The rationale usually given for this is that the slower curve
has more time to “bite” the air - consequently, it will have a sharper break.

284 Terry Bahill and David Baldwin.
Relief pitchers who rely on sinkers are sometimes surprised that they are
at their best when they are tired from pitching on several consecutive days.
They lose some speed on their pitches and the sinker dips much more than it
does when they are rested and strong (Thorn, 1979). Dusty Baker calls the
sinker the toughest pitch to hit and has recommended that the batter study
box scores in newspapers to determine a sinkerball pitcher’s fatigue level
(Baker, et al., 1993).
The batter’s antidote for the rising fastball and breaking pitches is to
predict the next pitch and rehearse it with a mental simulation. This allows
the batter to adjust expectations of the speed of the pitch. The batter can take
measures to minimize the effects of the break or rise. If a breaking pitch is
expected, the batter moves forward in the batter’s box to “catch the ball
before it breaks.” Sievers (1958) and Gwynn and Rosenthal (1992) stress
that the batter must concentrate on waiting as long as possible before
committing the swing. If a high fastball is expected, the batter moves to the
back of the box and prepares to swing at the upper half of the ball. With the
count at less than two strikes, the batter has the luxury of taking the pitch if
his prediction is wrong. With two strikes, the batter protects the strike zone
by choking up on the bat and concentrating on hitting the ball up the middle
(Baker, et al., 1993).
Both pitchers and batters assume that the methods of grip and delivery a
pitcher uses can make the pitches change course abruptly. Pitchers know that
the speed of the pitch is important to its success, but they are unaware that
success is dependent upon an illusion experienced by the batter. And the
batters, too, do not realize that they are being fooled by their own
expectations.
10.9 SUMMARY
One by one, scientists and engineers, using principles of physics, have
explained most of baseball's peculiar pitches: e.g., the knuckle ball (Watts
and Sawyer, 1975: Hollenberg, 1986), the scuff ball (Watts and Bahill,
2000) and the curveball (Watts and Bahill, 2000). The most mysterious
remaining pitches were the rising fastball and the breaking pitches. Now,
adding principles of physiological psychology, we can suggest that the rising
fastball and the breaking pitches may be perceptual illusions, caused by the
batter misestimating the speed of the pitch. Pitchers take advantage of these
illusions when devising tactics and techniques but are generally unaware of
the cause of these phenomena. However, Christy Mathewson (quoted by

Chap. 10. The Rising Fast Ball & Other Perceptual Illusions of Batters 285
Kahn, 2000) once said, “Fooling the other fellow was just as valuable as
throwing hard – and a darn sight easier on the arm.”
10.10 REFERENCES
Aaron, H. and Cohen, J., 1974, Hitting the Aaron Way, Englewood Cliffs, NJ: Prentice-Hall, Inc.
Adair, R. K., The Physics of Baseball, Harper & Row, 1990.
Bahill, A. T. and Karnavas, W. J., 1993, The Perceptual Illusion of Baseball’s Rising Fastball
and Breaking Curveball, Journal of Experimental Psychology, Human Perception and
Performance, 19(1): 3-14.
Bahill, A. T. and LaRitz, T., 1984, Why can't batters keep their eyes on the ball, American
Scientist, 72: 249-253.
Baker, D., Mercer, J. and Bittinger, M.L., 1993, You Can Teach Hitting, Carmel, IN: Bittinger
Books, Inc.
Beverley, K. I. and Regan, D., 1975, The relation between discrimination and sensitivity in
the perception of motion in depth, Journal of Physiology, 249: 387-398.
Flatow, I., 1988, Rainbows, Curve Balls, and Other Wonders of the Natural World Explained,
New York: William Morrow and Co.
Frohlich, C., 1984, Aerodynamic drag crisis and its possible effect on the flight of baseballs.
American Journal of Physics, 52: 325-334.
Gray, R., 2002, Behavior of college baseball players in a virtual batting task, Journal of
experimental psychology: Human Performance and Perception. 28, No. 5, 1131–1148.
Gray, R., 2003, Markov at the bat: a model of cognitive processing in baseball batters,
Psychological Science, 13(6): 542-547, 2003.
Gray, R. and Regan, D., 1998, Accuracy of estimating time to collision using binocular and
monocular information, Vision Research, 38: 499-512.
Gwynn, T. and Rosenthal, J., 1992, Tony Gwynn’s Total Baseball Player, New York: St.
Martin’s Press.
Hollenberg, J. W., 1986, Secrets of the knuckleball, The Bent of Tau Beta Pi, 77(4): 26-30.
Hoyle, F., 1957, The Black Cloud, Middlesex England: Penguin Books.
House, T., 1994, The Pitching Edge, Champaign, IL: Human Kinetics.
Kahn, R., 2000, The Head Game: Baseball Seen from the Pitcher's Mound, New York:
Harcourt Brace Inc., p. 98.
Kara, G. B., 1990, Lost vision: Babe Ruth's legend, Argus, from the American Academy of
Ophthalmology, 13(7): 6.
Karnavas, W. J., Bahill, A. T. and Regan, D. M., 1990, A model for the rising fastball and
breaking curve ball, Proceedings of the 1990 IEEE International Conference on System,
Man, and Cybernetics, 925-928.
Karnavas, W. J., Sanchez, P. and Bahill A. T., 1993, Sensitivity Analysis of Continuous and
Discrete Systems in the Time and Frequency Domains, IEEE Transactions on System,
Man, and Cybernetics, SMC-23: 408-501.
Lau, C. and Glossbrenner, A., 1984, The Winning Hitter, New York: Hearst Books.
Lee, D. N., 1976, A theory of visual control of braking based on information about time-to-
collision, Perception, 5: 437-459.
Matin, L., and Kibler, G., 1966, Acuity of visual perception of direction in the dark for
various positions of the eye in the orbit, Perceptual and Motor Skills, 22: 407-420.
McBeath, M., 1990, The rising fastball: Baseball's impossible pitch, Perception, 90: 545-552.

286 Terry Bahill and David Baldwin.
McKee, S. P., 1981, A local mechanism for differential velocity discrimination, Vision
Research, 21: 491-500.
Orban, G. A., De Wolf, J., and Maes, H., 1984, Factors influencing velocity coding in the
human visual system, Vision Research, 24: 33-39.
Palmer, J. and Cohen, J. H., 1975, Pitching, New York: Atheneum.
Regan, D., 1997, Visual factors in hitting and catching, Journal of Sports Science, 15: 533-558.
Regan, D., 1986, The eye in ballgames: Hitting and catching. Sport en Zien, pp. 7-32.
Haarlem, De Vrieseborcht.
Regan, D., 1992, Visual judgments and misjudgments in cricket, and the art of flight,
Perception, 21: 91-115.
Regan, D. and Beverley, K. I., 1978, Looming detectors in the human visual pathway, Vision
Research, 18: 415-21.
Regan, D. and Beverley, K. I., 1980, Visual responses to changing size and to sideways
motion for different directions of motion in depth: Linearization of visual responses,
Journal of the Optical Society of America, 11: 1289-96.
Regan, D., Beverley, K. I. and Cynader, M., 1979, Stereoscopic subsystems for position in
depth and for motion in depth, Proceedings of the Royal Society of London (Series B),
204: 485-501.
Regan, D. and Cynader, M., 1979, Neurons in area 18 of cat visual cortex selectively sensitive
to changing size, Vision Research, 19: 699-711.
Regan, D., Erkelens, C. J. and Collewijn, H., 1986, Necessary conditions for perception of
motion in depth, Investigative Ophthalmology and Visual Science, 27: 584-597.
Ryan, N. and House, T., 1991, Nolan Ryan’s Pitcher’s Bible, New York: Simon and Schuster.
Saito, H., Yukie, M., Tanaka, K., Hikosaka, K., Fukada, Y. and Iwai, E., 1986, Integration of
direction signals of image motion in the superior temporal sulcus of the macaque monkey,
Journal of Neuroscience, 6: 145-157.
Seaver, T and Lowenfish, L., 1984, The Art of Pitching, New York: Hearst Books.
Sievers, R., 1958, Roy Sievers on the art of hitting, Sports Illustrated, 8(13): 35-47.
Schmidt, M. and Ellis, R., 1994, The Mike Schmidt Study: Hitting Theory, Skills and
Technique, Atlanta: McGriff and Bell Inc.
Stanley, F. and Stanley, L., 1988, The Complete Instructional Baseball Manual, Scottsdale,
AZ: The Stanley Co.
Steinbach, M. J., 1970, Aligning the eye to the actively or passively positioned hand,
Perception and Psychophysics, 8: 287-288.
Thorn, J., 1979, The Relief Pitcher: Baseball’s New Hero, New York: E.P. Dutton.
Thrift, S. and Shapiro, B., 1990, The Game According to Syd, New York: Simon and
Schuster.
Todd, J. T., 1981, Visual information about moving objects, Journal of Experimental
Psychology: Human Perception and Performance, 7: 795-810.
Watts, R. G., and Bahill, A. T., 2000, Keep Your Eye on The Ball: Curveballs, Knuckleballs
and Fallacies of Baseball, New York: W.H. Freeman and Co.
Watts, R. G., and Sawyer, E., 1975, Aerodynamics of a knuckleball, American Journal of
Physics, 43: 960-963.
Will, G. F., 1990, Men at Work, New York: Macmillan.
Williams, T. and Underwood, J., 1982, The Science of Hitting, New York: Simon and
Schuster.

Chap. 10. The Rising Fast Ball & Other Perceptual Illusions of Batters 287
10.11 BIOGRAPHICAL SKETCHES
Terry Bahill has been a Professor of Systems Engineering at the
University of Arizona in Tucson since 1984. He received his Ph.D. in
electrical engineering and computer science from the University of
California, Berkeley, in 1975. He holds U.S. patent number 5,118,102 for
the Bat Chooser, a system that computes the Ideal Bat Weight for individual
baseball and softball batters. He is a Fellow of the Institute of Electrical and
Electronics Engineers (IEEE) and of INCOSE. He is chair of the INCOSE
Fellows Selection Committee. His picture is in the Baseball Hall of Fame’s
exhibition “Baseball As America.”
Dave Baldwin, as a relief pitcher for the Washington Senators,
Milwaukee Brewers and Chicago White Sox during the 1960s and 1970s,
compiled a lifetime ERA of 3.08 with 6 wins, 11 loses and 22 saves in 176
games. Following a 16-year baseball career, he earned a Ph.D. in genetics
and an M.S. in systems engineering from the University of Arizona.
Currently, he is an information and decision analyst for the HylaPark, Inc. in
Carlsbad, CA. He is also a member of the Society for American Baseball
Research (SABR).