Embed Size (px)
Citation preview
10Referências bibliográficas
Adamson, A.W., 1982. Physical Chemistry of Surfaces. John Wiley & Sons, N.Y.; 4th edition.
Alaton, I.A., Kabdash, I., Hanbaba, D., Kuybu, E., 2007. Electrocoagulation of a
real reactive Dyebath effluent using aluminum and stainless steel electrodes.
Journal of hazardous Materials (2007).
Applegate, L.E., 1984. Membrane Separation Processes. Chem. Eng., 64.
Asselin, M., Drogui, P., Brar, S.K., Benmoussa, H., Blais, J.F., 2007. Organics
removal in oily bilgewater by electrocoagulation process. Journal of Hazardous
Materials.
Bagotsky, V.S., 2005. Fundamentals of Electrochemistry. Wiley-Interscience; 2nd
edition.
Bancroft, W.D., 1913. The Theory of Emulsification, V. J. Phys. Chem., 17, 501.
Bancroft, W.D., 1926. Applied Colloid Chemistry, 2nd edition. McGraw-Hill Book
Com., N.Y.
Bande, R.M., Prasad, B., Mishra, I.M., Wasewar, K.L., 2007. Oil field effluent
water treatment for safe disposal by electroflotation. Chemical Engineering
Journal (2007)
Becher, P., 1965. Emulsions: theory and practice. Reinhold Publishing
Corporation, N.Y.; 2nd edition.
Bensadok, K., Benammar, S., Lapicque, F., Nezzal, G., 2007. Electrocoagulation
of cutting oil emulsions using aluminum plate electrodes. Journal of Hazardous
Materials.
Bockris, J. O’M., Reddy, A.K.N., 2001. Modern Electrochemistry 2B: Electrodics
in Chemistry, Biology and Environmental Science. Springer; 2nd edition.
Cañizares, P., Martínez, F., Lobato, J., Rodrigo, M.N., 2007. Break-up of oil-in-
water emulsions by electrochemical techniques. Journal of Hazardous Materials
145 (2007) 233-240.
Cañizares, P., Martinez, F., Jimenez, C., Saez, C., Rodrigo, M.A., 2007.
Coagulation and Electrocoagulation of oil in water emulsions. Journal of
Hazardous materials 2007.
Carmona, M., Khemis, M., Leclerc, J-P., Lapicque, F.A., 2006. A simple model to
predict the removal of oil suspensions from water using the electrocoagulation
technique. Chemical Engineering Science 61 (2006) 1237-1246.
Chen, G., 2004. Electrochemical technologies in wastewater treatment. Separation
and Purification Technology 38, 11-41.
Chen, X., Chen, G., Yue, P.L., 2000. Separation of pollutants from restaurant
wastewater by electrocoagulation. Separation and Purification Technology 19, 65-
76.
Chen, X., Chen, G., Yue, P.L., 2002. Novel electrode system for electroflotation
of wastewater. Environmental Science & Technology 36, 778-783
Chen-Lu, Y., 2007. Electrochemical coagulation for oily water demulsification.
Separation and purification technology. 54 2007, 388-395.
Conama (Conselho Nacional do Meio Ambiente), 2005. Resolução número 357,
de 17 de março de 2005. Dispõe sobre a classificação dos corpos de água e
195
diretrizes ambientais para o seu enquadramento, bem como estabelece as
condições e padrões de lançamento de efluentes, e dá outras providências.
Daneshvar, N., Khataee, A.R., Amani Ghadim, A.R., Rasoulifard, M.H., 2007.
Decolorization of C.I. Acid Yellow 23 solution by electrocoagulation process:
Investigation of operational parameters and evaluation of specific electrical
energy consumption (SEEC). Journal of hazardous Materials 148. (2007) 566 –
572.
Dimoglo, A., Akbulut, M.Y., Ciham, F., Karpuzcu, M., 2004. Petrochemical
wastewater treatment by means of clean electrochemical technologies. Clean
Technology Environmental Policy 6(2004) 288-295.
Eckenfelder Jr, W. Wesley., 1999. Industrial Water Pollution Control. McGraw-
Hill Science/Engineering/Math; 3rd edition.
Emamjomeh, M.M., Sivakumar, M., 2006. An empirical model for defluoridation
by batch monopolar electrocoagulation/flotation (ECF) process. Journal of
Hazardous Materials B 131, 118-125.
Elmore, F.E., 1905. A process for separating certain constituents of subdivided
ores and like substances, and apparatus therefore, Br. Patent 13.578.
Ferreira, L.H., 2006. Remoção de sólidos em suspensão de efluente da indústria
de papel por eletroflotação. Dissertação de mestrado. Universidade Estadual de
Campinas. São Paulo, Dezembro 2006.
Fogler, H.S., 1991. Elements of Chemical Reaction Engineering, 2nd edition.
Prentice Hall International Series.
Ford, D.L., Elton, R.L., 1977. Removal of Oil and Grease From Industrial
Wastewaters. Chem. Eng., Deskbook Issue, 49.
196

Freestone, F.J., Tabakin, R.B., 1975. Review of U.S. Environmental Protection
Agency Research in Oil-Water Separation Technology. Conference on Prevention
and Control of Oil Polution, San Francisco, 437.
Gambhir, S.P., 1983. Resource Recovery-Oil From Sludge. 38th Purdue Industrial
Waste Conference, Lafayette, IN, 23.
Griffin, W.C., 1949. Classification of Surface-Active Agents by HLB. J. Soc.
Cosmet. Chem., 1, 311.
Holt, P.K., Barton, G.W., Mitchell, C.A., 2005. The future for electrocoagulation
as a localised water treatment technology. Chemosphere 59, 355-367.
Holt, P.K., Barton, G.W., Mitchell, C.A., 2004. Deciphering the science behind
electrocoagulation to remove suspended clay particles from water. Water Science
and Technology Vol 50 No 12 pp 177-184.
Holt, P.K., 2006. Electrocoagulation : Unravelling and synthesising the
mechanisms behind a water treatment process. PhD Thesis – University of Sydney
– Chemical Engineering.
Holt, P.K., Barton, G.W., Wark, M., Mitchell, C.A., 2002. A quantitative
comparison between chemical dosing and electrocoagulation. Colloids and
Surfaces A: Physiochemical and Engineering Aspects 211 (2-3), 233-248.
Horder, R.L., 1977. An Evaluation of Some Methods For Assessing The Stability
of Oil-In-Water Emulsions. PHD Thesis, Department of Pharmaceutics, The
School of Pharmacy, University of London, London.
Hosny, A.Y., 1995. Separating oil from oil-water emulsions by electroflotation
technique. Separations Technology 6, 9-17.
Ibanez, J.G., Takimoto, M.M., Vasquez, R.C., Basak, S., Myung, N., Rajeshwer,
K., 1995. Laboratory experiments on electrochemical remediation of the
197
environment: electrocoagulation of oily wastewater. J. Chem. Educ. 72 (11)
(1995) 1050-1058.
Ibrahim, M.Y., Mostafa, S.R., Fahmy, M.F.M., Hafez, A.I., 2001. Utilization of
electroflotation in remediation of oily wastewater. Separation Science and
Technology 36, 3749-3762.
Jafelicci Junior, M., Varanda, L.C., 1999. O mundo dos colóides. Química Nova
na Escola, no 9, 9-13, maio 1999.
Khemis, M., Leclerc, J-P., Tanguy, G., Valentin, G., Lapicque, F., 2006.
Treatment of industrial liquid wastes by electrocoagulation: Experimental
investigations and an overall interpretation model. Chemical Engineering Science
61, 3602-3609.
King, A., 1941. Some Factors Governing the Stability of Oil-in-Water Emulsions.
Trans. Faraday Soc., 37, 168.
Kobya, M., Hiz, H., Senturk, E., Aydiner, C., Demirbas, E., 2006. Treatment of
potato chips manufacturing wasterwater by electrocoagulation. Desalination 190
(2006) 201-211.
Kramer, G.R., Buyers, A., Brownlee, B., 1979. Electrolytic Treatment for Oily
Wastewater, 34th Purdue Industrial Waste Conference, Lafayette, IN, 673.
Kumar, P.R., Chandari, S., Khilar, K.C., Mahajan, S.P., 2004. Removal of arsenic
from water by electrocoagulation, 2004. Chemosphere 55, 1245-1252.
Letterman, R.D., Amirtharaj, A., O'Melia, C.R., 1999. Coagulation and
Flocculation. In Water Quality and Treatment, A Handbook of community water
supplies. McGraw-Hill, New York.
198

Magdich, P., 1988. The removal of oil from oil - water mixtures using selective
oil filtration. Dissertação de mestrado em engenharia civil – University of
Minnesota.
Mameri, N., Yeddou, A.R., Lounici, H., Belhocine, D., Grib, H., Bariou, B., 1998.
Water Research 32, 1604.
Mansour, L.B., Chalbi, S., 2006. Removal of oil from oil/water emulsions using
electroflotation process. Journal of Applied Electrochemistry (2006) 36 : 577 –
581.
Merma, A.G., 2008. Eletrocoagulação aplicada a meios aquosos contendo óleo.
Rio de Janeiro, 2008. 136p. Dissertação de Mestrado – Departamento de Ciências
dos Materiais e Metalurgia, Pontifícia Universidade Católica do Rio de Janeiro.
Modirshahla, N., Behnajady, M.A., Kooshaiian, S., 2007. Investigation of the
effect of the different electrode connections on the removal efficiency of
Tartrazine from aqueous solutions by electrocoagulation. Dyes and Pigments 74,
(2007) 249 – 257.
Mollah, M.Y.A., Morkovsky, P., Gomes, J.A.G., Kesmez, M., Parga, J., Cocke,
D.L., 2004. Journal of Hazardous Materials B114, 199-210.
Moreno-Casillas, H.A., Cocke, D.L., Gomes, J.A.G., Morkosvky, P., Parga, J.R.,
Peterson, E., 2007. Electrocoagulation mechanism for COD removal. Separation
and purification Technology 56 (2007) 204 – 211.
Mostefa, N.M., Tir, M., 2004. Coupling flocculation with electroflotation for
waste oil/waste emulsion treatment. Optimization of the operating conditions.
Desalination 161 (2004) 115 – 121.
Mouedhen, M., Feki, M., De Petris, W., Ayedi, H.F., 2007. Behavior of aluminum
electrodes in electrocoagulation process. Journal of Hazardous Materials.
199

Murugananthan, M., Bhaskar Raju, G., Prabhakar, S., 2004. Separation of
pollutants from tannery effluents by electro flotation. Separation and Purification
Technology 40, 69-75.
Oblinger, F.G., Weintraub, M.H., Gealer, R.L., Blais, E.J., 1984. In Plant
Operation of Electrolytic Cell for Oily Wastewater Treatment. Env. Prog., 3, (1),
1.
Pinto, S.D., 1978. Ultrafiltration for dewatering of waste emulsified oils.
Lubrification Challenges in Metalworking and Processing Proceedings, 1st
International Conference, IIT Research Institute, Chicago.
Pouet, M.F., Grasmick, A., 1995. Water Science Technology 31, 275.
Rajeshwar, K., Ibanez, J.G., 1997. Environmental Electrochemistry. Academic
Press; 1st edition.
Rao, S.R., 2003. Surface Chemistry of Froth Flotation, Volume 2. Springer, 1st
edition.
Reddy, S.R., Fogler, H.S., 1981. Emulsion Stability: Determination From
Turbidity. J. Coll. Int. Sci., 79, (1), 101.
Rosen, M.J., 1978. Surfactants and interfacial phenomena. John Wiley & Sons,
N.Y.
Rubio, J., Souza, M.L., Smith, R.W., 2001. Overview of flotation as a wastewater
treatment technique. Minerals Engineering 15, 139-155.
Ryan, J., 1986. Process selection for oil separation. Eff. Wat. Treat. Journal, 60.
Schoenhals, M., 2006. Avaliação da eficiência do processo de flotação aplicado
ao tratamento primário de efluentes de abatedouro avícola – Dissertação de
mestrado em engenharia química – Universidade Federal de Santa Catarina.
200

Sherman, P., 1953. Studies in Water-in-Oil Emulsions. III. The Properties of
Interfacial Films of Sorbitan Sesquioleate. J. Coll. Sci., 8, 35.
Sherman, P., 1968. Emulsion Science. Academic Press, London.
Strokach, P.P., 1975. Eletrochem. Ind. Process. Bio. 55, 375.
Stuart, F.E., 1946. Electronic water purification progress report on the electronic
coagulator – a new device which gives promise of unusually speedy and effective
results, water sewage 84, 24-26.
Tabakin, R.B., Tratter, R. and Chereminsinoff, P.N., 1978. Oil/water separation
technology : the options available, part one. Wat. Sew. Works, 74.
Tchobanoglous, G., Burton, F.L., Stensel, H.D., 2002. Wastewater Engineering
Treatment and Reuse. McGraw-Hill Science/Engineering/Math, 4th edition.
Wang, L.K., Yang, J.Y., Dahm, D.B, 1975. Separation of emulsified oil from
water. Chem. & Ind., 662.
Weber, W.J., 1972. Physicochemical Process for Water Quality Control. John
Wiley & Sons, N.Y.
Yang, C.L., 2007. Electrochemical coagulation for oily water demulsification.
Separation and Purification Technology, 54 (2007), 388-395.
Youssuf, A.M., Schennach, R., Parga, J.R., Cocke, D.L., 2001. Journal of
Hazardous Materials B84, 29-41.
Xu, X., Zhu, X., 2004. Treatment of refectory oily wastewater by electro-
coagulation process. Chemosphere 56, 889 – 894.
201

Zabel, T., 1992. Flotation in water treatment. In: Mavros, P., Matis, K.A. ( Eds. ),
Innovations in Flotation Technology. Kluwer Academic Publishers, Dordrecht,
M.A.
202

ApêndicesApêndice A – Resultados dos experimentos 1 a 6.
Tabela 1 – Medições de potencial zeta e de condutividade das emulsões.Experimento Potencial zeta inicial (mV) Potencial zeta final
(mV)Condutividade média x 1000
(μScm-1)2.1 -74,94 -78,57 6,012.2 -71,70 -76,40 6,132.3 -73,00 -9,70 6,052.4 -74,90 -72,60 5,772.5 -77,10 -78,03 5,753.1 -75,68 -34,88 5,873.2 -81,10 -34,68 6,003.3 -84,41 -66,74 5,983.4 -80,41 -43,65 5,984.1 -45,10 -41,45 5,634.2 -83,25 -72,35 6,404.3 -84,81 -52,90 6,294.6 -75,25 -63,49 6,924.7 -72,02 -72,87 6,485.1 -74,70 -43,13 6,595.2 -73,98 -41,17 6,355.4 -84,27 -69,95 6,796.1 -73,88 -34,52 2,31
Tabela 2 – Resultados dos experimentos 1.1 a 1.5.Experimento 1.1 Experimento 1.2 Experimento 1.3 Experimento 1.4 Experimento 1.5Corrente de 0,5 A Corrente de 1,0 A Corrente de 2,0 A Corrente de 4,0 A Corrente de 8,0 A
Tempo (min)
DQO (mgl-1) R% pH
DQO (mgl-1) R% pH
DQO (mgl-1) R% pH
DQO (mgl-1) R% pH
DQO (mgl-1) R% pH
0 2736,4 0,0 9,6 2676,5 0,0 9,7 2701,2 0,0 9,7 2651,9 0,0 9,1 2655,4 0,0 9,42 2651,9 3,1 9,7 2673,0 0,1 9,7 2694,1 0,3 9,8 2648,0 0,1 9,6 2609,6 1,7 9,95 2651,9 3,1 9,7 2666,0 0,4 9,8 2669,5 1,2 9,9 2644,8 0,3 9,7 2581,4 2,8 9,9
10 2634,2 3,7 9,9 2641,3 1,3 10,0 2644,8 2,1 10,0 2620,1 1,2 10,0 2560,2 3,6 10,015 2560,2 6,4 10,0 2627,2 1,8 10,2 2623,7 2,9 10,0 2584,9 2,5 10,0 1189,5 55,2 9,820 2553,2 6,7 10,1 2623,7 2,0 10,2 2613,1 3,3 9,9 2549,7 3,9 9,5 90,1 96,6 11,025 2535,6 7,3 10,2 2620,1 2,1 10,3 2560,2 5,2 10,1 2415,8 8,9 9,6 54,0 98,0 10,930 2514,4 8,1 10,2 2616,6 2,2 10,3 2518,0 6,8 10,2 113,9 95,7 9,6 39,9 98,5 10,040 2465,1 9,9 10,3 2577,9 3,7 10,3 2426,3 10,2 10,1 78,6 97,0 11,1 35,5 98,7 11,250 2458,1 10,2 10,5 2500,3 6,6 10,3 2292,4 15,1 10,0 56,6 97,9 10,9 34,6 98,7 11,160 2447,5 10,6 10,4 2472,1 7,6 10,3 283,9 89,5 10,8 44,3 98,3 11,0 28,4 98,9 9,970 2422,8 11,5 10,5 2451,0 8,4 10,2 131,5 95,1 11,0 43,4 98,4 10,6 24,9 99,1 10,080 2401,7 12,2 10,4 2429,9 9,2 10,2 79,5 97,1 10,9 36,4 98,6 10,3 22,3 99,2 10,390 2362,9 13,6 10,4 2370,0 11,5 9,9 58,4 97,8 11,0 31,1 98,8 10,7 20,5 99,2 10,6
203

Tabela 3 – Resultados dos experimentos 2.1 a 2.5.Experimento 2.1 Experimento 2.2 Experimento 2.3 Experimento 2.4 Experimento 2.5Corrente de 0,5 A Corrente de 1,0 A Corrente de 2,0 A Corrente de 4,0 A Corrente de 8,0 A
Tempo (min)
DQO (mgl-1) R% pH
DQO (mgl-1) R% pH
DQO (mgl-1) R% pH
DQO (mgl-1) R% pH
DQO (mgl-1) R% pH
0 6320,6 0,0 9,4 6646,4 0,0 9,4 7200,3 0,0 9,5 6177,2 0,0 9,6 6542,2 0,0 9,32 6190,3 2,1 9,6 6548,7 1,5 9,7 6666,0 7,4 10,0 6170,7 0,1 10,3 6242,4 4,6 10,55 6157,7 2,6 9,8 6281,5 5,5 10,1 6659,5 7,5 10,3 5590,7 9,5 10,7 6151,2 6,0 10,6
10 6151,2 2,7 10,0 6248,9 6,0 10,4 6568,2 8,8 10,6 5493,0 11,1 10,7 4932,6 24,6 10,115 6046,9 4,3 10,2 6183,7 7,0 10,6 6444,4 10,5 10,7 5232,3 15,3 10,8 2762,6 57,8 9,820 5994,8 5,2 10,4 6144,6 7,5 10,7 6418,3 10,9 10,7 5199,7 15,8 10,5 1948,0 70,2 9,425 5936,1 6,1 10,5 6125,1 7,8 10,8 6242,4 13,3 10,7 4691,5 24,1 9,9 371,0 94,3 9,730 5923,1 6,3 10,5 5805,8 12,6 10,9 6242,4 13,3 10,6 1368,0 77,9 9,7 70,4 98,9 9,940 5916,6 6,4 10,7 5167,2 22,3 10,9 5897,0 18,1 10,0 1055,2 82,9 9,7 58,2 99,1 10,050 5558,2 12,1 10,8 4887,0 26,5 10,8 3609,7 49,9 10,0 527,4 91,5 9,7 58,2 99,1 9,960 5219,3 17,4 10,8 4763,1 28,3 10,8 735,9 89,8 9,9 247,2 96,0 10,0 49,2 99,2 10,070 5180,2 18,0 10,9 4698,0 29,3 10,8 696,8 90,3 10,1 221,1 96,4 10,1 47,6 99,3 10,080 5102,0 19,3 10,9 4645,8 30,1 10,6 657,7 90,9 10,1 201,6 96,7 10,0 46,0 99,3 9,690 4958,6 21,5 10,9 4320,0 35,0 10,5 384,0 94,7 10,1 195,1 96,8 10,2 31,3 99,5 9,8
Tabela 4 – Resultados dos experimentos 3.1 a 3.5.Experimento 3.1 Experimento 3.2 Experimento 3.3 Experimento 3.4 Experimento 3.5
Distância de 5 mm Distância de 10 mm Distância de 15 mm Distância de 20 mm Distância de 40 mmTempo (min)
DQO (mgl-1) R% pH
DQO (mgl-1) R% pH
DQO (mgl-1) R% pH
DQO (mgl-1) R% pH
DQO (mgl-1) R% pH
0 7122,1 0,0 9,5 7128,6 0,0 8,8 7454,5 0,0 8,7 6724,6 0,0 9,5 7474,0 0,0 8,95 6933,1 2,7 10,3 7004,8 1,7 9,7 7265,5 2,5 9,6 6666,0 0,9 10,5 7461,0 0,2 9,8
10 6796,3 4,6 10,6 6985,3 2,0 10,2 7226,4 3,1 10,1 6600,8 1,8 10,9 7428,4 0,6 10,320 6587,8 7,5 10,8 6965,7 2,3 10,5 7154,7 4,0 10,4 6509,6 3,2 11,1 7421,9 0,7 10,630 6470,5 9,1 10,6 6828,9 4,2 10,4 7115,6 4,5 10,3 6457,4 4,0 10,8 7421,9 0,7 10,540 6372,7 10,5 10,3 6281,5 11,9 10,1 6261,9 16,0 9,6 6086,0 9,5 10,1 7415,4 0,8 10,250 4209,2 40,9 10,2 1283,3 82,0 9,9 3629,3 51,3 9,6 2938,5 56,3 9,1 4698,0 37,1 10,055 2521,5 64,6 10,3 142,9 98,0 9,4 465,5 93,8 9,7 2573,6 61,7 10,0 722,9 90,3 9,960 2123,9 70,2 10,1 138,0 98,1 9,7 423,1 94,3 9,7 1428,3 78,8 10,0 270,0 96,4 9,965 1348,5 81,1 10,1 71,2 99,0 9,9 377,5 94,9 9,3 1195,3 82,2 9,9 170,6 97,7 9,970 1289,8 81,9 10,0 59,8 99,2 9,9 229,3 96,9 9,4 1061,7 84,2 9,9 122,6 98,4 10,075 618,6 91,3 10,0 53,3 99,3 9,8 165,7 97,8 9,7 773,4 88,5 9,8 108,7 98,5 10,080 553,5 92,2 10,1 53,3 99,3 9,7 138,0 98,1 9,8 335,2 95,0 9,9 76,9 99,0 10,090 331,9 95,3 10,0 40,3 99,4 9,9 134,8 98,2 9,8 260,2 96,1 10,0 75,0 99,0 10,0
204
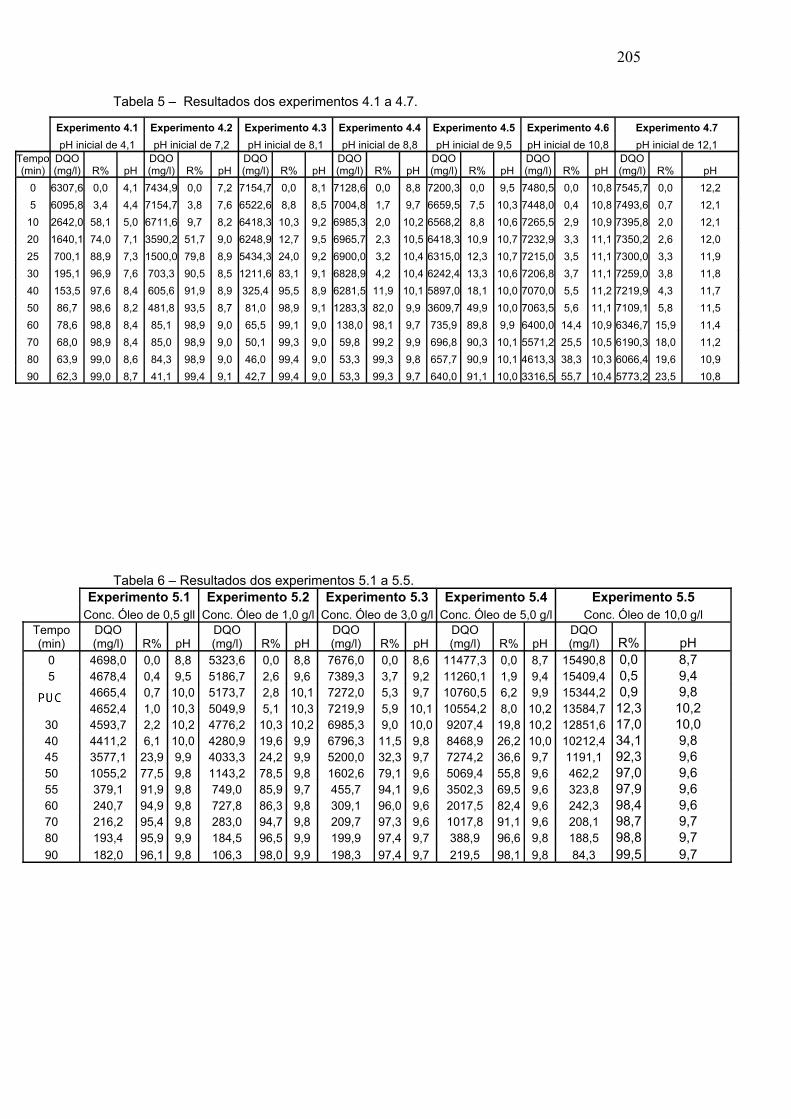
Tabela 5 – Resultados dos experimentos 4.1 a 4.7.
Experimento 4.1 Experimento 4.2 Experimento 4.3 Experimento 4.4 Experimento 4.5 Experimento 4.6 Experimento 4.7pH inicial de 4,1 pH inicial de 7,2 pH inicial de 8,1 pH inicial de 8,8 pH inicial de 9,5 pH inicial de 10,8 pH inicial de 12,1
Tempo (min)
DQO (mg/l) R% pH
DQO (mg/l) R% pH
DQO (mg/l) R% pH
DQO (mg/l) R% pH
DQO (mg/l) R% pH
DQO (mg/l) R% pH
DQO (mg/l) R% pH
0 6307,6 0,0 4,1 7434,9 0,0 7,2 7154,7 0,0 8,1 7128,6 0,0 8,8 7200,3 0,0 9,5 7480,5 0,0 10,8 7545,7 0,0 12,25 6095,8 3,4 4,4 7154,7 3,8 7,6 6522,6 8,8 8,5 7004,8 1,7 9,7 6659,5 7,5 10,3 7448,0 0,4 10,8 7493,6 0,7 12,1
10 2642,0 58,1 5,0 6711,6 9,7 8,2 6418,3 10,3 9,2 6985,3 2,0 10,2 6568,2 8,8 10,6 7265,5 2,9 10,9 7395,8 2,0 12,120 1640,1 74,0 7,1 3590,2 51,7 9,0 6248,9 12,7 9,5 6965,7 2,3 10,5 6418,3 10,9 10,7 7232,9 3,3 11,1 7350,2 2,6 12,025 700,1 88,9 7,3 1500,0 79,8 8,9 5434,3 24,0 9,2 6900,0 3,2 10,4 6315,0 12,3 10,7 7215,0 3,5 11,1 7300,0 3,3 11,930 195,1 96,9 7,6 703,3 90,5 8,5 1211,6 83,1 9,1 6828,9 4,2 10,4 6242,4 13,3 10,6 7206,8 3,7 11,1 7259,0 3,8 11,840 153,5 97,6 8,4 605,6 91,9 8,9 325,4 95,5 8,9 6281,5 11,9 10,1 5897,0 18,1 10,0 7070,0 5,5 11,2 7219,9 4,3 11,750 86,7 98,6 8,2 481,8 93,5 8,7 81,0 98,9 9,1 1283,3 82,0 9,9 3609,7 49,9 10,0 7063,5 5,6 11,1 7109,1 5,8 11,560 78,6 98,8 8,4 85,1 98,9 9,0 65,5 99,1 9,0 138,0 98,1 9,7 735,9 89,8 9,9 6400,0 14,4 10,9 6346,7 15,9 11,470 68,0 98,9 8,4 85,0 98,9 9,0 50,1 99,3 9,0 59,8 99,2 9,9 696,8 90,3 10,1 5571,2 25,5 10,5 6190,3 18,0 11,280 63,9 99,0 8,6 84,3 98,9 9,0 46,0 99,4 9,0 53,3 99,3 9,8 657,7 90,9 10,1 4613,3 38,3 10,3 6066,4 19,6 10,990 62,3 99,0 8,7 41,1 99,4 9,1 42,7 99,4 9,0 53,3 99,3 9,7 640,0 91,1 10,0 3316,5 55,7 10,4 5773,2 23,5 10,8
Tabela 6 – Resultados dos experimentos 5.1 a 5.5.Experimento 5.1 Experimento 5.2 Experimento 5.3 Experimento 5.4 Experimento 5.5
Conc. Óleo de 0,5 gll Conc. Óleo de 1,0 g/l Conc. Óleo de 3,0 g/l Conc. Óleo de 5,0 g/l Conc. Óleo de 10,0 g/lTempo (min)
DQO (mg/l) R% pH
DQO (mg/l) R% pH
DQO (mg/l) R% pH
DQO (mg/l) R% pH
DQO (mg/l) R% pH
0 4698,0 0,0 8,8 5323,6 0,0 8,8 7676,0 0,0 8,6 11477,3 0,0 8,7 15490,8 0,0 8,75 4678,4 0,4 9,5 5186,7 2,6 9,6 7389,3 3,7 9,2 11260,1 1,9 9,4 15409,4 0,5 9,4
10 4665,4 0,7 10,0 5173,7 2,8 10,1 7272,0 5,3 9,7 10760,5 6,2 9,9 15344,2 0,9 9,820 4652,4 1,0 10,3 5049,9 5,1 10,3 7219,9 5,9 10,1 10554,2 8,0 10,2 13584,7 12,3 10,230 4593,7 2,2 10,2 4776,2 10,3 10,2 6985,3 9,0 10,0 9207,4 19,8 10,2 12851,6 17,0 10,040 4411,2 6,1 10,0 4280,9 19,6 9,9 6796,3 11,5 9,8 8468,9 26,2 10,0 10212,4 34,1 9,845 3577,1 23,9 9,9 4033,3 24,2 9,9 5200,0 32,3 9,7 7274,2 36,6 9,7 1191,1 92,3 9,650 1055,2 77,5 9,8 1143,2 78,5 9,8 1602,6 79,1 9,6 5069,4 55,8 9,6 462,2 97,0 9,655 379,1 91,9 9,8 749,0 85,9 9,7 455,7 94,1 9,6 3502,3 69,5 9,6 323,8 97,9 9,660 240,7 94,9 9,8 727,8 86,3 9,8 309,1 96,0 9,6 2017,5 82,4 9,6 242,3 98,4 9,670 216,2 95,4 9,8 283,0 94,7 9,8 209,7 97,3 9,6 1017,8 91,1 9,6 208,1 98,7 9,780 193,4 95,9 9,9 184,5 96,5 9,9 199,9 97,4 9,7 388,9 96,6 9,8 188,5 98,8 9,790 182,0 96,1 9,8 106,3 98,0 9,9 198,3 97,4 9,7 219,5 98,1 9,8 84,3 99,5 9,7
205
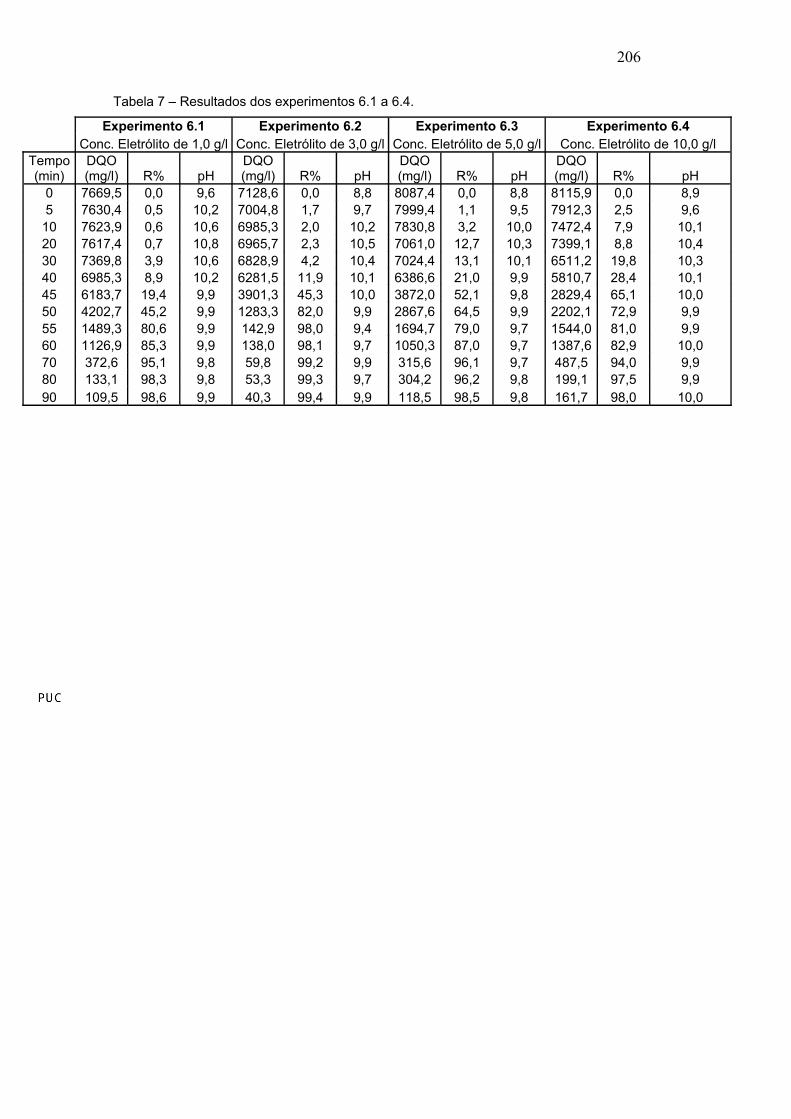
Tabela 7 – Resultados dos experimentos 6.1 a 6.4.
Experimento 6.1 Experimento 6.2 Experimento 6.3 Experimento 6.4Conc. Eletrólito de 1,0 g/l Conc. Eletrólito de 3,0 g/l Conc. Eletrólito de 5,0 g/l Conc. Eletrólito de 10,0 g/l
Tempo (min)
DQO (mg/l) R% pH
DQO (mg/l) R% pH
DQO (mg/l) R% pH
DQO (mg/l) R% pH
0 7669,5 0,0 9,6 7128,6 0,0 8,8 8087,4 0,0 8,8 8115,9 0,0 8,95 7630,4 0,5 10,2 7004,8 1,7 9,7 7999,4 1,1 9,5 7912,3 2,5 9,6
10 7623,9 0,6 10,6 6985,3 2,0 10,2 7830,8 3,2 10,0 7472,4 7,9 10,120 7617,4 0,7 10,8 6965,7 2,3 10,5 7061,0 12,7 10,3 7399,1 8,8 10,430 7369,8 3,9 10,6 6828,9 4,2 10,4 7024,4 13,1 10,1 6511,2 19,8 10,340 6985,3 8,9 10,2 6281,5 11,9 10,1 6386,6 21,0 9,9 5810,7 28,4 10,145 6183,7 19,4 9,9 3901,3 45,3 10,0 3872,0 52,1 9,8 2829,4 65,1 10,050 4202,7 45,2 9,9 1283,3 82,0 9,9 2867,6 64,5 9,9 2202,1 72,9 9,955 1489,3 80,6 9,9 142,9 98,0 9,4 1694,7 79,0 9,7 1544,0 81,0 9,960 1126,9 85,3 9,9 138,0 98,1 9,7 1050,3 87,0 9,7 1387,6 82,9 10,070 372,6 95,1 9,8 59,8 99,2 9,9 315,6 96,1 9,7 487,5 94,0 9,980 133,1 98,3 9,8 53,3 99,3 9,7 304,2 96,2 9,8 199,1 97,5 9,990 109,5 98,6 9,9 40,3 99,4 9,9 118,5 98,5 9,8 161,7 98,0 10,0
206

Tabela 8 – Coeficientes de correlação entre polinômio de sexta ordem e os dados empíricos de remoção.
Experimento R = ao + a1t + a2t2 + a3t3 + a4t4 + a5t5 + a6t6 2.1 R2=0,98982.2 R2=0,99622.3 R2=0,99062.4 R2=0,96172.5 R2=0,99543.1 R2=0,99093.2 R2=0,97163.3 R2=0,97953.4 R2=0,98663.5 R2=0,98004.1 R2=0,99824.2 R2=0,98134.3 R2=0,95154.4 R2=0,97164.5 R2=0,99064.6 R2=0,99834.7 R2=0,97785.1 R2=0,95595.2 R2=0,95275.3 R2=0,96145.4 R2=0,99495.5 R2=0,94516.1 R2=0,98186.2 R2=0,96956.3 R2=0,98726.4 R2=0,9776
207
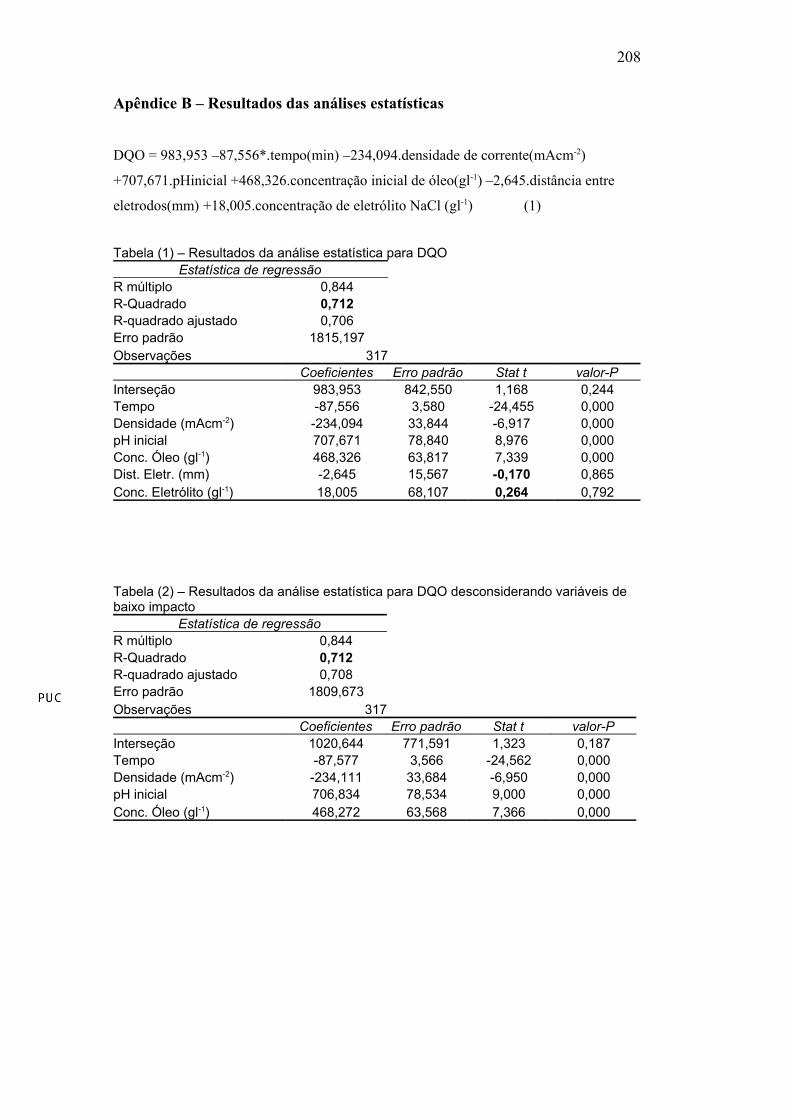
Apêndice B – Resultados das análises estatísticas
DQO = 983,953 –87,556*.tempo(min) –234,094.densidade de corrente(mAcm-2)
+707,671.pHinicial +468,326.concentração inicial de óleo(gl-1) –2,645.distância entre
eletrodos(mm) +18,005.concentração de eletrólito NaCl (gl-1) (1)
Tabela (1) – Resultados da análise estatística para DQOEstatística de regressão
R múltiplo 0,844R-Quadrado 0,712R-quadrado ajustado 0,706Erro padrão 1815,197Observações 317
Coeficientes Erro padrão Stat t valor-PInterseção 983,953 842,550 1,168 0,244Tempo -87,556 3,580 -24,455 0,000Densidade (mAcm-2) -234,094 33,844 -6,917 0,000pH inicial 707,671 78,840 8,976 0,000Conc. Óleo (gl-1) 468,326 63,817 7,339 0,000Dist. Eletr. (mm) -2,645 15,567 -0,170 0,865Conc. Eletrólito (gl-1) 18,005 68,107 0,264 0,792
Tabela (2) – Resultados da análise estatística para DQO desconsiderando variáveis de baixo impacto
Estatística de regressãoR múltiplo 0,844R-Quadrado 0,712R-quadrado ajustado 0,708Erro padrão 1809,673Observações 317
Coeficientes Erro padrão Stat t valor-PInterseção 1020,644 771,591 1,323 0,187Tempo -87,577 3,566 -24,562 0,000Densidade (mAcm-2) -234,111 33,684 -6,950 0,000pH inicial 706,834 78,534 9,000 0,000Conc. Óleo (gl-1) 468,272 63,568 7,366 0,000
208
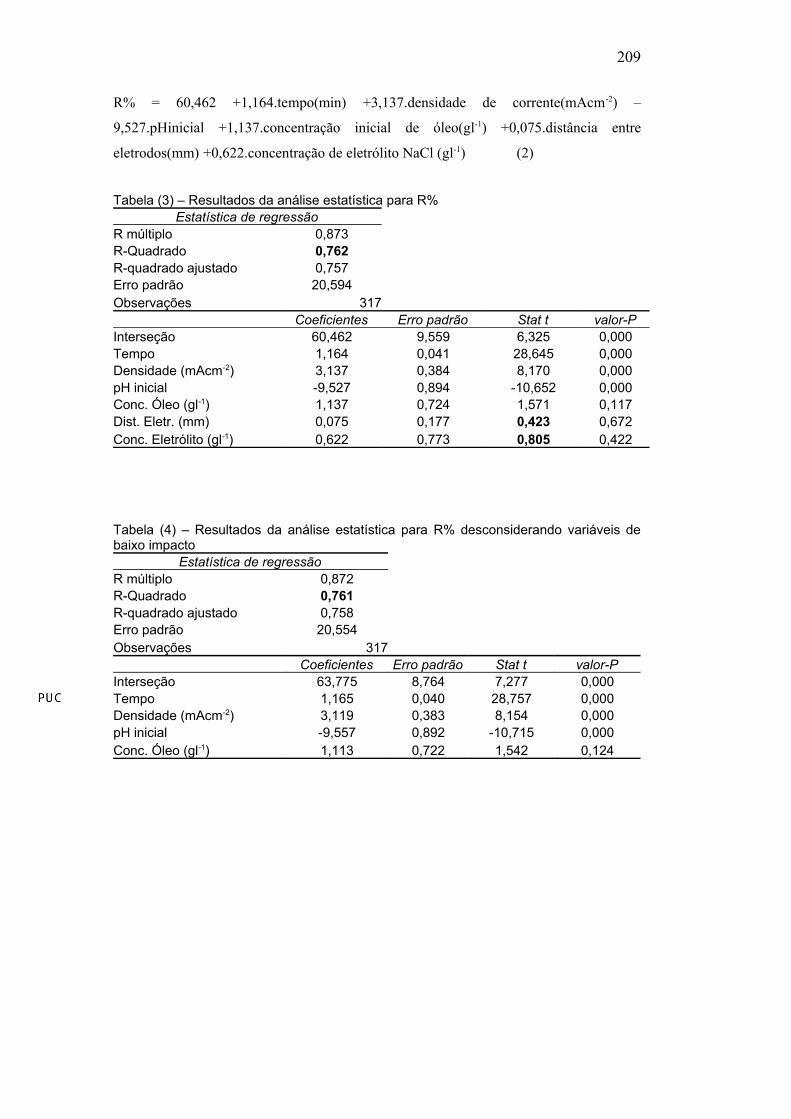
R% = 60,462 +1,164.tempo(min) +3,137.densidade de corrente(mAcm-2) –
9,527.pHinicial +1,137.concentração inicial de óleo(gl-1) +0,075.distância entre
eletrodos(mm) +0,622.concentração de eletrólito NaCl (gl-1) (2)
Tabela (3) – Resultados da análise estatística para R%Estatística de regressão
R múltiplo 0,873R-Quadrado 0,762R-quadrado ajustado 0,757Erro padrão 20,594Observações 317
Coeficientes Erro padrão Stat t valor-PInterseção 60,462 9,559 6,325 0,000Tempo 1,164 0,041 28,645 0,000Densidade (mAcm-2) 3,137 0,384 8,170 0,000pH inicial -9,527 0,894 -10,652 0,000Conc. Óleo (gl-1) 1,137 0,724 1,571 0,117Dist. Eletr. (mm) 0,075 0,177 0,423 0,672Conc. Eletrólito (gl-1) 0,622 0,773 0,805 0,422
Tabela (4) – Resultados da análise estatística para R% desconsiderando variáveis de baixo impacto
Estatística de regressãoR múltiplo 0,872R-Quadrado 0,761R-quadrado ajustado 0,758Erro padrão 20,554Observações 317
Coeficientes Erro padrão Stat t valor-PInterseção 63,775 8,764 7,277 0,000Tempo 1,165 0,040 28,757 0,000Densidade (mAcm-2) 3,119 0,383 8,154 0,000pH inicial -9,557 0,892 -10,715 0,000Conc. Óleo (gl-1) 1,113 0,722 1,542 0,124
209
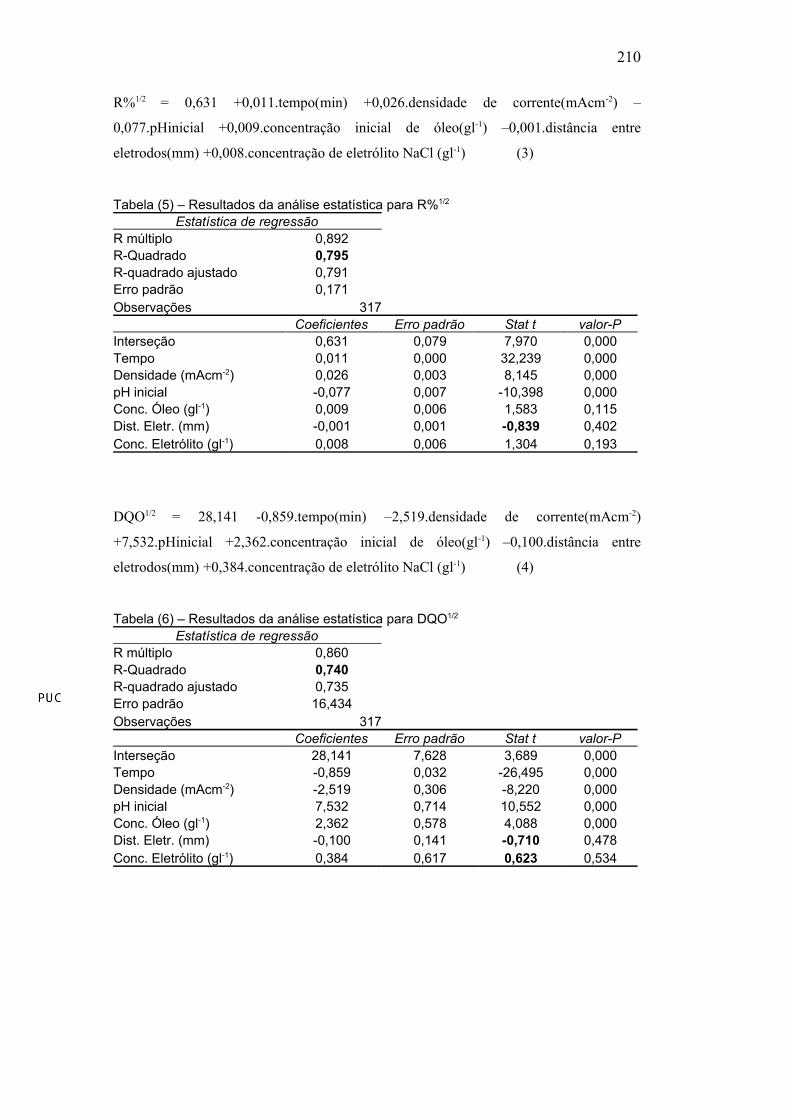
R%1/2 = 0,631 +0,011.tempo(min) +0,026.densidade de corrente(mAcm-2) –
0,077.pHinicial +0,009.concentração inicial de óleo(gl-1) –0,001.distância entre
eletrodos(mm) +0,008.concentração de eletrólito NaCl (gl-1) (3)
Tabela (5) – Resultados da análise estatística para R%1/2
Estatística de regressãoR múltiplo 0,892R-Quadrado 0,795R-quadrado ajustado 0,791Erro padrão 0,171Observações 317
Coeficientes Erro padrão Stat t valor-PInterseção 0,631 0,079 7,970 0,000Tempo 0,011 0,000 32,239 0,000Densidade (mAcm-2) 0,026 0,003 8,145 0,000pH inicial -0,077 0,007 -10,398 0,000Conc. Óleo (gl-1) 0,009 0,006 1,583 0,115Dist. Eletr. (mm) -0,001 0,001 -0,839 0,402Conc. Eletrólito (gl-1) 0,008 0,006 1,304 0,193
DQO1/2 = 28,141 -0,859.tempo(min) –2,519.densidade de corrente(mAcm-2)
+7,532.pHinicial +2,362.concentração inicial de óleo(gl-1) –0,100.distância entre
eletrodos(mm) +0,384.concentração de eletrólito NaCl (gl-1) (4)
Tabela (6) – Resultados da análise estatística para DQO1/2
Estatística de regressãoR múltiplo 0,860R-Quadrado 0,740R-quadrado ajustado 0,735Erro padrão 16,434Observações 317
Coeficientes Erro padrão Stat t valor-PInterseção 28,141 7,628 3,689 0,000Tempo -0,859 0,032 -26,495 0,000Densidade (mAcm-2) -2,519 0,306 -8,220 0,000pH inicial 7,532 0,714 10,552 0,000Conc. Óleo (gl-1) 2,362 0,578 4,088 0,000Dist. Eletr. (mm) -0,100 0,141 -0,710 0,478Conc. Eletrólito (gl-1) 0,384 0,617 0,623 0,534
210

ln(DQO) = 6,049 -0,045.tempo(min) –0,156.densidade de corrente(mAcm-2)
+0,432.pHinicial +0,047.concentração inicial de óleo(gl-1) –0,009.distância entre
eletrodos(mm) +0,042.concentração de eletrólito NaCl (gl-1) (5)
Tabela (7) – Resultados da análise estatística para ln(DQO)Estatística de regressão
R múltiplo 0,847R-Quadrado 0,717R-quadrado ajustado 0,711Erro padrão 0,930Observações 317
Coeficientes Erro padrão Stat t valor-PInterseção 6,049 0,432 14,008 0,000Tempo -0,045 0,002 -24,549 0,000Densidade (mAcm-2) -0,156 0,017 -9,006 0,000pH inicial 0,432 0,040 10,687 0,000Conc. Óleo (gl-1) 0,047 0,033 1,435 0,152Dist. Eletr. (mm) -0,009 0,008 -1,144 0,253Conc. Eletrólito (gl-1) 0,042 0,035 1,207 0,228
1/DQO = 6,589.10-3 +1,049.10-4.tempo(min) +6,036.10-4.densidade de corrente(mAcm-2)
–1,151.10-3.pHinicial –5,012.10-5.concentração inicial de óleo(gl-1) +1,097.10-5.distância
entre eletrodos(mm) –2,309.10-4.concentração de eletrólito NaCl (gl-1) (6)
Tabela (8) – Resultados da análise estatística para 1/DQOEstatística de regressão
R múltiplo 0,683R-Quadrado 0,467R-quadrado ajustado 0,457Erro padrão 0,004Observações 317
Coeficientes Erro padrão Stat t valor-PInterseção 6,589E-03 0,002 3,509 0,001Tempo 1,049E-04 0,000 13,144 0,000Densidade (mAcm-2) 6,036E-04 0,000 8,004 0,000pH inicial -1,151E-03 0,000 -6,553 0,000Conc. Óleo (gl-1) -5,012E-05 0,000 -0,352 0,725Dist. Eletr. (mm) 1,097E-05 0,000 0,316 0,752Conc. Eletrólito (gl-1) -2,309E-04 0,000 -1,521 0,129
211
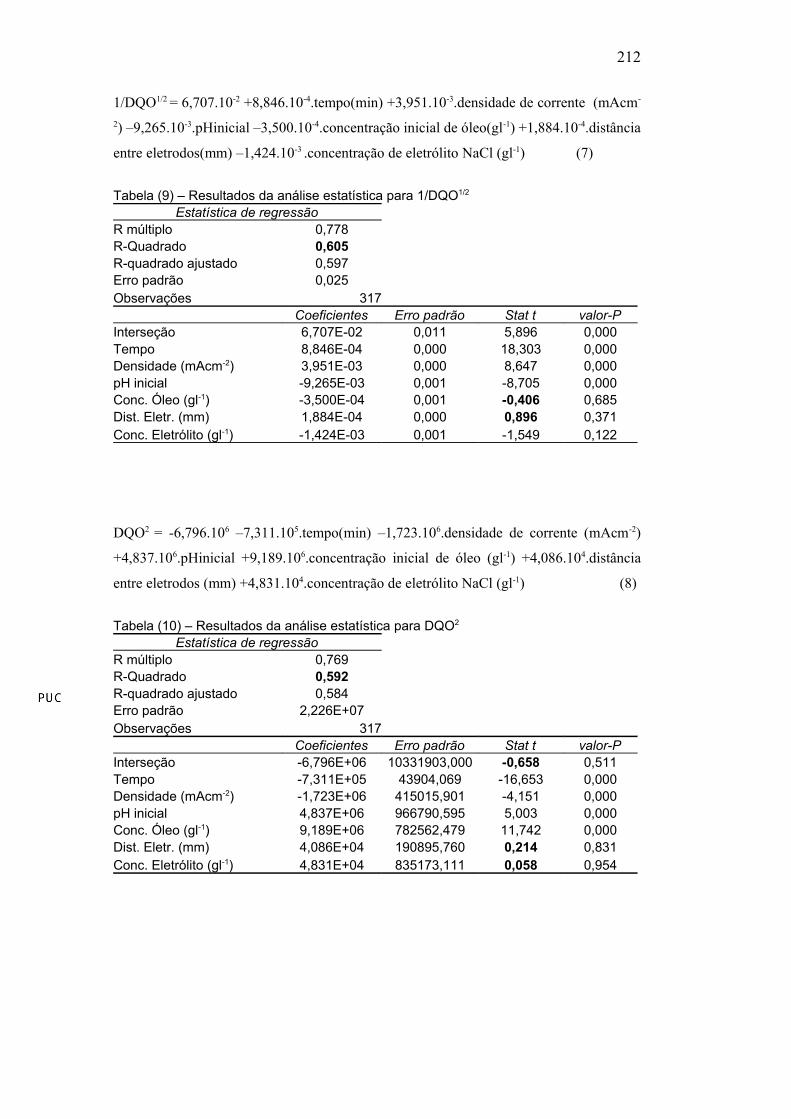
1/DQO1/2 = 6,707.10-2 +8,846.10-4.tempo(min) +3,951.10-3.densidade de corrente (mAcm-
2) –9,265.10-3.pHinicial –3,500.10-4.concentração inicial de óleo(gl-1) +1,884.10-4.distância
entre eletrodos(mm) –1,424.10-3 .concentração de eletrólito NaCl (gl-1) (7)
Tabela (9) – Resultados da análise estatística para 1/DQO1/2
Estatística de regressãoR múltiplo 0,778R-Quadrado 0,605R-quadrado ajustado 0,597Erro padrão 0,025Observações 317
Coeficientes Erro padrão Stat t valor-PInterseção 6,707E-02 0,011 5,896 0,000Tempo 8,846E-04 0,000 18,303 0,000Densidade (mAcm-2) 3,951E-03 0,000 8,647 0,000pH inicial -9,265E-03 0,001 -8,705 0,000Conc. Óleo (gl-1) -3,500E-04 0,001 -0,406 0,685Dist. Eletr. (mm) 1,884E-04 0,000 0,896 0,371Conc. Eletrólito (gl-1) -1,424E-03 0,001 -1,549 0,122
DQO2 = -6,796.106 –7,311.105.tempo(min) –1,723.106.densidade de corrente (mAcm-2)
+4,837.106.pHinicial +9,189.106.concentração inicial de óleo (gl-1) +4,086.104.distância
entre eletrodos (mm) +4,831.104.concentração de eletrólito NaCl (gl-1) (8)
Tabela (10) – Resultados da análise estatística para DQO2
Estatística de regressãoR múltiplo 0,769R-Quadrado 0,592R-quadrado ajustado 0,584Erro padrão 2,226E+07Observações 317
Coeficientes Erro padrão Stat t valor-PInterseção -6,796E+06 10331903,000 -0,658 0,511Tempo -7,311E+05 43904,069 -16,653 0,000Densidade (mAcm-2) -1,723E+06 415015,901 -4,151 0,000pH inicial 4,837E+06 966790,595 5,003 0,000Conc. Óleo (gl-1) 9,189E+06 782562,479 11,742 0,000Dist. Eletr. (mm) 4,086E+04 190895,760 0,214 0,831Conc. Eletrólito (gl-1) 4,831E+04 835173,111 0,058 0,954
212
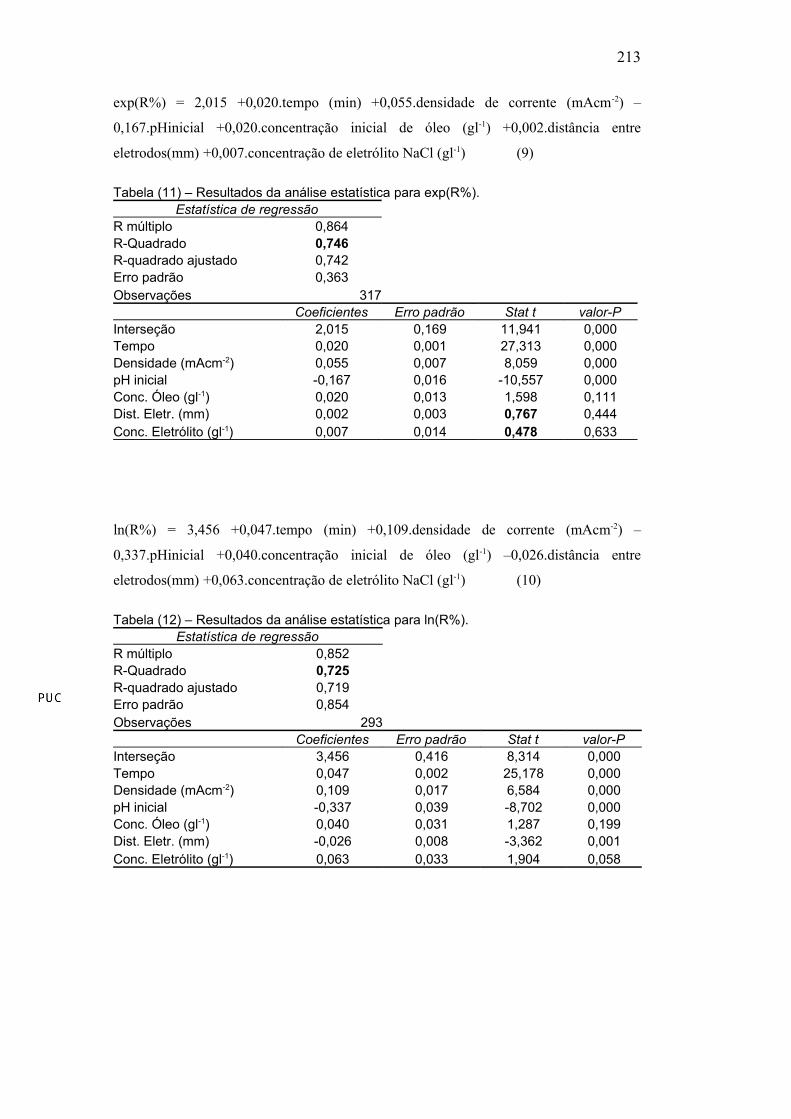
exp(R%) = 2,015 +0,020.tempo (min) +0,055.densidade de corrente (mAcm-2) –
0,167.pHinicial +0,020.concentração inicial de óleo (gl-1) +0,002.distância entre
eletrodos(mm) +0,007.concentração de eletrólito NaCl (gl-1) (9)
Tabela (11) – Resultados da análise estatística para exp(R%).Estatística de regressão
R múltiplo 0,864R-Quadrado 0,746R-quadrado ajustado 0,742Erro padrão 0,363Observações 317
Coeficientes Erro padrão Stat t valor-PInterseção 2,015 0,169 11,941 0,000Tempo 0,020 0,001 27,313 0,000Densidade (mAcm-2) 0,055 0,007 8,059 0,000pH inicial -0,167 0,016 -10,557 0,000Conc. Óleo (gl-1) 0,020 0,013 1,598 0,111Dist. Eletr. (mm) 0,002 0,003 0,767 0,444Conc. Eletrólito (gl-1) 0,007 0,014 0,478 0,633
ln(R%) = 3,456 +0,047.tempo (min) +0,109.densidade de corrente (mAcm-2) –
0,337.pHinicial +0,040.concentração inicial de óleo (gl-1) –0,026.distância entre
eletrodos(mm) +0,063.concentração de eletrólito NaCl (gl-1) (10)
Tabela (12) – Resultados da análise estatística para ln(R%).Estatística de regressão
R múltiplo 0,852R-Quadrado 0,725R-quadrado ajustado 0,719Erro padrão 0,854Observações 293
Coeficientes Erro padrão Stat t valor-PInterseção 3,456 0,416 8,314 0,000Tempo 0,047 0,002 25,178 0,000Densidade (mAcm-2) 0,109 0,017 6,584 0,000pH inicial -0,337 0,039 -8,702 0,000Conc. Óleo (gl-1) 0,040 0,031 1,287 0,199Dist. Eletr. (mm) -0,026 0,008 -3,362 0,001Conc. Eletrólito (gl-1) 0,063 0,033 1,904 0,058
213

(R%)2 = 0,581 +0,011.tempo (min) +0,033.densidade de corrente (mAcm-2) –
0,100.pHinicial +0,012.concentração inicial de óleo (gl-1) +0,002.distância entre
eletrodos(mm) +0,002.concentração de eletrólito NaCl (gl-1) (11)
Tabela (13) – Resultados da análise estatística para (R%)2.Estatística de regressão
R múltiplo 0,845R-Quadrado 0,714R-quadrado ajustado 0,708Erro padrão 0,229Observações 317
Coeficientes Erro padrão Stat t valor-PInterseção 0,581 0,106 5,472 0,000Tempo 0,011 0,000 24,910 0,000Densidade (mAcm-2) 0,033 0,004 7,644 0,000pH inicial -0,100 0,010 -10,087 0,000Conc. Óleo (gl-1) 0,012 0,008 1,518 0,130Dist. Eletr. (mm) 0,002 0,002 1,094 0,275Conc. Eletrólito (gl-1) 0,002 0,009 0,183 0,855
(R%)-1 = 0,051 –0,010.tempo (min) –0,001.densidade de corrente (mAcm-2)
+0,048.pHinicial –0,001.concentração inicial de óleo (gl-1) +0,022.distância entre
eletrodos(mm) -0,023.concentração de eletrólito NaCl (gl-1) (12)
Tabela (14) – Resultados da análise estatística para (R%)-1.Estatística de regressão
R múltiplo 0,416R-Quadrado 0,173R-quadrado ajustado 0,156Erro padrão 0,671Observações 293
Coeficientes Erro padrão Stat t valor-PInterseção 0,051 0,327 0,156 0,876Tempo -0,010 0,001 -6,657 0,000Densidade (mAcm-2) -0,001 0,013 -0,105 0,917pH inicial 0,048 0,030 1,568 0,118Conc. Óleo (gl-1) -0,001 0,025 -0,028 0,978Dist. Eletr. (mm) 0,022 0,006 3,717 0,000Conc. Eletrólito (gl-1) -0,023 0,026 -0,891 0,373
214

(R%/R*%) = 0,431 +0,013.tempo (min) +0,020.densidade de corrente (mAcm-2) -0,063
.pHinicial +0,007.concentração inicial de óleo (gl-1) -0,002.distância entre eletrodos (mm)
+0,001.concentração de eletrólito NaCl (gl-1) (13)
Tabela (15) – Resultados da análise estatística para (R%/R*%).Estatística de regressão
R múltiplo 0,902R-Quadrado 0,814R-quadrado ajustado 0,810Erro padrão 0,183Observações 317
Coeficientes Erro padrão Stat t valor-PInterseção 0,431 0,085 5,068 0,000Tempo 0,013 0,000 35,574 0,000Densidade (mAcm-2) 0,020 0,003 5,850 0,000pH inicial -0,063 0,008 -7,942 0,000Conc. Óleo (gl-1) 0,007 0,006 1,119 0,264Dist. Eletr. (mm) -0,002 0,002 -0,993 0,321Conc. Eletrólito (gl-1) 0,001 0,007 0,121 0,904
exp(R%/R*%) = 1,726 +0,022.tempo (min) +0,037.densidade de corrente (mAcm-2)
-0,116.pHinicial +0,013.concentração inicial de óleo (gl-1) -0,001.distância entre eletrodos
(mm) -0,002.concentração de eletrólito NaCl (gl-1) (14)
Tabela (16) – Resultados da análise estatística para exp(R%/R*%).Estatística de regressão
R múltiplo 0,901R-Quadrado 0,812R-quadrado ajustado 0,808Erro padrão 0,319Observações 317
Coeficientes Erro padrão Stat t valor-PInterseção 1,726 0,148 11,674 0,000Tempo 0,022 0,001 35,225 0,000Densidade (mAcm-2) 0,037 0,006 6,199 0,000pH inicial -0,116 0,014 -8,379 0,000Conc. Óleo (gl-1) 0,013 0,011 1,148 0,252Dist. Eletr. (mm) -0,001 0,003 -0,519 0,604Conc. Eletrólito (gl-1) -0,002 0,012 -0,179 0,858
215

(R%/R*%)1/2 = 0,480 +0,011.tempo (min) +0,015.densidade de corrente (mAcm-2) -0,046
.pHinicial +0,006.concentração inicial de óleo (gl-1) -0,003.distância entre eletrodos (mm)
+0,003.concentração de eletrólito NaCl (gl-1) (15)
Tabela (17) – Resultados da análise estatística para (R%/R*%)1/2.Estatística de regressão
R múltiplo 0,900R-Quadrado 0,809R-quadrado ajustado 0,805Erro padrão 0,164Observações 317
Coeficientes Erro padrão Stat t valor-PInterseção 0,480 0,076 6,302 0,000Tempo 0,011 0,000 35,392 0,000Densidade (mAcm-2) 0,015 0,003 4,982 0,000pH inicial -0,046 0,007 -6,523 0,000Conc. Óleo (gl-1) 0,006 0,006 1,049 0,295Dist. Eletr. (mm) -0,003 0,001 -2,312 0,021Conc. Eletrólito (gl-1) 0,003 0,006 0,557 0,578
exp((R*-R)/R*) = 0,635 +0,008.tempo (min) +0,014.densidade de corrente (mAcm-2)
-0,043.pHinicial +0,005.concentração inicial de óleo (gl-1) -0,001.distância entre eletrodos
(mm) -0,001.concentração de eletrólito NaCl (gl-1) (16)
Tabela (18) – Resultados da análise estatística para exp((R*-R)/R*).Estatística de regressão
R múltiplo 0,901R-Quadrado 0,812R-quadrado ajustado 0,808Erro padrão 0,117Observações 317
Coeficientes Erro padrão Stat t valor-PInterseção 0,635 0,054 11,674 0,000Tempo 0,008 0,000 35,225 0,000Densidade (mAcm-2) 0,014 0,002 6,199 0,000pH inicial -0,043 0,005 -8,379 0,000Conc. Óleo (gl-1) 0,005 0,004 1,148 0,252Dist. Eletr. (mm) -0,001 0,001 -0,519 0,604Conc. Eletrólito (gl-1) -0,001 0,004 -0,179 0,858
216

ln((R*-R)/R*) = -2,048 –0,081.tempo (min) –0,152.densidade de corrente (mAcm-2)
+0,436.pHinicial –0,029.concentração inicial de óleo (gl-1) -0,002.distância entre
eletrodos (mm) +0,057.concentração de eletrólito NaCl (gl-1) (17)
Tabela (19) – Resultados da análise estatística para ln((R*-R)/R*).Estatística de regressão
R múltiplo 0,855R-Quadrado 0,730R-quadrado ajustado 0,725Erro padrão 1,483Observações 317
Coeficientes Erro padrão Stat t valor-PInterseção -2,048 0,688 -2,976 0,003Tempo -0,081 0,003 -27,760 0,000Densidade (mAcm-2) -0,152 0,028 -5,509 0,000pH inicial 0,436 0,064 6,777 0,000Conc. Óleo (gl-1) -0,029 0,052 -0,560 0,576Dist. Eletr. (mm) -0,002 0,013 -0,186 0,853Conc. Eletrólito (gl-1) 0,057 0,056 1,029 0,304
((R*-R)/R*)1/2 = 0,618 -0,012.tempo (min) -0,021.densidade de corrente (mAcm-2)
+0,065.pHinicial -0,007.concentração inicial de óleo (gl-1) +3,752.10-4.distância entre
eletrodos (mm) +0,003.concentração de eletrólito NaCl (gl-1) (18)
Tabela (20) – Resultados da análise estatística para ((R*-R)/R*)1/2.Estatística de regressão
R múltiplo 0,911R-Quadrado 0,830R-quadrado ajustado 0,827Erro padrão 0,163Observações 317
Coeficientes Erro padrão Stat t valor-PInterseção 0,618 0,075 8,180 0,000Tempo -0,012 0,000 -37,317 0,000Densidade (mAcm-2) -0,021 0,003 -7,016 0,000pH inicial 0,065 0,007 9,135 0,000Conc. Óleo (gl-1) -0,007 0,006 -1,272 0,204Dist. Eletr. (mm) 3,752E-04 0,001 0,269 0,788Conc. Eletrólito (gl-1) 0,003 0,006 0,547 0,585
217
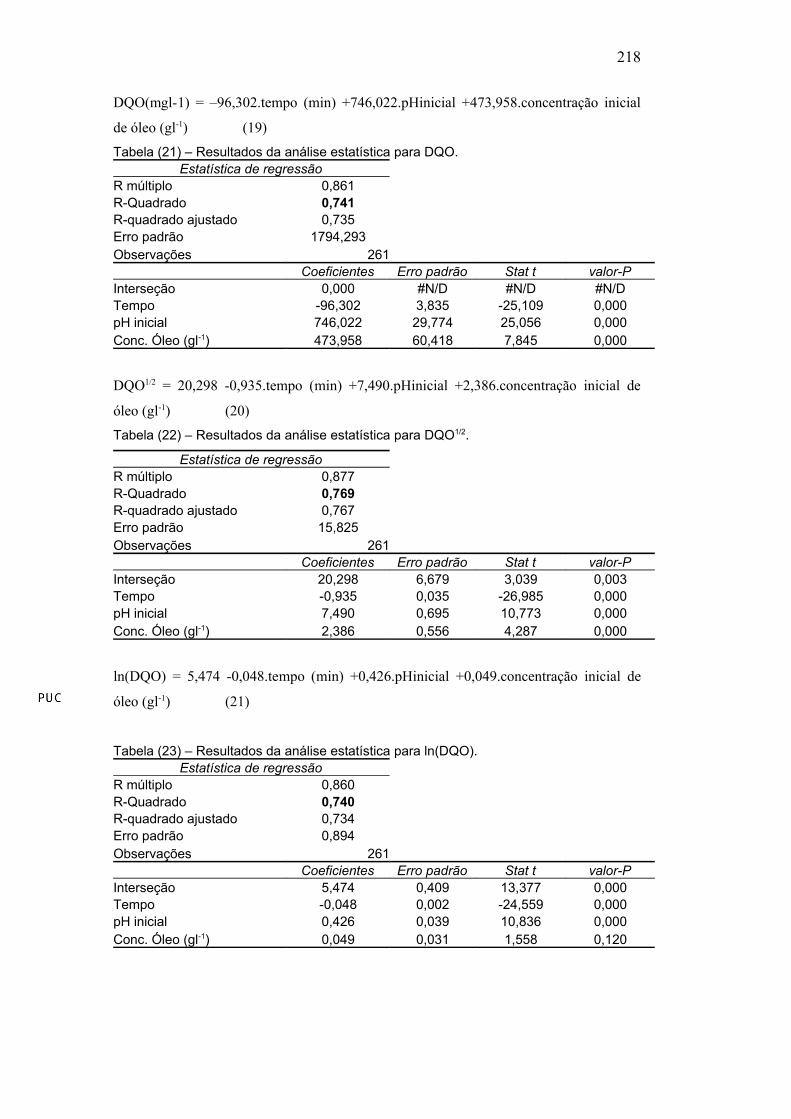
DQO(mgl-1) = –96,302.tempo (min) +746,022.pHinicial +473,958.concentração inicial
de óleo (gl-1) (19)
Tabela (21) – Resultados da análise estatística para DQO.Estatística de regressão
R múltiplo 0,861R-Quadrado 0,741R-quadrado ajustado 0,735Erro padrão 1794,293Observações 261
Coeficientes Erro padrão Stat t valor-PInterseção 0,000 #N/D #N/D #N/DTempo -96,302 3,835 -25,109 0,000pH inicial 746,022 29,774 25,056 0,000Conc. Óleo (gl-1) 473,958 60,418 7,845 0,000
DQO1/2 = 20,298 -0,935.tempo (min) +7,490.pHinicial +2,386.concentração inicial de
óleo (gl-1) (20)
Tabela (22) – Resultados da análise estatística para DQO1/2.
Estatística de regressãoR múltiplo 0,877R-Quadrado 0,769R-quadrado ajustado 0,767Erro padrão 15,825Observações 261
Coeficientes Erro padrão Stat t valor-PInterseção 20,298 6,679 3,039 0,003Tempo -0,935 0,035 -26,985 0,000pH inicial 7,490 0,695 10,773 0,000Conc. Óleo (gl-1) 2,386 0,556 4,287 0,000
ln(DQO) = 5,474 -0,048.tempo (min) +0,426.pHinicial +0,049.concentração inicial de
óleo (gl-1) (21)
Tabela (23) – Resultados da análise estatística para ln(DQO).Estatística de regressão
R múltiplo 0,860R-Quadrado 0,740R-quadrado ajustado 0,734Erro padrão 0,894Observações 261
Coeficientes Erro padrão Stat t valor-PInterseção 5,474 0,409 13,377 0,000Tempo -0,048 0,002 -24,559 0,000pH inicial 0,426 0,039 10,836 0,000Conc. Óleo (gl-1) 0,049 0,031 1,558 0,120
218

R% = 73,192 +1,245.tempo (min) –9,264.pHinicial +1,024.concentração inicial de óleo
(gl-1) (22)
Tabela (24) – Resultados da análise estatística para R%.
Estatística de regressãoR múltiplo 0,891R-Quadrado 0,794R-quadrado ajustado 0,791Erro padrão 19,290Observações 261
Coeficientes Erro padrão Stat t valor-PInterseção 73,192 8,142 8,989 0,000Tempo 1,245 0,042 29,483 0,000pH inicial -9,264 0,848 -10,930 0,000Conc. Óleo (gl-1) 1,024 0,678 1,510 0,132
R%1/2 = 7,212 +0,115.tempo (min) –0,758.pHinicial +0,090.concentração inicial de óleo
(gl-1) (23)
Tabela (25) – Resultados da análise estatística para R%1/2
Estatística de regressãoR múltiplo 0,907R-Quadrado 0,823R-quadrado ajustado 0,820Erro padrão 1,611Observações 261
Coeficientes Erro padrão Stat t valor-PInterseção 7,212 0,737 9,779 0,000Tempo 0,115 0,004 32,709 0,000pH inicial -0,758 0,071 -10,706 0,000Conc. Óleo (gl-1) 0,090 0,057 1,581 0,115
exp(R%) = 2,231 +0,021.tempo (min) –0,161.pHinicial +0,018.concentração inicial de
óleo (gl-1) (24)
Tabela (26)– Resultados da análise estatística para exp(R%).
Estatística de regressãoR múltiplo 0,884R-Quadrado 0,781R-quadrado ajustado 0,779Erro padrão 0,339Observações 261
Coeficientes Erro padrão Stat t valor-PInterseção 2,231 0,143 15,585 0,000Tempo 0,021 0,001 28,298 0,000pH inicial -0,161 0,015 -10,834 0,000Conc. Óleo (gl-1) 0,018 0,012 1,536 0,126
219

R%2 = 0,708 +0,012.tempo (min) –0,097.pHinicial +0,011.concentração inicial de óleo
(gl-1) (25)
Tabela (27) – Resultados da análise estatística para R%2. Estatística de regressão
R múltiplo 0,867R-Quadrado 0,751R-quadrado ajustado 0,748Erro padrão 0,214Observações 261
Coeficientes Erro padrão Stat t valor-PInterseção 0,708 0,090 7,847 0,000Tempo 0,012 0,000 25,879 0,000pH inicial -0,097 0,009 -10,289 0,000Conc. Óleo (gl-1) 0,011 0,008 1,439 0,151
(R%/R*%) = 0,507 +0,013.tempo (min) -0,067.pHinicial +0,008.concentração inicial de
óleo (gl-1) (26)
Tabela (28) – Resultados da análise estatística para (R%/R*%).Estatística de regressão
R múltiplo 0,905R-Quadrado 0,819R-quadrado ajustado 0,817Erro padrão 0,183Observações 261
Coeficientes Erro padrão Stat t valor-PInterseção 0,507 0,077 6,576 0,000Tempo 0,013 0,000 33,110 0,000pH inicial -0,067 0,008 -8,402 0,000Conc. Óleo (gl-1) 0,008 0,006 1,304 0,193
exp(R%/R*%) = 1,869 +0,023.tempo (min) -0,122.pHinicial +0,014.concentração inicial
de óleo (gl-1) (27)
Tabela (29) – Resultados da análise estatística para exp(R%/R*%).Estatística de regressão
R múltiplo 0,901R-Quadrado 0,812R-quadrado ajustado 0,810Erro padrão 0,322Observações 261
Coeficientes Erro padrão Stat t valor-PInterseção 1,869 0,136 13,764 0,000Tempo 0,023 0,001 32,216 0,000pH inicial -0,122 0,014 -8,610 0,000Conc. Óleo (gl-1) 0,014 0,011 1,277 0,203
220

(R%/R*%)1/2 = 0,522 +0,012.tempo (min) -0,052.pHinicial +0,008.concentração inicial
de óleo (gl-1) (28)
Tabela (30)– Resultados da análise estatística para (R%/R*%)1/2.
Estatística de regressãoR múltiplo 0,912R-Quadrado 0,832R-quadrado ajustado 0,830Erro padrão 0,157Observações 261
Coeficientes Erro padrão Stat t valor-PInterseção 0,522 0,066 7,887 0,000Tempo 0,012 0,000 34,843 0,000pH inicial -0,052 0,007 -7,504 0,000Conc. Óleo (gl-1) 0,008 0,006 1,382 0,168
exp((R*-R)/R*) = 1,849 –0,023.tempo (min) +0,109.pHinicial -0,015.concentração inicial
de óleo (gl-1) (29)
Tabela (31) – Resultados da análise estatística para exp((R*-R)/R*).
Estatística de regressãoR múltiplo 0,906R-Quadrado 0,821R-quadrado ajustado 0,819Erro padrão 0,310Observações 261
Coeficientes Erro padrão Stat t valor-PInterseção 1,849 0,131 14,132 0,000Tempo -0,023 0,001 -33,366 0,000pH inicial 0,109 0,014 7,971 0,000Conc. Óleo (gl-1) -0,015 0,011 -1,342 0,181
((R*-R)/R*)1/2 = 0,540 –0,012.tempo (min) +0,067.pHinicial -0,008.concentração inicial
de óleo (gl-1) (30)
Tabela (32) – Resultados da análise estatística para ((R*-R)/R*)1/2.
Estatística de regressãoR múltiplo 0,910R-Quadrado 0,829R-quadrado ajustado 0,827Erro padrão 0,165Observações 261
Coeficientes Erro padrão Stat t valor-PInterseção 0,540 0,069 7,769 0,000Tempo -0,012 0,000 -34,052 0,000pH inicial 0,067 0,007 9,290 0,000Conc. Óleo (gl-1) -0,008 0,006 -1,387 0,167
221


![Referências Bibliográficas - DBD PUC RIO · Referências Bibliográficas [1] ANATEL, Regulamento sobre a Limitação da Exposição a Campos Elétricos e Eletromagnéticos na faixa](https://img.dokumen.tips/doc/110x75/5bee364909d3f2f51e8c9be8/referencias-bibliograficas-dbd-puc-referencias-bibliograficas-1-anatel.jpg)


![9 Referências Bibliográficas - DBD PUC RIO · 9 Referências Bibliográficas ABBS, B; ... Editora Vozes Ltda, [1975], ... Coral Gardens and their magic. v. 2](https://img.dokumen.tips/doc/110x75/5bf6953b09d3f2d24c8cba7d/9-referencias-bibliograficas-dbd-puc-9-referencias-bibliograficas-abbs.jpg)