Embed Size (px)
Citation preview
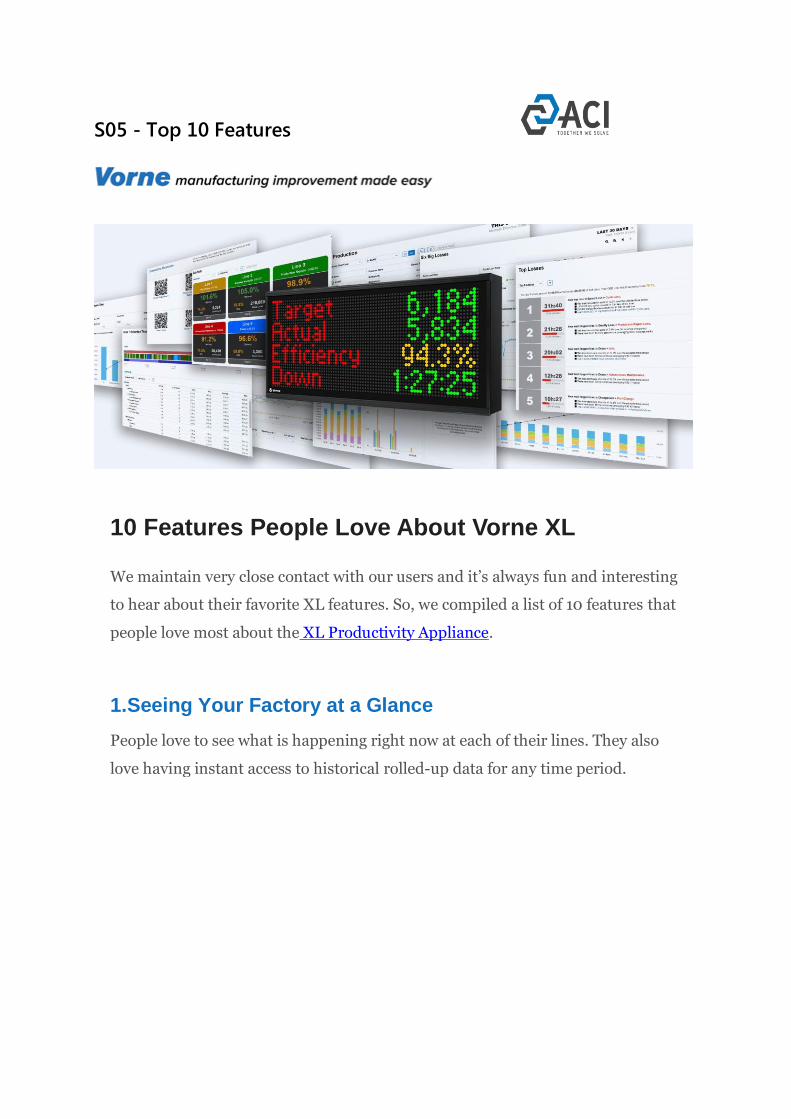
S05 - Top 10 Features
10 Features People Love About Vorne XL
We maintain very close contact with our users and it’s always fun and interesting
to hear about their favorite XL features. So, we compiled a list of 10 features that
people love most about the XL Productivity Appliance.
1.Seeing Your Factory at a Glance
People love to see what is happening right now at each of their lines. They also
love having instant access to historical rolled-up data for any time period.
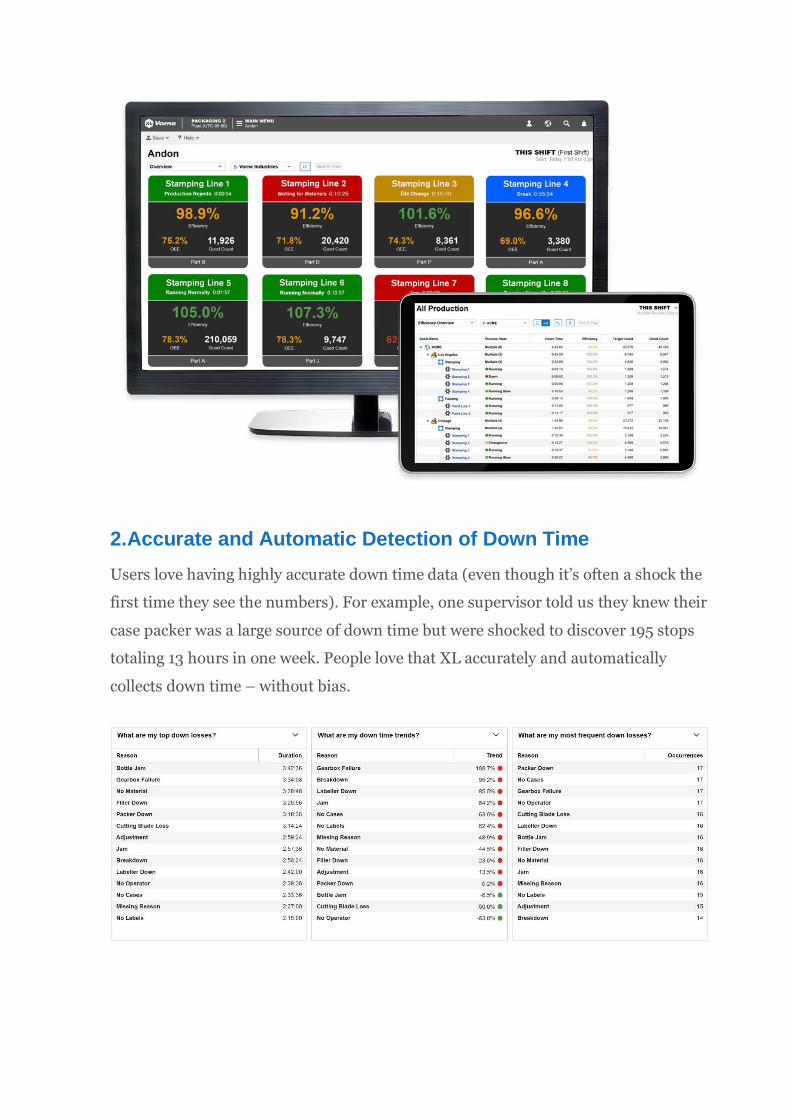
2.Accurate and Automatic Detection of Down Time
Users love having highly accurate down time data (even though it’s often a shock the
first time they see the numbers). For example, one supervisor told us they knew their
case packer was a large source of down time but were shocked to discover 195 stops
totaling 13 hours in one week. People love that XL accurately and automatically
collects down time – without bias.
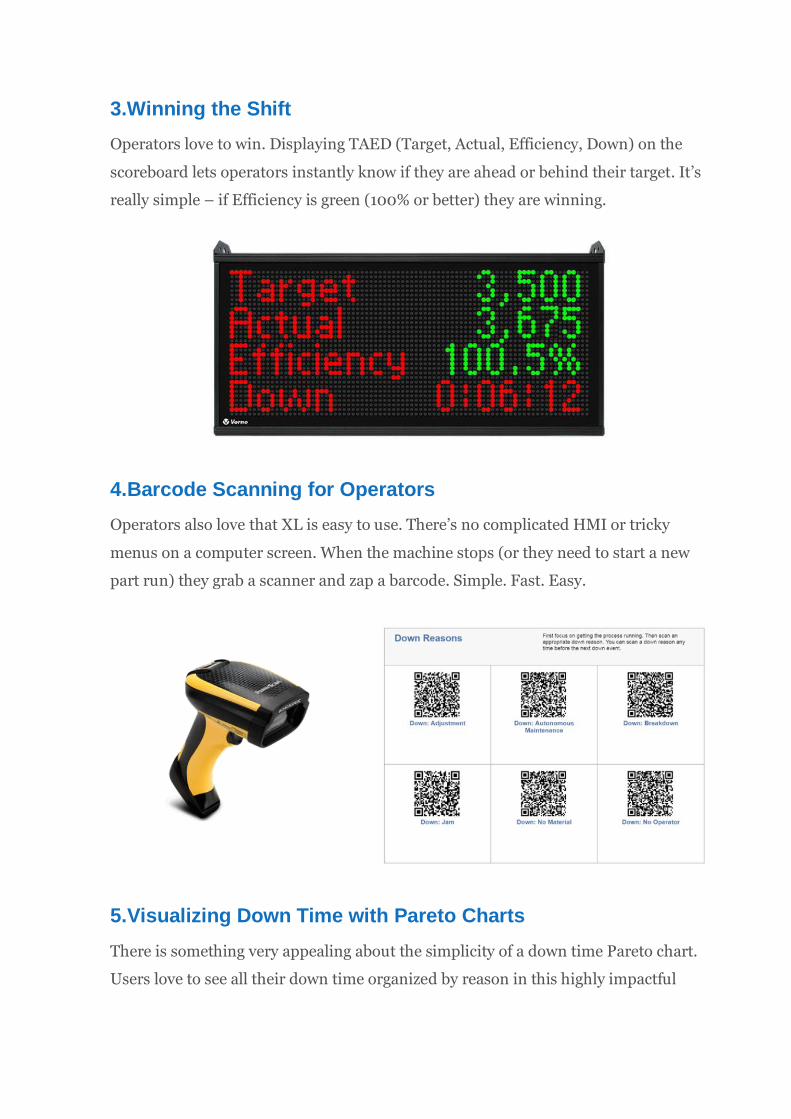
3.Winning the Shift
Operators love to win. Displaying TAED (Target, Actual, Efficiency, Down) on the
scoreboard lets operators instantly know if they are ahead or behind their target. It’s
really simple – if Efficiency is green (100% or better) they are winning.
4.Barcode Scanning for Operators
Operators also love that XL is easy to use. There’s no complicated HMI or tricky
menus on a computer screen. When the machine stops (or they need to start a new
part run) they grab a scanner and zap a barcode. Simple. Fast. Easy.
5.Visualizing Down Time with Pareto Charts
There is something very appealing about the simplicity of a down time Pareto chart.
Users love to see all their down time organized by reason in this highly impactful

way. They also love that they can easily filter by shift, part, or any of the other
analytical dimensions provided by XL.
6.Seeing Patterns Jump Off the Page
Chronograms are great for spotting patterns. People love that it is easy to see
patterns such as late starts after breaks (red after blue), rough running after
changeovers (light green or red after orange), or down time (lots of red).
7.Exporting Data to Excel
Users love that it’s easy to download data straight into Microsoft Excel. Every data
table can be downloaded, and it’s simple to create your own data tables with
whatever combination of metrics you want to export.

8.Integrating to ERP Systems
IT loves that it is easy to integrate XL to their ERP system. A common integration is
starting jobs in XL with information from your ERP, and then copying metrics for
each completed job back to your ERP. Our partner Vetii | GROUP provides tools for
easy ERP integration, which can be deployed at any time.

9.Instantly Accessing Top Losses
CI engineers love that the Top Losses page tells them exactly where to focus their
attention (it ranks and prioritizes every loss). Consider it your continuous
improvement roadmap to success. No additional analysis needed. It’s the perfect
page for picking your next improvement project.
10.Exposing Hidden Losses
Many users are amazed to discover how much production time is lost to previously

hidden losses such as slow cycles and small stops. For example, one customer
discovered that their operator was slowing the filling machine in order to prevent a
handful of rejects each hour – at a cost of 6,500 bottles per hour of production.
Now It's Your Turn
Call me and we’ll talk about your application and the problems you would like to
solve. Or click the button below to schedule a webinar. Either way – let’s talk.
Dierik Rotsaert
Snr. consultant
0032/474/33.73.47
www.tqm.be
https://trs-logiciel.fr/
https://oee-tracking.nl/