Embed Size (px)
Citation preview
1
Youth Development Indicators for Educational and Workforce Development Programs in
Massachusetts At the State, Regional, and Local WIB Service Delivery Areas
Prepared ByCenter for Labor Market Studies
Northeastern UniversityBoston, Massachusetts
Prepared for:Commonwealth Corporation
March 19, 2009

2
The Components of the Massachusetts Youth Development Indicators Project
• The Youth Development Indicators Packages. They were produced for the entire state, five regions across the state, and the sixteen local WIB service delivery areas
• A Users Guide for the Youth Development Indicators Packages
• A Power Point Presentation Providing Key Findings and Data on Youth Educational Labor Market, and Social Outcomes
• A Policy Research Monograph on the State of Youth In the Commonwealth and Key Educational/Workforce Development Challenges

3
Key Elements of the Youth Development Indicator Packages
• The size and demographic characteristics of the resident 16-24 year old population; recent changes in its size and the projected population outlook to 2015
• The school enrollment status/educational attainment of the 16-19 and 20-24 year old population
• The labor force behavior, unemployment rates, and unemployment rates of teens and young adults
• The employment and earnings experiences of teens and young adults over the year
• The industries and occupations of the jobs held by employed teens and young adults

4
Key Elements of the Youth Development Indicator Packages (Cont.)
• The percent of teens and young adults with no paid work experience during the year
• The percent of teens and young adults that were disconnected from both school and work
• The percent of teens and young adults that were disconnected from both school and work
• The incidence of high school dropout problems among teens and young adults and their income problem
• The incidence of motherhood and single motherhood among 16-24 year old women and their income inadequacy problems
5
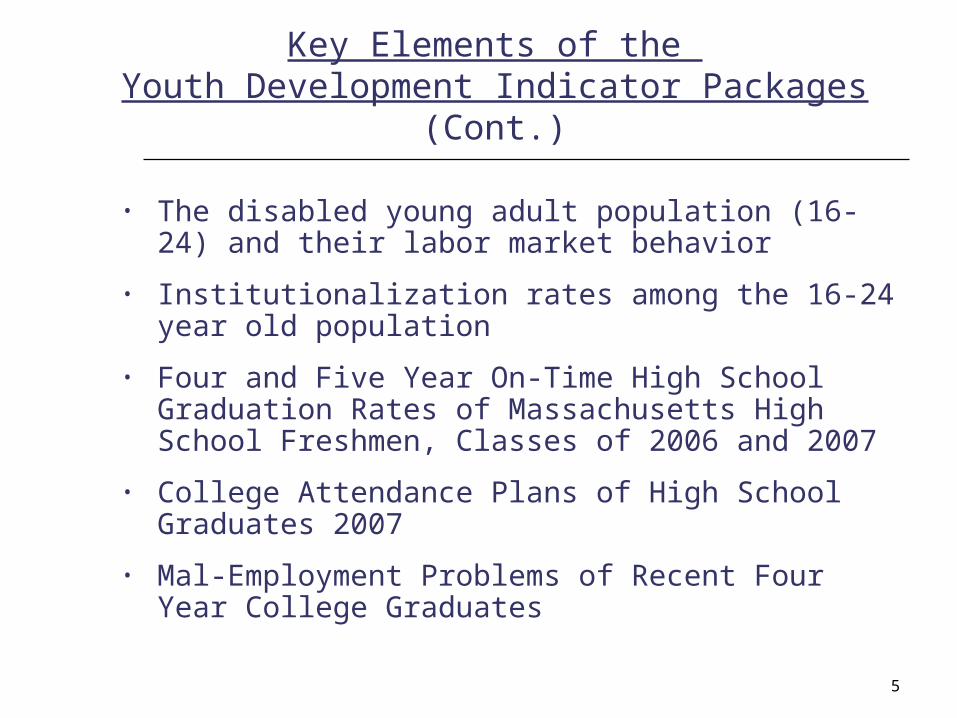
Key Elements of the Youth Development Indicator Packages (Cont.)
• The disabled young adult population (16-24) and their labor market behavior
• Institutionalization rates among the 16-24 year old population
• Four and Five Year On-Time High School Graduation Rates of Massachusetts High School Freshmen, Classes of 2006 and 2007
• College Attendance Plans of High School Graduates 2007
• Mal-Employment Problems of Recent Four Year College Graduates

6
Sources of Data for the Youth Workforce Development Indicators
• 2000 Census of Population and Housing
• 2005-2006-2007 American Community Surveys; 36,000-37,000 households per year; 4,000 residents of group quarters including inmates of institutions
• Current Population Surveys, selected years 1978-79 to 2007-2008
• Massachusetts Vital Statistics, birth data for women 15-24
• Massachusetts Department of Education, 4 and 5 year high school graduation rates, Classes of 2006 and 2007
• Massachusetts Department of Education, annual exit surveys of college / work / military service plans of new high school graduates
7
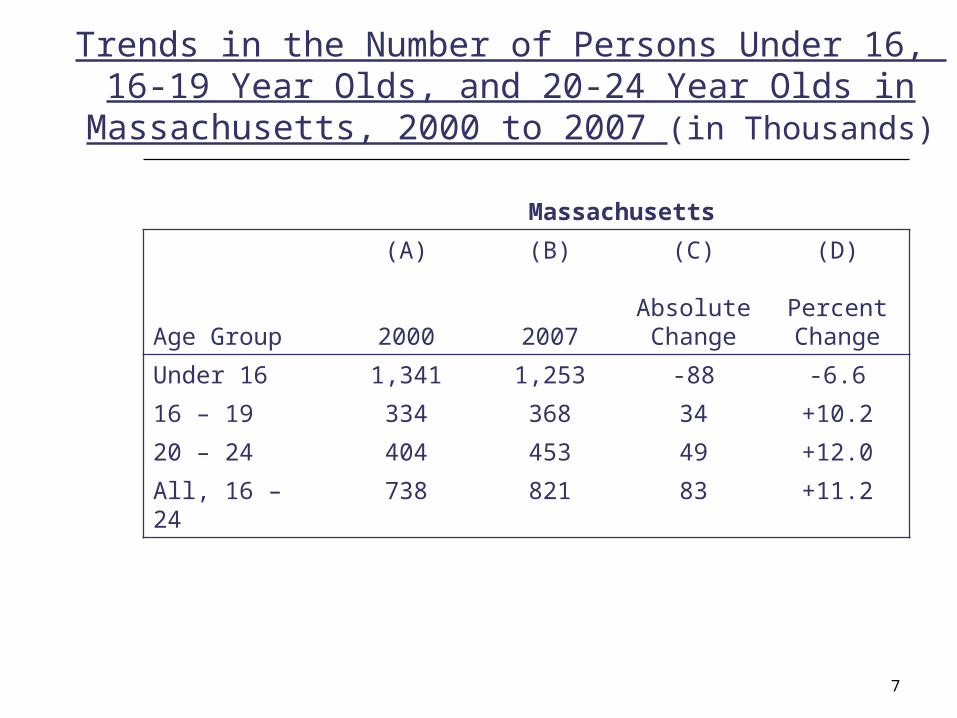
Trends in the Number of Persons Under 16, 16-19 Year Olds, and 20-24 Year Olds in
Massachusetts, 2000 to 2007 (in Thousands)
Massachusetts
Age Group
(A)
2000
(B)
2007
(C)
AbsoluteChange
(D)
PercentChange
Under 16 1,341 1,253 -88 -6.6
16 – 19 334 368 34 +10.2
20 – 24 404 453 49 +12.0
All, 16 – 24 738 821 83 +11.2

8
Trends in the Number of Persons Under 16, 16-19 Year Olds, and 20-24 Year Olds in the U.S.,
2000 to 2007 (in Thousands)
United States
Age Group
(A)
2000
(B)
2007
(C)
AbsoluteChange
(D)
PercentChange
Under 16 64,273 65,153 880 1.4
16 – 19 16,200 17,209 1,009 6.2
20 – 24 18,964 21,032 2,068 10.9
All, 16 – 24 35,164 38,241 3,077 8.8

9
Estimated Changes in the 16-24 Year Old Resident Population of Massachusetts by
Race-Ethnic Group, 2000 to 2006-2007
Group
(A)
2000April
(B)
2006-2007Average
(C)
AbsoluteChange
(D)
PercentChange
All 735,072 818,126 83,054 11.3%
Asian 40,053 45,160 5,107 12.7%
Black, not Hispanic 44,319 58,667 14,348 32.3%
Hispanic 76,168 92,166 15,998 21.0%
Other Races, not Hispanic(1)
30,265 24,072 -6,193 -20.4%
White, not Hispanic 544,267 598,086 53,819 9.9%
10
Percent Change in the Population of 16-24 Year Olds in Massachusetts and the Northeast WIB
Regions By Age and Race-Ethnic Group, 2000-2007
Group(A)MA
(B)Northeast Region
16-19 11.7 7.4
20-21 15.5 24.1
22-24 7.7 9.8
Black 32.4 30.9
Hispanic 21.0 22.4
White 9.9 10.0

11
Projected Changes in the Resident Population of Persons Under 16, 16-19, and
20-24 in Massachusetts, 2008-2015
Age Group
(A)
2008
(B)
2015
(C)
AbsoluteChange
(D)
PercentChange
Under 16 1,310,674 1,303,765 -6,909 -.5%
16 – 19 387,958 348,634 -39,324 -10.1%
20 – 24 449,147 477,596 28,449 6.8%
16 – 24 837,105 826,230 -10,875 -1.3%

12
Recent and Projected Changes in the Size and Demographic Composition of the State’s Teen
(16-19) and 20-24 Year Old Populations
• Population developments in the state from 2000-2008; the double-digit growth of the teen and young adult populations
• The changing race-ethnic composition of the 16-24 year old population
• The projected population outlook for teens and young adults between 2008 and 2015
13
Developments in the Nation’s Teen and Young Adult Labor Markets 2000-2007 and During the
Current Economic Recession
• The civilian labor force participation and employment rates of the nation’s teens and young native born adults (20-24) fell sharply and steeply from 2001 through 2003; their E/P ratios fell more steeply than any other age group by far
• Teen employment was only marginally affected by national job growth from 2003 to 2006 and then began to decline in the fall of 2006 well before the onset of the national recession. The teen E/P ratio fell considerably from the fall of 2007 to the end of 2008; by the end of 2008, only 30% of the nation’s teens were employed, lowest rate in post-World War II history
• Between 2000 and 2008, teen employment rate declines were overwhelming; their E/P rate fell by 15 percentage points from November-December 2000 to November-December 2008

14
Continued
• Teen employment declines were severe in every major demographic and socioeconomic group; young college students affected the least, high school students and high school dropouts the most
• Employment rates of teens in 2008 were lowest among the young (16-17), males, Blacks and Asians, and low income youth
• Among 20-24 year olds, employment rates in 2008 were nearly 5 percentage points below 2000 among all youth, by January 2009, young males were employed at rates 10 to 12 percentage points below those of early 2001; record low employment rates for young 20-24 year old males; high school dropouts and graduates with no college have fared the worst in the labor market
15
Continued
• E/P ratios of young college graduates have remained quite high (the smallest declines) but a very high fraction of them are mal-employed, working at jobs that do not require a college degree
16
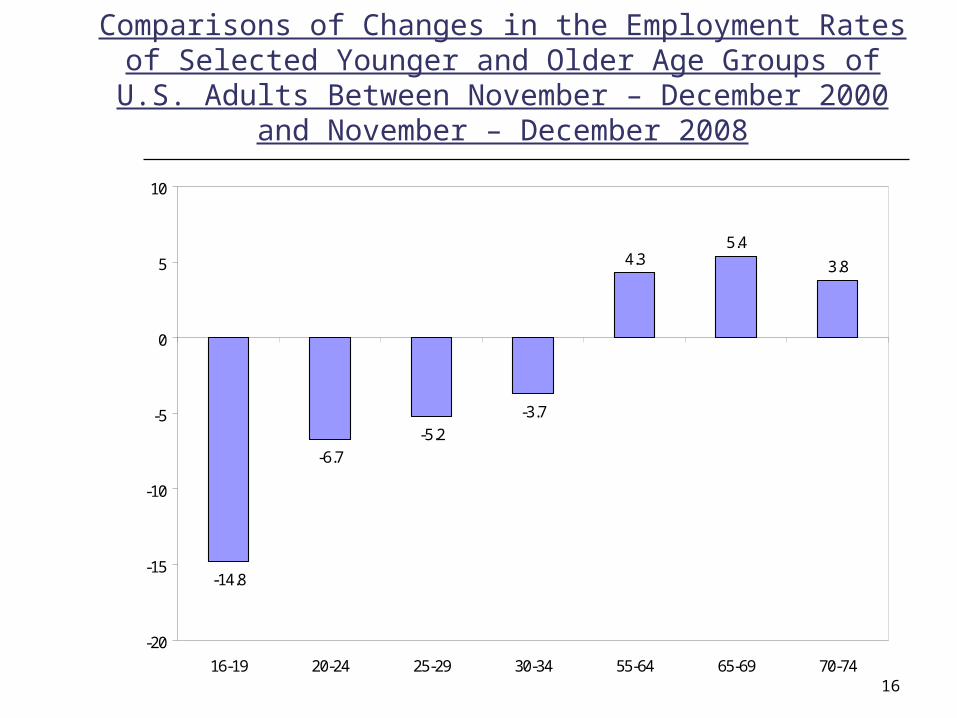
Comparisons of Changes in the Employment Rates of Selected Younger and Older Age Groups of U.S. Adults Between
November – December 2000 and November – December 2008
-14.8
-6.7
-5.2
-3.7
4.35.4
3.8
-20
-15
-10
-5
0
5
10
16-19 20-24 25-29 30-34 55-64 65-69 70-74

17
Changes in Civilian Employment in the U.S. from December 2007 – January 2009 by Major Age Group
(Seasonally Adjusted*)
Age Group
(A)
November2007
(B)
January2009
(C)
Change inEmployed Persons
16+ 146,665 142,099 -4,566
16-24 19,864 18,238 -1,626
25-29(1) 16,224 15,653 -571
55+ 26,201 27,218 +1,017
Note: The seasonally adjusted numbers for 25-29 year olds were generated by the authors by estimating seasonal adjustment factors for November and January.

18
Declines in 16-19 Year Old Teen Employment Rates Between 2000 and 2008 by Gender and Race-Ethnic
(Annual Averages, in %)
Demographic Group
(A)
2000
(B)
2008
(C)
PercentagePoint Change
All 45.5 33.2 -12.3
Men 45.5 32.2 -13.3
Women 45.5 34.1 -11.4
Asian 30.8 21.2 -9.6
Black 30.0 21.5 -8.5
Hispanic 38.7 28.8 -9.9
White 52.0 38.3 -13.7
19
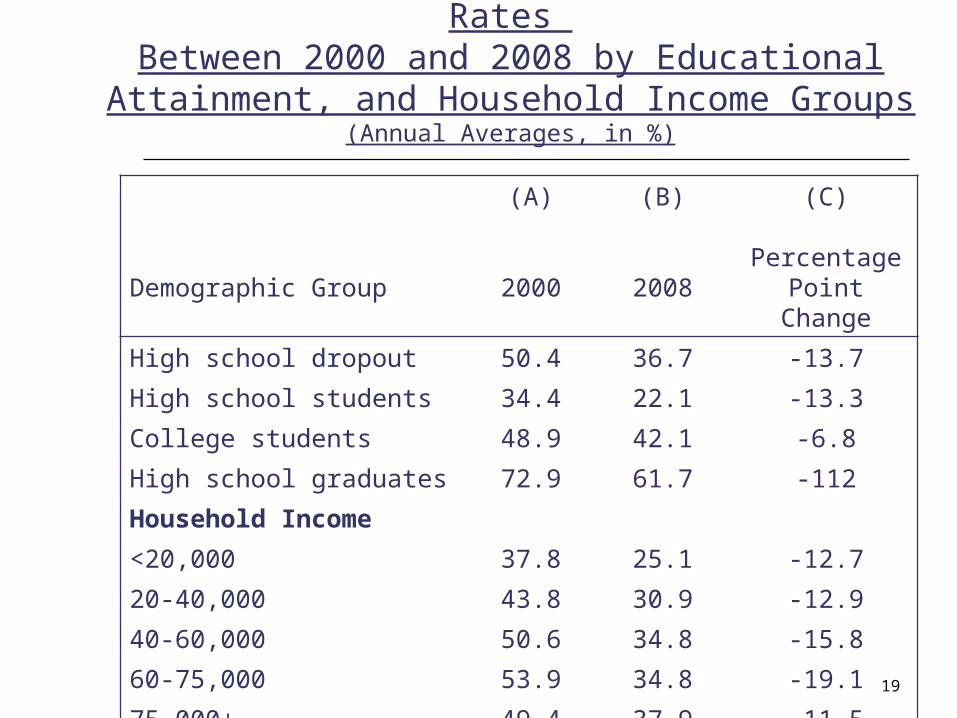
Declines in 16-19 Year Old Teen Employment Rates Between 2000 and 2008 by Educational Attainment, and
Household Income Groups (Annual Averages, in %)
Demographic Group
(A)
2000
(B)
2008
(C)
PercentagePoint Change
High school dropout 50.4 36.7 -13.7
High school students 34.4 22.1 -13.3
College students 48.9 42.1 -6.8
High school graduates 72.9 61.7 -112
Household Income
<20,000 37.8 25.1 -12.7
20-40,000 43.8 30.9 -12.9
40-60,000 50.6 34.8 -15.8
60-75,000 53.9 34.8 -19.1
75,000+ 49.4 37.9 -11.5
20
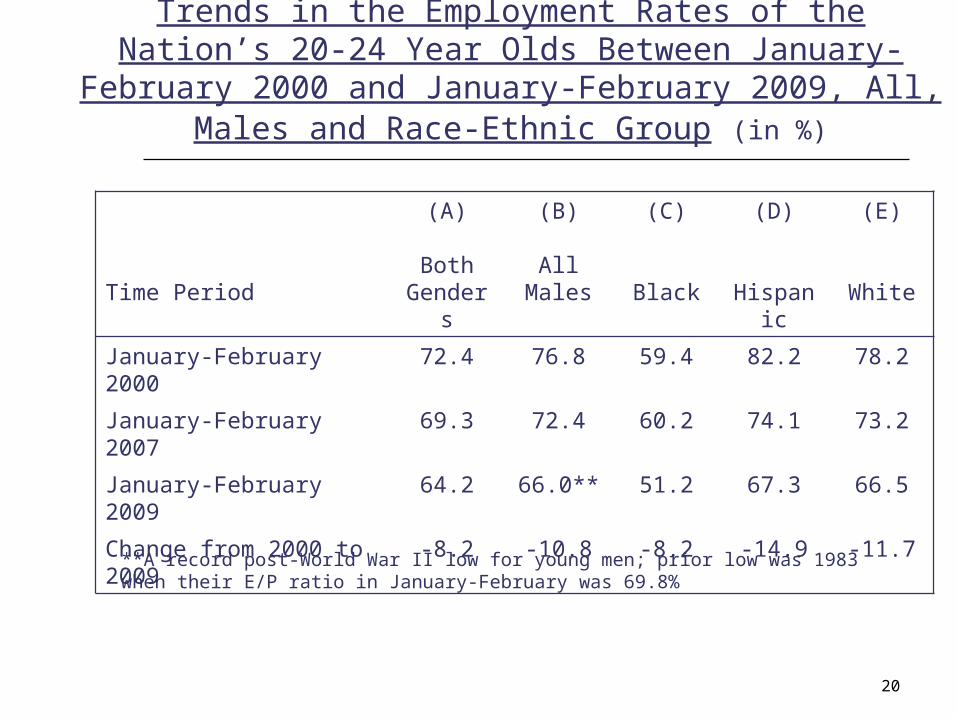
Trends in the Employment Rates of the Nation’s 20-24 Year Olds Between January-February 2000 and January-February
2009, All, Males and Race-Ethnic Group (in %)
Time Period
(A)
BothGenders
(B)
AllMales
(C)
Black
(D)
Hispanic
(E)
White
January-February 2000 72.4 76.8 59.4 82.2 78.2
January-February 2007 69.3 72.4 60.2 74.1 73.2
January-February 2009 64.2 66.0** 51.2 67.3 66.5
Change from 2000 to 2009 -8.2 -10.8 -8.2 -14.9 -11.7
**A record post-World War II low for young men; prior low was 1983 when their E/P ratio in January-February was 69.8%
21
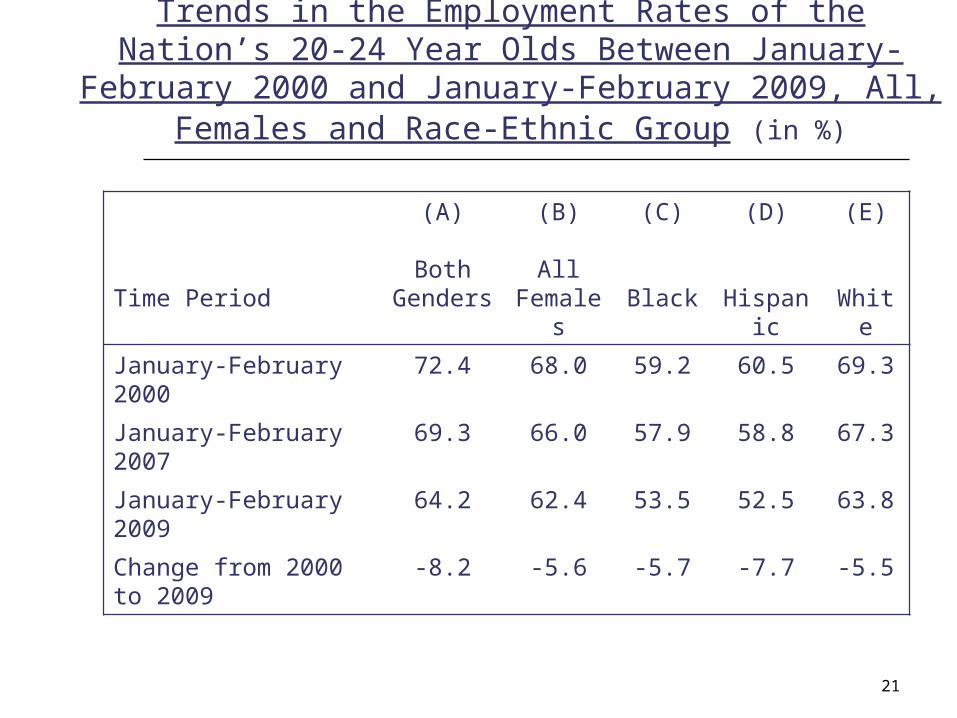
Trends in the Employment Rates of the Nation’s 20-24 Year Olds Between January-February 2000 and January-February
2009, All, Females and Race-Ethnic Group (in %)
Time Period
(A)
BothGenders
(B)
AllFemales
(C)
Black
(D)
Hispanic
(E)
White
January-February 2000 72.4 68.0 59.2 60.5 69.3
January-February 2007 69.3 66.0 57.9 58.8 67.3
January-February 2009 64.2 62.4 53.5 52.5 63.8
Change from 2000 to 2009
-8.2 -5.6 -5.7 -7.7 -5.5
22
Teen Employment Developments in the State of Massachusetts Over the Long Run, 2000-2008, and Recent Years, 2005-2007
• Long-term secular changes in teen employment rates in Massachusetts and the U.S.: the state’s relative decline from more of a national leader in the late 1980s to the middle of the pack (2007-2008)
• Employment rates of Massachusetts teens in 2007-2008 by family income
• Changes in the employment rates of teenaged high school students 1999-2000 to 2007-2008 by gender, race, and family income
• The predicted probabilities of employment among selected subgroups of 16-19 year old high school students in Massachusetts, 2005-2007
23
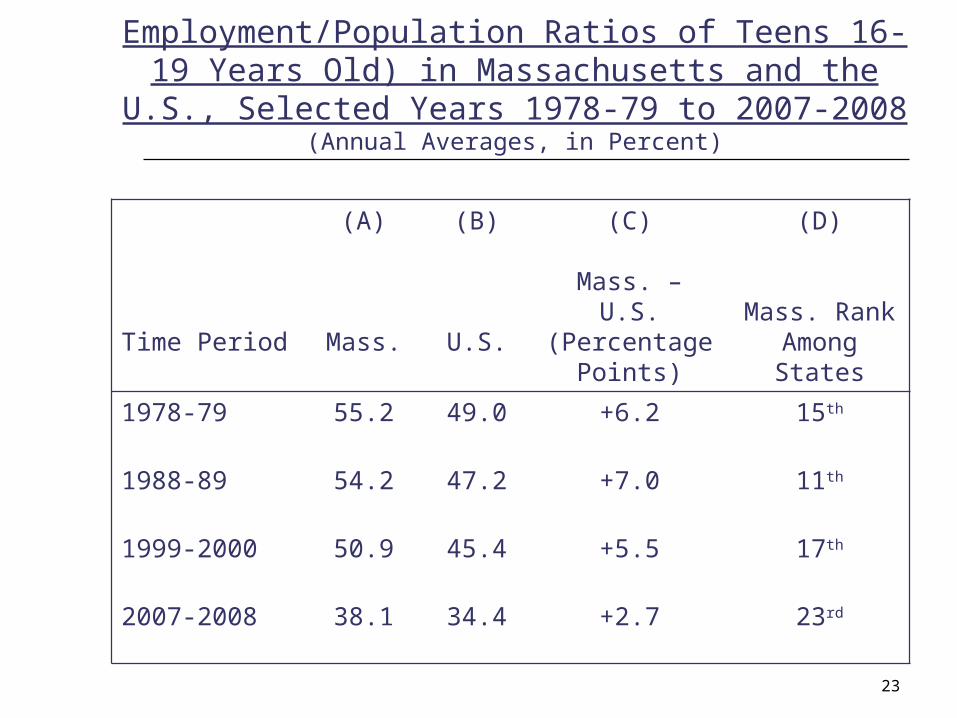
Employment/Population Ratios of Teens 16-19 Years Old) in Massachusetts and the U.S., Selected Years
1978-79 to 2007-2008 (Annual Averages, in Percent)
Time Period
(A)
Mass.
(B)
U.S.
(C)
Mass. – U.S.(Percentage
Points)
(D)
Mass. Rank Among States
1978-79 55.2 49.0 +6.2 15th
1988-89 54.2 47.2 +7.0 11th
1999-2000 50.9 45.4 +5.5 17th
2007-2008 38.1 34.4 +2.7 23rd
24
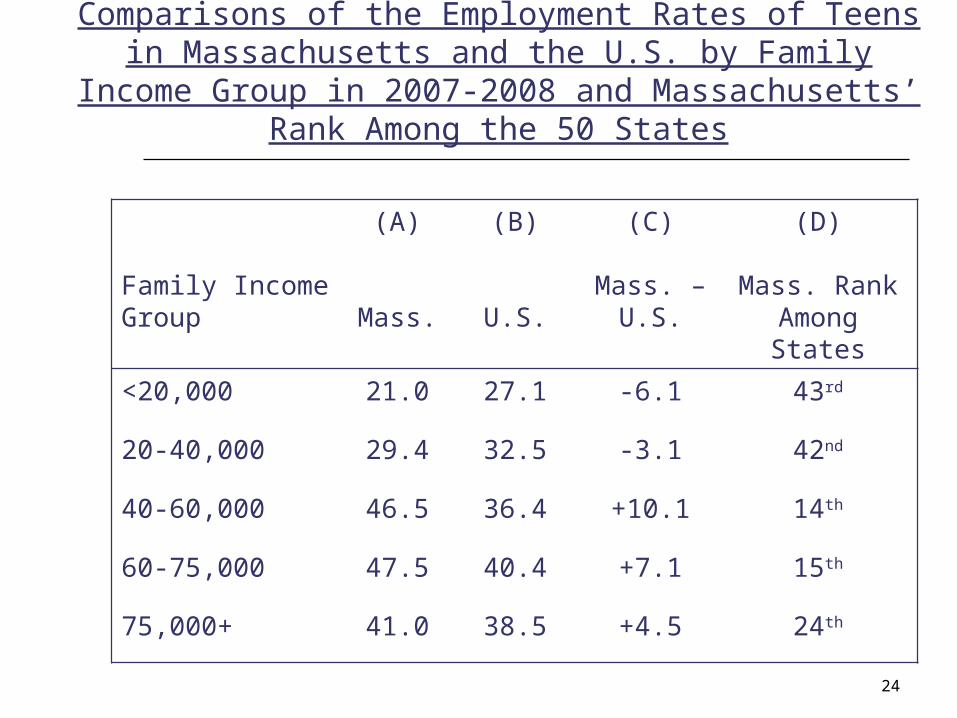
Comparisons of the Employment Rates of Teens in Massachusetts and the U.S. by Family Income Group in
2007-2008 and Massachusetts’ Rank Among the 50 States
Family IncomeGroup
(A)
Mass.
(B)
U.S.
(C)
Mass. –U.S.
(D)
Mass. Rank Among States
<20,000 21.0 27.1 -6.1 43rd
20-40,000 29.4 32.5 -3.1 42nd
40-60,000 46.5 36.4 +10.1 14th
60-75,000 47.5 40.4 +7.1 15th
75,000+ 41.0 38.5 +4.5 24th
25
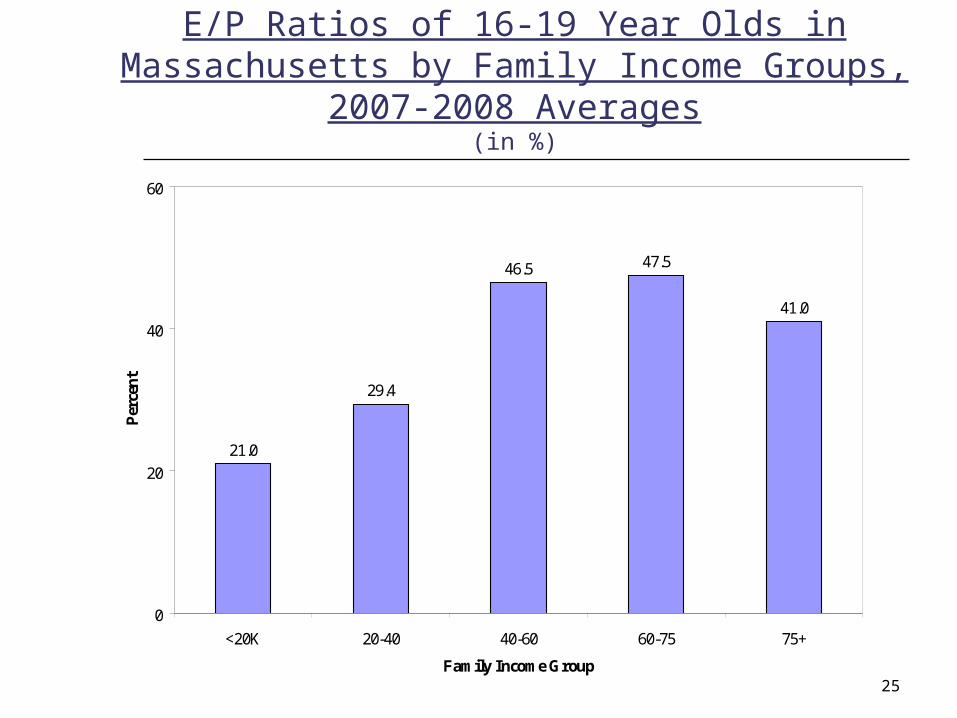
E/P Ratios of 16-19 Year Olds in Massachusetts by Family Income Groups, 2007-2008 Averages
(in %)
21.0
29.4
46.5 47.5
41.0
0
20
40
60
<20K 20-40 40-60 60-75 75+
Family Income Group
Per
cen
t
26
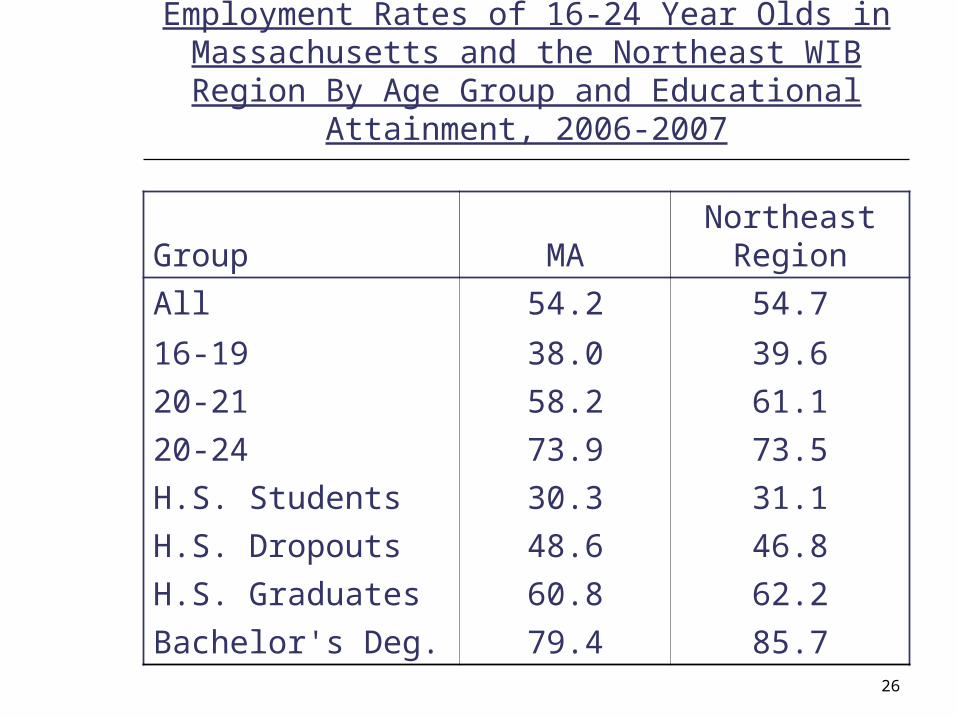
Employment Rates of 16-24 Year Olds in Massachusetts and the Northeast WIB Region By
Age Group and Educational Attainment, 2006-2007
Group MANortheast
Region
All 54.2 54.7
16-19 38.0 39.6
20-21 58.2 61.1
20-24 73.9 73.5
H.S. Students 30.3 31.1
H.S. Dropouts 48.6 46.8
H.S. Graduates 60.8 62.2
Bachelor's Deg. 79.4 85.7

27
Employment Rates of 16-24 Year Olds in Massachusetts and the Northeast WIB Region By
Household Income Group, 2006-2007
Household Income MANortheast
Region
Less than $20,000 39.0 31.6
$20-$40,000 54.6 53.8
$40-$60,000 60.7 58.6
$80-$100,000 63.8 59.6
28
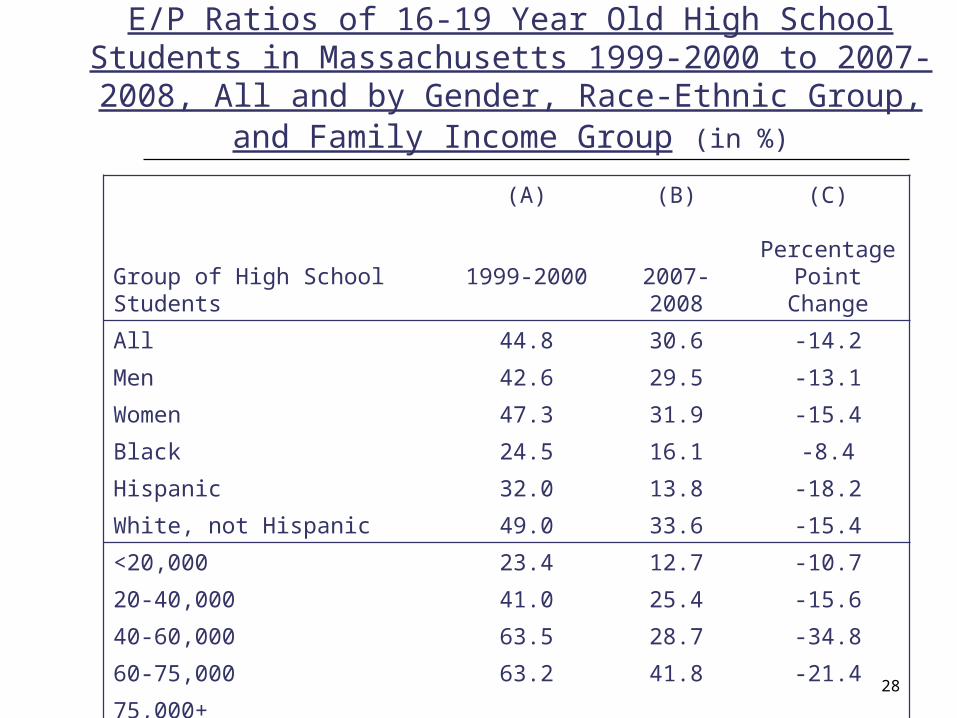
E/P Ratios of 16-19 Year Old High School Students in Massachusetts 1999-2000 to 2007-2008, All and by Gender,
Race-Ethnic Group, and Family Income Group (in %)
Group of High School Students
(A)
1999-2000
(B)
2007-2008
(C)
PercentagePoint Change
All 44.8 30.6 -14.2
Men 42.6 29.5 -13.1
Women 47.3 31.9 -15.4
Black 24.5 16.1 -8.4
Hispanic 32.0 13.8 -18.2
White, not Hispanic 49.0 33.6 -15.4
<20,000 23.4 12.7 -10.7
20-40,000 41.0 25.4 -15.6
40-60,000 63.5 28.7 -34.8
60-75,000 63.2 41.8 -21.4
75,000+
29
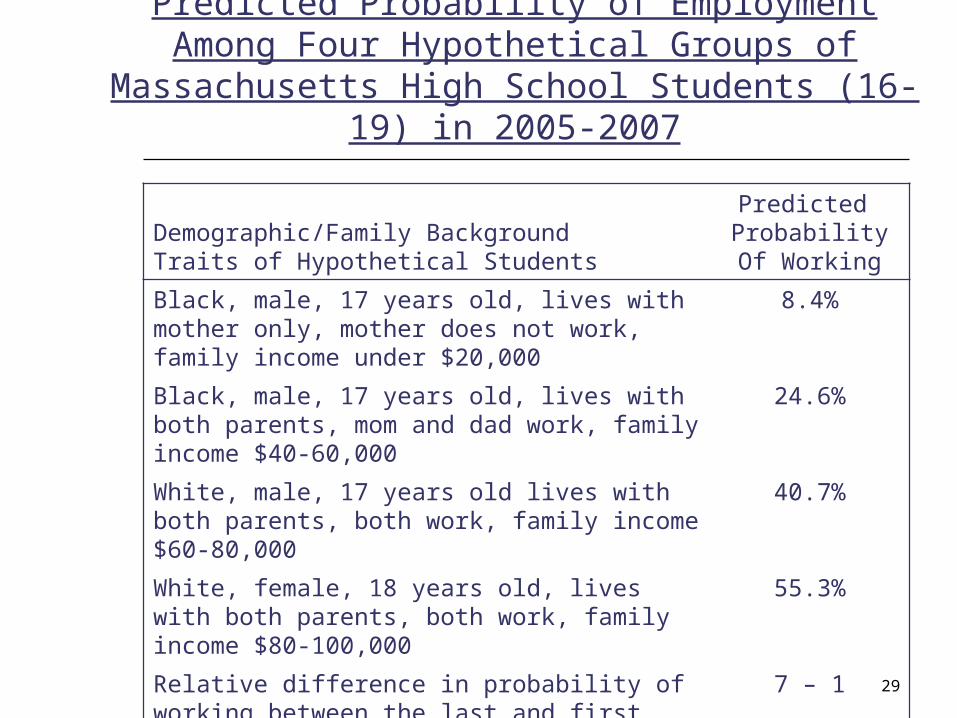
Predicted Probability of Employment Among Four Hypothetical Groups of Massachusetts High School
Students (16-19) in 2005-2007
Demographic/Family Background Traits of Hypothetical Students
Predicted ProbabilityOf Working
Black, male, 17 years old, lives with mother only, mother does not work, family income under $20,000
8.4%
Black, male, 17 years old, lives with both parents, mom and dad work, family income $40-60,000
24.6%
White, male, 17 years old lives with both parents, both work, family income $60-80,000
40.7%
White, female, 18 years old, lives with both parents, both work, family income $80-100,000
55.3%
Relative difference in probability of working between the last and first groups
7 – 1
30
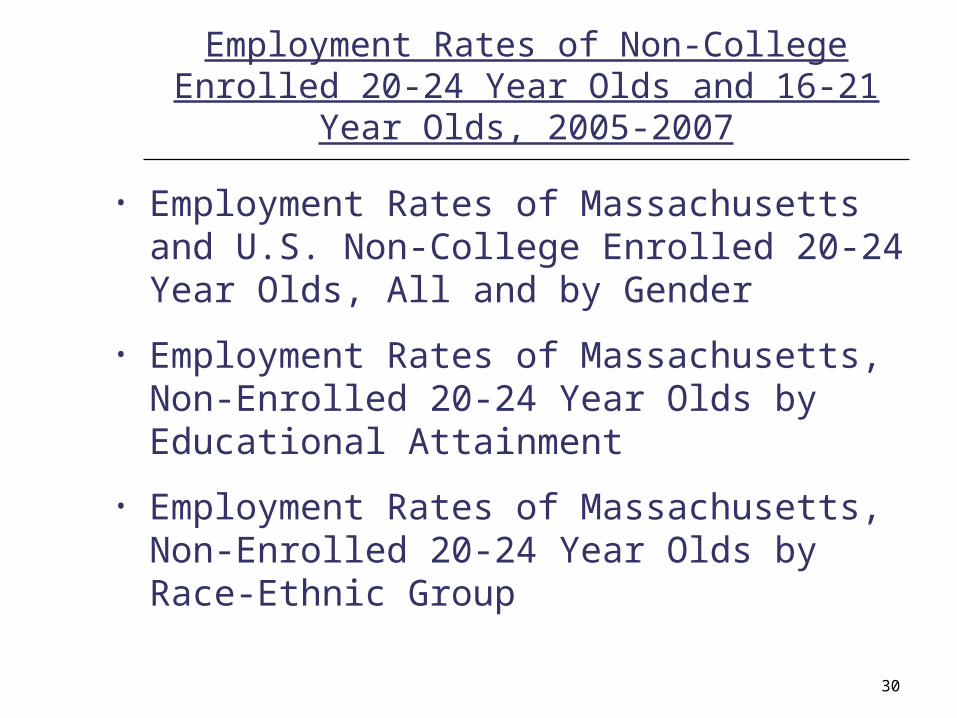
Employment Rates of Non-College Enrolled 20-24 Year Olds and 16-21 Year Olds, 2005-2007
• Employment Rates of Massachusetts and U.S. Non-College Enrolled 20-24 Year Olds, All and by Gender
• Employment Rates of Massachusetts, Non-Enrolled 20-24 Year Olds by Educational Attainment
• Employment Rates of Massachusetts, Non-Enrolled 20-24 Year Olds by Race-Ethnic Group
31
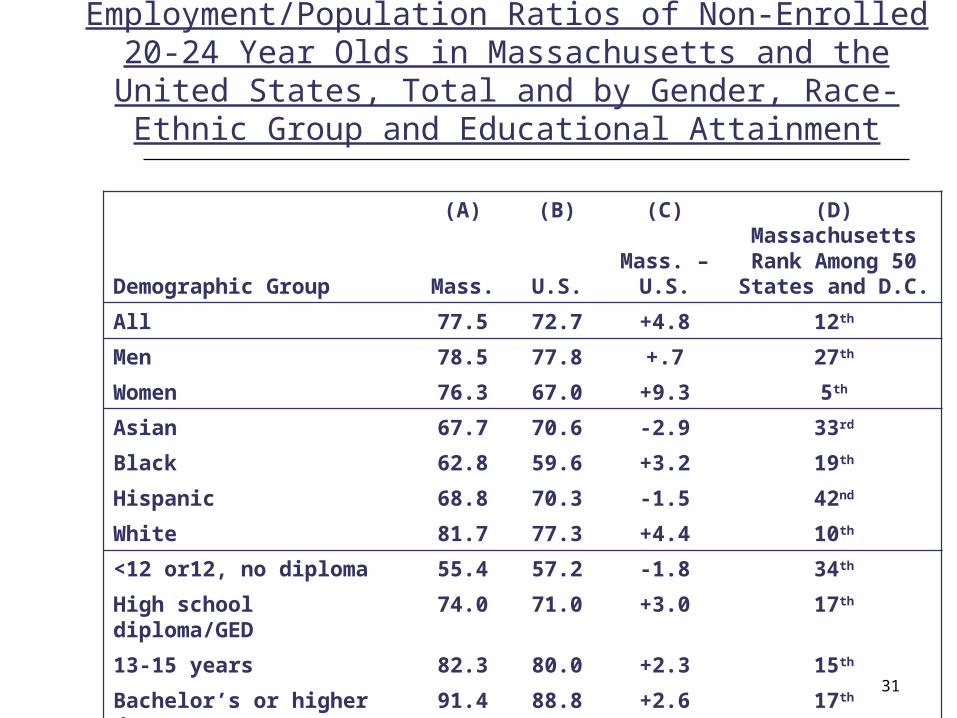
Employment/Population Ratios of Non-Enrolled 20-24 Year Olds in Massachusetts and the United States, Total and by
Gender, Race-Ethnic Group and Educational Attainment
Demographic Group
(A)
Mass.
(B)
U.S.
(C)
Mass. –U.S.
(D)Massachusetts Rank Among 50States and D.C.
All 77.5 72.7 +4.8 12th
Men 78.5 77.8 +.7 27th
Women 76.3 67.0 +9.3 5th
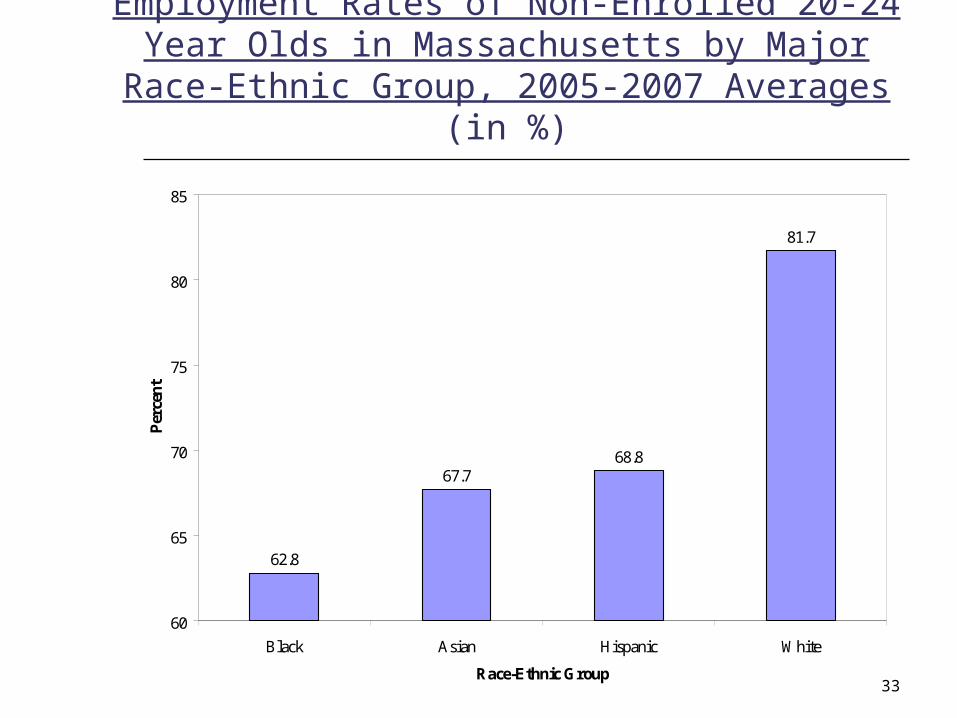
Asian 67.7 70.6 -2.9 33rd
Black 62.8 59.6 +3.2 19th
Hispanic 68.8 70.3 -1.5 42nd
White 81.7 77.3 +4.4 10th
<12 or12, no diploma 55.4 57.2 -1.8 34th
High school diploma/GED 74.0 71.0 +3.0 17th
13-15 years 82.3 80.0 +2.3 15th
Bachelor’s or higher degree 91.4 88.8 +2.6 17th
32
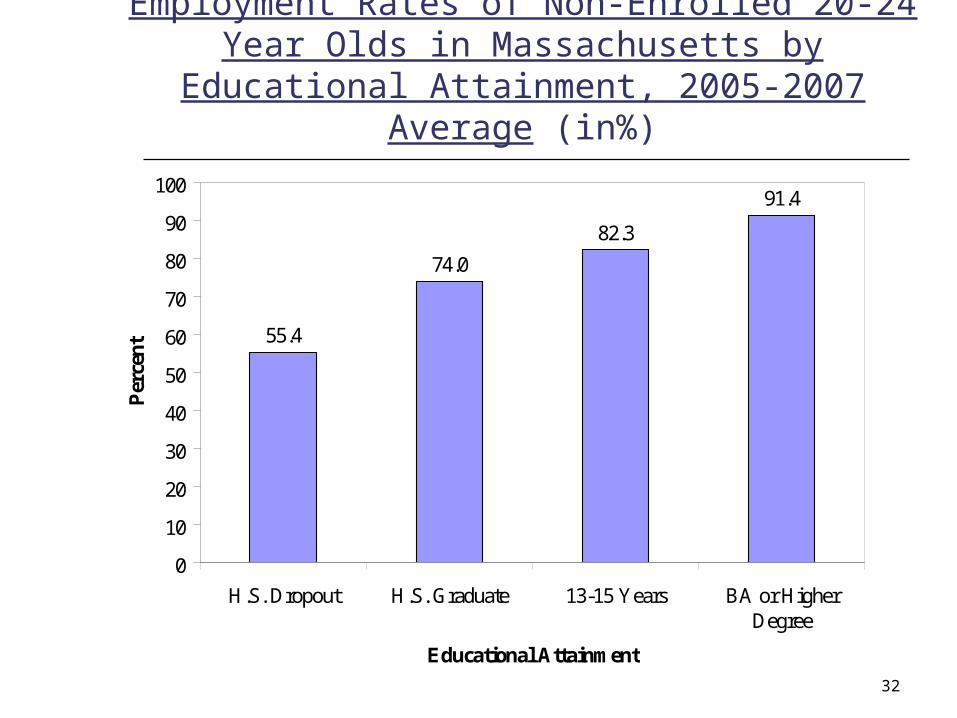
Employment Rates of Non-Enrolled 20-24 Year Olds in Massachusetts by Educational Attainment,
2005-2007 Average (in%)
55.4
74.0
82.3
91.4
0
10
20
30
40
50
60
70
80
90
100
H.S. Dropout H.S. Graduate 13-15 Years BA or HigherDegree
Educational Attainment
Per
cent
33
Employment Rates of Non-Enrolled 20-24 Year Olds in Massachusetts by Major Race-Ethnic Group, 2005-
2007 Averages (in %)
62.8
67.768.8
81.7
60
65
70
75
80
85
Black Asian Hispanic White
Race-Ethnic Group
Per
cen
t
34
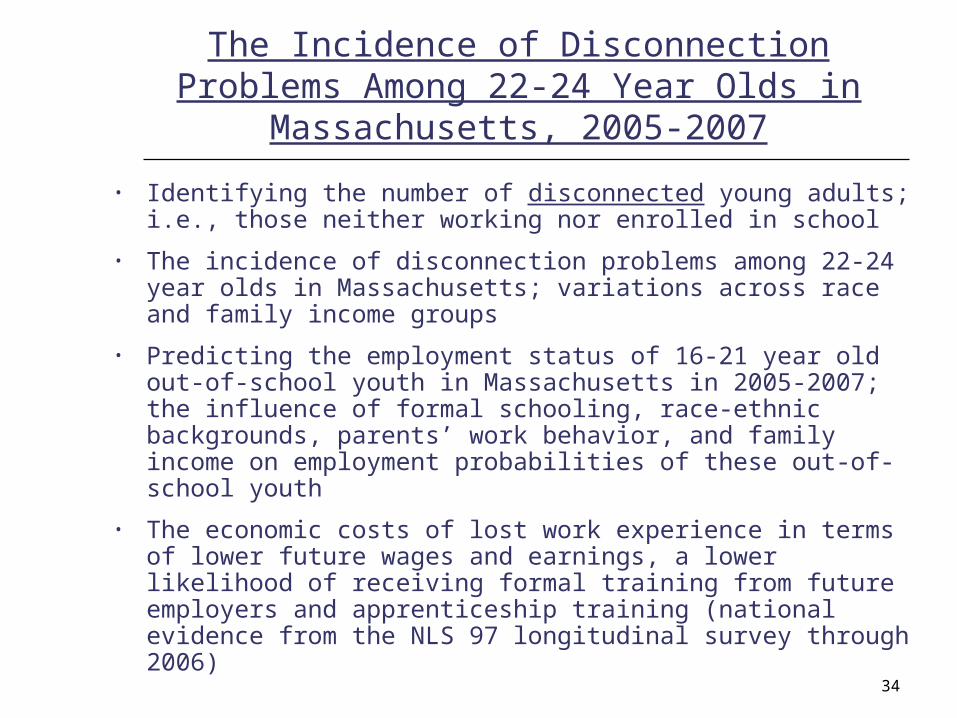
The Incidence of Disconnection Problems Among 22-24 Year Olds in Massachusetts, 2005-2007
• Identifying the number of disconnected young adults; i.e., those neither working nor enrolled in school
• The incidence of disconnection problems among 22-24 year olds in Massachusetts; variations across race and family income groups
• Predicting the employment status of 16-21 year old out-of-school youth in Massachusetts in 2005-2007; the influence of formal schooling, race-ethnic backgrounds, parents’ work behavior, and family income on employment probabilities of these out-of-school youth
• The economic costs of lost work experience in terms of lower future wages and earnings, a lower likelihood of receiving formal training from future employers and apprenticeship training (national evidence from the NLS 97 longitudinal survey through 2006)

35
Percent of the State’s and Nation’s 22-24 Year Olds Who Were Out-of-School and Out-of-Work in 2005-2007,
All and by Gender, Race/Ethnic Group, and Family Income
Group
(A)
Mass.
(B)
U.S.
(C)
Mass. –U.S.
(D)
Mass.Rank Among
50 States
All 12.9 17.1 -4.2 10th lowest
Men 12.1 13.7 -1.6 17th
Women 13.6 20.4 -6.8 4th lowest
Asian 14.0 12.7 +1.3 31st
Black 22.7 25.9 -3.2 17th
Hispanic 22.8 22.1 +.7 26th
White, not Hispanic 10.1 13.7 -3.6 6th
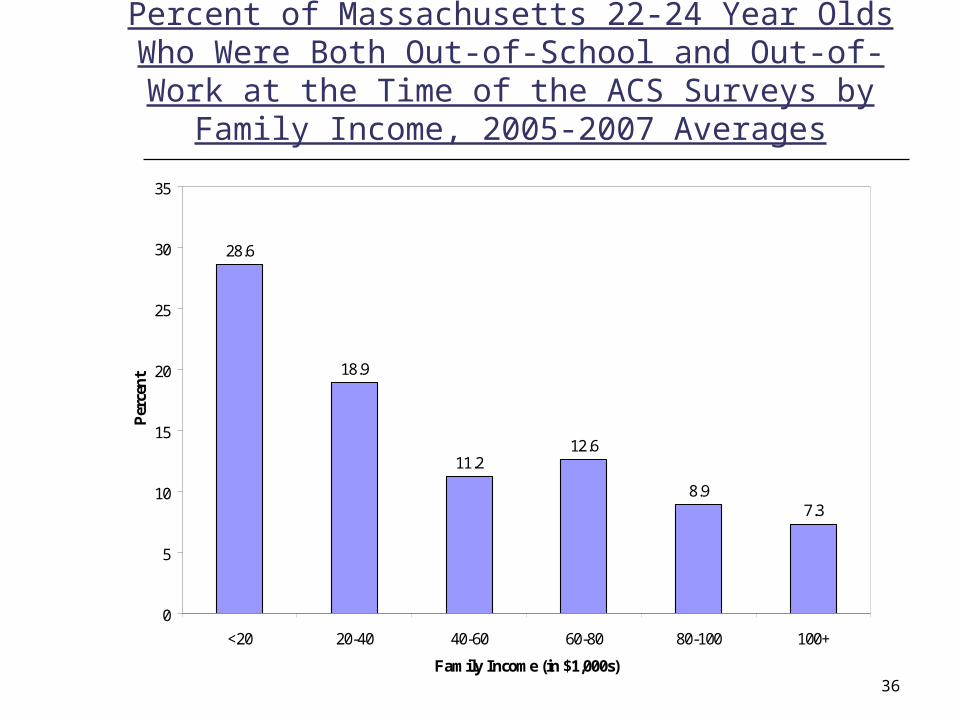
<20,000 28.6 27.3 +1.3 33rd
20-40,000 18.9 20.3 -1.4 26th
40-60,000 11.2 15.5 -4.3 6th
60-80,000 12.6 13.8 -1.2 21st
80-100,000 8.9 12.0 -3.1 6th
100,000+ 7.3 10.0 -2.7 5th
36
Percent of Massachusetts 22-24 Year Olds Who Were Both Out-of-School and Out-of-Work at the Time of the ACS Surveys by Family Income, 2005-2007 Averages
28.6
18.9
11.212.6
8.97.3
0
5
10
15
20
25
30
35
<20 20-40 40-60 60-80 80-100 100+
Family Income (in $1,000s)
Per
cen
t
37
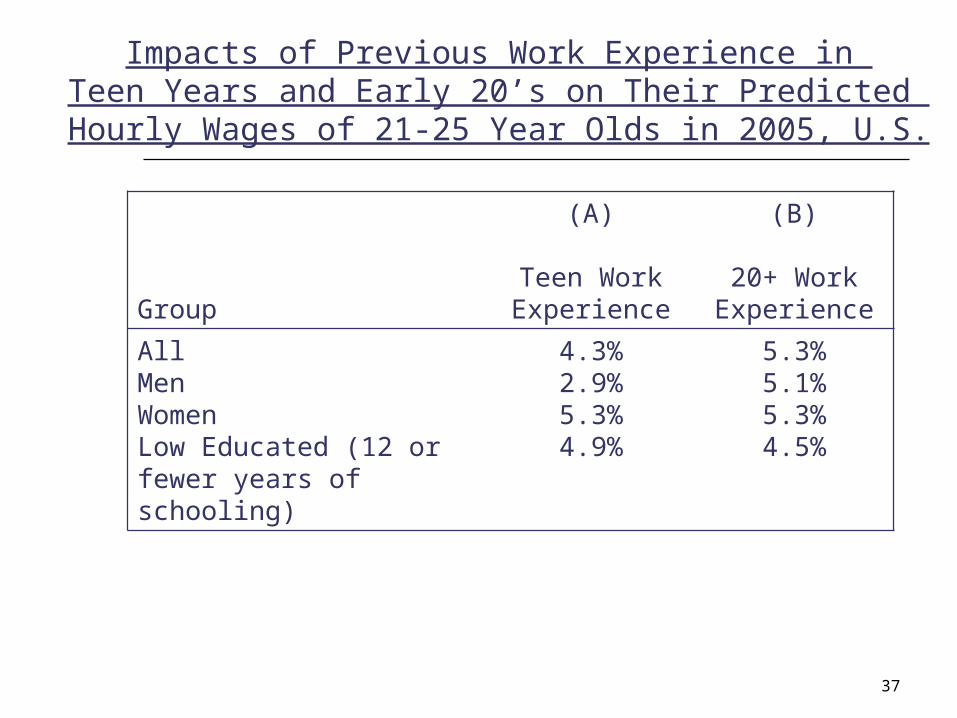
Impacts of Previous Work Experience in Teen Years and Early 20’s on Their Predicted Hourly Wages of 21-25 Year Olds in 2005, U.S.
Group
(A)
Teen Work Experience
(B)
20+ Work Experience
AllMenWomenLow Educated (12 or fewer years of schooling)
4.3%2.9%5.3%4.9%
5.3%5.1%5.3%4.5%
38
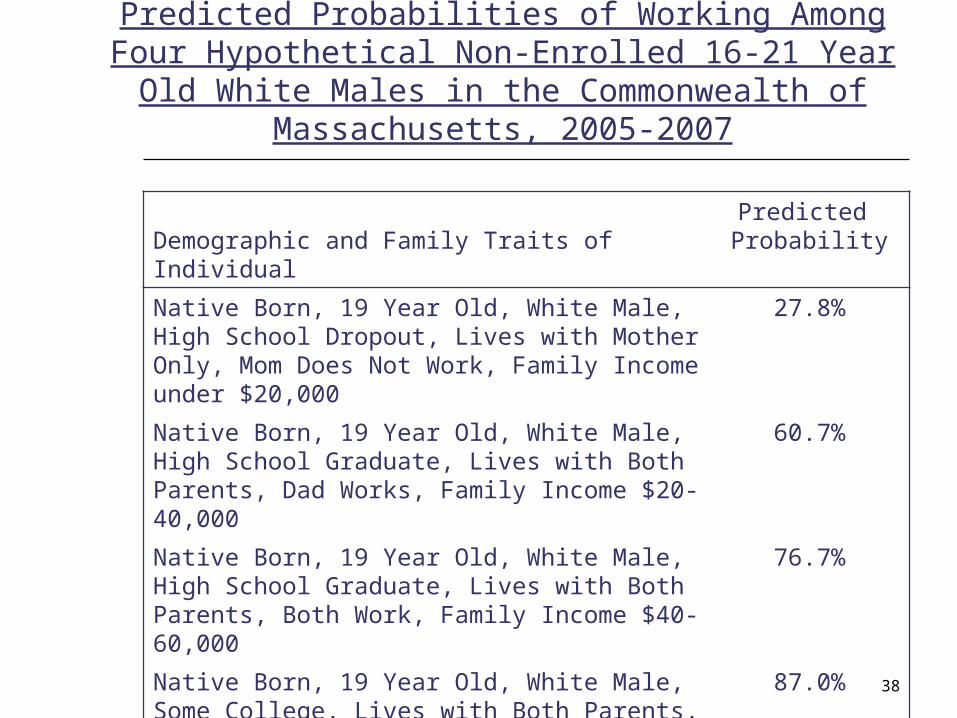
Predicted Probabilities of Working Among Four Hypothetical Non-Enrolled 16-21 Year Old White Males in
the Commonwealth of Massachusetts, 2005-2007
Demographic and Family Traits of IndividualPredicted Probability
Native Born, 19 Year Old, White Male, High School Dropout, Lives with Mother Only, Mom Does Not Work, Family Income under $20,000
27.8%
Native Born, 19 Year Old, White Male, High School Graduate, Lives with Both Parents, Dad Works, Family Income $20-40,000
60.7%
Native Born, 19 Year Old, White Male, High School Graduate, Lives with Both Parents, Both Work, Family Income $40-60,000
76.7%
Native Born, 19 Year Old, White Male, Some College, Lives with Both Parents, Both Work, Family Income $80-100,000
87.0%

39
Impacts of Teen Work Experience, 20+ Work Experience, Apprenticeship Training Spells, and Formal Company Training Spells on Annual Earnings in 2005
(Ln earnings was dependent variable)
(A)
All
(B)
Men
(C)
Women
Teen Work Experience
20+ Work Experience
Apprentice Training
Formal Company Training
Other Training
16%
19%
7%
9%
10%
16%
14%
13%
14%
10%
14%
24%
0
6%
7%
40
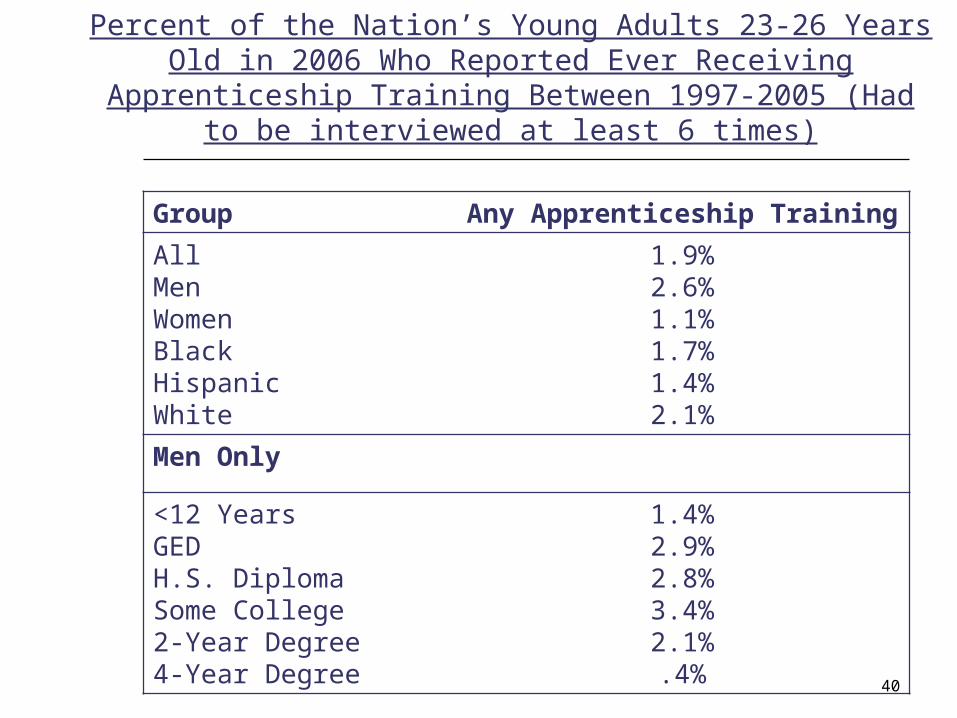
Percent of the Nation’s Young Adults 23-26 Years Old in 2006 Who Reported Ever Receiving Apprenticeship Training Between
1997-2005 (Had to be interviewed at least 6 times)
Group Any Apprenticeship Training
AllMenWomenBlackHispanicWhite
1.9%2.6%1.1%1.7%1.4%2.1%
Men Only
<12 YearsGEDH.S. DiplomaSome College2-Year Degree4-Year Degree
1.4%2.9%2.8%3.4%2.1%.4%
41
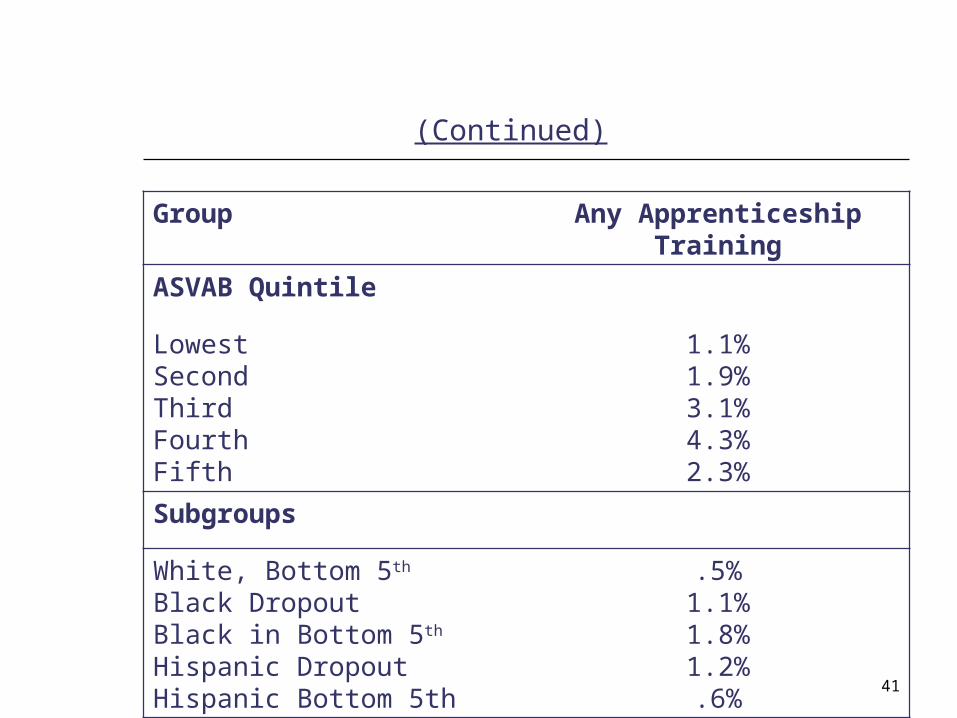
(Continued)
Group Any Apprenticeship Training
ASVAB Quintile
LowestSecondThirdFourth Fifth
1.1%1.9%3.1%4.3%2.3%
Subgroups
White, Bottom 5th
Black DropoutBlack in Bottom 5th
Hispanic DropoutHispanic Bottom 5th
.5%1.1%1.8%1.2%.6%

42
The Economic and Social Consequences of High School Dropouts in the Commonwealth
• Lower rates of employment in all stages of the work life from late teens to mid 60s; reduces cumulative work experience
• Lower annual earnings from ages 22-34 than high school graduates and all other educational groups
• Increased incidence of income inadequacy problems; greater dependence on government cash and in-kind transfers
• Reduced marriage rates over the lifetime
• Higher rates of out-of-wedlock childbearing
• Increased incarceration rates in jails / prisons especially among males and race-ethnic minorities
• Impose large net fiscal burdens on the rest of society
43
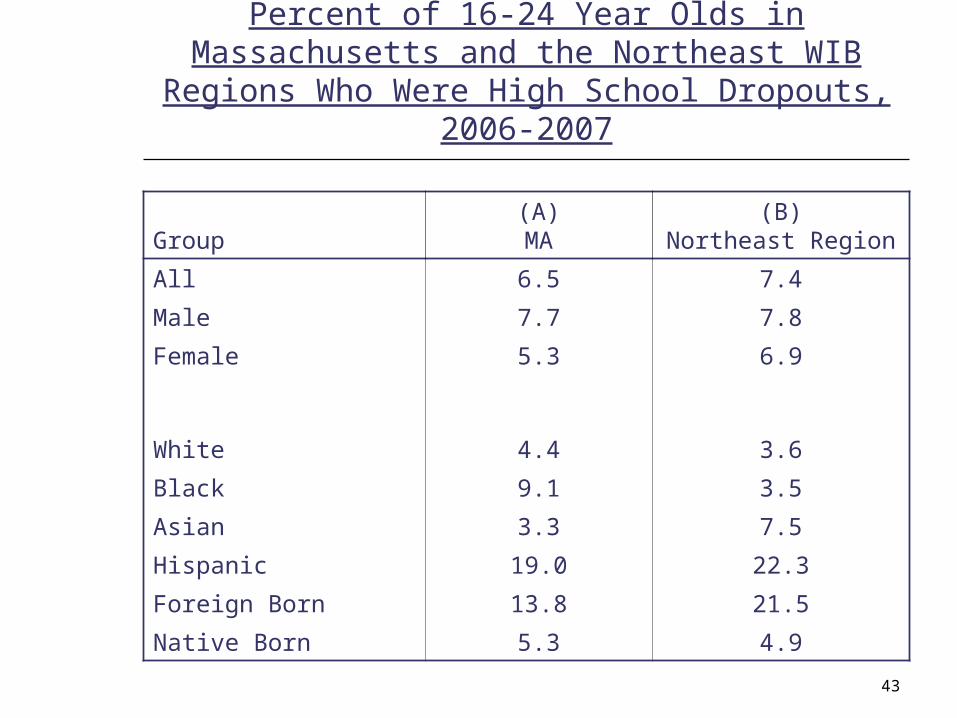
Percent of 16-24 Year Olds in Massachusetts and the Northeast WIB Regions Who Were High School
Dropouts, 2006-2007
Group(A)MA
(B)Northeast Region
All 6.5 7.4
Male 7.7 7.8
Female 5.3 6.9
White 4.4 3.6
Black 9.1 3.5
Asian 3.3 7.5
Hispanic 19.0 22.3
Foreign Born 13.8 21.5
Native Born 5.3 4.9
44
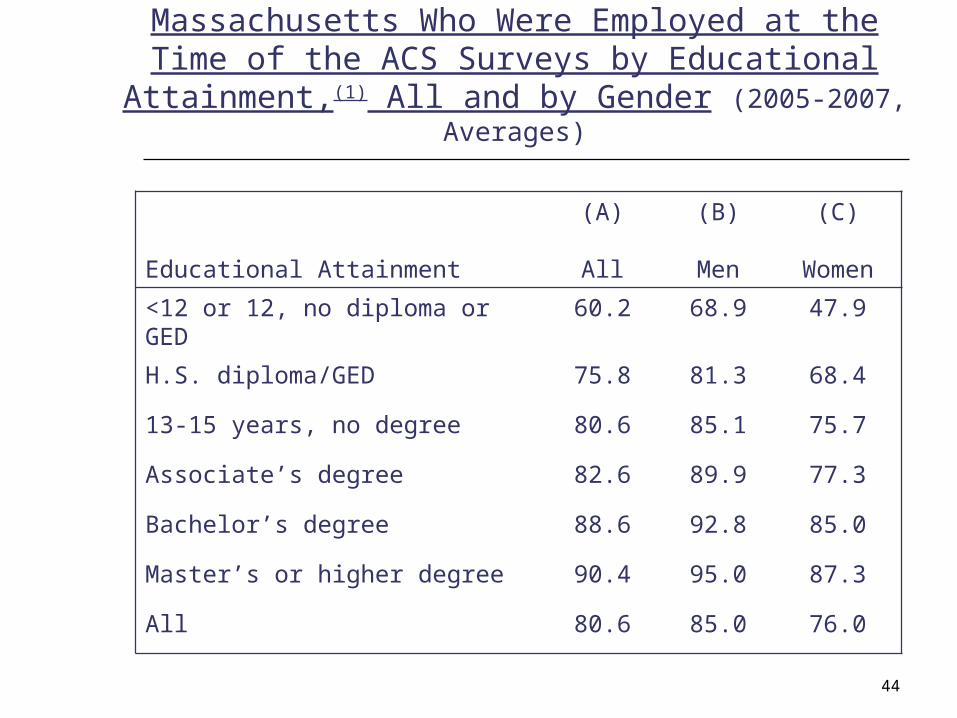
Percent of 22-34 Year Olds in Massachusetts Who Were Employed at the Time of the ACS Surveys by Educational
Attainment,(1) All and by Gender (2005-2007, Averages)
Educational Attainment
(A)
All
(B)
Men
(C)
Women
<12 or 12, no diploma or GED 60.2 68.9 47.9
H.S. diploma/GED 75.8 81.3 68.4
13-15 years, no degree 80.6 85.1 75.7
Associate’s degree 82.6 89.9 77.3
Bachelor’s degree 88.6 92.8 85.0
Master’s or higher degree 90.4 95.0 87.3
All 80.6 85.0 76.0
45
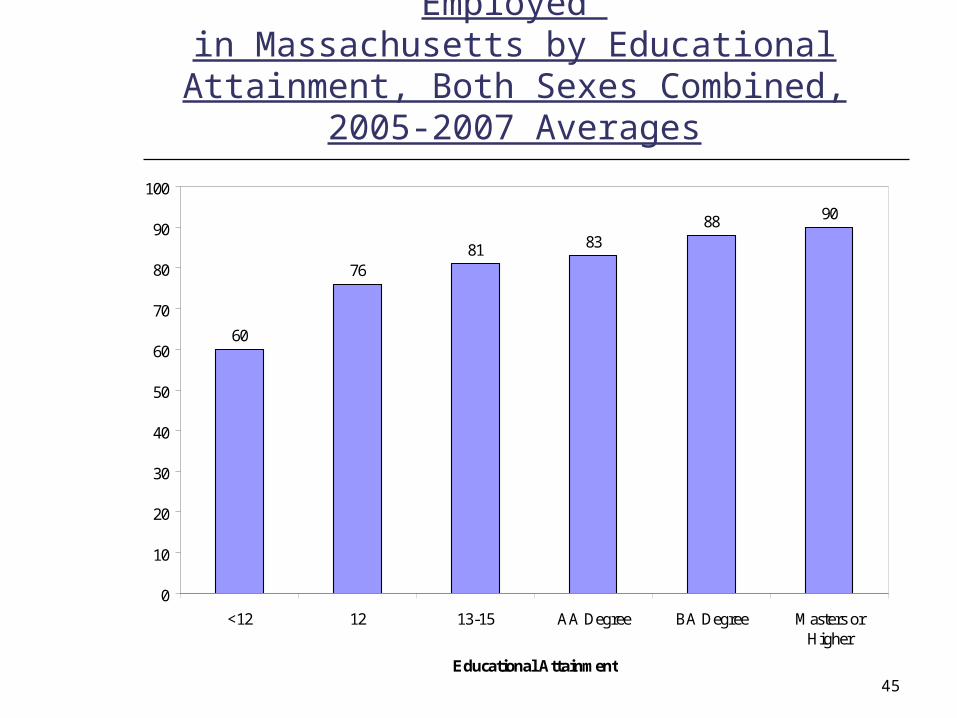
Percent of 22-34 Year Olds Who Were Employed in Massachusetts by Educational Attainment, Both Sexes Combined, 2005-2007 Averages
60
7681 83
88 90
0
10
20
30
40
50
60
70
80
90
100
<12 12 13-15 AA Degree BA Degree Masters orHigher
Educational Attainment

46
Mean Annual Earnings from Employment of 22-34 Year Olds(1) in Massachusetts by Educational
Attainment, All and by Gender 2005-2007 Averages
Educational Attainment
(A)
All
(B)
Men
(C)
Women
<12 or 12, no diploma or GED 15,252 19,022 9,931
H.S. diploma/GED 23,653 29,101 16,208
11-15 years, not degree 27,561 33,458 21,305
Associate’s degree 31,437 38,429 26,301
Bachelor’s degree 44,331 54,336 35,642
Master’s or higher degree 59,602 75,172 49,109
All 33,678 39,539 27,533
47
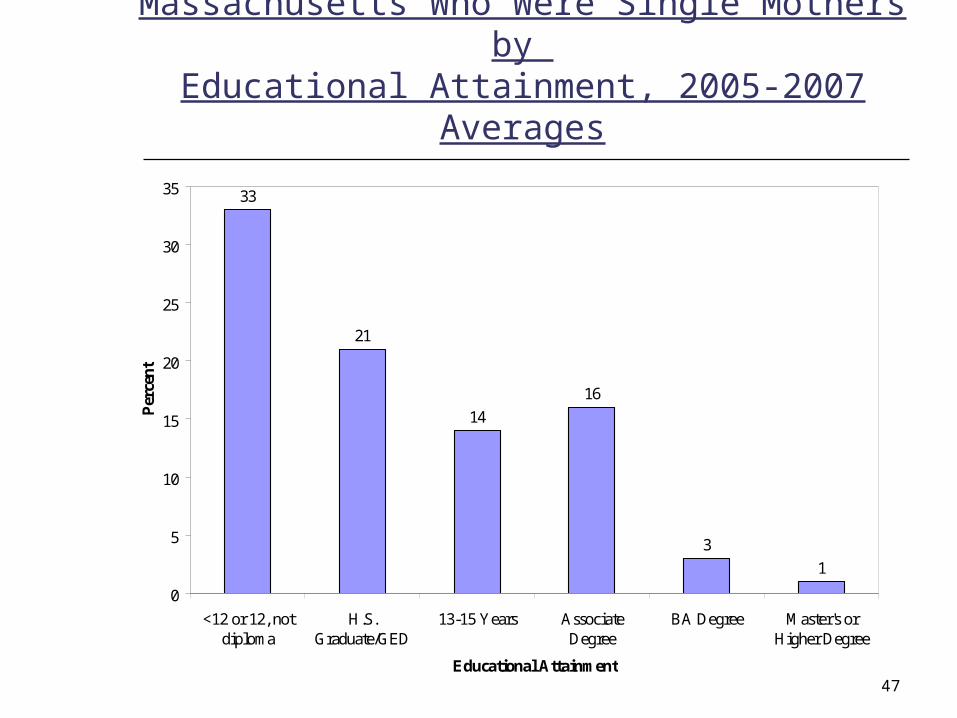
Percent of 22-34 Year Old Women in Massachusetts Who Were Single Mothers by Educational Attainment, 2005-2007 Averages
33
21
14
16
3
1
0
5
10
15
20
25
30
35
<12 or 12, notdiploma
H.S.Graduate/GED
13-15 Years AssociateDegree
BA Degree Master's orHigher Degree
Educational Attainment
Per
cen
t

48
Percent of 22-34 Year Olds in Massachusetts Who Were Poor or Near Poor or Low Income by Educational
Attainment, Both Genders Combined, 2005-2007 Averages
Educational Attainment
(A)
Poor orNear Poor
(B)
LowIncome
<12 or 12, no diploma or GED 30.1 51.4
H.S. diploma or GED 16.5 29.3
13-15 years 12.4 23.6
Associate’s degree 8.0 17.0
Bachelor’s degree 4.8 9.7
Master’s or higher degree 3.2 5.8
All 12.0 21.8
49
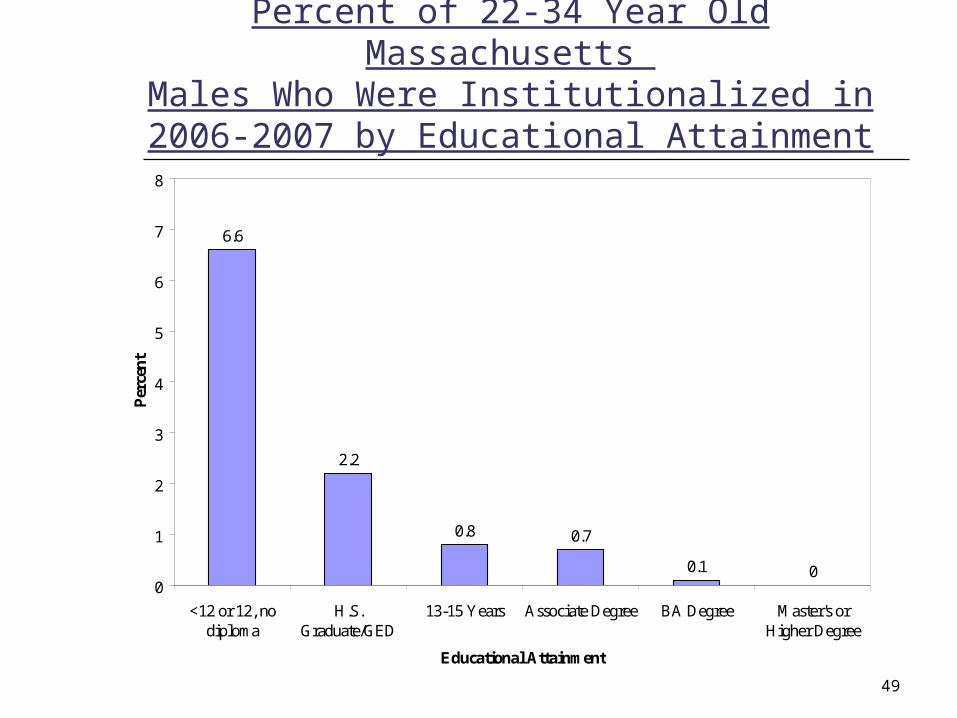
Percent of 22-34 Year Old Massachusetts Males Who Were Institutionalized in 2006-2007 by
Educational Attainment
6.6
2.2
0.8 0.7
0.1 00
1
2
3
4
5
6
7
8
<12 or 12, nodiploma
H.S.Graduate/GED
13-15 Years Associate Degree BA Degree Master's orHigher Degree
Educational Attainment
Per
cen
t

50
Identifying Other Key Target Groups for Youth Educational and Workforce Development Programs
• The young ex-offender population; human capital deficits of ex-offenders (limited schooling, literacy/numeracy, work experience)
• Young single mothers; their educational barriers and income inadequacy problems; high geographic concentration of teen mothers in the Commonwealth
• The disabled youth population; identifying the pool of disabled youth and their labor market problems at the state and local WIB level; there are substantially below average labor force participation rates and high unemployment of youth with work-related disabilities

51
Labor Force Activity Rates of 16-24 Year Old in Massachusetts by Work Disability Status,
2005-2006-2007 Averages
GroupLabor Force
Participation RateEmployment-
Population Ratio Unemployment RateWork
DisabledNot
DisabledWork
DisabledNot
DisabledWork
DisabledNot
Disabled
All (16-24) 32.0% 63.6% 21.6% 55.2% 32.3% 13.2%
Male 35.6% 63.3% 22.6% 53.5% 36.4% 15.4%
Female 27.2% 64.0% 20.3% 57.0% 25.3% 11.0%
White 31.9% 65.2% 22.9% 57.9% 28.3% 11.2%
Black 33.4% 58.7% 19.3% 45.1% 42.3% 23.2%
Asian 27.6% 47.5% 24.3% 40.1% 11.9% 15.7%
Hispanic 30.3% 63.6% 16.1% 51.4% 46.9% 19.2%
Other 36.8% 68.1% 23.9% 56.6% 35.0% 16.9%
16-19 26.0% 48.2% 16.7% 38.6% 35.9% 19.8%
20-21 37.1% 68.3% 19.4% 59.6% 47.6% 12.8%
22-24 35.1% 82.0% 29.5% 75.3% 15.9% 8.1%
HS Students 22.5% 40.8% 16.9% 30.7% 25.0% 24.8%
HS Dropouts 26.6% 70.9% 15.2% 52.4% 42.9% 26.1%
HS Graduates(1) 37.3% 71.2% 24.2% 62.3% 35.1% 12.5%
Some College(1) 43.2% 66.3% 32.1% 60.4% 25.8% 9.0%
B.A. or Higher(1) 46.6% 84.6% 36.0% 79.5% 22.8% 6.1%
52
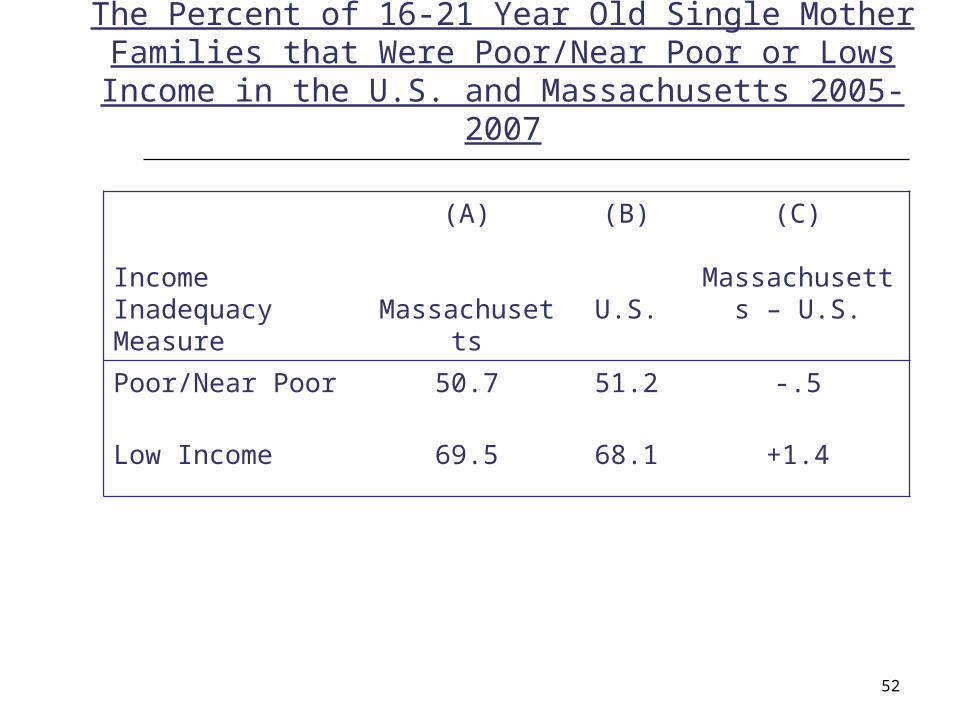
The Percent of 16-21 Year Old Single Mother Families that Were Poor/Near Poor or Lows Income in the U.S. and
Massachusetts 2005-2007
Income Inadequacy Measure
(A)
Massachusetts
(B)
U.S.
(C)
Massachusetts – U.S.
Poor/Near Poor 50.7 51.2 -.5
Low Income 69.5 68.1 +1.4
53
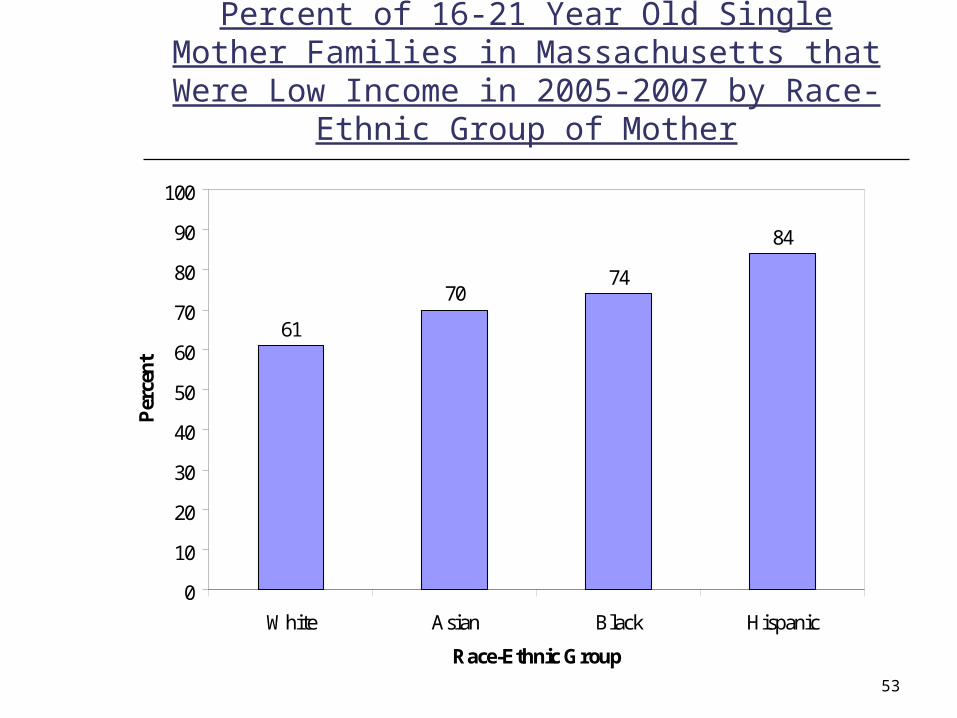
Percent of 16-21 Year Old Single Mother Families in Massachusetts that Were Low Income in 2005-2007
by Race-Ethnic Group of Mother
61
7074
84
0
10
20
30
40
50
60
70
80
90
100
White Asian Black Hispanic
Race-Ethnic Group
Per
cent
54
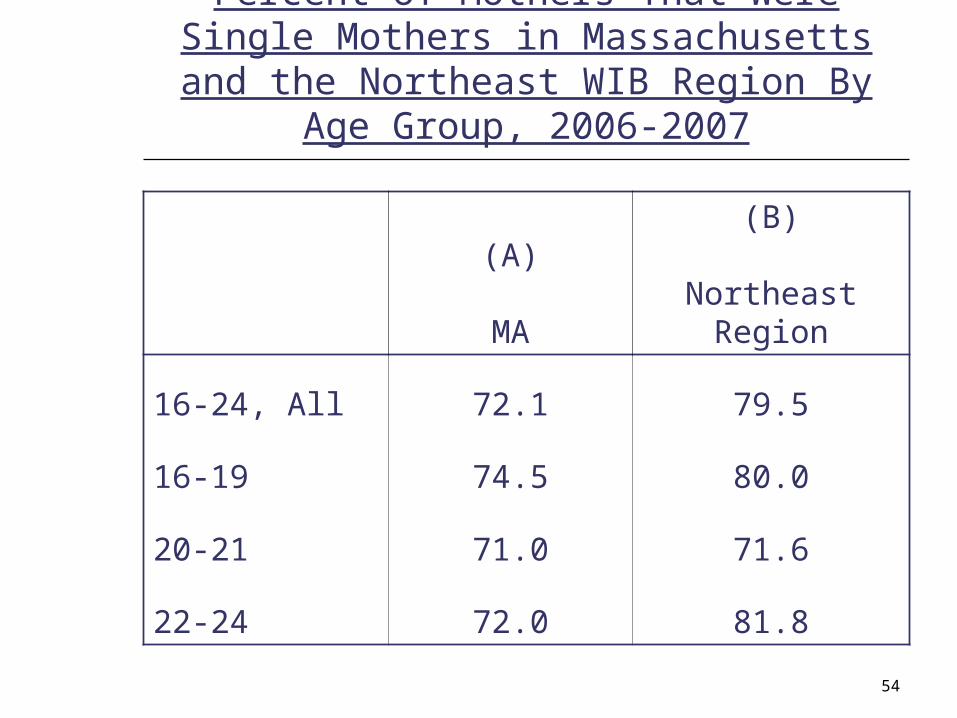
Percent of Mothers That Were Single Mothers in Massachusetts and the Northeast
WIB Region By Age Group, 2006-2007
(A)
MA
(B)
Northeast Region
16-24, All 72.1 79.5
16-19 74.5 80.0
20-21 71.0 71.6
22-24 72.0 81.8
55
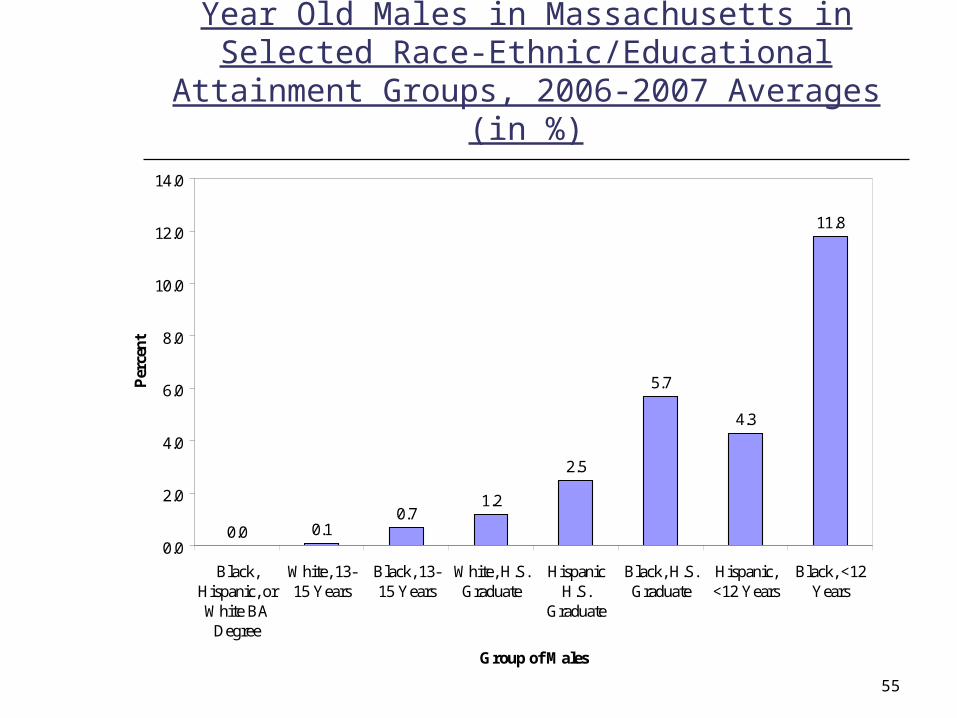
Institutionalization Rates of 16-24 Year Old Males in Massachusetts in Selected Race-Ethnic/Educational
Attainment Groups, 2006-2007 Averages (in %)
0.0 0.10.7
1.2
2.5
5.7
4.3
11.8
0.0
2.0
4.0
6.0
8.0
10.0
12.0
14.0
Black,Hispanic, orWhite BA
Degree
White, 13-15 Years
Black, 13-15 Years
White, H.S.Graduate
HispanicH.S.
Graduate
Black, H.S.Graduate
Hispanic,<12 Years
Black, <12Years
Group of Males
Per
cen
t
56
The 4-Year and 5-Year High School Graduation Rate Performance of Massachusetts and Northeast
Massachusetts Public Schools, Class of 2007 Cohort
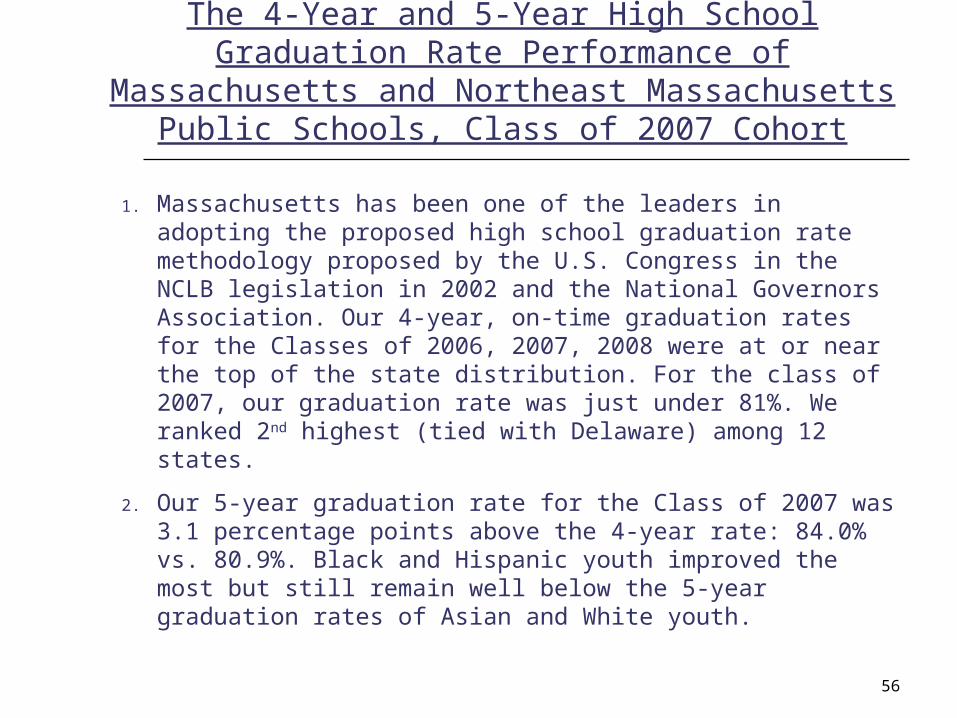
1. Massachusetts has been one of the leaders in adopting the proposed high school graduation rate methodology proposed by the U.S. Congress in the NCLB legislation in 2002 and the National Governors Association. Our 4-year, on-time graduation rates for the Classes of 2006, 2007, 2008 were at or near the top of the state distribution. For the class of 2007, our graduation rate was just under 81%. We ranked 2nd highest (tied with Delaware) among 12 states.
2. Our 5-year graduation rate for the Class of 2007 was 3.1 percentage points above the 4-year rate: 84.0% vs. 80.9%. Black and Hispanic youth improved the most but still remain well below the 5-year graduation rates of Asian and White youth.
57
(Continued
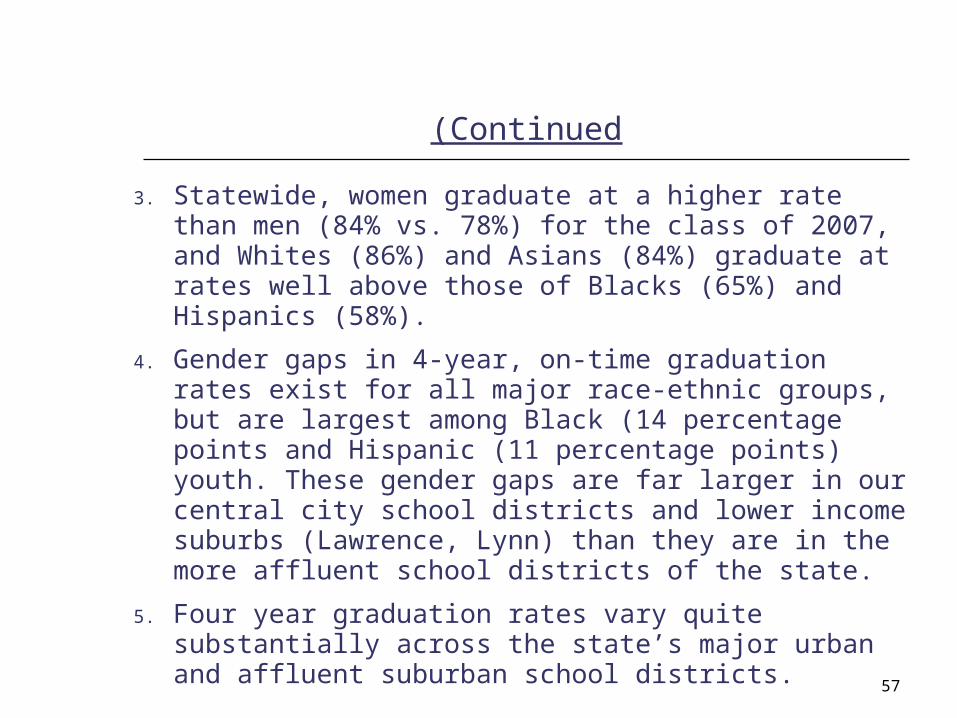
3. Statewide, women graduate at a higher rate than men (84% vs. 78%) for the class of 2007, and Whites (86%) and Asians (84%) graduate at rates well above those of Blacks (65%) and Hispanics (58%).
4. Gender gaps in 4-year, on-time graduation rates exist for all major race-ethnic groups, but are largest among Black (14 percentage points and Hispanic (11 percentage points) youth. These gender gaps are far larger in our central city school districts and lower income suburbs (Lawrence, Lynn) than they are in the more affluent school districts of the state.
5. Four year graduation rates vary quite substantially across the state’s major urban and affluent suburban school districts.

58
4-Year and 5-Year Graduation Rates for All Students and Student Subgroups in Massachusetts,
Class of 2007 Cohort
(A)
4-Year Rate
(B)
5-Year Rate
All StudentsFemale
MaleAsianBlack
HispanicWhite
Limited English ProficiencySpecial Education
Low Income
80.984.177.883.765.258.586.453.362.865.2
84.086.581.587.771.264.488.560.865.570.7
59
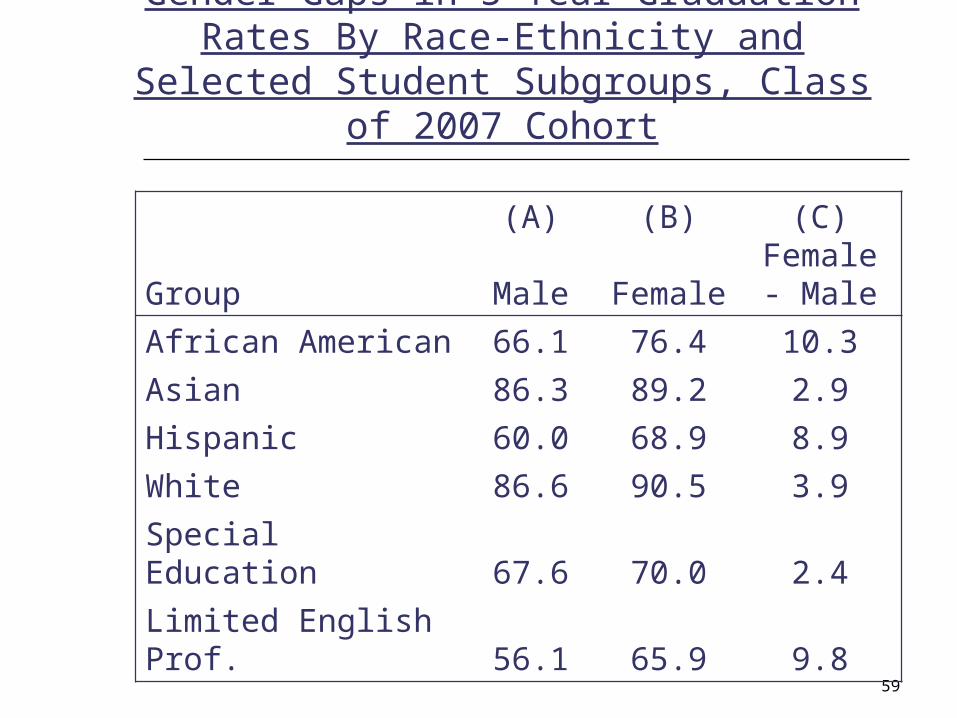
Gender Gaps in 5-Year Graduation Rates By Race-Ethnicity and Selected Student
Subgroups, Class of 2007 Cohort
Group
(A)
Male
(B)
Female
(C)Female -
Male
African American 66.1 76.4 10.3
Asian 86.3 89.2 2.9
Hispanic 60.0 68.9 8.9
White 86.6 90.5 3.9
Special Education 67.6 70.0 2.4
Limited English Prof. 56.1 65.9 9.8
60
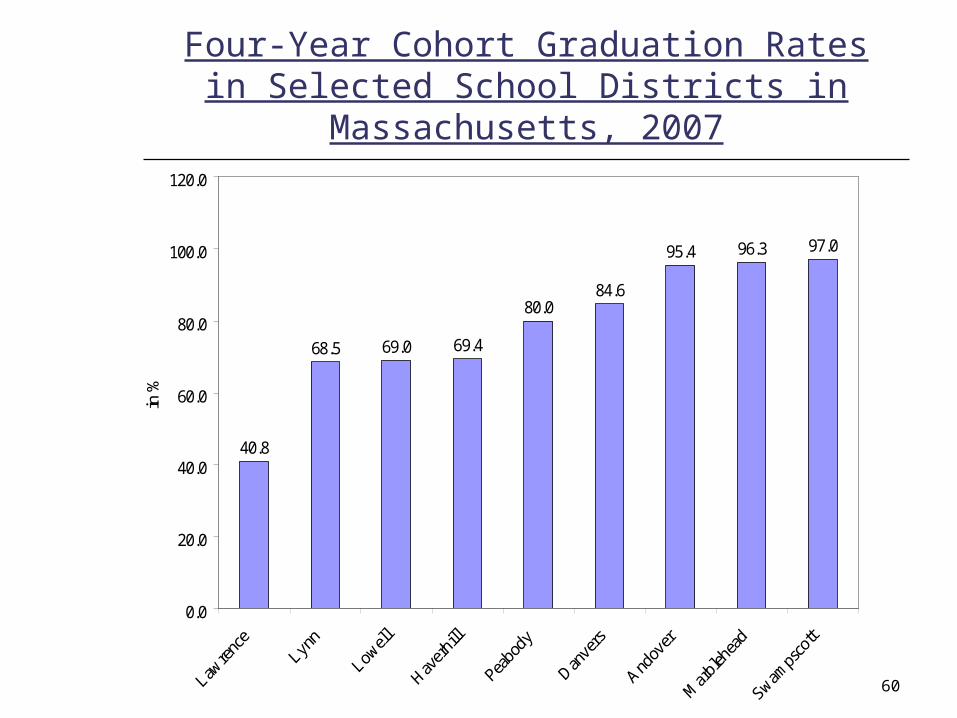
Four-Year Cohort Graduation Rates in Selected School Districts in Massachusetts, 2007
40.8
68.5 69.0 69.4
80.084.6
95.4 96.3 97.0
0.0
20.0
40.0
60.0
80.0
100.0
120.0
in %

61
The Early Transition to College; College Retention and Graduation Rates in Massachusetts
There is some good news and some bad news on each of these educational fronts
Overall, Massachusetts appears to perform quite well in transitioning high school graduates into college in the fall immediately following graduation from high school.
Statewide, 79 percent of public school graduates from the Class of 2007 planned to attend a 2 or 4 year college in the fall following graduation versus 67% of their peers across the country.
Planned attendance in college in Massachusetts varied across gender, race-ethnic groups, and especially geographic areas; Massachusetts graduates outperformed their counterparts in each gender group and among Blacks and Whites

62
(Continued)
Planned 2 and 4 year college enrollment rates of 2007 graduates varied widely across affluent and large urban school districts of the state, ranging from a low of 51% in Lawrence to 78-80% in Haverhill and Lynn and to highs of 95 percent in affluent suburban school districts, such as Chelmsford and Westford
We need to do a better job tracking the persistence of all Massachusetts high school graduates after they enroll in college and improve their graduation rates.

63
College, Work, and Military Service Plans of Massachusetts High School Graduates By Gender
and Race-Ethnic Group
Group
(A)
2 or 4 Year
(B)
2-Year
(C)
4-Year
(D)
Other Post-
Secondary
(E)
Military
(F)
Work
(H)
Unknown
All 79.3 21.6 57.7 2.8 1.4 9.6 6.0
Male 73.6 21.0 52.6 3.4 2.4 12.9 6.8
Female 84.9 22.2 62.7 2.2 0.4 6.4 5.2
African-American 73.3 28.3 45.0 2.8 0.6 7.3 15.2
Asian 88.3 15.7 72.6 1.5 0.4 3.3 5.9
Hispanic 64.9 35.1 29.8 3.8 1.7 13.0 13.7
White 81.3 19.7 61.6 2.8 1.5 9.7 4.1

64
Percent of H.S. Graduates in the Class of 2007 Planning to Attend a 4-Year College or University, Selected
School Districts in the Northeast WIB Regions
23.8
35.5
45.5
50.5
73.778.2
80.5
86.9
0
10
20
30
40
50
60
70
80
90
100

65
Comparisons of the Graduation Rates At Massachusetts 4-Year Private, 4-Year Public and 2-Year Public Colleges and
Universities With the National Average (Classes of 2006)
Type of Institution / Cohort
(A)
MA
(B)
U.S.
(C)
MA - U.S.
4-Year Private Colleges and Universities, 2000 Cohort 70.6 63.8 +6.8
4-Year Public Colleges and Universities, 2000 Cohort 54.0 53.3 0.7
2-Year Public Colleges and Universities, 2003 Cohort 18.0 23.2 -5.2
66
Growing Mal-Employment Among Young College Graduates in Massachusetts
• Defining mal-employment problems and college labor market jobs
• The declining shares of young college graduates (BA degrees under 30) in Massachusetts and the U.S. that are employed in college labor market jobs
• The mal-employment problems are high among both men and women in our state; much lower among those with a Master’s or higher degree
• Personal economic costs (sharply lower earnings) associated with mal-employment among college graduates; social costs of mal-employment
• The causes of mal-employment; alternative public policy responses
67
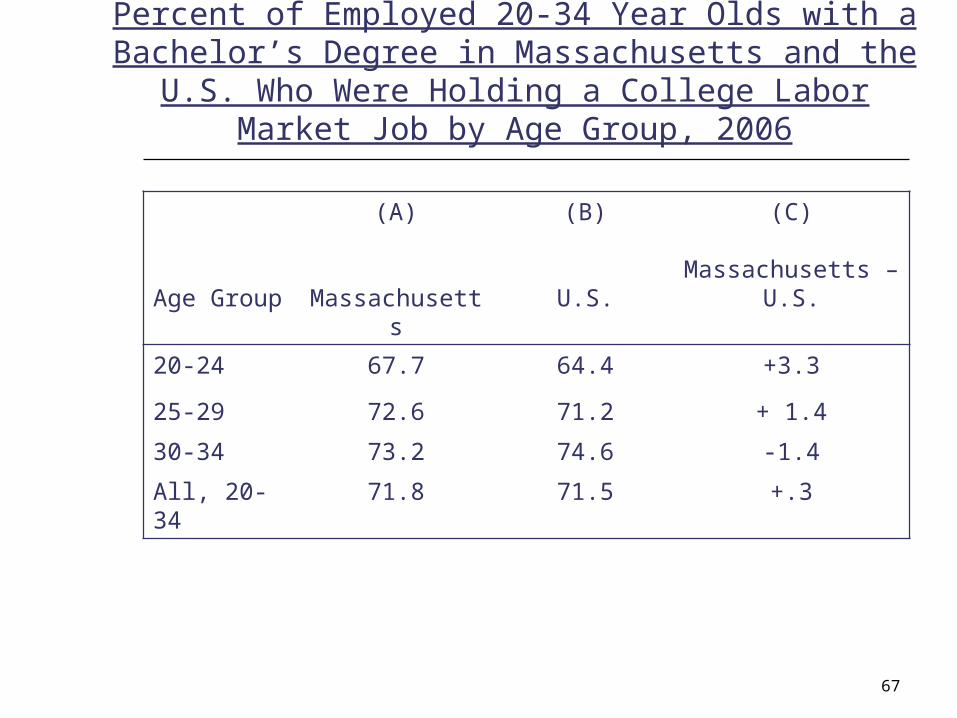
Percent of Employed 20-34 Year Olds with a Bachelor’s Degree in Massachusetts and the U.S. Who Were
Holding a College Labor Market Job by Age Group, 2006
Age Group
(A)
Massachusetts
(B)
U.S.
(C)
Massachusetts – U.S.
20-24 67.7 64.4 +3.3
25-29 72.6 71.2 + 1.4
30-34 73.2 74.6 -1.4
All, 20-34 71.8 71.5 +.3
68
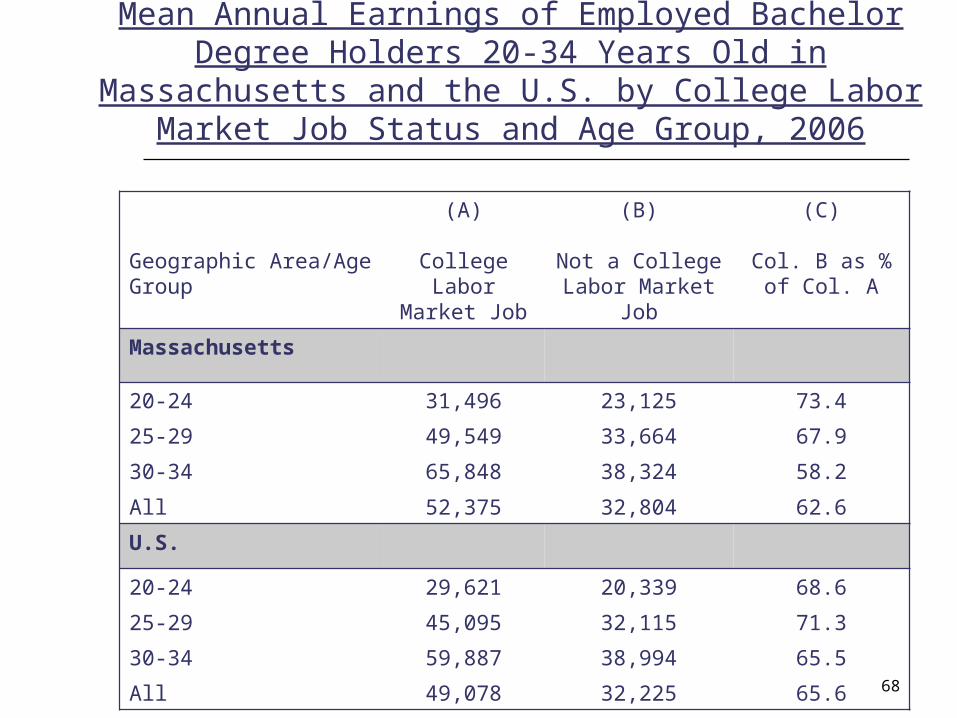
Mean Annual Earnings of Employed Bachelor Degree Holders 20-34 Years Old in Massachusetts and the U.S. by
College Labor Market Job Status and Age Group, 2006
Geographic Area/Age Group
(A)
College LaborMarket Job
(B)
Not a CollegeLabor Market Job
(C)
Col. B as %of Col. A
Massachusetts
20-24 31,496 23,125 73.4
25-29 49,549 33,664 67.9
30-34 65,848 38,324 58.2
All 52,375 32,804 62.6
U.S.
20-24 29,621 20,339 68.6
25-29 45,095 32,115 71.3
30-34 59,887 38,994 65.5
All 49,078 32,225 65.6


![Development of Wib Services Universal Gateway and Wireless … · STK command set, defined in GSM 11.14 [3]. As an example, there are Wib commands like “Display Text”, “Send](https://img.dokumen.tips/doc/110x75/5e893a8513f46577fe591e67/development-of-wib-services-universal-gateway-and-wireless-stk-command-set-defined.jpg)