Embed Size (px)
Citation preview

1
WELCOME
Department of AgricultureGovernment of Andhra Pradesh,
Hyderabad.
Presentation by Sri. Sunil Sharma., I.A.S., Mission Director - NFSM
Commissioner & Director of Agriculture.

2
NFSM- RELEASE & EXPENDITURE -2009-10( Rupees in Lakhs)
S.No Year SchemeApproved by
GOIRelease* Expenditure Balance Remarks
1 2009-10 NFSM-Rice 4669.365 4668.602 3684.040 79 984.56250
NFSM-Pulses 9553.746 9553.747 9107.635 95 446.11200
Publicity 271.100 146.85 98.9692 67 47.88080
14494.211 14369.199 12890.644 90 1478.55530
207.7912
1686.34650
1.Release includes the revalidated amount of Rs.1987.159 Unspent Balances under Rice & Pulses of 2008-09
Intrest accured
1. All UCs from 2007-08 to 2009-10 have been submitted2. Audit reports for 2007-08 & 2008-09 have been submitted

3
Targets and Achievements under Rice From 2007-08 to 2009-10 and targets for 2010-11 & 2011-12
Target Achievement Target Achievement Target Achievement1 2007-08 36.11 39.84 3283 3345 118.56 133.242 2008-09 40.52 43.87 3349 3246 135.69 142.413 2009-10 * 44.85 33.52 3298 3177 147.94 106.504 2010-11 43.70 - 3279 - 143.285 2011-12 46.00 - 3350 154.10
Production(lakh tons)YearS.No
Area (lakh ha)
Yield(kg / ha)
N.B:-• During Rabi-2007-08 Rice production increased by 54.71% in NFSM districts over baseline as against 26.90% in Non NFSM districts.• During 2008-09 Rice production increased by 89.69% in NFSM districts over baseline as against 38.07% in Non NFSM districts.
Base Line - 100.00 lakh tons

4
Planning of input procurement for Kharif-10 and progress
S.No Crop
Seed Distribution
target (Qtls)
Seed Availability
(Qtls)
1 Paddy 290625 342000
• APSSDC is identified as the agency to supply paddy seed• 30% of the seed is already positioned up to Mandal level and further movement is in progress

5
Status of Minikits Distribution of Rice
S.No Variety No. Allotted Supplying Agencies Status
1 KRH-2 (Hybrid Rice) 825 APSSDC
2 Swarna Sub-1 (Pre- release) 10000 NSC
3 NLR-34449 8000 APSSDC
4 Indra MTU (1061) 10000 APSSDC
Total 28825
District wise allotment
indicated to the Supplying Agencies
6
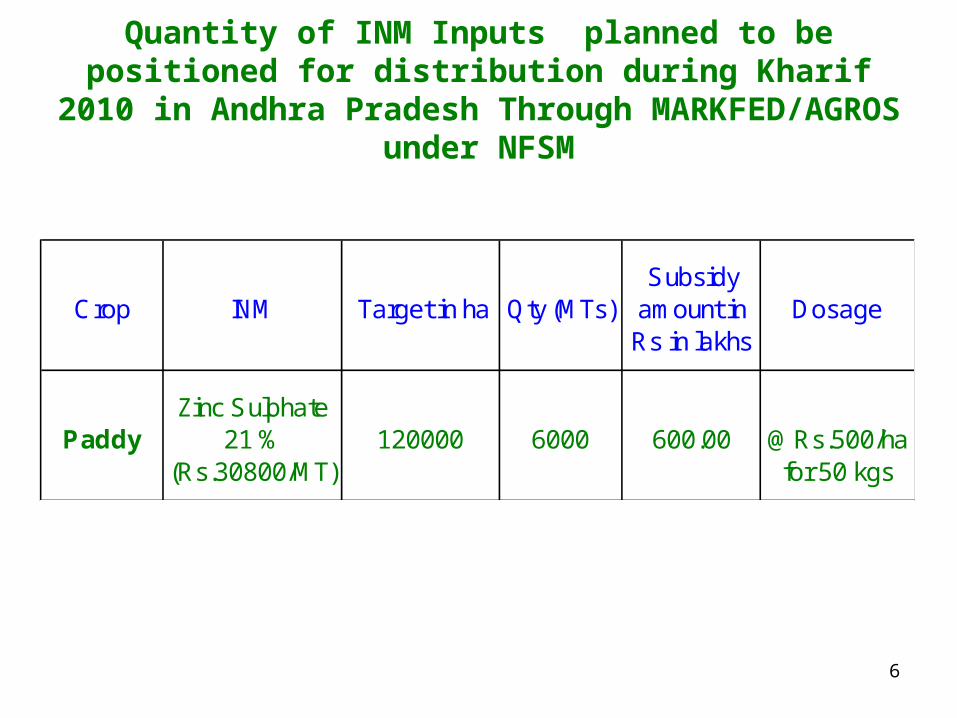
Quantity of INM Inputs planned to be positioned for distribution during Kharif 2010 in Andhra Pradesh Through
MARKFED/AGROS under NFSM
Crop INM Target in ha Qty (MTs)Subsidy
amount in Rs in lakhs
Dosage
PaddyZinc Sulphate
21 % (Rs.30800/MT)
120000 6000 600.00
@Rs.500/ha for 50 kgs

7
Promotion of SRI in Andhra Pradesh • It is decided to promote SRI cultivation in the state on a large scale
under wells and tanks during the remaining years of XI plan.• A training programme was organized for all District Joint Directors of
Agriculture and 2 master trainers from each district on 1st May-10.• A workshop was also organized on SRI with scientists, NGOs and
department officers to decide the strategy to promote SRI & cover about 3.71 lakh ha during 2010-11.
• The following strategies are evolved:– Intensive trainings to be imparted to staff (up to field staff and modal farmers)
scientists, farmers & labour.– Wide publicity to be give to promote SRI.– To follow area approach.– Work through NGOs, RMGs, WUAs, KVKs etc.– Custom hiring centers to be established for hiring SRI implements.– One person to be made incharge in each village to ensure constant supervision.– Farmers field visits to be organized.

8
Pulses Development
1Pulses Production Target as per NDC Resolution
16.00 lakh tons (2011-12)
2 Base Line Production Level 12.50 lakh tons3 Additional Production Target 3.50 lakh tons

9
Total Pulses Targets and Achievements From 2007-08 to 2009-10
and targets for 2010-11 & 2011-12
Target Achievement Target Achievement Target # Achievement1 2007-08 21.26 21.13 675 803 14.35 16.972 2008-09 22.67 17.71 640 818 14.50 14.483 2009-10 * 19.45 19.49 752 746 14.63 14.53
4 2010-11 30.16 - 770 - 24.905 2011-12 31.69 - 905 - 30.61
# including other pulses.
S.NoArea
(lakh ha)Yield
(kg / ha)Production(lakh tons)Year
Pulses Development
Mission Proposed
Achievement Source:- DES
* Third Estimates
Base Line - 12.50 lakh tons

10
Targets and Achievements under Bengalgram From 2007-08 to 2009-10 and targets for 2011-12
Target Achievement Target Achievement Target Achievement1 2007-08 4.66 6.30 1244 1448 5.80 9.122 2008-09 4.70 6.07 1275 1413 6.00 8.573 2009-10 * 6.30 7.30 1190 1285 7.50 9.38
4 2010-11 6.50 - 1509 - 9.80
5 2011-12 6.50 - 1700 - 11.05
Pulses Development
Mission Proposed
Production(lakh tons)S.No Year
Area (lakh ha)
Yield(kg / ha)
* Third Estimates Achievement Source:- DES
• Bengalgram production during Rabi-07-08 increased by 121.26% in NFSM districts over baseline as against 22.20% in Non NFSM districts.• Bengalgram production during Rabi-08-09 increased by 107.27% in NFSM districts over baseline as against 19.41% in Non NFSM districts.

11
Targets and Achievements under Redgram From 2007-08 to 2009-10 and targets for 2010-11 & 2011-12
Target Achievement Target Achievement Target Achievement1 2007-08 5.03 4.63 615 651 3.10 3.022 2008-09 5.03 4.43 595 455 3.00 2.023 2009-10 * 4.55 5.42 520 515 2.37 2.79
4 2010-11 9.52 - 693 - 6.605 2011-12 11.05 - 867 - 9.58
Production(lakh tons)S.No Year
Area (lakh ha)
Yield(kg / ha)
Pulses Development Mission Proposed
* Third Estimates Achievement Source:- DES
• Reduction in area due to delayed monsoon during kharif-08• Reduction in yield due to late sowings in kharif-08 and severe drought in kharif-09• During Rabi-2009-10 an area of 1.03 lakh ha was covered as against a normal of 0.06 lakh ha

12
Targets and Achievements under Greengram From 2007-08 to 2009-10 and targets for 2011-12
Target Achievement Target Achievement Target Achievement1 2007-08 5.13 4.38 410 439 2.10 1.922 2008-09 4.74 3.20 465 426 2.20 1.363 2009-10 * 3.45 3.02 473 174 2.08 0.52
4 2010-11 6.98 - 514 - 3.595 2011-12 6.98 - 627 - 4.38
Pulses Development Mission Proposed
S.No YearArea
(lakh ha)Yield
(kg / ha)Production(lakh tons)
* Third Estimates Achievement Source:- DES
• Kharif-08 - Reduction in area due to diversification to Maize crop & delayed monsoon• Reduction in yield due to heavy rains in July – August-08.• Kharif-09 - Reduction in area and yield due to severe drought & YMV incidence
13
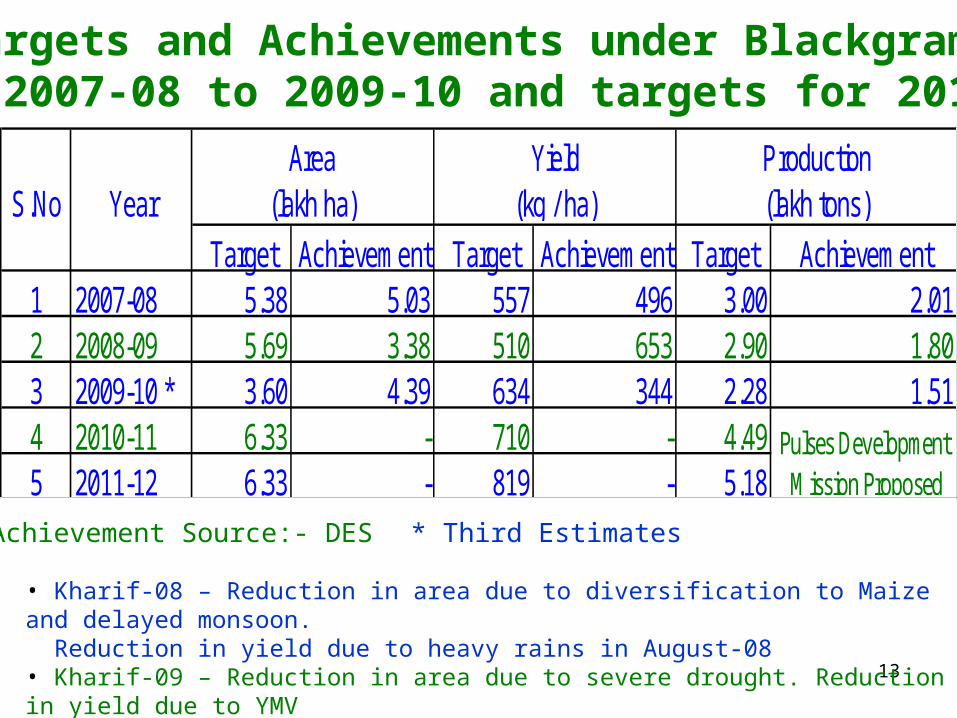
Targets and Achievements under Blackgram From 2007-08 to 2009-10 and targets for 2011-12
Target Achievement Target Achievement Target Achievement1 2007-08 5.38 5.03 557 496 3.00 2.012 2008-09 5.69 3.38 510 653 2.90 1.803 2009-10 * 3.60 4.39 634 344 2.28 1.514 2010-11 6.33 - 710 - 4.495 2011-12 6.33 - 819 - 5.18
S.No YearArea
(lakh ha)Yield
(kg / ha)Production(lakh tons)
Pulses Development Mission Proposed
* Third Estimates Achievement Source:- DES
• Kharif-08 – Reduction in area due to diversification to Maize and delayed monsoon. Reduction in yield due to heavy rains in August-08• Kharif-09 – Reduction in area due to severe drought. Reduction in yield due to YMV• Rabi-09-10 – Reduction in yield due to hailstorm.
14
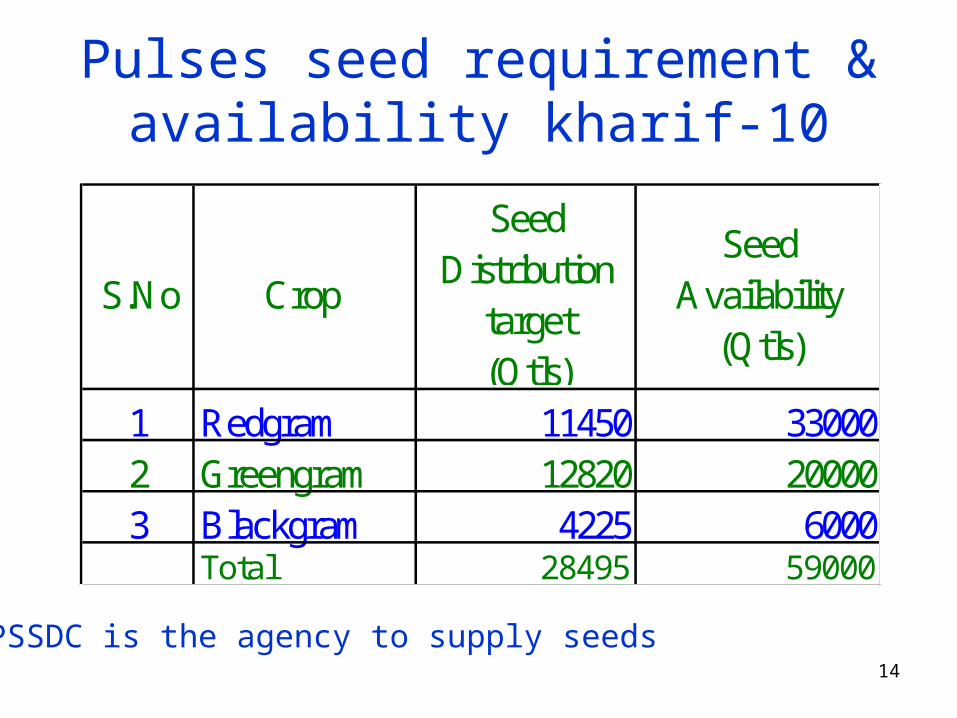
Pulses seed requirement & availability kharif-10
S.No Crop
Seed Distribution
target (Qtls)
Seed Availability
(Qtls)
1 Redgram 11450 330002 Greengram 12820 200003 Blackgram 4225 6000
Total 28495 59000
APSSDC is the agency to supply seeds

15
Quantity of INM Inputs planned to be positioned for distribution during Kharif 2010 Through
MARKFED/AGROS under NFSM
Crop INM Target in ha Qty (MTs)Subsidy
amount in Rs in lakhs
Dosage
Pulses Zinc Sulphate
21 % (Rs.30800/MT)
50000 1250 192.5
@Rs.380/ha for 25 kgs
Gypsum (Rs2225/Mt
30600 7650 85.374
@Rs.279/ha for 250 kgs

16
GENERAL
• IPM – (14) Departmental Biological control labs are geared up to produce the required quantity of bio-agents (Trichoderma viridi 104000 kgs, Pseudomonas fluroscence 48000 kgs, Tricho cards 86500 nos, NPV (LE) 50.00 lakhs)
• INM – (2) Bacterial Cultural Labs in the state have already started producing 100800 packets (500 g each) of PSB & Rhizobium culture and will be supplied by 31.05.10 to field level
• Farm Mechanization – AGROS is the identified agency – tenders are floated
17
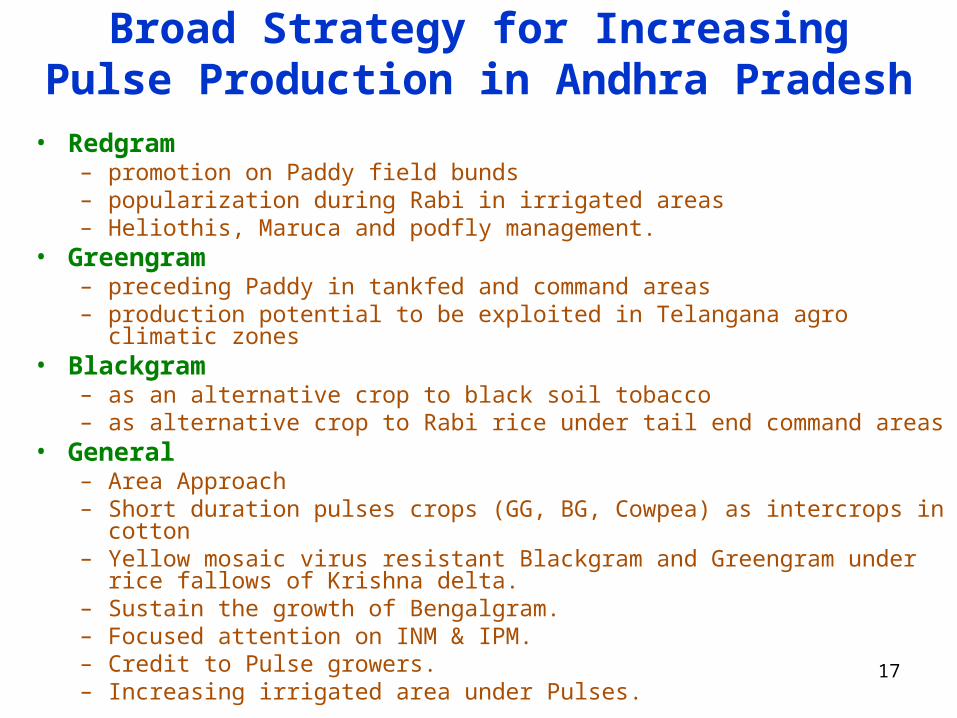
Broad Strategy for Increasing Pulse Production in Andhra Pradesh
• Redgram – promotion on Paddy field bunds– popularization during Rabi in irrigated areas– Heliothis, Maruca and podfly management.
• Greengram – preceding Paddy in tankfed and command areas– production potential to be exploited in Telangana agro climatic zones
• Blackgram – as an alternative crop to black soil tobacco– as alternative crop to Rabi rice under tail end command areas
• General– Area Approach– Short duration pulses crops (GG, BG, Cowpea) as intercrops in cotton– Yellow mosaic virus resistant Blackgram and Greengram under rice fallows of
Krishna delta.– Sustain the growth of Bengalgram.– Focused attention on INM & IPM.– Credit to Pulse growers.– Increasing irrigated area under Pulses.

18
NFSM – Accelerated Pulse Production Programme – (A3P) - Implementation
• 28 units (1000 ha) allotted to Andhra Pradesh during Kharif-10.– Redgram - 13 blocks– Greengram - 5 blocks– Blackgram - 10 blocks
Total - 28 blocks
• Out of 13 blocks of Redgram 1 unit in Anantapur will be implemented by NCIPM.
19
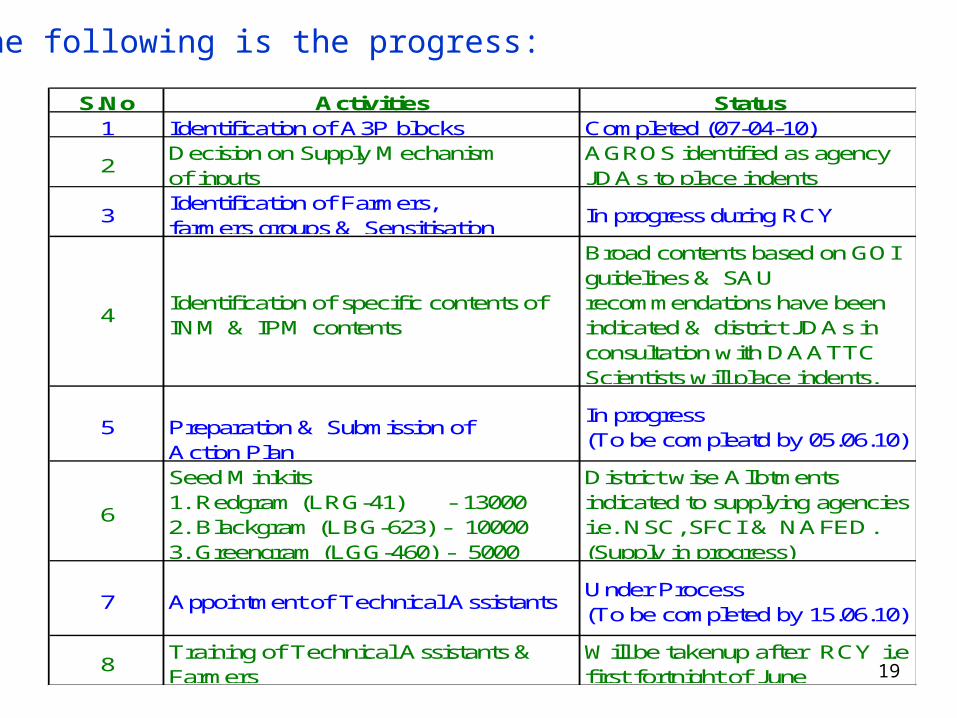
• The following is the progress:
S.No Activities Status1 Identification of A3P blocks Completed (07-04-10)
2Decision on Supply Mechanism of inputs
AGROS identified as agencyJDAs to place indents
3Identification of Farmers, farmers groups & Sensitisation
In progress during RCY
4Identification of specific contents of INM & IPM contents
Broad contents based on GOI guidelines & SAU recommendations have been indicated & district JDAs in consultation with DAATTC Scientists will place indents.
5 Preparation & Submission of Action Plan
In progress (To be compleatd by 05.06.10)
6
Seed Minikits1. Redgram (LRG-41) - 130002. Blackgram (LBG-623) - 100003. Greengram (LGG-460) - 5000
District wise Allotments indicated to supplying agencies i.e. NSC, SFCI & NAFED. (Supply in progress)
7 Appointment of Technical Assistants Under Process(To be completed by 15.06.10)
8Training of Technical Assistants & Farmers
Will be takenup after RCY i.e first fortnight of June

20

21
NFSM-YEARWISE BUDGET RELEASE & EXPENDITURE DETAILS ( Rupees in Lakhs)
S.No Year SchemeApproved by
GOIRelease* Expenditure Balance Remarks
1 2007-08 NFSM-Rice 1574.83000 1574.8300 654.6783 42 920.1517NFSM-Pulses 2811.00000 2811.0000 1876.3869 67 934.6131Publicity 76.00000 76.0000 76.0000 100 0.0000
4461.8300 4461.8300 2607.0651 58 1854.76492 2008-09 NFSM-Rice 3668.68900 3334.76900 2498.36100 75 836.40800
NFSM-Pulses 6833.94500 6833.94400 5683.18800 83 1150.75600Publicity 100.00000 100.00000 100.00000 100 0.00000
10602.63400 10268.71300 8281.54900 81 1987.16400
3 2009-10 NFSM-Rice 4669.365 4668.602 3684.040 79 984.56250
NFSM-Pulses 9553.746 9553.747 9107.635 95 446.11200
Publicity 271.100 146.85 98.9692 67 47.88080
14494.211 14369.199 12890.644 90 1478.55530
*Release includes therevalidated amount of Rs.1854.765 Unspent Balances under Rice &
Pulses of 2007-08
1.Release includes the revalidated amount of Rs.1987.159 Unspent Balances under Rice & Pulses of 2008-09 2.2009-10 expenditure upto December including Committed Expenditure.
1. All UCs from 2007-08 to 2009-10 have been submitted2. Audit reports for 2007-08 & 2008-09 have been submitted
22
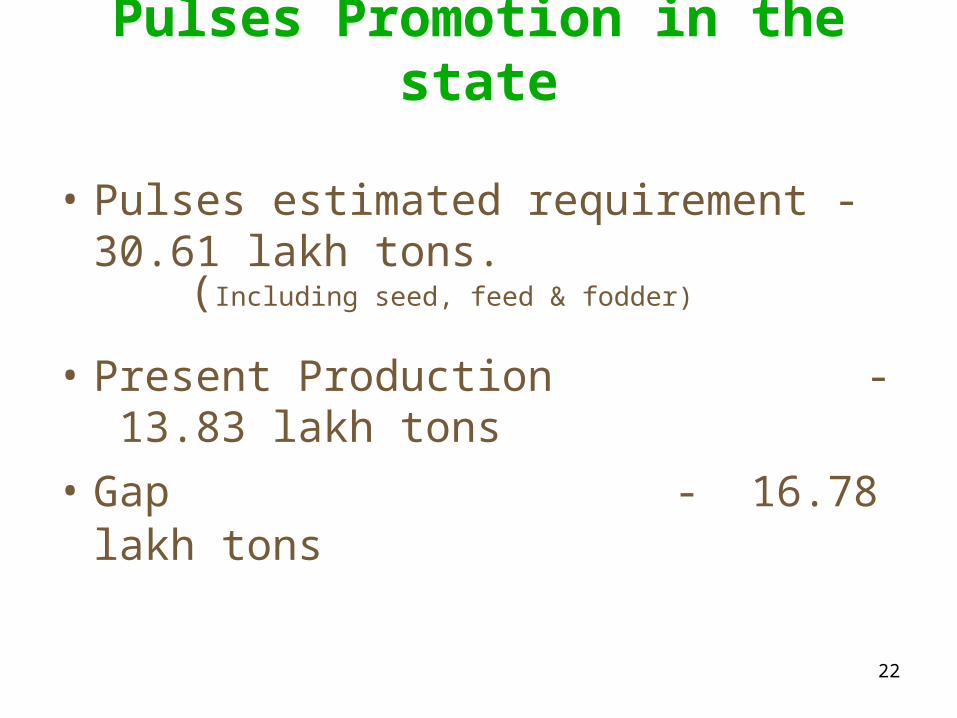
Pulses Promotion in the state
• Pulses estimated requirement - 30.61 lakh tons.
(Including seed, feed & fodder)
• Present Production - 13.83 lakh tons
• Gap - 16.78 lakh tons

23
State Pulses Development MissionTargets
(Area lakh ha, Yield kg / ha, Production lakh tons)
Normal2010-11Target
2011-12Target
Normal2010-11Target
2011-12Target
Normal2010-11Target
2011-12Target
1 Redgram 4.56 9.52 11.05 519 693 867 2.37 6.60 9.582 Greengram 3.98 6.98 6.98 400 514 627 1.59 3.59 4.383 Blackgram 4.37 6.33 6.33 608 710 819 2.66 4.49 5.184 Bengalgram 5.15 6.50 6.50 1319 1509 1700 6.79 9.80 11.055 Other pulses 0.83 0.83 0.83 510 510 510 0.42 0.42 0.42
Total 18.89 30.16 31.69 732 826 966 13.83 24.90 30.61
S.NoArea ProductionProductivity
Crop

24
Details of Crop wise / Year wise Additional targeted Areas
1 Redgrama) by diversification from other crops 2.40 2.40b) Rabi Redgram under Jalayagnam areas 2.06 3.09c) intercropping 1.35 2.35Total 5.81 7.84
2 Greengrama) Rice fallows 2.00 2.00b) preceeding to paddy 1.00 1.00Total 3.00 3.00
3 Blackgrama) Rice fallows 1.96 1.96Total 10.77 12.8

25
Increasing Pulses Area under Irrigation
Sl.No
Item
2010-11 2011-12 Total
NosArea under
irrigation haNos
Area under
irrigation ha
NosArea under
irrigation ha
1Sprinkler/Water carrying pipes
7000 14000 10000 20000 17000 34000
2Diesel Engines / Electric motors
4400 8800 10000 20000 14400 28800
Total 11400 22800 20000 40000 31400 62800

26
Pulses Development - Source of Funding / requirement
1. National Food Security Mission
a) Annual Action Plan- 48.53 croresb) Under A3P - 15.12 crores
Sub Total - 63.65 crores
2. 60,000 villages – RKVY - 33.00 croresGrand Total - 96.65 crores
3. Requirement of funds under State Pulses Mission:to cover additional areas planned Total requirement - 2010-11 2011-12
155.82 180.69
a) To be met from ATMA - 2.11 2.11b) Balance to be met from RKVY- 153.71 178.58
Pulses Development - Source of Funding / requirement

27
Organizing sixty thousand “Pulses and Oilseeds Villages” in Rainfed Areas
S.No Activity Status
1 Selection of clusters of 10 Villages of pulses \ and oil seeds
All districts have selected the clusters of 10 villages of pulses and oil seeds
2 WMSs, PACs etc of each cluster to be selected
Under progress.
3 Agency to be identified for supply of tractors and Accessories
AGROS identified as the agency for supply of 35HP tractors with accessories viz. Ridge & furrow planter, Rotavator (Marker for SRI etc also included) to the WMSs, PACs etc.
4 Unit can take up supply of critical Inputs
Critical inputs will be supplied to cluster villages by the identified agency as per the requirement .
5 Orientation of farmers Orientation is taken up to the farmers on “pulses andoil seeds development programme in rainfed areas” during the “Rythu Chaitanya Yatra “ from 17.05.10.
28
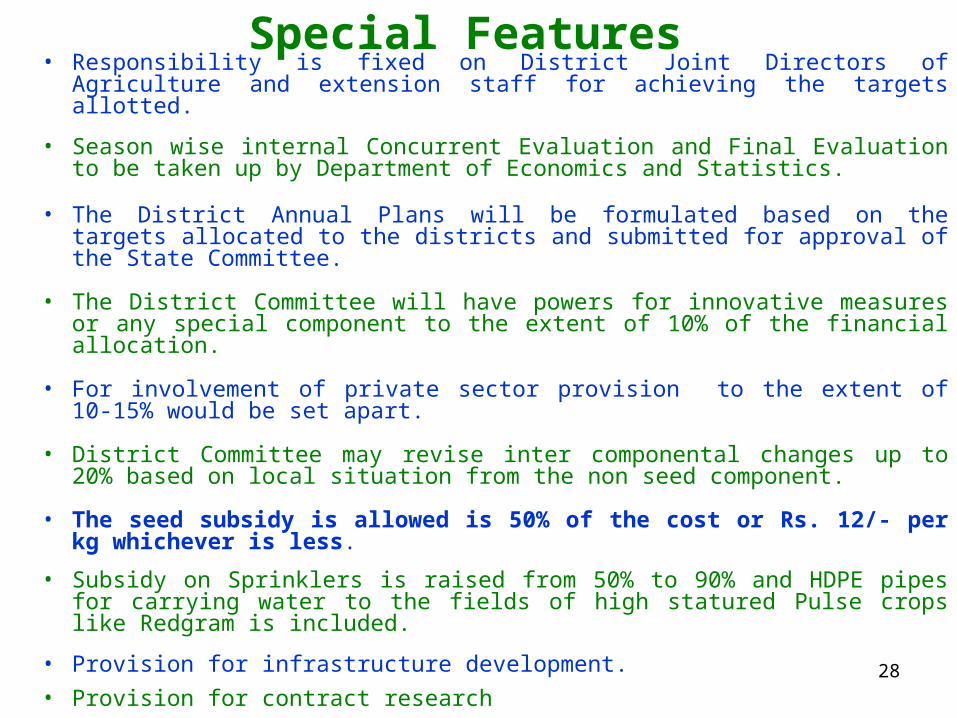
Special Features • Responsibility is fixed on District Joint Directors of Agriculture and extension
staff for achieving the targets allotted.
• Season wise internal Concurrent Evaluation and Final Evaluation to be taken up by Department of Economics and Statistics.
• The District Annual Plans will be formulated based on the targets allocated to the districts and submitted for approval of the State Committee.
• The District Committee will have powers for innovative measures or any special component to the extent of 10% of the financial allocation.
• For involvement of private sector provision to the extent of 10-15% would be set apart.
• District Committee may revise inter componental changes up to 20% based on local situation from the non seed component.
• The seed subsidy is allowed is 50% of the cost or Rs. 12/- per kg whichever is less.
• Subsidy on Sprinklers is raised from 50% to 90% and HDPE pipes for carrying water to the fields of high statured Pulse crops like Redgram is included.
• Provision for infrastructure development.
• Provision for contract research
29
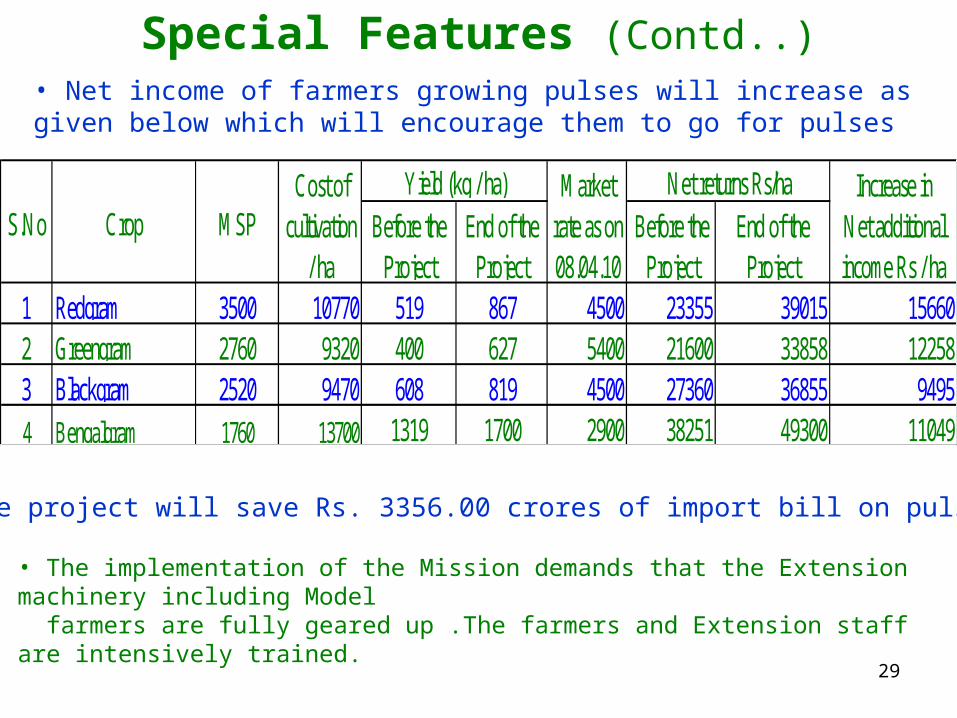
• Net income of farmers growing pulses will increase as given below which will encourage them to go for pulses
Special Features (Contd..)
Before the Project
End of the Project
Before the Project
End of the Project
1 Redgram 3500 10770 519 867 4500 23355 39015 156602 Greengram 2760 9320 400 627 5400 21600 33858 122583 Blackgram 2520 9470 608 819 4500 27360 36855 94954 Bengalgram 1760 13700 1319 1700 2900 38251 49300 11049
Increase in Net additional income Rs / ha
Yield (kg / ha) Net returns Rs/haMarket rate as on 08.04.10
S.No Crop MSPCost of
cultivation / ha
The project will save Rs. 3356.00 crores of import bill on pulses.
• The implementation of the Mission demands that the Extension machinery including Model farmers are fully geared up .The farmers and Extension staff are intensively trained.
30
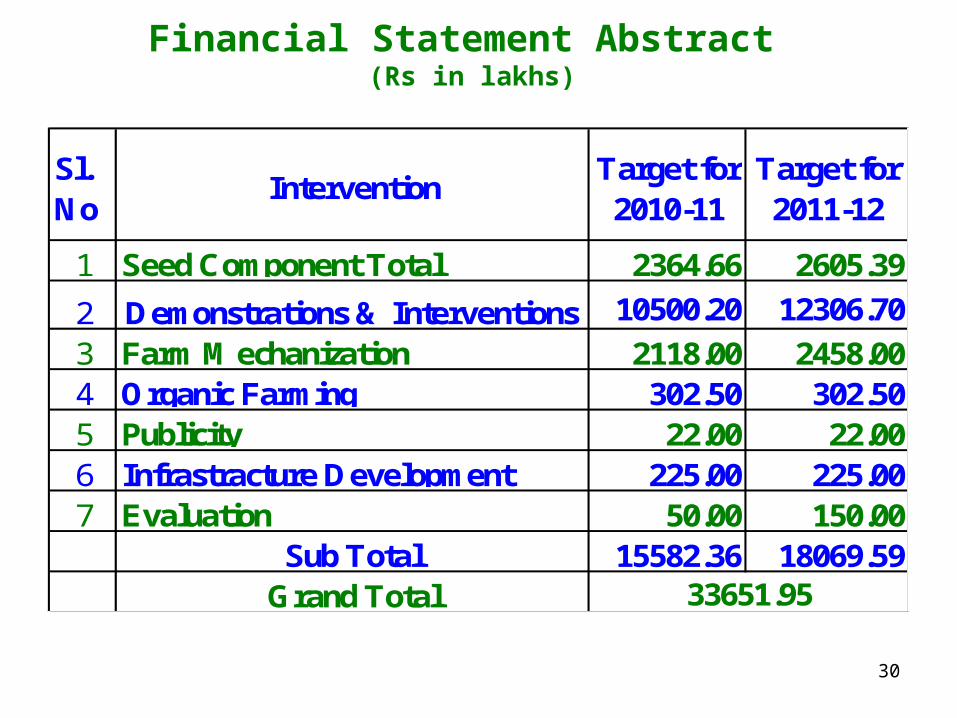
Financial Statement Abstract (Rs in lakhs)
Sl.No
InterventionTarget for 2010-11
Target for 2011-12
1 Seed Component Total 2364.66 2605.39
2 Demonstrations & Interventions 10500.20 12306.70
3 Farm Mechanization 2118.00 2458.004 Organic Farming 302.50 302.505 Publicity 22.00 22.006 Infrastracture Development 225.00 225.007 Evaluation 50.00 150.00
Sub Total 15582.36 18069.59Grand Total 33651.95
31
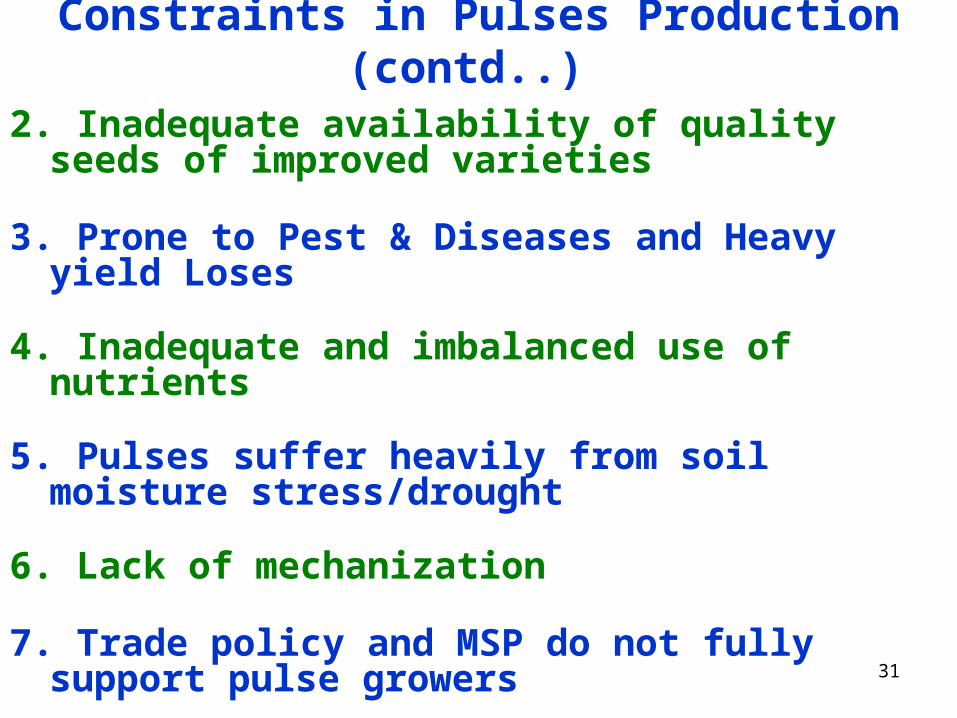
Constraints in Pulses Production (contd..)
2. Inadequate availability of quality seeds of improved varieties
3. Prone to Pest & Diseases and Heavy yield Loses
4. Inadequate and imbalanced use of nutrients
5. Pulses suffer heavily from soil moisture stress/drought
6. Lack of mechanization
7. Trade policy and MSP do not fully support pulse growers

32
Constraints in Pulses Production1. Net returns in Pulses are low compared to Rice, Maize etc.
Minimum Maximum Minimum Maximum Minimum Maximum1 Rice 950-980 32279 3246 2000 2100 64920 68166 32641 358872 Maize 840 19920 4874 900 950 43866 46303 23946 263833 Redgram 3500 10770 455 4000 4500 18200 20475 7430 97054 Greengram 2760 9320 426 2760 2760 11758 11757.6 2438 24385 Blackgram 2520 9470 653 2700 3350 17631 21875.5 8161 124066 Bengalgram 1760 13700 1413 1900 2100 26847 29673 13147 15973
Market rate as on 08.05.10
Total returns Rs/ha Net returns Rs/haMSPS.No Crop
Cost of cultivation
/ ha
Yield kg/ha
(08-09)
• As could be seen the net returns especially Greengram and Redgram are not attractive where as, there is an immediate need for increase in production of pulses in the state through increase in area and productivity.
• Since Redgram is the staple food it is envisaged to increase its productivity and production along with other pulses.
Source:- Department of Agriculture / Marketing
33
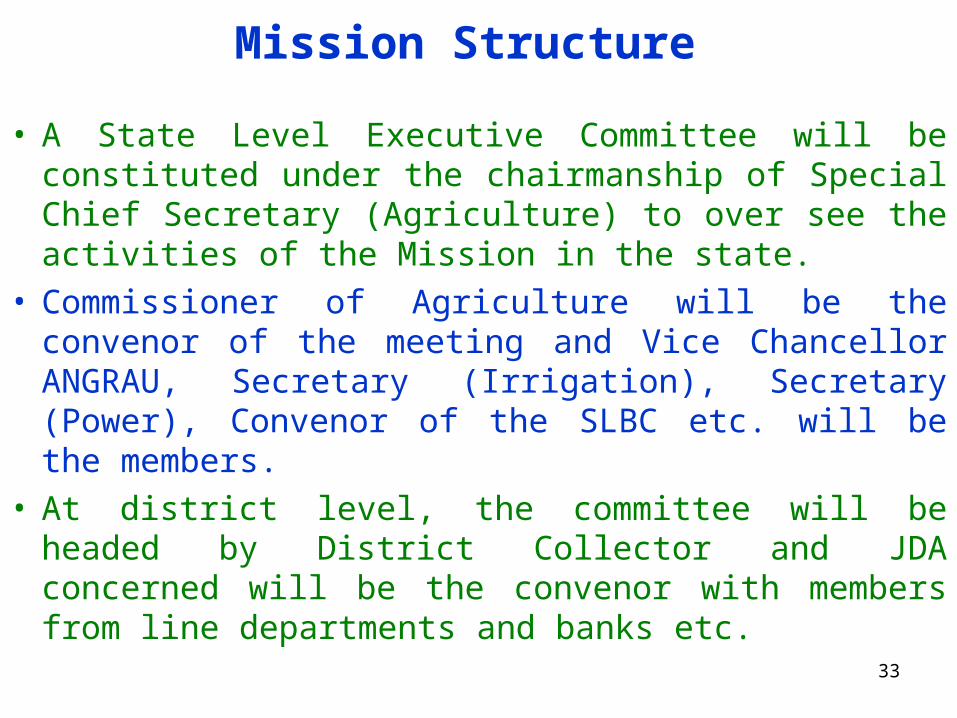
Mission Structure
• A State Level Executive Committee will be constituted under the chairmanship of Special Chief Secretary (Agriculture) to over see the activities of the Mission in the state.
• Commissioner of Agriculture will be the convenor of the meeting and Vice Chancellor ANGRAU, Secretary (Irrigation), Secretary (Power), Convenor of the SLBC etc. will be the members.
• At district level, the committee will be headed by District Collector and JDA concerned will be the convenor with members from line departments and banks etc.
34
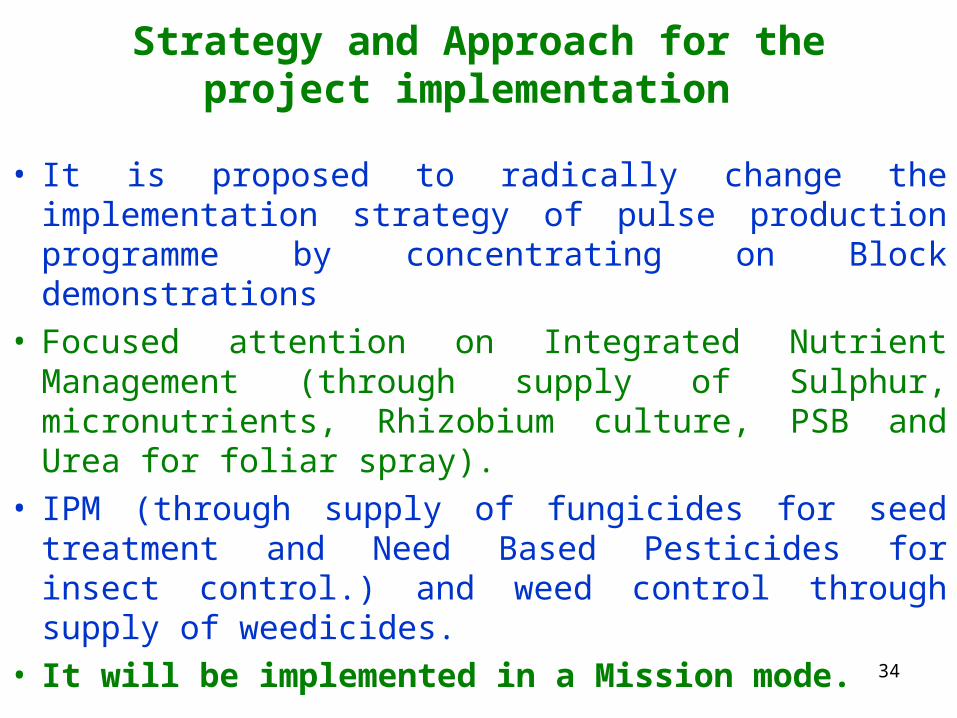
Strategy and Approach for the project implementation
• It is proposed to radically change the implementation strategy of pulse production programme by concentrating on Block demonstrations
• Focused attention on Integrated Nutrient Management (through supply of Sulphur, micronutrients, Rhizobium culture, PSB and Urea for foliar spray).
• IPM (through supply of fungicides for seed treatment and Need Based Pesticides for insect control.) and weed control through supply of weedicides.
• It will be implemented in a Mission mode.
35
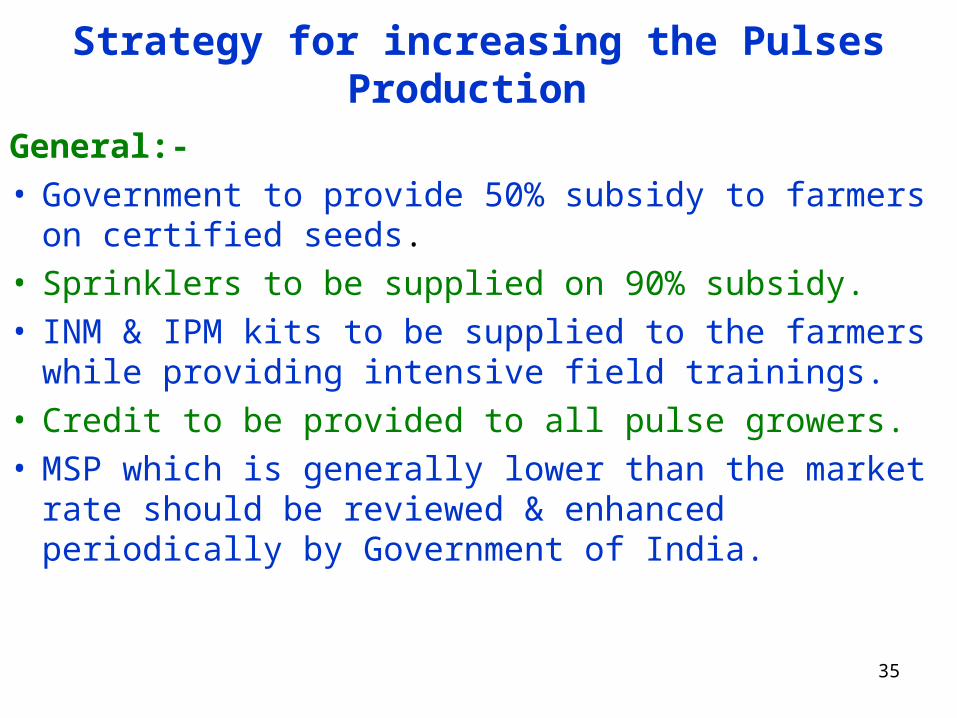
Strategy for increasing the Pulses Production
General:-• Government to provide 50% subsidy to farmers on certified
seeds.• Sprinklers to be supplied on 90% subsidy.• INM & IPM kits to be supplied to the farmers while
providing intensive field trainings. • Credit to be provided to all pulse growers.• MSP which is generally lower than the market rate should
be reviewed & enhanced periodically by Government of India.
36
Infrastructure Development
• Increased production of seed and its storage is crucial for the success of the Mission,
• Therefore provision is made to create appropriate need based infrastructure facilities for this purpose.
• This will be used for providing irrigation facilities on seed farms (bore wells, tube wells, lining of channels, pump sets levelling of fields, fencing etc) and creation of storage facilities.
• Department and ANGRAU could avail this provision.

37
Additional Area Planned and requirement of various class of seed for the year 2010-11 & 2011-12
Addl. Planned
Area (lakh ha)
Total Seed
Requirement
Planned SRR (%)
Requirement of C/S
as per SRR
Breeder Seed
Requirement
Foundation Seed
Requirement
1 Redgram 4.96 49600 33 16368 1.64 163.682 Greengram 3.00 60000 33 19800 12.38 495.003 Blackgram 1.96 39200 33 12936 8.09 323.404 Bengalgram 0.00 0 33 0 0.00 0.005 Other Pulses 0 0 0 0 0.00 0.00
Total Pulses
9.92 148800 49104 22.10 982.08
2010-11
CropS.No
Addl. Planned
Area (lakh ha)
Total Seed
Requirement
Planned SRR (%)
Requirement of C/S
as per SRR
Breeder Seed
Requirement
Foundation Seed
Requirement
1 Redgram 6.49 64900 33 21417 2.14 214.172 Greengram 3.00 60000 33 19800 12.38 495.003 Blackgram 1.96 39200 33 12936 8.09 323.404 Bengalgram 0.00 0 33 0 0.00 0.005 Other Pulses 0.00 0 0 0 0.00 0.00
Total Pulses 11.45 164100 54153 22.60 1032.57
S.No Crop
2011-12

38
Pulses Research by ANGRAU:An amount of 5% of allocation under seed component will be
earmarked to ANGRAU for Contract Research for development of new varieties including drought resistant varieties of pulses. Specific new problems hampering cultivation of these crops needing immediate remedies will also be taken up by ANGRAU.
Transfer of Technology:
Block Demonstrations: The size of each demonstration will be 5 ha in a compact area to the extent possible.
• Results will be analyzed and evaluated and given wide publicity through distribution of leaflets and other mass communication media
Demonstration on Integrated Pest Management (Farmers Field School)
39
Monitoring & Evaluation
• The Mission will have a strong mechanism of Monitoring of Evaluation with the involvement of all the concerned agencies and line departments.
• Formats for monitoring progress under various interventions will be developed and communicated to the implementing officers.
• Internal Concurrent Evaluation will be done at the end of each season.
• Final evaluation will be done by Director of Economics & Statistics.
• District Joint Directors of Agriculture will be allotted targets for area coverage, productivity and production levels to be achieved for each season and the performance of Joint Directors of Agriculture and field extension staff will be reviewed against achievements every year.
40
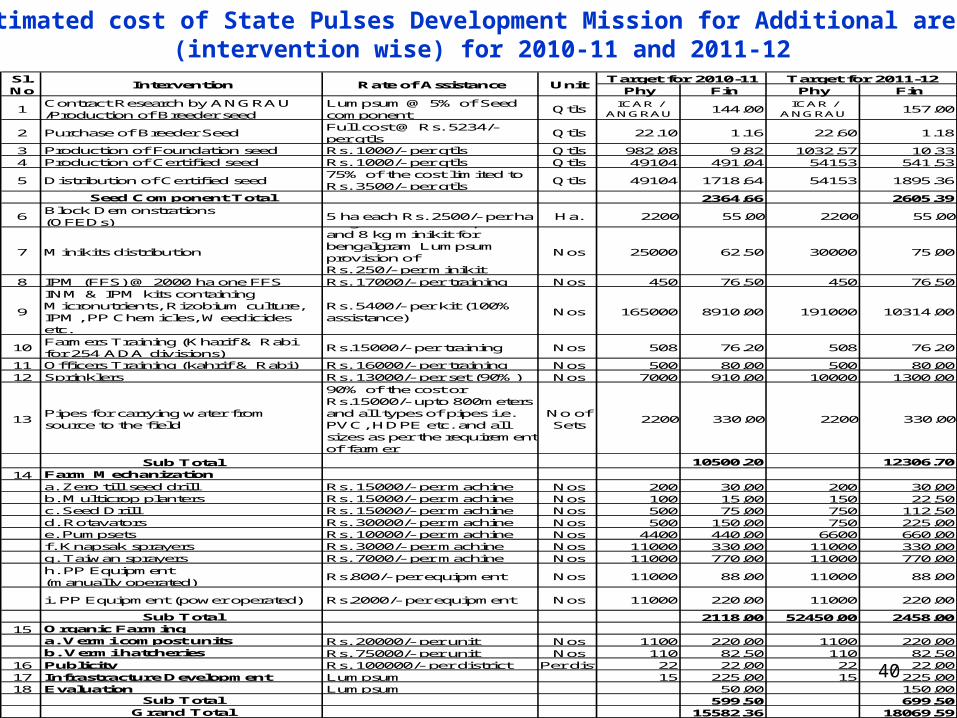
Estimated cost of State Pulses Development Mission for Additional areas (intervention wise) for 2010-11 and 2011-12
Phy Fin Phy Fin
1Contract Research by ANGRAU /Production of Breeder seed
Lumpsum @ 5% of Seed component
QtlsICAR /
ANGRAU144.00
ICAR / ANGRAU
157.00
2 Purchase of Breeder SeedFull cost @ Rs. 5234/- per qtls
Qtls 22.10 1.16 22.60 1.18
3 Production of Foundation seed Rs. 1000/- per qtls Qtls 982.08 9.82 1032.57 10.334 Production of Certified seed Rs. 1000/- per qtls Qtls 49104 491.04 54153 541.53
5 Distribution of Certified seed75% of the cost limited to Rs. 3500/- per qtls
Qtls 49104 1718.64 54153 1895.36
Seed Component Total 2364.66 2605.39
6Block Demonstrations(OFEDs)
5 ha each Rs. 2500/- per ha Ha. 2200 55.00 2200 55.00
7 Minikits distribution
4 kg minikit for all pulses and 8 kg minikit for bengalgram Lumpsum provision of Rs. 250/- per minikit
Nos 25000 62.50 30000 75.00
8 IPM (FFS) @ 2000 ha one FFS Rs. 17000/- per training Nos 450 76.50 450 76.50
9
INM & IPM kits containing Micronutrients, Rizobium culture, IPM, PP Chemicles, Weedicides etc.
Rs. 5400/- per kit (100% assistance)
Nos 165000 8910.00 191000 10314.00
10Farmers Training (Kharif & Rabi for 254 ADA divisions)
Rs.15000/- per training Nos 508 76.20 508 76.20
11 Officers Training (kahrif & Rabi) Rs. 16000/- per training Nos 500 80.00 500 80.0012 Sprinklers Rs. 13000/- per set (90%) Nos 7000 910.00 10000 1300.00
13Pipes for carrying water from source to the field
90% of the cost or Rs.15000/- upto 800meters and all types of pipes i.e. PVC, HDPE etc. and all sizes as per the requirement of farmer
No of Sets
2200 330.00 2200 330.00
Sub Total 10500.20 12306.70
14 Farm Mechanizationa. Zero till seed drill Rs. 15000/- per machine Nos 200 30.00 200 30.00b. Multicrop planters Rs. 15000/- per machine Nos 100 15.00 150 22.50c. Seed Drill Rs. 15000/- per machine Nos 500 75.00 750 112.50d. Rotavators Rs. 30000/- per machine Nos 500 150.00 750 225.00e. Pumpsets Rs. 10000/- per machine Nos 4400 440.00 6600 660.00f. Knapsak sprayers Rs. 3000/- per machine Nos 11000 330.00 11000 330.00g. Taiwan sprayers Rs. 7000/- per machine Nos 11000 770.00 11000 770.00h. PP Equipment (manually operated)
Rs.800/- per equipment Nos 11000 88.00 11000 88.00
i. PP Equipment (power operated) Rs.2000/- per equipment Nos 11000 220.00 11000 220.00
Sub Total 2118.00 52450.00 2458.0015 Organic Farming
a. Vermi compost units Rs. 20000/- per unit Nos 1100 220.00 1100 220.00b. Vermi hatcheries Rs. 75000/- per unit Nos 110 82.50 110 82.50
16 Publicity Rs. 100000/- per district Per dist 22 22.00 22 22.0017 Infrastracture Development Lumpsum 15 225.00 15 225.0018 Evaluation Lumpsum 50.00 150.00
Sub Total 599.50 699.50Grand Total 15582.36 18069.59
Sl.No
Rate of AssistanceTarget for 2010-11 Target for 2011-12
UnitIntervention
41
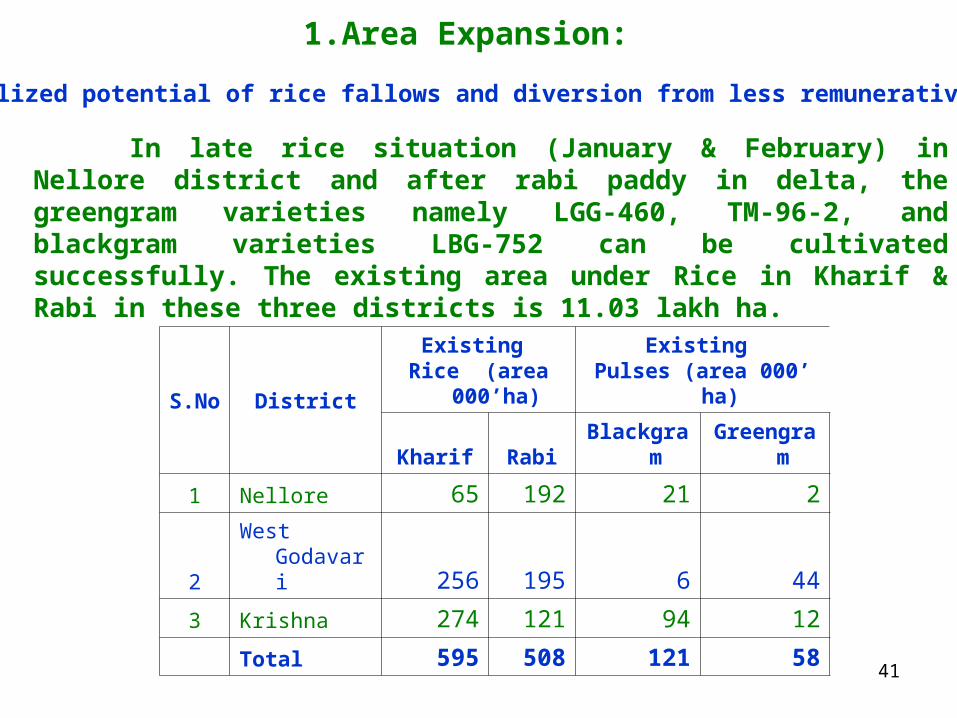
1. Area Expansion:
In late rice situation (January & February) in Nellore district and after rabi paddy in delta, the greengram varieties namely LGG-460, TM-96-2, and blackgram varieties LBG-752 can be cultivated successfully. The existing area under Rice in Kharif & Rabi in these three districts is 11.03 lakh ha.
S.No DistrictExisting
Rice (area 000’ha)Existing
Pulses (area 000’ ha)
Kharif Rabi Blackgram Greengram
1 Nellore 65 192 21 2
2 West Godavari 256 195 6 44
3 Krishna 274 121 94 12
Total 595 508 121 58
i. Unutilized potential of rice fallows and diversion from less remunerative crops.
42
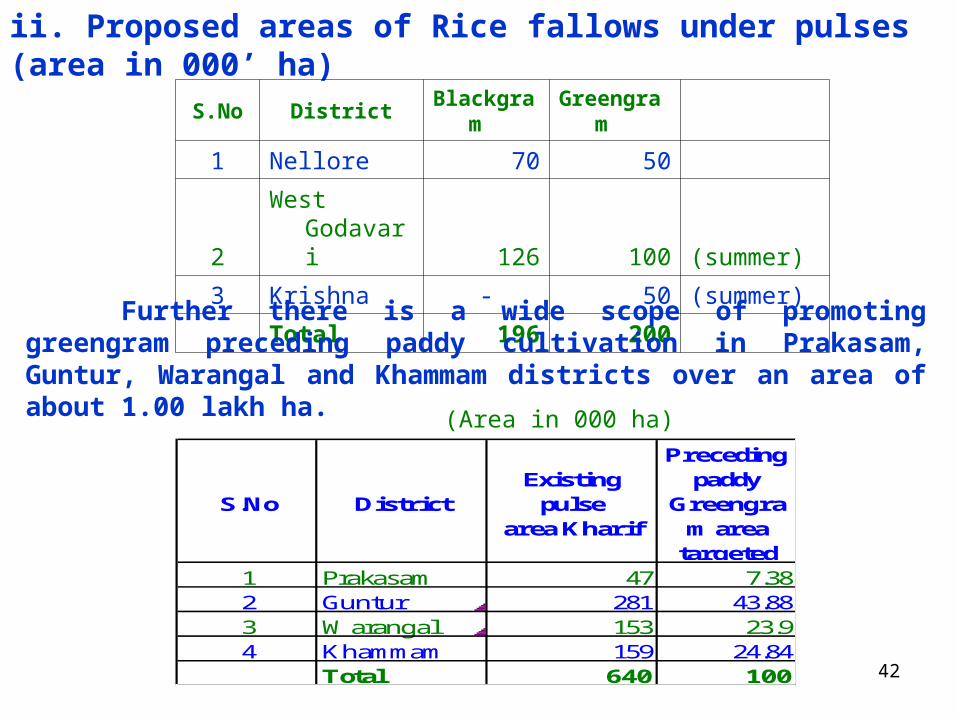
ii. Proposed areas of Rice fallows under pulses (area in 000’ ha)
S.No District Blackgram Greengram
1 Nellore 70 50
2 West Godavari 126 100 (summer)
3 Krishna - 50 (summer)
Total 196 200
Further there is a wide scope of promoting greengram preceding paddy cultivation in Prakasam, Guntur, Warangal and Khammam districts over an area of about 1.00 lakh ha.
S.No DistrictExisting
pulse area Kharif
Preceding paddy
Greengram area
targeted1 Prakasam 47 7.382 Guntur 281 43.883 Warangal 153 23.94 Khammam 159 24.84
Total 640 100
(Area in 000 ha)
43
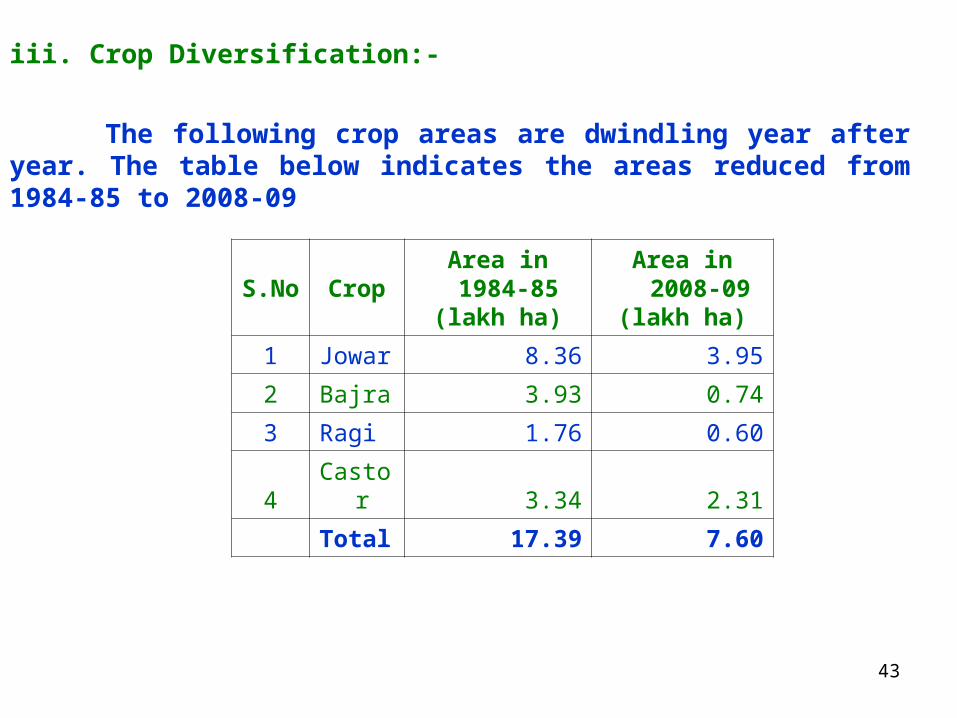
iii. Crop Diversification:-
The following crop areas are dwindling year after year. The table below indicates the areas reduced from 1984-85 to 2008-09
S.No CropArea in 1984-85
(lakh ha)Area in 2008-09
(lakh ha)
1 Jowar 8.36 3.95
2 Bajra 3.93 0.74
3 Ragi 1.76 0.60
4 Castor 3.34 2.31
Total 17.39 7.60

44
It is envisaged to divert the areas of less economical rainfed crops like Jowar, Bajra, Ragi, castor and even maize duly stabilizing maize area at about 6.30 lakh ha as indicated below
S.No CropNormal Area (000' ha)
Area proposed for diversification to Redgram
(000' ha)
Kharif Rabi Total Kharif Rabi Total
1 Jowar 161.52 233.83 395.35 52.00 0 52.00
2 Bajra 62.18 11.56 73.74 11.00 0 11.00
3 Ragi 52.32 7.48 59.80 15.00 0 15.00
4 Maize 530.21 225.47 755.68 125.00 0 125.00
5 Castor 231.20 0.00 231.20 37.00 0 37.00
Total 1037.43 478.34 1515.77 240.00 0 240.00

45
Goal of the Mission & Objectives• The over all goal of the Mission is to ensure a balance between the requirement and
production of pulses in the state for major pulse crops viz. Redgram, Greengram, Blackgram and Bengalgram.
Objectives:
• The main objectives of the mission are:
a) To improve the lot of rainfed farmers through pulse production.
b) To increase the area, productivity and production of major pulses i.e.
Redgram, Greengram, Blackgram and Bengalgram.
• To establish the Mission in partnership with stakeholders farmers’ groups /private /public institutions by ensuring end to end resources availability and by adopting improved INM and 1PM production technologies for accelerating the production of pulses
• To provide technical support by the extension staff throughout the growing season with a view to ensure effective dissemination of improved production technology to the farmers.
• To establish Village Based Seed System for self sufficiency in seeds on the same lines as that of Seed Village Scheme.

46
Need for the Mission
• The present normal production of pulses is 13.83 lakh tons.
• Under NFSM the target given is 16.00 lakh tons by end of XI plan.
• The present pulses requirement is estimated at 24.90 lakh tons during 2010 based on 26 kg per capita need per year as per NIN recommendation, similarly based on NCA recommendation @ 25 kg per head per year it is estimated at 24.00 lakh tons during 2010.
• Thus there is a gap of more than 10.00 lakh tons.
• Hence there is an urgent need to step up the production of pulses in order to meet the growing demand.
47
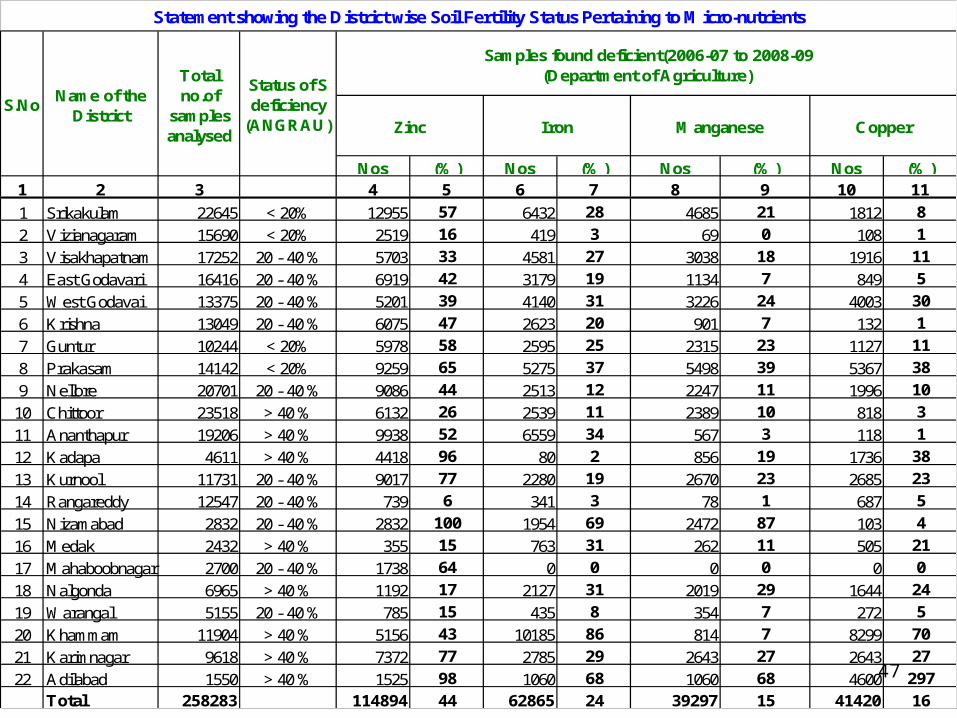
Nos (%) Nos (%) Nos (%) Nos (%)1 2 3 4 5 6 7 8 9 10 11
1 Srikakulam 22645 < 20% 12955 57 6432 28 4685 21 1812 8
2 Vizianagaram 15690 < 20% 2519 16 419 3 69 0 108 1
3 Visakhapatnam 17252 20 - 40 % 5703 33 4581 27 3038 18 1916 11
4 East Godavari 16416 20 - 40 % 6919 42 3179 19 1134 7 849 5
5 West Godavai 13375 20 - 40 % 5201 39 4140 31 3226 24 4003 30
6 Krishna 13049 20 - 40 % 6075 47 2623 20 901 7 132 1
7 Guntur 10244 < 20% 5978 58 2595 25 2315 23 1127 11
8 Prakasam 14142 < 20% 9259 65 5275 37 5498 39 5367 38
9 Nellore 20701 20 - 40 % 9086 44 2513 12 2247 11 1996 10
10 Chittoor 23518 > 40 % 6132 26 2539 11 2389 10 818 3
11 Ananthapur 19206 > 40 % 9938 52 6559 34 567 3 118 1
12 Kadapa 4611 > 40 % 4418 96 80 2 856 19 1736 38
13 Kurnool 11731 20 - 40 % 9017 77 2280 19 2670 23 2685 23
14 Rangareddy 12547 20 - 40 % 739 6 341 3 78 1 687 5
15 Nizamabad 2832 20 - 40 % 2832 100 1954 69 2472 87 103 4
16 Medak 2432 > 40 % 355 15 763 31 262 11 505 21
17 Mahaboobnagar 2700 20 - 40 % 1738 64 0 0 0 0 0 0
18 Nalgonda 6965 > 40 % 1192 17 2127 31 2019 29 1644 24
19 Warangal 5155 20 - 40 % 785 15 435 8 354 7 272 5
20 Khammam 11904 > 40 % 5156 43 10185 86 814 7 8299 70
21 Karimnagar 9618 > 40 % 7372 77 2785 29 2643 27 2643 27
22 Adilabad 1550 > 40 % 1525 98 1060 68 1060 68 4600 297
Total 258283 114894 44 62865 24 39297 15 41420 16
S.No
Samples found deficient(2006-07 to 2008-09 (Department of Agriculture)
Status of S deficiency
(ANGRAU)
Statement showing the District wise Soil Fertility Status Pertaining to Micro-nutrients
Zinc Iron Manganese Copper
Total no.of
samples analysed
Name of the District
48
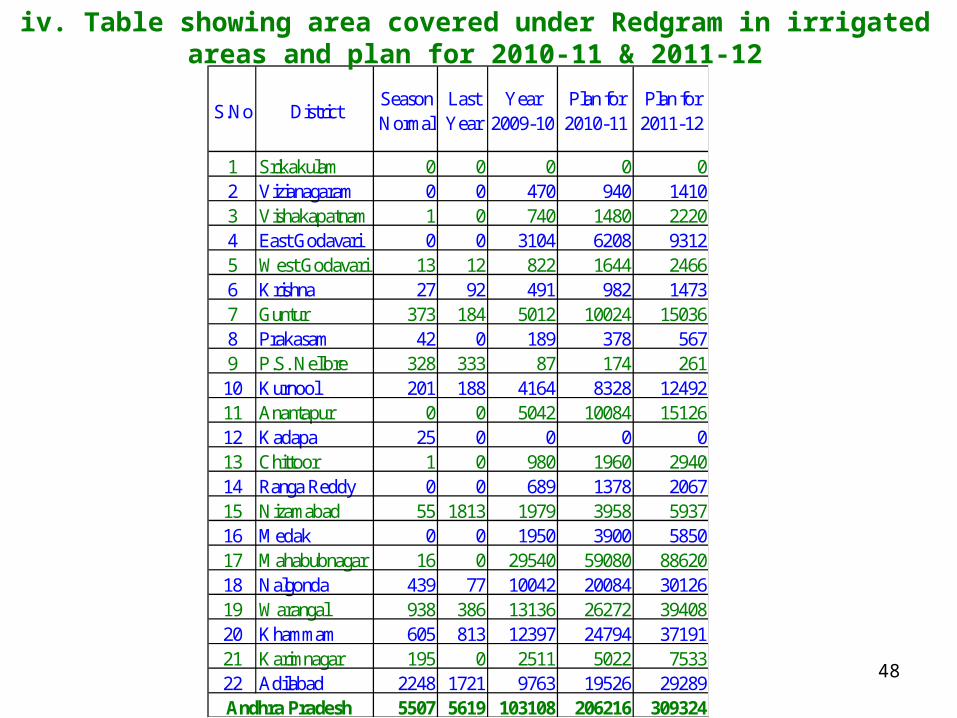
S.No DistrictSeasonNormal
Last Year
Year 2009-10
Plan for 2010-11
Plan for 2011-12
1 Srikakulam 0 0 0 0 02 Vizianagaram 0 0 470 940 14103 Vishakapatnam 1 0 740 1480 22204 East Godavari 0 0 3104 6208 93125 West Godavari 13 12 822 1644 24666 Krishna 27 92 491 982 14737 Guntur 373 184 5012 10024 150368 Prakasam 42 0 189 378 5679 P.S. Nellore 328 333 87 174 26110 Kurnool 201 188 4164 8328 1249211 Anantapur 0 0 5042 10084 1512612 Kadapa 25 0 0 0 013 Chittoor 1 0 980 1960 294014 Ranga Reddy 0 0 689 1378 206715 Nizamabad 55 1813 1979 3958 593716 Medak 0 0 1950 3900 585017 Mahabubnagar 16 0 29540 59080 8862018 Nalgonda 439 77 10042 20084 3012619 Warangal 938 386 13136 26272 3940820 Khammam 605 813 12397 24794 3719121 Karimnagar 195 0 2511 5022 753322 Adilabad 2248 1721 9763 19526 29289
5507 5619 103108 206216 309324Andhra Pradesh
iv. Table showing area covered under Redgram in irrigated areas and plan for 2010-11 & 2011-12
49
Pulses Overview
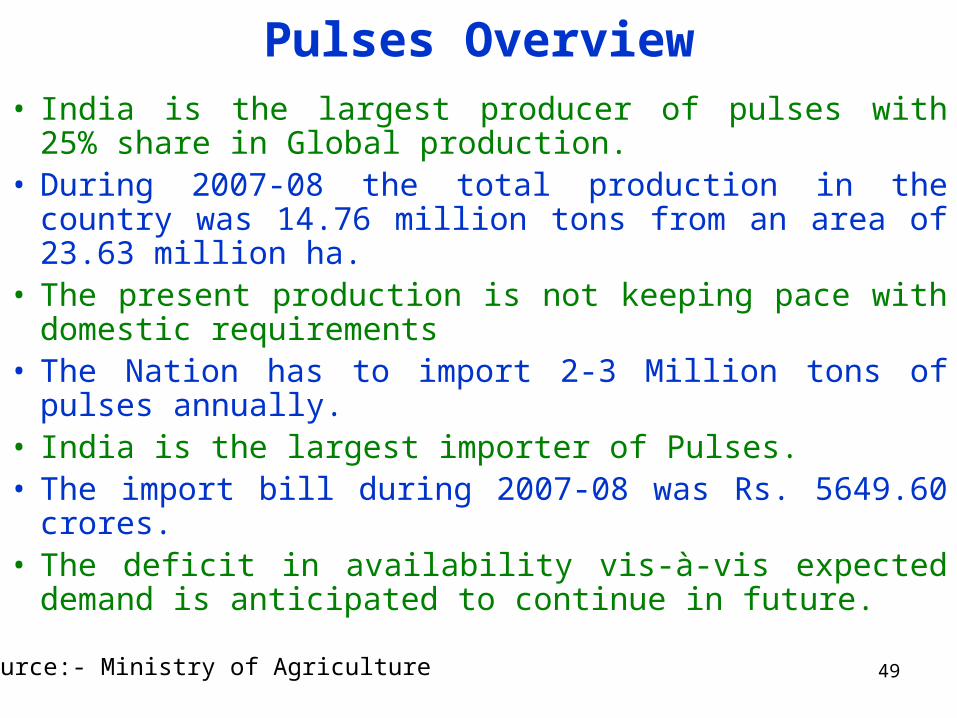
• India is the largest producer of pulses with 25% share in Global production.
• During 2007-08 the total production in the country was 14.76 million tons from an area of 23.63 million ha.
• The present production is not keeping pace with domestic requirements
• The Nation has to import 2-3 Million tons of pulses annually.
• India is the largest importer of Pulses. • The import bill during 2007-08 was Rs. 5649.60 crores.• The deficit in availability vis-à-vis expected demand is
anticipated to continue in future.
Source:- Ministry of Agriculture

50
Requirement of pulses in Andhra Pradesh (Based on Low cost balanced diet (sedentary man)
CommodityTotal
Requirement (lakh tons)
AverageProduction
(1991-2008) (lakh tons)
Production(2007-08)
(lakhtons)
Production(2008-09)
(lakhtons)
Excess / Shortfall
(lakh tons)as comparedProductionin 2007-08
Excess /Shortfall
(lakh tons)as comparedProductionin 2008-09
Redgram (whole) 9.38 1.58 3.02 2.02 -6.36 -7.36
Greengram (whole) 2.51 1.89 1.92 1.36 -0.59 -1.15
Blackgram (whole) 2.51 3.02 2.50 2.20 -0.01 -0.31
Bengalgram (whole) 0.78 2.65 9.12 8.57 +8.34 +7.79
Total Pulses 15.18 10.52* 16.97* 14.48* +1.79 -1.03
Need for the Mission
Source:- ANGRAU(* Including other pulses)
However under Perspective Plan formulated earlier, the pulses requirement was estimated at 24.90 lakh tons during 2010 based on 26 kg per capita need per year as per NIN recommendation, similarly based on NCA recommendation @ 25 kg per head per year it is estimated at 24.00 lakh tons during 2010.
Thus there is an urgent need to step up the production of pulses in order to meet the growing demand.
51
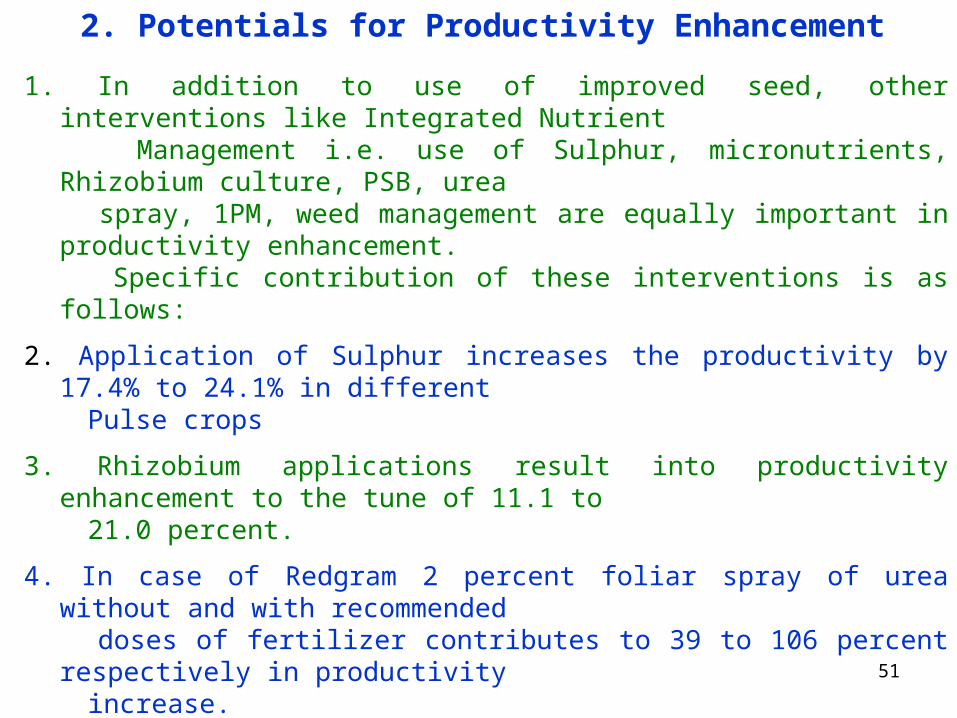
2. Potentials for Productivity Enhancement
1. In addition to use of improved seed, other interventions like Integrated Nutrient Management i.e. use of Sulphur, micronutrients, Rhizobium culture, PSB, urea spray, 1PM, weed management are equally important in productivity enhancement. Specific contribution of these interventions is as follows:
2. Application of Sulphur increases the productivity by 17.4% to 24.1% in different Pulse crops
3. Rhizobium applications result into productivity enhancement to the tune of 11.1 to 21.0 percent.
4. In case of Redgram 2 percent foliar spray of urea without and with recommended doses of fertilizer contributes to 39 to 106 percent respectively in productivity increase.
5. Yield increase through adoption of 1PM technology is 17.6 to 28.1 percent
6. Control of weeds results into yield increase of 18.30 to 40 percent
7. Planting on ridges gives 25.7 % higher yield and bed planting in black soils increases the productivity by 20-30%.
8. Micronutrients like zinc, boron and iron also have significant effect on productivity enhancement.

52
Table showing District wise, Crop wise Yield potential of different pulses in the state
Redgram Greengram Blackgram Bengalgram
1 Srikakulam 800 700 800 18002 East Godavari 700 600 600 17503 Krishna 1000 800 1500 20004 Guntur 1400 800 1200 25005 Prakasam 1100 800 1000 24006 Kurnool 900 600 800 20007 Kadapa 600 600 800 16008 Anantapur 600 600 0 17509 Nizamabad 1250 750 1000 2400
10 Mahabubnagar 900 500 800 180011 Nalgonda 900 700 750 180012 Warangal 1000 800 1000 120013 Khammam 900 800 1000 1800
14 Adilabad 1200 750 1000 200Sub Total 946 700 875 1786
15 Karimnagar 1000 700 800 160016 Medak 750 700 800 150017 Ranga Reddy 1150 650 800 160018 Vizianagaram 800 600 800 180019 Visakhapatnam 600 600 800 180020 West Godavari 700 750 700 021 Nellore 800 600 800 160022 Chittoor 500 600 600 1800
Sub Total 788 650 763 1463889 682 834 1668Andhra Pradesh
Non NFSM Districts
S.No DistrictPotential Yield (Kg / ha)
NFSM Districts
Source:- ANGRAU
53
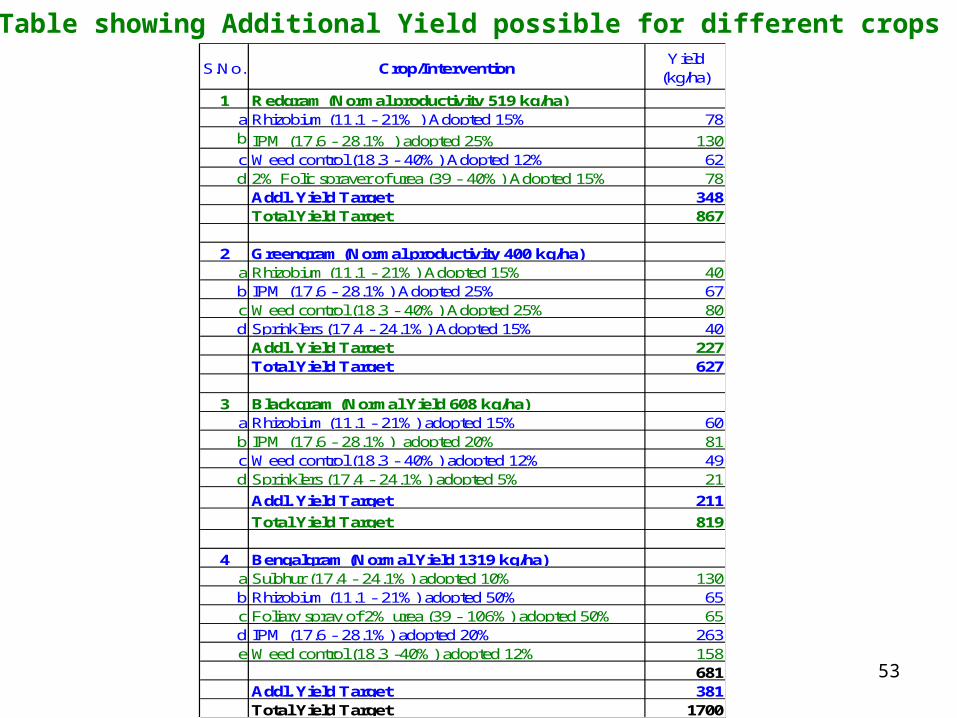
S.No. Crop/InterventionYield
(kg/ha)
1 Redgram (Normal productivity 519 kg/ha)a Rhizobium (11.1 - 21% ) Adopted 15% 78b IPM (17.6 - 28.1% ) adopted 25% 130c Weed control (18.3 - 40%) Adopted 12% 62d 2% Folic sprayer of urea (39 - 40%) Adopted 15% 78
Addl. Yield Target 348Total Yield Target 867
2 Greengram (Normal productivity 400 kg/ha)a Rhizobium (11.1 - 21%) Adopted 15% 40b IPM (17.6 - 28.1%) Adopted 25% 67c Weed control (18.3 - 40%) Adopted 25% 80d Sprinklers (17.4 - 24.1%) Adopted 15% 40
Addl. Yield Target 227Total Yield Target 627
3 Blackgram (Normal Yield 608 kg/ha)a Rhizobium (11.1 - 21%) adopted 15% 60b IPM (17.6 - 28.1%) adopted 20% 81c Weed control (18.3 - 40%) adopted 12% 49d Sprinklers (17.4 - 24.1%) adopted 5% 21
Addl. Yield Target 211
Total Yield Target 819
4 Bengalgram (Normal Yield 1319 kg/ha)a Sulphur (17.4 - 24.1%) adopted 10% 130b Rhizobium (11.1 - 21%) adopted 50% 65c Foliary spray of 2% urea (39 - 106%) adopted 50% 65d IPM (17.6 - 28.1%) adopted 20% 263e Weed control (18.3 -40%) adopted 12% 158
681Addl. Yield Target 381Total Yield Target 1700
Table showing Additional Yield possible for different crops
54
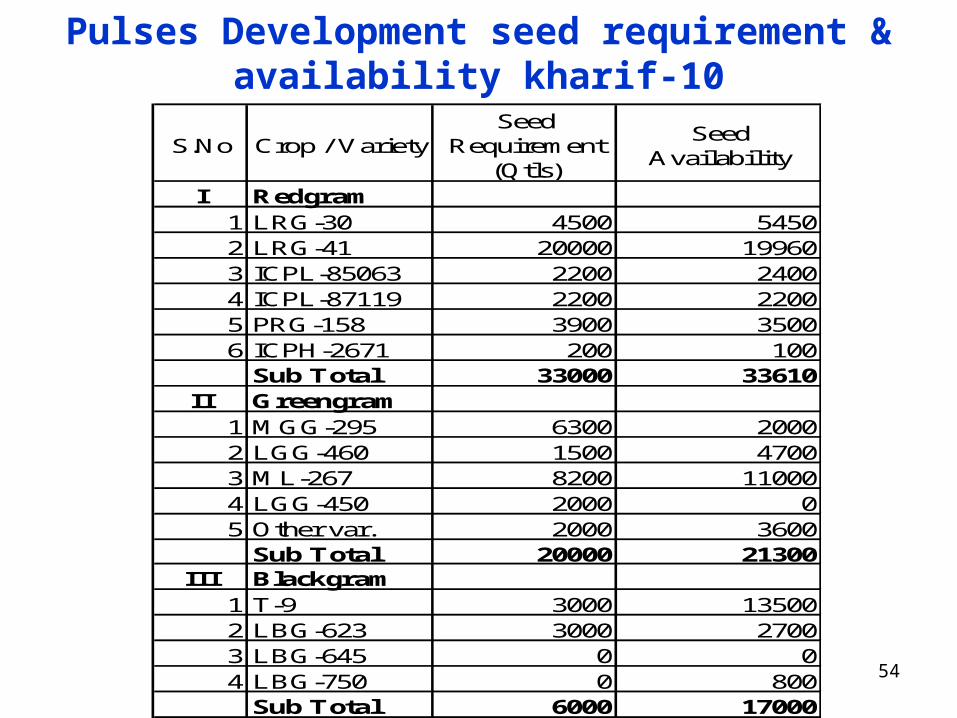
S.No Crop / VarietySeed
Requirement (Qtls)
Seed Availability
I Redgram1 LRG-30 4500 54502 LRG-41 20000 199603 ICPL-85063 2200 24004 ICPL-87119 2200 22005 PRG-158 3900 35006 ICPH-2671 200 100
Sub Total 33000 33610II Greengram
1 MGG-295 6300 20002 LGG-460 1500 47003 ML-267 8200 110004 LGG-450 2000 05 Other var. 2000 3600
Sub Total 20000 21300III Blackgram
1 T-9 3000 135002 LBG-623 3000 27003 LBG-645 0 04 LBG-750 0 800
Sub Total 6000 17000
Pulses Development seed requirement & availability kharif-10

55
Paddy seed requirement & availability kharif-10
S.No Crop / VarietySeed
Requirement (Qtls)
Seed Availability
I Paddy1 BPT-5204 358308 4280002 MTU-1010 100000 1617003 MTU-1001 55000 171004 MTU-7029 50000 509005 JGL-1798 34112 450006 Tellahamsa 17500 210007 BPT-3291 13000 134008 RGL-2537 11000 112009 ADT-37 11000 11674
10 NLR-34449 10000 2000011 MTU-1061 9000 990012 Other var. 31080 37935
Paddy Total 700000 827809
56
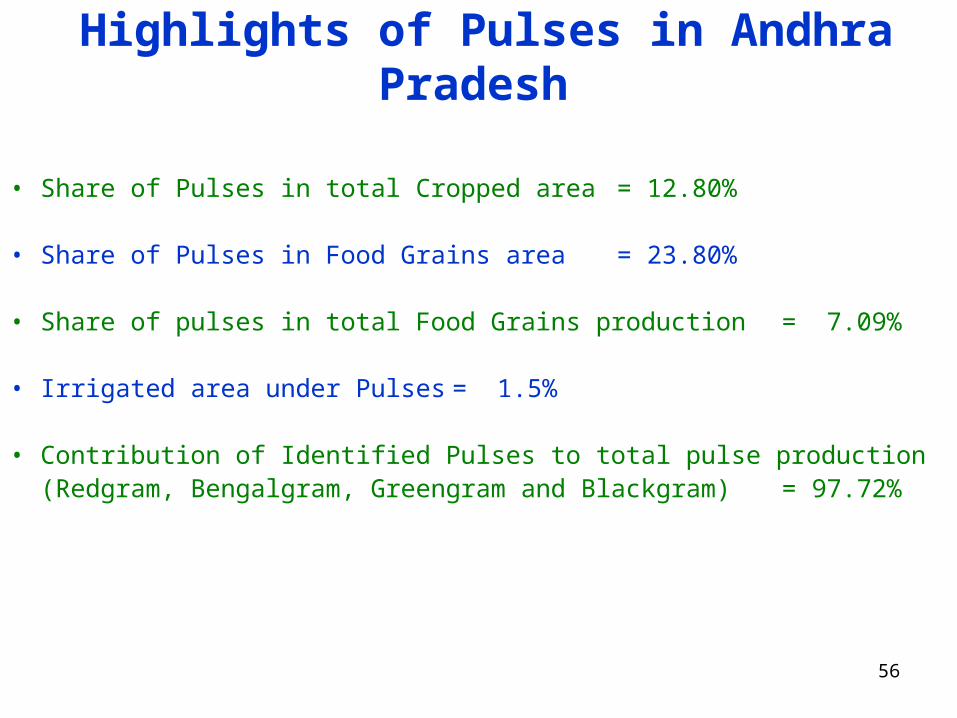
Highlights of Pulses in Andhra Pradesh
• Share of Pulses in total Cropped area = 12.80%
• Share of Pulses in Food Grains area = 23.80%
• Share of pulses in total Food Grains production = 7.09%
• Irrigated area under Pulses = 1.5%
• Contribution of Identified Pulses to total pulse production (Redgram, Bengalgram, Greengram and Blackgram) = 97.72%
57
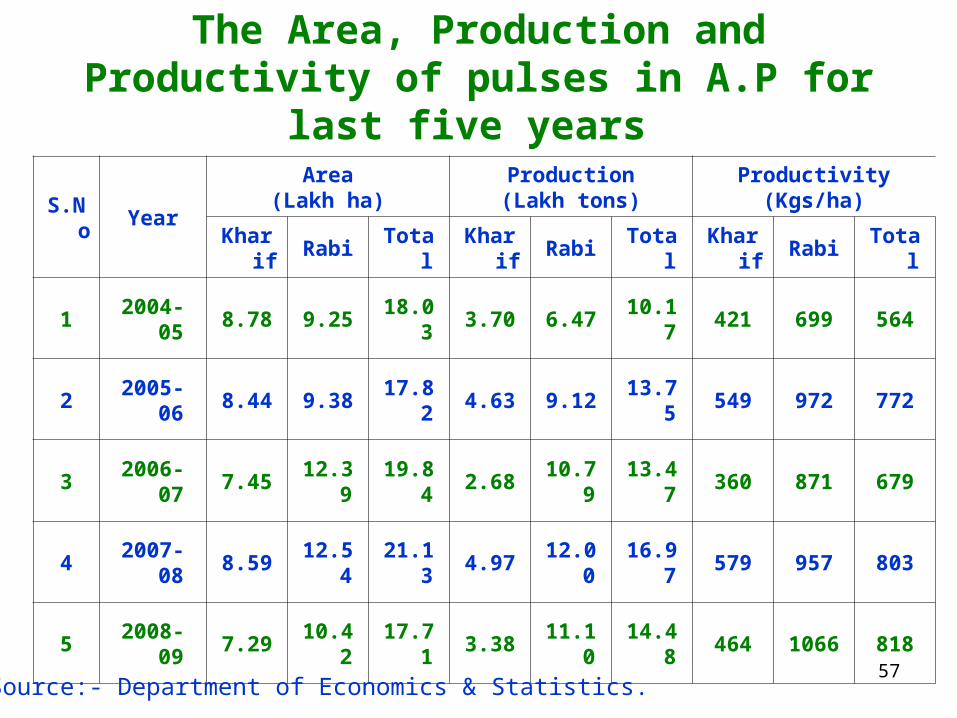
The Area, Production and Productivity of pulses in A.P for last five years
S.No Year
Area(Lakh ha)
Production(Lakh tons)
Productivity(Kgs/ha)
Kharif Rabi Total Kharif Rabi Total Kharif Rabi Total
1 2004-05 8.78 9.25 18.03 3.70 6.47 10.17 421 699 564
2 2005-06 8.44 9.38 17.82 4.63 9.12 13.75 549 972 772
3 2006-07 7.45 12.39 19.84 2.68 10.79 13.47 360 871 679
4 2007-08 8.59 12.54 21.13 4.97 12.00 16.97 579 957 803
5 2008-09 7.29 10.42 17.71 3.38 11.10 14.48 464 1066 818
Source:- Department of Economics & Statistics.
58
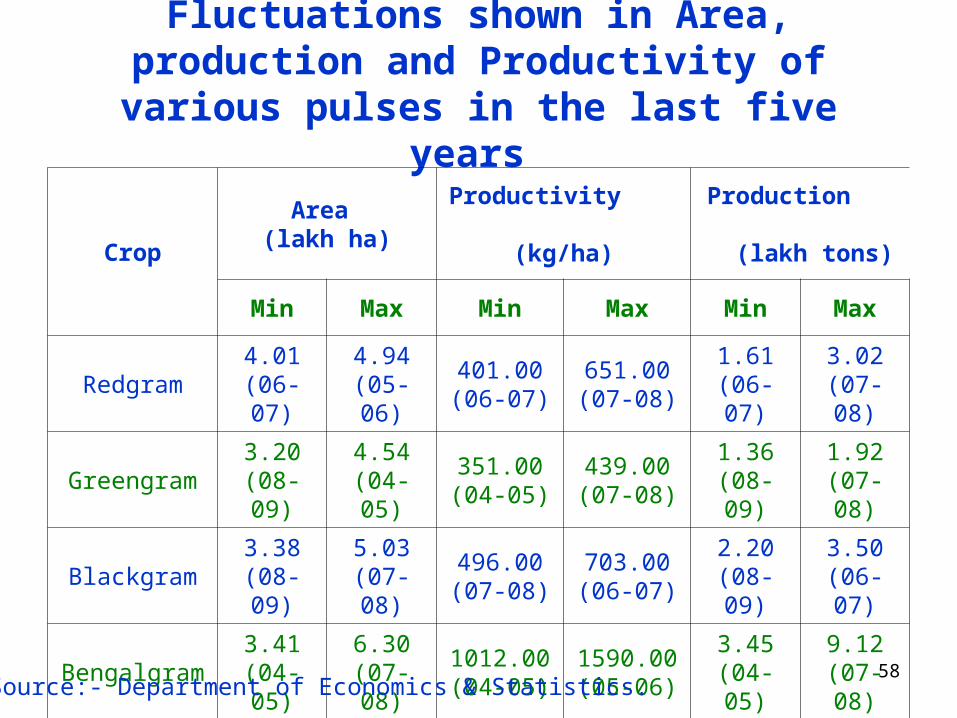
Fluctuations shown in Area, production and Productivity of various pulses in the last five years
Crop
Area (lakh ha)
Productivity (kg/ha)
Production (lakh tons)
Min Max Min Max Min Max
Redgram4.01
(06-07)4.94
(05-06)401.00(06-07)
651.00(07-08)
1.61(06-07)
3.02(07-08)
Greengram3.20
(08-09)4.54
(04-05)351.00(04-05)
439.00(07-08)
1.36(08-09)
1.92(07-08)
Blackgram3.38
(08-09)5.03
(07-08)496.00(07-08)
703.00(06-07)
2.20(08-09)
3.50(06-07)
Bengalgram3.41
(04-05)6.30
(07-08)1012.00(04-05)
1590.00(05-06)
3.45(04-05)
9.12(07-08)
Source:- Department of Economics & Statistics.