Embed Size (px)
Citation preview

1
Web Performance Modeling
Chapter 10

2
New Phenomena in the Internet and WWW
• Self-similarity - a self-similar process looks bursty across several time scales.
• Heavy-tailed distributions in workload characteristics, that means a very large variability in the values of the workload parameters.

3
WWW Traffic Burst
106
107
Bytes
Chronological time (slots of 1000 sec)

4
Incorporating New Phenomena in the Workload Characterization
Burstiness Modeling• burstiness in a given period can be represented by a pair of
parameters (a,b)
– a is the ratio between the maximum observed request rate and the average request rate during the period.
– b is the fraction of time during which the instantaneous arrival rate exceeds the average arrival rate.

5
Burstiness Modeling
• Consider an HTTP LOG composed of L requests to a Web server.
: time interval during which the requests arrive
: average arrival rate, = L / • The time interval is divided into n equal subintervals of
duration / n called epochs
• Arr(k) number of HTTP requests that arrive in epoch k
k arrival rate during epoch k

6
Burstiness Modeling
• Arr+ total number of HTTP requests that arrive in epochs in which k >
• b = (number of epochs for which k > ) / n
• above-average arrival rate, + = Arr+ / (b*)
• a = + / = Arr+ / (b*L)
7
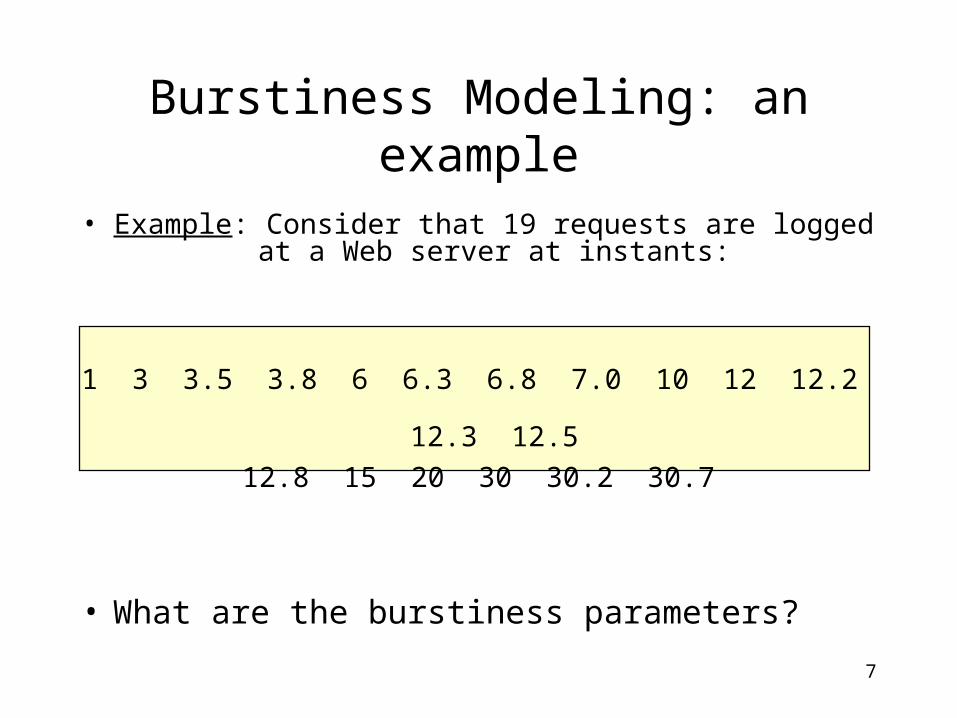
Burstiness Modeling: an example
• Example: Consider that 19 requests are logged at a Web server at instants:
1 3 3.5 3.8 6 6.3 6.8 7.0 10 12 12.2 12.3 12.5
12.8 15 20 30 30.2 30.7
• What are the burstiness parameters?

8
Burstiness Modeling: an example
• Let us consider the number of epochs n=21
• Each epoch has a duration of / n = 31 /21 = 1.48
• The average arrival rate = 19/31 = 0.613 req./sec
• The number of arrivals in each of the 21 epochs are: 1, 0, 3, 0, 4, 0, 1, 0, 4, 0, 1, 0, 0, 1, 0, 0, 0, 0, 0, 0, 4
• Thus, 1 = 1/1.48 = 0.676, that exceeds the avg. = 0.613
• In 8 of the 21 epochs, k exceeds
• b = 8 / 21 = 0.381
• a = Arr+ / (b*L) = 19 / (0.381 * 19) = 2.625

9
The Impact of Burstiness
• As shown in some studies, the maximum throughput of a Web server decreases as the burstiness factors increase.
• How can we represent in performance models the effects of burstiness?
• We know that the maximum throughput is equal to the inverse of the maximum service demand or the service demand of the bottleneck resource.

10
The Impact of Burstiness• To account for the burstiness effect, we write the service demand of the
bottleneck resource as:
– D = Df + b
– Df is the portion of the service demand that does not depend
on burstiness
is a factor used to inflate the service demand according to
burstiness factor b. It is given by:
= (U1/X10 - U2/X2
0)/(b1-b2)
– The measurement interval is divided into 2 subintervals 1
and 2 to obtain Ui, Xi0, and bi

11
The Impact of Burstiness: an example
• Consider the HTTP LOG of the previous slides. During 31 sec in which the 19 requests arrived, the CPU was found to be the bottleneck. What is the burstiness adjustment that should be applied to the CPU service demand to account for the burstiness effect on the performance of the Web server?
• The number of requests during each 15.5 sec subinterval is 14 and 5, respectively.
• The measured CPU utilization in each interval was 0.18 and 0.06

12
The Impact of Burstiness: an example (2)
• The throughput in each interval is:– X1
0 = 14/15.5 = 0.903
– X20 = 5/15.5 = 0.323
• Using the previous algorithm:– b1 = 0.273, b2 = 0.182
= (0.18/0.903 - 0.06/0.323)/(0.273-0.182) = 0.149
– the adjustment factor is: × b = 0.149 × 0.381 = 0.057
• Assuming Df = 0.02 sec, we are able to calculate the maximum server throughput as a function of the burstiness factor (b).

13
The Impact of Burstiness: an example (2)
0
10
20
30
40
50
60
Burstiness factor
Max
imu
m. T
hro
ug
hp
ut
0.30.10.0 0.2

14
Incorporating New Phenomena in the Workload Characterization
Accounting for Heavy Tails in the Model
• Due to the large variability of the size of documents, average results for the whole population would have very little statistical meaning.
• Categorizing the requests into a number of classes, defined by ranges of document sizes, improves the accuracy and significance of performance metrics.
• Multiclass queuing network models, with classes associated with requests for docs of different size.
15
Accounting for Heavy Tails: an example (1)
• The HTTP LOG of a Web server was analyzed during 1 hour. A total of 21,600 requests were successfully processed during the interval.
• Let us use a multiclass model to represent the server.
• There are 5 classes in the model, each corresponding to the 5 file size ranges.

16
Accounting for Heavy Tails: an example (2)
• File Size Distributions.
Class File Size Range(KB)
Percent of Requests
1 Size < 5 25
2 5 size 50 40
3 50 size 100 20
4 100 size 500 10
5 size 500 5

17
Accounting for Heavy Tails: an example (3)
• The arrival rate for each class r is a fraction of the overall arrival rate = 21,600/3,600 = 6 requests/sec.
1 = 6 0.25 = 1.5 req./sec
2 = 6 0.40 = 2.4 req./sec
3 = 6 0.20 = 1.2 req./sec
4 = 6 0.10 = 0.6 req./sec
5 = 6 0.05 = 0.3 req./sec

18
Client Side Models
• Questions to answer for clients capacity– Bandwidth of the link to ISP– Bandwidth of the LAN– No Cache proxy server – Cache proxy server

19
Client Side ModelsNo cache proxy server case
Internet
Router
Client 1 Client M
Webserver Webserver
LAN

20
Client Side ModelsNo cache proxy server case
1 2 3 4
5
6
Incoming link
Internetweb server
Outgoing link
Router
LANClients

21
Client Side ModelsNo cache proxy server case
Dcl = 1/Browser Rate 8 x [m + Overhead (m)] Network Time (m) = 10 x LANBandwidth
Overhead (m) = TCP Ovhd + Ndatagrams (m) x (IPOvhd + FrameOvhd) = 20 + NDatagrams (m) x (20 + FrameOvhd)
6

22
Client Side ModelsNo cache proxy server case
m + TCPOvhddatagrams (m) = MaxPDU - IPOvhd
DLAN = NetworkTime (AVGSizeHTTP request) + NetworkTime (1,024 x DocmentSize)
Drouter = [Ndatagrams (1,024 x DocumentSize + 7] x RouterLatency X 10
Dint = 1.5 x InternetDelayRTT/1,000 + DocumentSize/InternetDataRate

23
Client Side ModelsNo cache proxy server case
8x [AvgSizeHTTPRequest + 5 x (20 +20)]DOutL = 1,024 x LinkBandwidth
8 x (1,0224 x DocumentSize + LinkOvhdDinL = 1,024 LinkBandwidth
1,024 x DocumentSizeLinkOvhd = X (TCPOvhd + IPOvhd) 65,535
1,024 x DocumentSize = x 40 65,535

24
Client Side ModelsNo cache proxy server case
Example 10.4

25
Client Side Models Cache proxy server case
Internet
Router
Client 1 Client M
Webserver Webserver
Proxy Cache server
LAN

26
Client Side Models Cache proxy server case
• Request from clients go first to cache proxy server
• Cache Hit if document found in cache
• Cache Miss Document not found in cache– Proxy server acts as client, connects to web server,
requests the document, stores it into its cache, the returns it to client.
– Proxy overhead for cache misses caused slow down of document retrieval by a factor of two
27
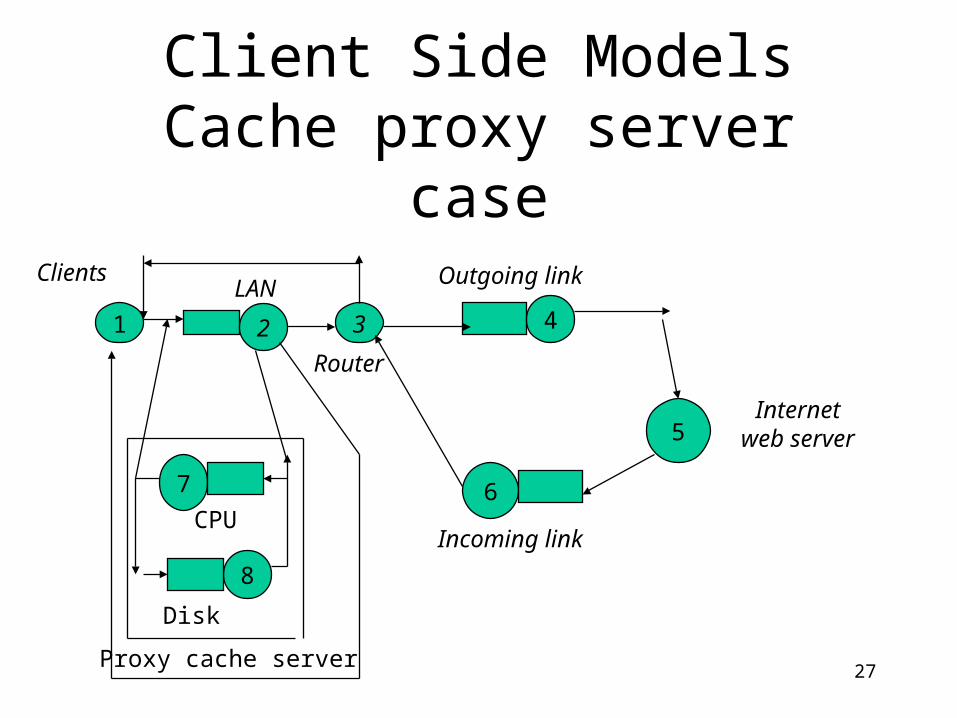
Client Side ModelsCache proxy server case
1 2 3 4
5
6
Incoming link
Internetweb server
Outgoing link
Router
LANClients
7
8
CPU
Disk
Proxy cache server

28
Client Side ModelsCache proxy server case
• Additional parameter for proxy model– Phit Fraction of requests that can be served from
proxy server cache– HitCPUTime - CPU time in seconds needed to
process the request at the proxy server– MissCPUTime - CPU time in seconds to process
a request at proxy, request from originating server, store it into the cache, send the docoment to client.
– DiskTime - disk time per kb at the cache proxy in milliseconds

29
Client Side ModelsCache proxy server case
• Dlan = Phit x Dlan + (1- Phit) x 2 x Dlan
• = (2 - Phit ) x Dlan• Drouter = (1 - Phit ) x Drouter• DOutL = (1 - Phit ) x DOutL• Dint = (1 - Ph it ) x Dint • DInL = (1 - Ph it ) x DInL
p
p
p
p
p

30
Client Side ModelsCache proxy server case
• Dcpu = Phit x HitCPUTime + (1 - Phit) x
• MissCPUTime
• Ddisk = DiskTime x DocumentSize / 1,000
p
p
31
Client Side ModelsCache proxy server case
Examples 10.5 and 10.6

32
Server Side Models
• Questions to be answered for Servers– Bandwidth of the link from web server to
internet– Mirror sites? How many?– Redundant Array of Inexpensive Computers
(RAIC) or single powerful server– Assessment of relocating documents within the
web server

33
Server Side Models(cont.)
• Questions– Replication popular documents strategies– File placement on disk– Compression– CGI scripts or Java applets?– Compiled or interpreted CGI scripts– etc. etc.

34
Server Side Models(cont.)
• Single Web Server
• Mirrored Web Servers

35
Single Web Server
Web server
Internet
Client Client
LAN Router
36
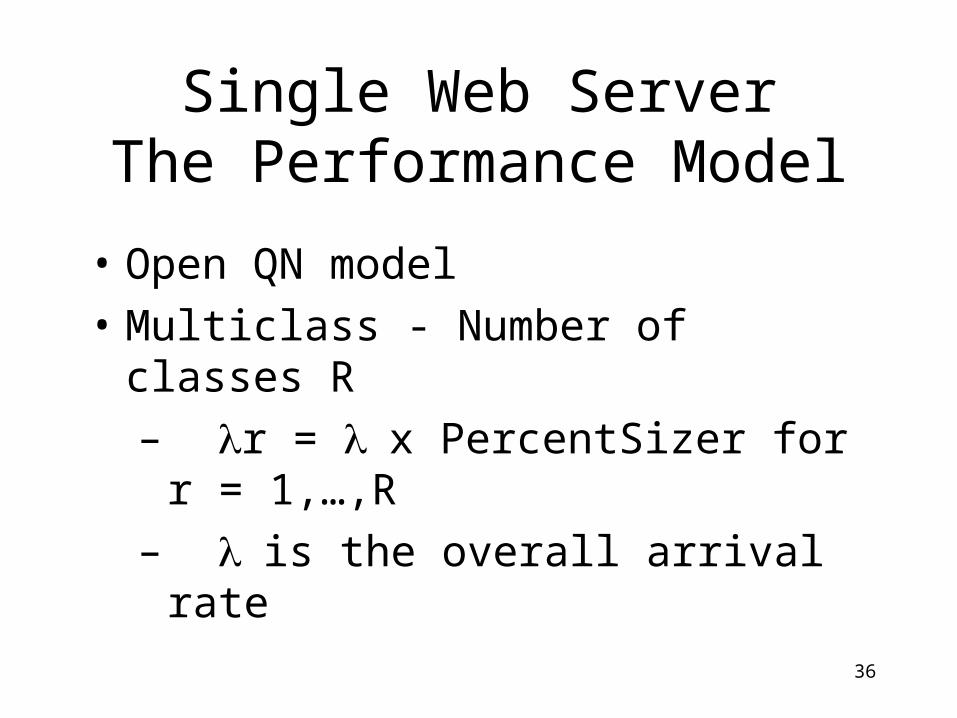
Single Web ServerThe Performance Model
• Open QN model
• Multiclass - Number of classes R
– r = x PercentSizer for r = 1,…,R
– is the overall arrival rate
37
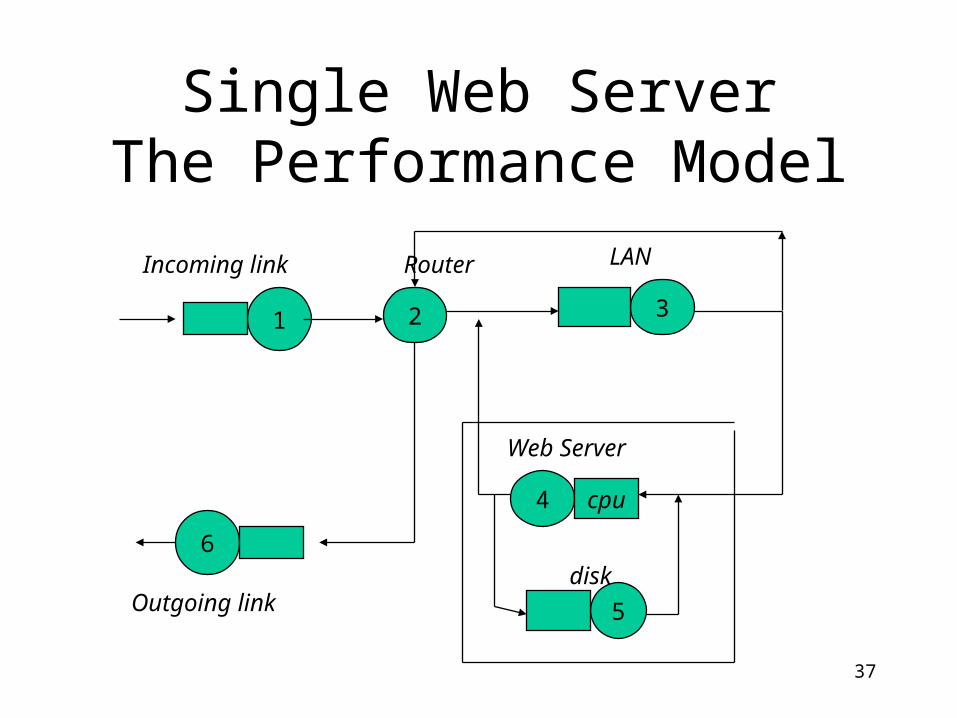
Single Web ServerThe Performance Model
1 2 3
6
4 cpu
5
Incoming link Router LAN
Web Server
Outgoing linkdisk

38
Single Web ServerThe Performance Model
• Additional Parameters
– CPUTimePerHTTPRequestr• Total CPU time, in seconds, to process one HTTP
request of class r
– DiskTime• Disk time per kb transferred, in milliseconds

39
Single Web ServerThe Performance Model
• Text book pages 239 to 243 • Examples 10.7 and 10.8

40
Mirrored Web Serverswith a shared file system
Web server n
Internet
Client Client
LAN Router
Webserver 1
File server
41
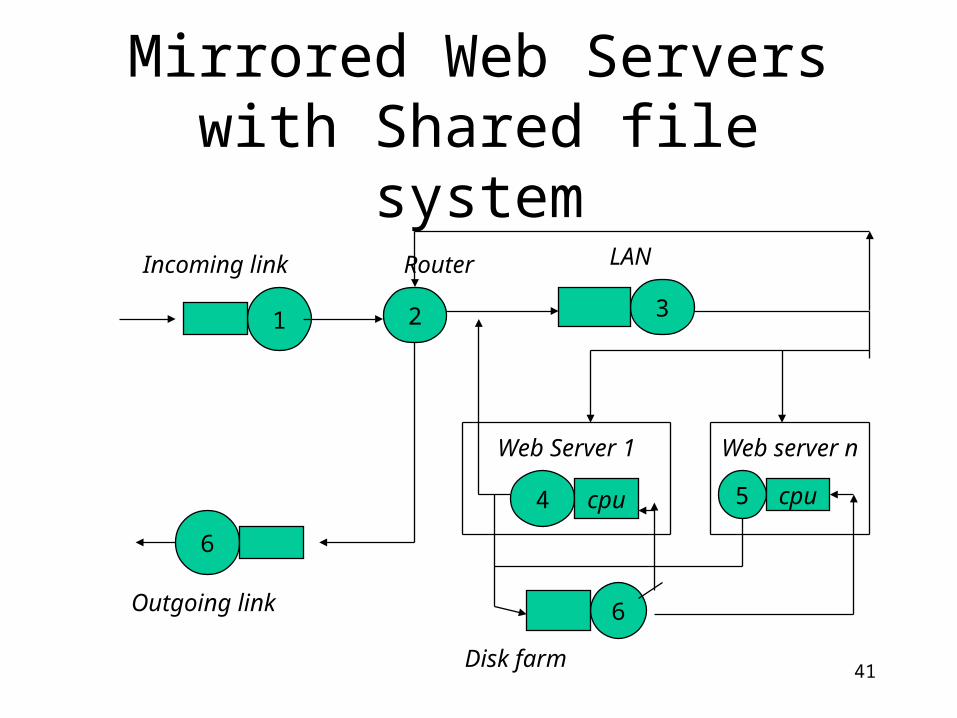
Mirrored Web Serverswith Shared file system
1 2 3
6
4 cpu
6
Incoming link Router LAN
Web Server 1
Outgoing link
Disk farm
5 cpu
Web server n
42
Mirrored Web Serverswith Shared file system
Text book pages 243 - 246
Examples 10.9 and 10.10
43
Summary Chapter 10
• How to account for burstiness of web traffic
• Multiclass models for heavy-tailed
• Client-side model analyzed with closed QN
• Server-side models with open multicalss