Embed Size (px)
Citation preview

1
Web-Based Data Archive, Monitoring, and Mining Tool
Jeffrey A. Melby, PhD
USACE ERDC
Coastal and Hydraulics Lab
5-5-11
CSTORM-DB/VS
2
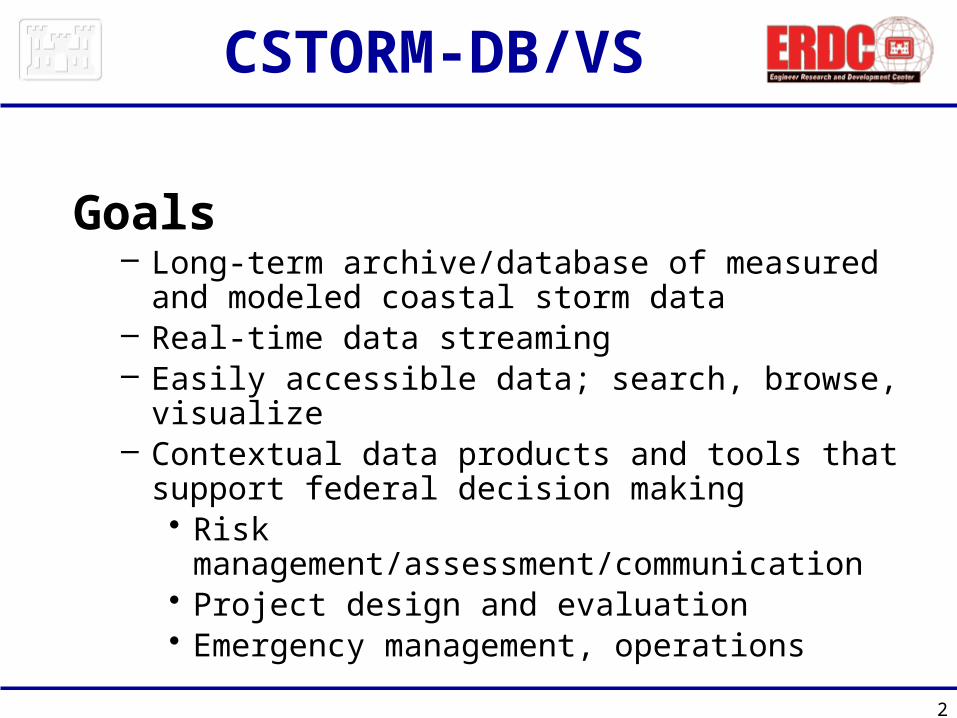
CSTORM-DB/VS
Goals – Long-term archive/database of measured and
modeled coastal storm data– Real-time data streaming– Easily accessible data; search, browse, visualize– Contextual data products and tools that support
federal decision making• Risk management/assessment/communication• Project design and evaluation• Emergency management, operations

3
CSTORM-DB/VS
Coastal Storm Database
CSTORM-VS Web App with Google Earth Plug-In
Coastal Storm HDF5 Archive
USACE KML and Data Servers
CSTORM Data Processing and Visualization
System
CSTORM-DB Storm Server
External KML and Data Servers
Desktop PCPersonal Google Earth App

4
Proof-Of-Concept System, 2010
• Storm mining tool with Google Earth interface to data and products• 43 TB RAID NAS for archive• HDF5 archive of meteorological, ADCIRC/STWAVE data
– Structure, deflator/inflator tools, metadata search tools– Model grid, bathymetry, setup, input, output, results– Gulf of Mexico LACPR, MSCIP hurricanes– Historical measured waves, water levels, met data
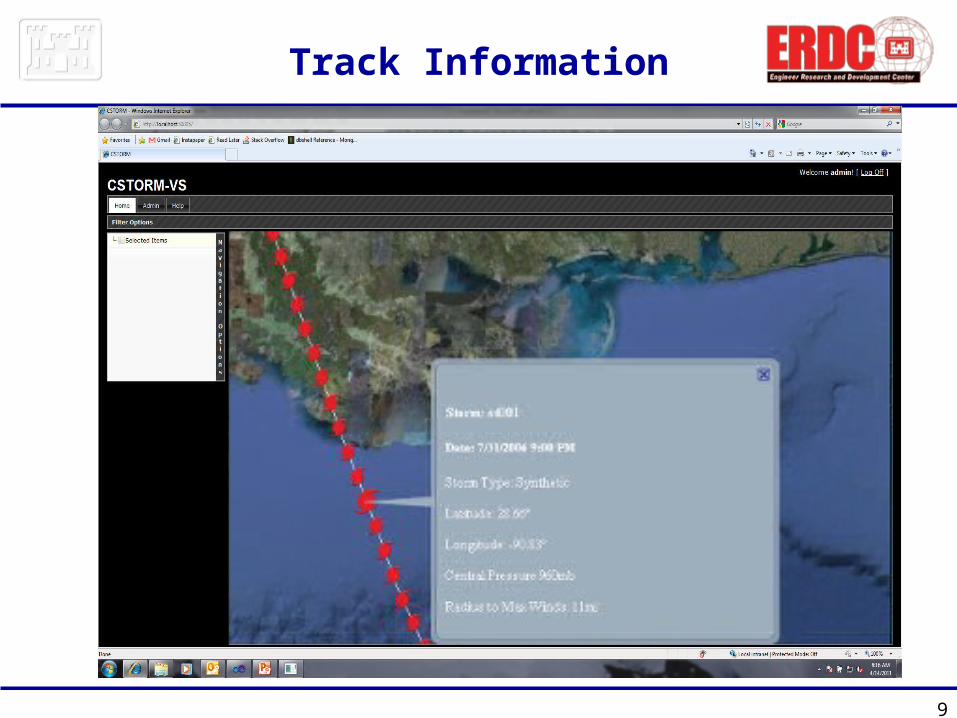
• Database– Summary information for hurricanes - hurricane track, pressure, wind,
wave, max wind, max wave and max water level data – Example graphical products: wind, wave, water level color fill contour
maps, tracks, vector plots – 3 storms– Animations of color-fill contour maps – 3 storms– Fast search and extraction capability of summary storm info– Save points from model time series, 2D plotting of time series
• Storm query tool based on landfall location, min central pressure, wind speed• Web links: NOAA/USGS/USACE gage data, real-time data• Any KML: New Orleans levee GIS and BFE water level contour
CSTORM-DB/VS

5
Data Archive
HDF5 Archive: Compact efficient storage of SMS, CSTORM-MS modeled data(setup, input, results). Fast search, import and export capability.

6
Home Screen

Adding Stations

Station Information
View Plots, Data
9
Max. Water Elevation
Max. Velocity
Max. Wind Velocity
Water Elevation
Track Information

Layers
Bathymetry
Model Grid
Data Stations
Live Stations
Storm Tracks
Refresh
Update Live Stations
Layer
Options
Storm Options
Max. Water Elevation
Max. Velocity
Max. Wind Velocity
Water Elevation
Storm001
Refresh
>
Contour plots

Display
Plot
Value
Vector
FavoritesStations
--
+ Storms
East BankWest BankNew CanalShell BeachGrand IsleMS River EastMS River WestAmerada PassStation New
20
26
10
ParametersWater Level
PredictedMeasured
-
Precipitation
Waves-
Winds-
Display
Plot
Value
Vector
Wave HeightWave DirectionPeak Wave PeriodAverage Wave Period
Wind SpeedWind DirectionRate of Change
Refresh
30
12
12
Update Live Stations20 minutes since last update…..
Update Stations
KML files, real-time measurements

12
FY11 Capabilities
• Archive: – HDF5 data archive to include measured data, wind fields,
modeled storms, metadata, data standards– XMDF (ERDC HDF5 standard) compatibility with SMS, etc
• Administration Module: – Archive/database viewing, importing, exporting, and general
data management• Database
– Mongo-DB– 12-day storm time series of all synoptic parameters
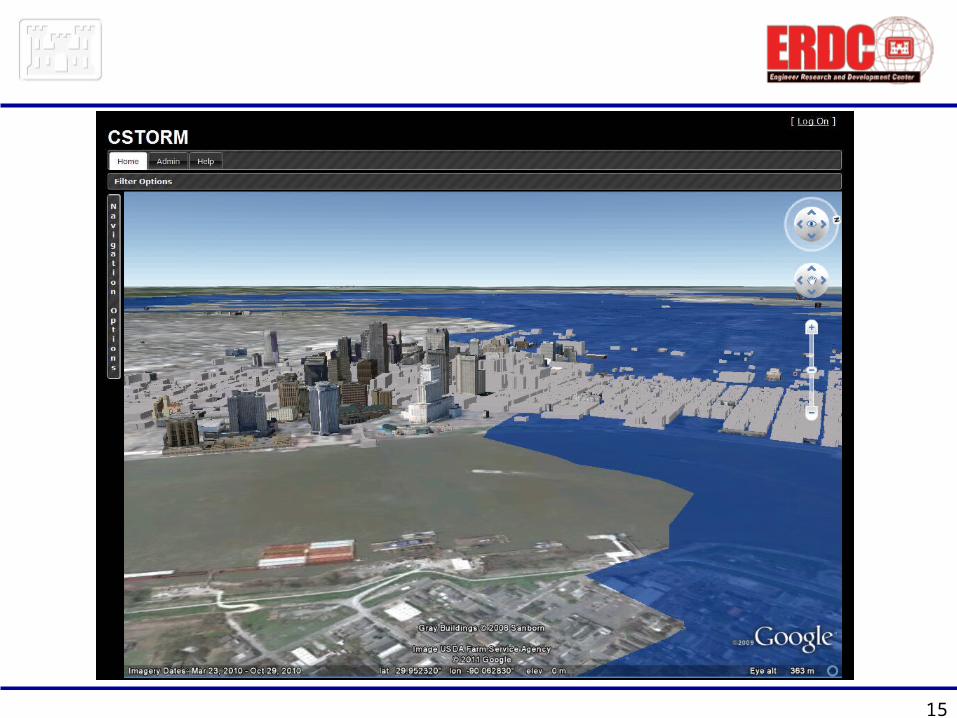
• User Interface Module: web app with layered GUI surrounding Google Earth plugin
• Data storage hardware system• Publish tool to USACE web portal
13
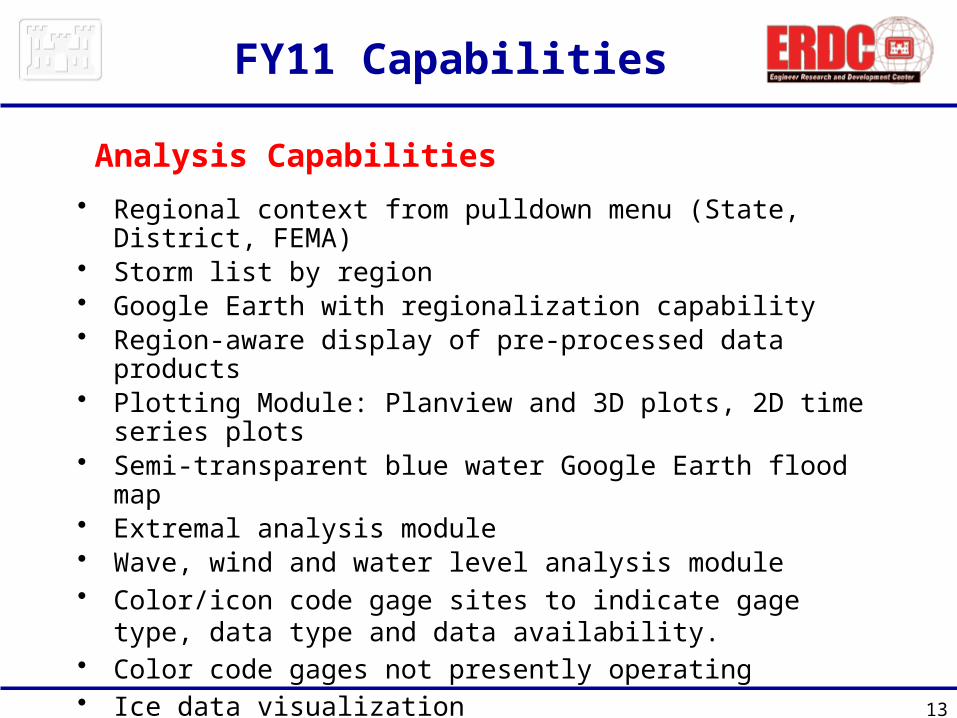
FY11 Capabilities
• Regional context from pulldown menu (State, District, FEMA)• Storm list by region• Google Earth with regionalization capability• Region-aware display of pre-processed data products• Plotting Module: Planview and 3D plots, 2D time series plots• Semi-transparent blue water Google Earth flood map • Extremal analysis module• Wave, wind and water level analysis module • Color/icon code gage sites to indicate gage type, data type and
data availability. • Color code gages not presently operating• Ice data visualization
Analysis Capabilities
14
FY11 Capabilities
• FEMA Reanalysis Data – Region V (Great Lakes)– Region IV, VI, VII (GoM)– Region III
• South Pacific SWIMS Data • Storm summary for all coasts (HURDAT, new summary)• PBL, CFSR, other modeled meteorological data• ADCIRC (pre and post-coupled), STWAVE, WAM…• Historical measurements (waves, Met, WLs, stream flow) • Ice• General storm-specific information
Data
15