Embed Size (px)
Citation preview
1
Troubleshooting Chronic Troubleshooting Chronic Conditions in Large IP NetworksConditions in Large IP Networks
Ajay MahimkarAjay Mahimkar, Jennifer Yates, Yin Zhang,, Jennifer Yates, Yin Zhang,Aman Shaikh, Jia Wang, Zihui Ge, Cheng Tien EeAman Shaikh, Jia Wang, Zihui Ge, Cheng Tien Ee
UT-Austin and AT&T Labs-ResearchUT-Austin and AT&T [email protected]@cs.utexas.edu
ACM CoNEXT 2008ACM CoNEXT 2008
2
Network ReliabilityNetwork Reliability
• Applications demand high reliability and performance – VoIP, IPTV, Gaming, … – Best-effort service is no longer acceptable
• Accurate and timely troubleshooting of network outages required– Outages can occur due to mis-configurations, software
bugs, malicious attacks• Can cause significant performance impact • Can incur huge losses
3
Hard FailuresHard Failures
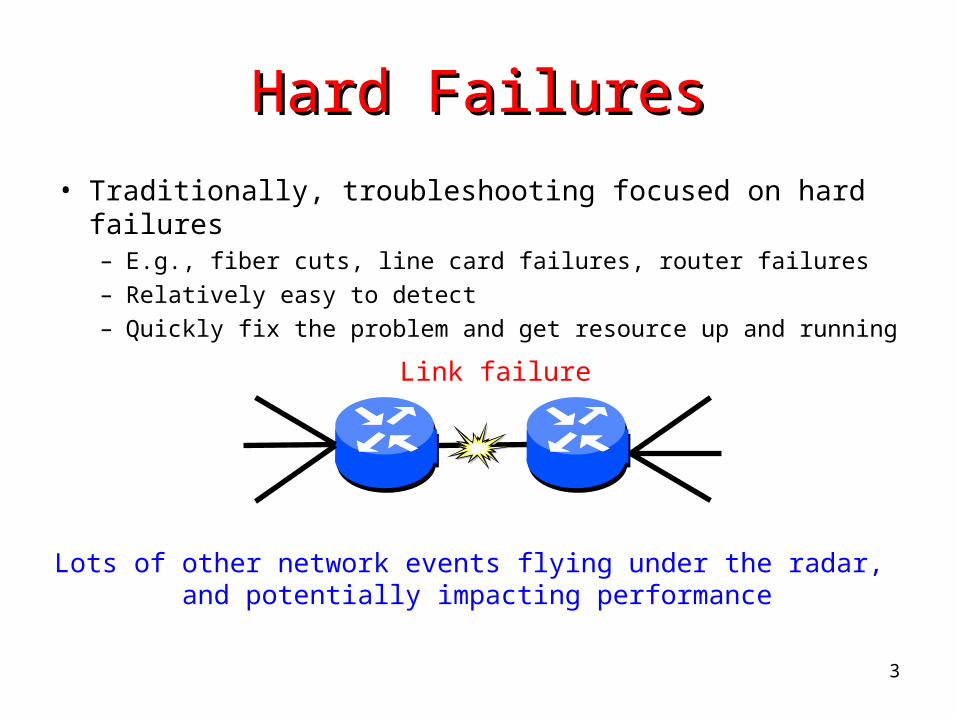
• Traditionally, troubleshooting focused on hard failures – E.g., fiber cuts, line card failures, router failures – Relatively easy to detect– Quickly fix the problem and get resource up and running
Lots of other network events flying under the radar, and potentially impacting performance
Link failure
4
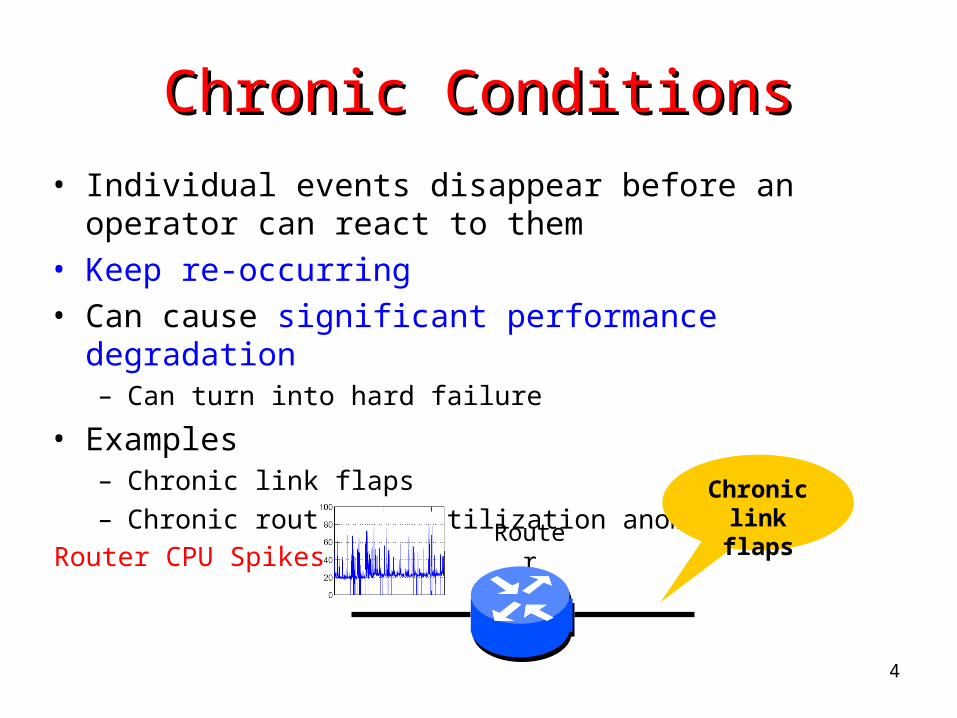
Chronic ConditionsChronic Conditions• Individual events disappear before an operator
can react to them• Keep re-occurring • Can cause significant performance degradation
– Can turn into hard failure
• Examples – Chronic link flaps– Chronic router CPU utilization anomalies
RouterRouter CPU Spikes
Chronic link flaps
5
Troubleshooting Chronic Troubleshooting Chronic ConditionsConditions
• Detect and troubleshoot before customer complains
• State of art – Manual troubleshooting
• Network-wide Information Correlation and Exploration (NICE) – First infrastructure for automated, scalable and flexible
troubleshooting of chronic conditions– Becoming a powerful tool inside AT&T
• Used to troubleshoot production network issues • Discovered anomalous chronic network conditions
6
OutlineOutline
• Troubleshooting Challenges Troubleshooting Challenges
• NICE Approach NICE Approach
• NICE Validation NICE Validation
• Deployment Experience Deployment Experience
• ConclusionConclusion
7
Troubleshooting Chronic Troubleshooting Chronic Conditions is hardConditions is hard
Routingreports
Syslogs
Layer-1Performancereports
Workflow Traffic
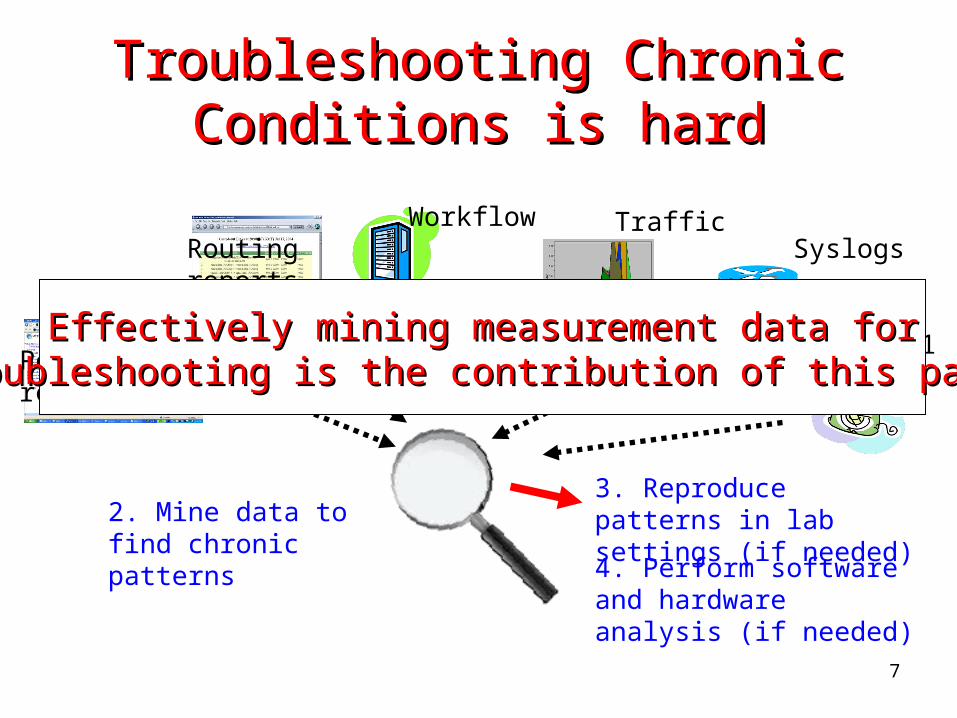
1. Collect network measurements
2. Mine data to find chronic patterns
3. Reproduce patterns in lab settings (if needed) 4. Perform software and hardware analysis (if needed)
Effectively mining measurement data forEffectively mining measurement data fortroubleshooting is the contribution of this papertroubleshooting is the contribution of this paper
8
Troubleshooting ChallengesTroubleshooting Challenges
• Massive Scale – Potential root-causes hidden in thousands of event-series– E.g., root-causes for packet loss include link congestion
(SNMP), protocol down (Route data), software errors (syslogs)
• Complex spatial and topology models – Cross-layer dependency– Causal impact scope
• Local versus global (propagation through protocols)
• Imperfect timing information – Propagation (events take time to show impact – timers) – Measurement granularity (point versus range events)
9
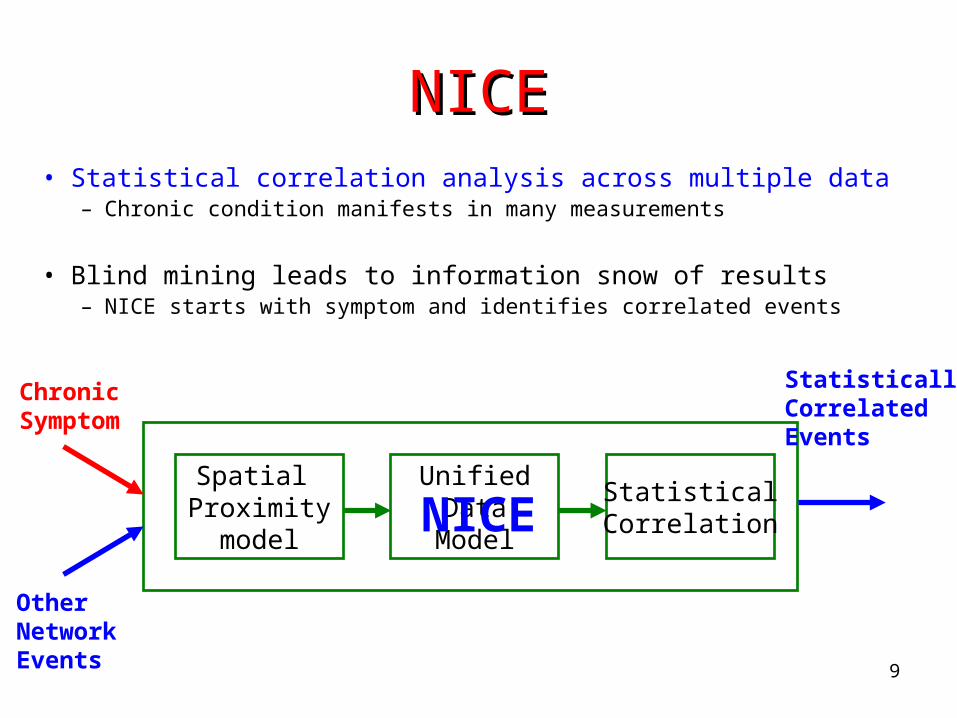
NICENICE• Statistical correlation analysis across multiple data
– Chronic condition manifests in many measurements
• Blind mining leads to information snow of results – NICE starts with symptom and identifies correlated events
ChronicSymptom
Spatial Proximity
model
UnifiedDataModel
StatisticalCorrelation
OtherNetworkEvents
StatisticallyCorrelatedEvents
NICE
10
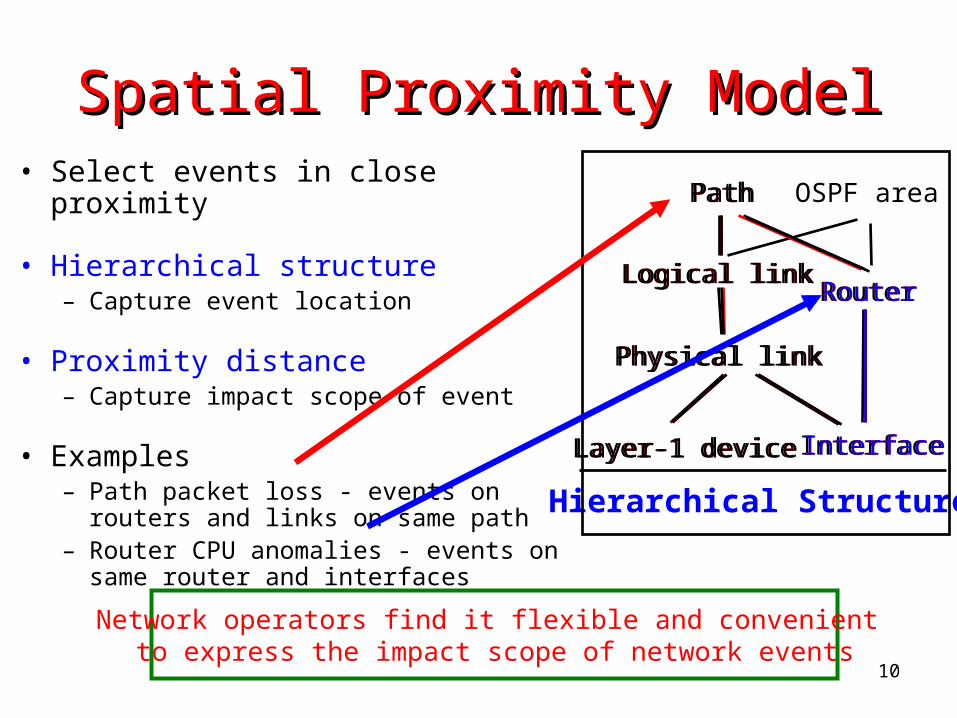
Spatial Proximity ModelSpatial Proximity Model• Select events in close proximity
• Hierarchical structure – Capture event location
• Proximity distance – Capture impact scope of event
• Examples– Path packet loss - events on
routers and links on same path– Router CPU anomalies - events on
same router and interfaces
OSPF area
Router
Path
Logical link
Physical link
Layer-1 device Interface
Network operators find it flexible and convenient to express the impact scope of network events
Hierarchical Structure
Path
Physical link
Layer-1 device Interface
Logical linkRouter
Path
RouterLogical link
Physical link
Layer-1 device Interface
11
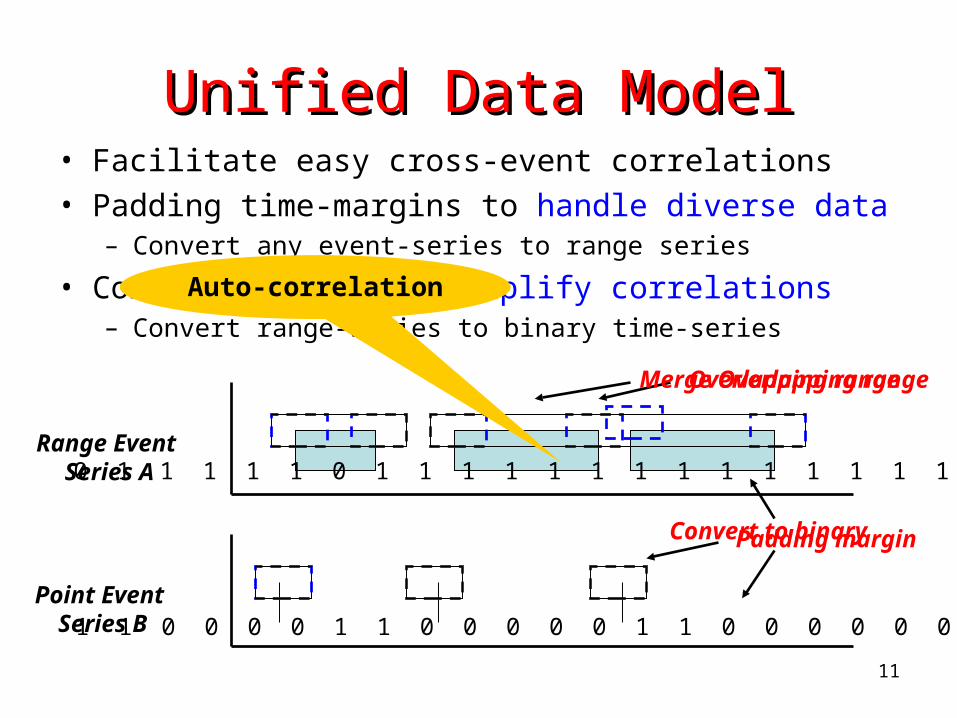
Unified Data ModelUnified Data Model• Facilitate easy cross-event correlations• Padding time-margins to handle diverse data
– Convert any event-series to range series
• Common time-bin to simplify correlations– Convert range-series to binary time-series
Range Event Series A
Point Event Series B
Padding margin
Overlapping range
0 1 1 1 1 1 0 1 1 1 1 1 1 1 1 1 1 1 1 1 1 0 0
1 1 0 0 0 0 1 1 0 0 0 0 0 1 1 0 0 0 0 0 0 0 0
Convert to binary
Merge Overlapping range
Auto-correlation
12
Statistical Correlation Statistical Correlation TestingTesting
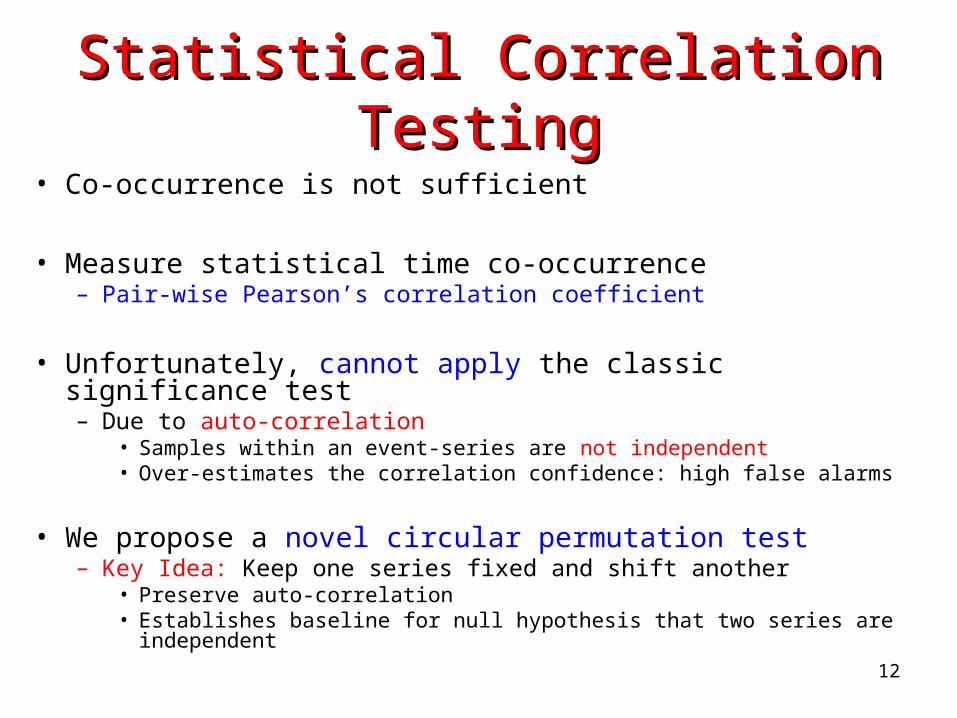
• Co-occurrence is not sufficient
• Measure statistical time co-occurrence – Pair-wise Pearson’s correlation coefficient
• Unfortunately, cannot apply the classic significance test – Due to auto-correlation
• Samples within an event-series are not independent• Over-estimates the correlation confidence: high false alarms
• We propose a novel circular permutation test – Key Idea: Keep one series fixed and shift another
• Preserve auto-correlation • Establishes baseline for null hypothesis that two series are
independent
13
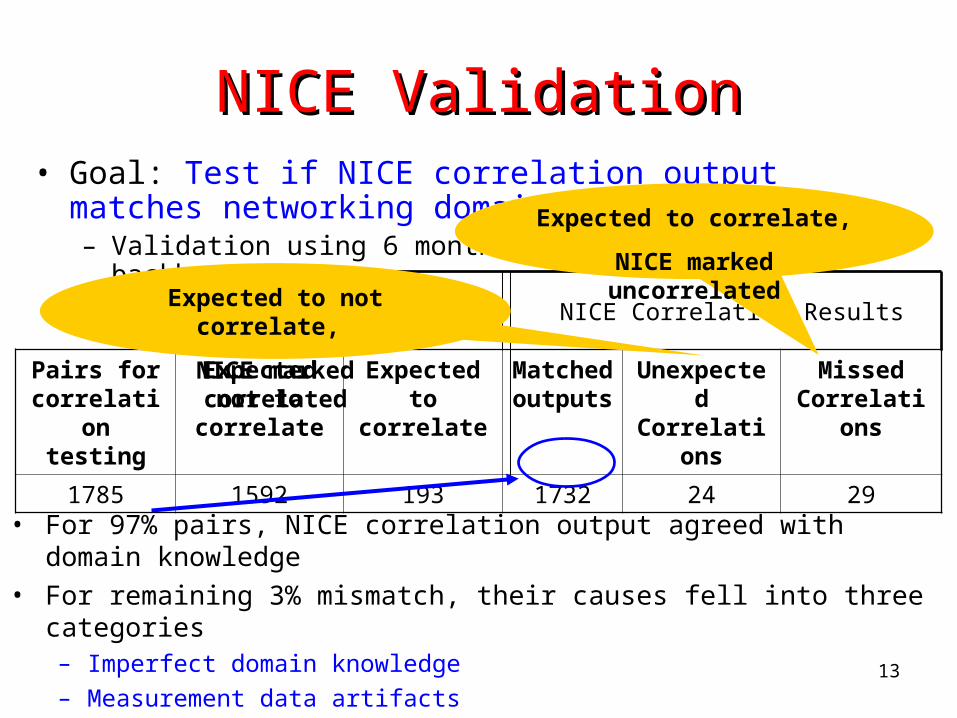
NICE ValidationNICE Validation• Goal: Test if NICE correlation output matches
networking domain knowledge – Validation using 6 months of data from AT&T backbone
Pairs for correlation testing
Expected not to
correlate
Expected to
correlate
Matched
outputs
Unexpected
Correlations
Missed Correlatio
ns
1785 1592 193 1732 24 29
NICE Correlation ResultsResults Expected by Network operators
• For 97% pairs, NICE correlation output agreed with domain knowledge
• For remaining 3% mismatch, their causes fell into three categories – Imperfect domain knowledge – Measurement data artifacts– Anomalous network behavior
Expected to not correlate,
NICE marked correlated
Expected to correlate,
NICE marked uncorrelated
14
Anomalous Network Anomalous Network BehaviorBehavior
• Example – Cross-layer Failure interactions– Modern ISPs use failure recovery at layer-1 to rapidly
recover from faults without inducing re-convergence at layer-3
• i.e., if layer-1 has protection mechanism invoked successfully, then layer-3 should not see a link failure
• Expectation: Layer-3 link down events should not correlate with layer-1 automated failure recovery– Spatial proximity model: SAME LINK
• Result: NICE identified strong statistical correlation – Router feature bugs identified as root cause – Problem has been mitigated
15
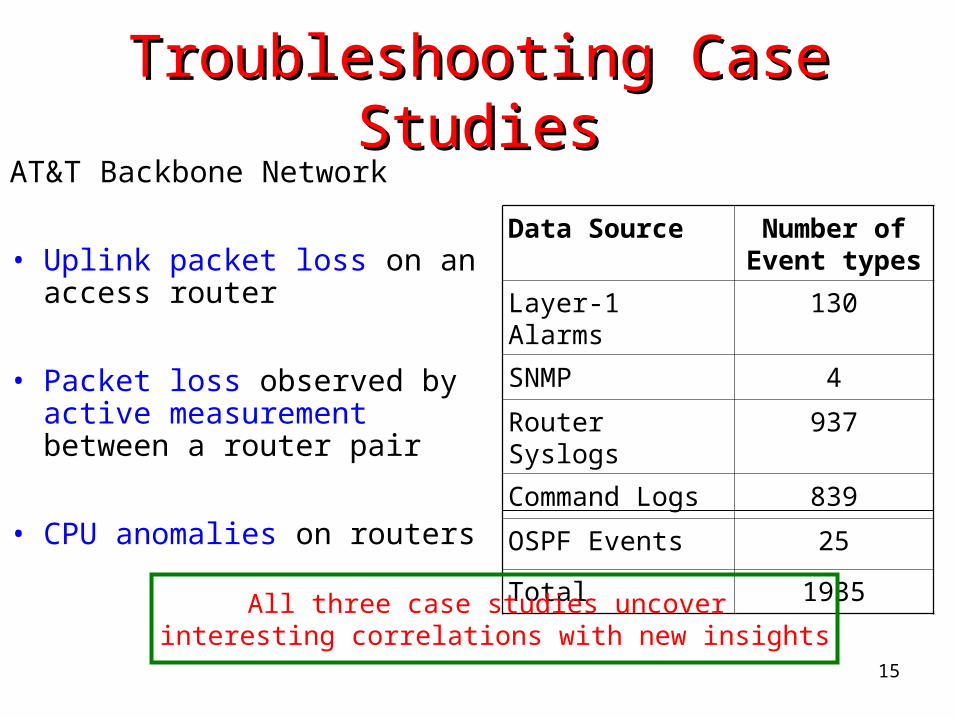
Troubleshooting Case Troubleshooting Case StudiesStudies
AT&T Backbone Network
• Uplink packet loss on an access router
• Packet loss observed by active measurement between a router pair
• CPU anomalies on routers
Data Source Number of Event types
Layer-1 Alarms 130
SNMP 4
Router Syslogs 937
Command Logs 839
OSPF Events 25
Total 1935
All three case studies uncover interesting correlations with new insights
16
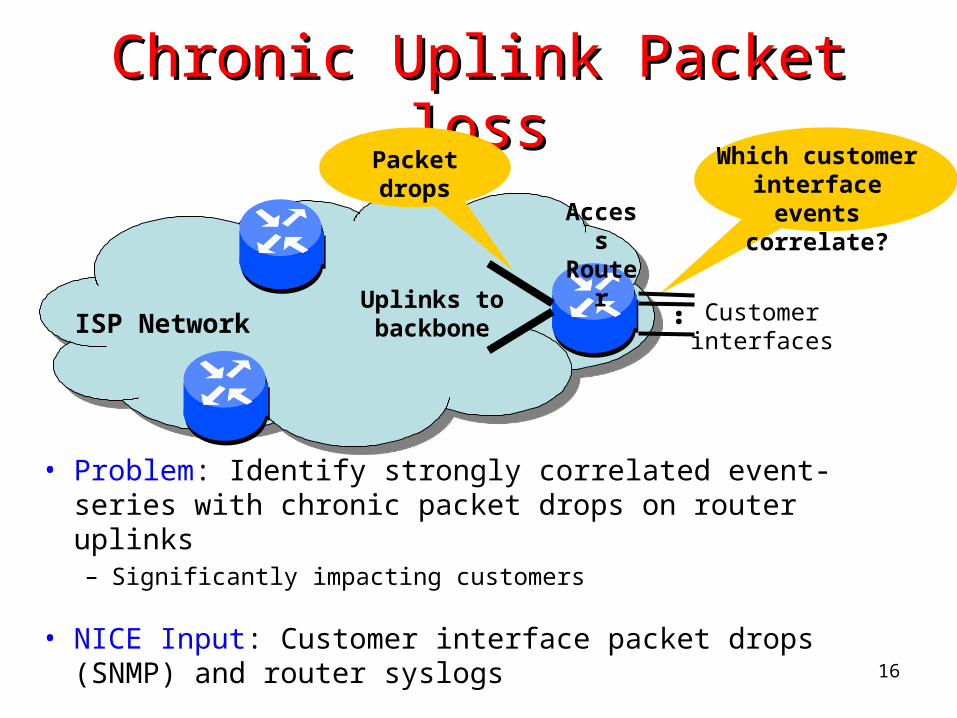
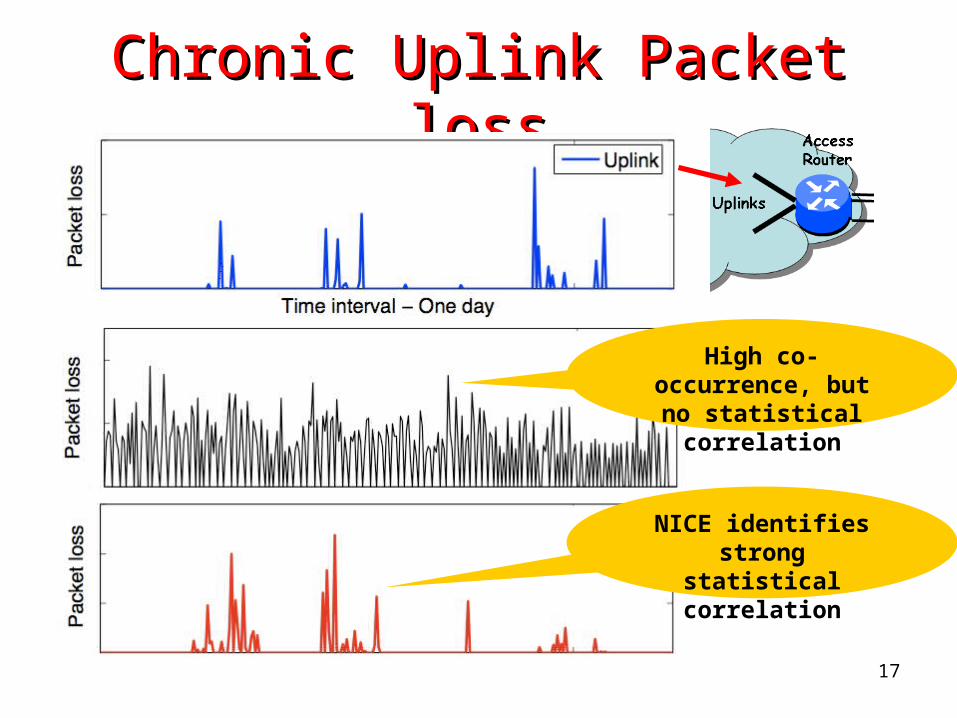
Chronic Uplink Packet lossChronic Uplink Packet loss
• Problem: Identify strongly correlated event-series with chronic packet drops on router uplinks – Significantly impacting customers
• NICE Input: Customer interface packet drops (SNMP) and router syslogs
Customerinterfaces
Which customerinterface events
correlate?
ISP NetworkUplinks to backbone
Packet drops
Access
Router ..
17
Chronic Uplink Packet lossChronic Uplink Packet loss
High co-occurrence, but no
statistical correlation
NICE identifies strong statistical
correlation
18
Chronic Uplink Packet lossChronic Uplink Packet loss
• NICE Findings: Strong Correlations with – Packet drops on four customer-facing
interfaces (out of 150+ with packet drops)• All four interfaces from SAME CUSTOMER
– Short-term traffic bursts appear to cause internal router limits to be reached
• Impacts traffic flowing out of router • Impacting other customers
– Mitigation Action: Re-home customer interface to another access router
19
ConclusionsConclusions• Important to detect and troubleshoot chronic
network conditions before customer complains
• NICE – First scalable, automated and flexible infrastructure for troubleshooting chronic network conditions – Statistical correlation testing– Incorporates topology and routing model
• Operational experience is very positive – Becoming a powerful tool inside AT&T
• Future Work– Network behavior change monitoring using correlations– Multi-way correlations

20
Thank You !

21
Backup Slides …
22
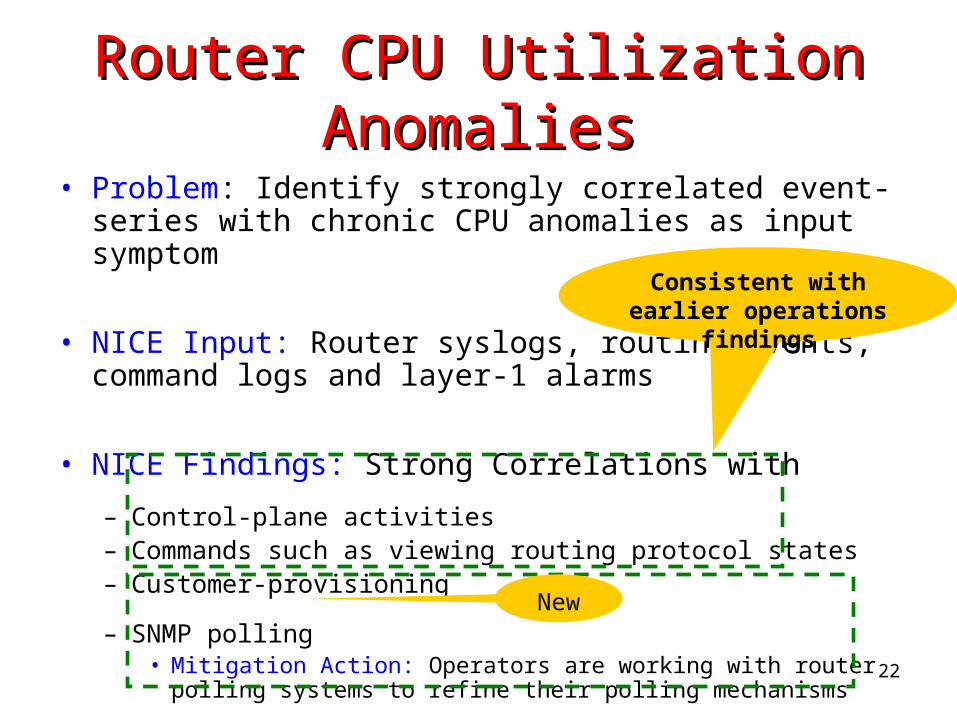
Router CPU Utilization Router CPU Utilization AnomaliesAnomalies
• Problem: Identify strongly correlated event-series with chronic CPU anomalies as input symptom
• NICE Input: Router syslogs, routing events, command logs and layer-1 alarms
• NICE Findings: Strong Correlations with
– Control-plane activities – Commands such as viewing routing protocol states – Customer-provisioning
– SNMP polling• Mitigation Action: Operators are working with router polling
systems to refine their polling mechanisms
Consistent with earlier operations
findings
New
23
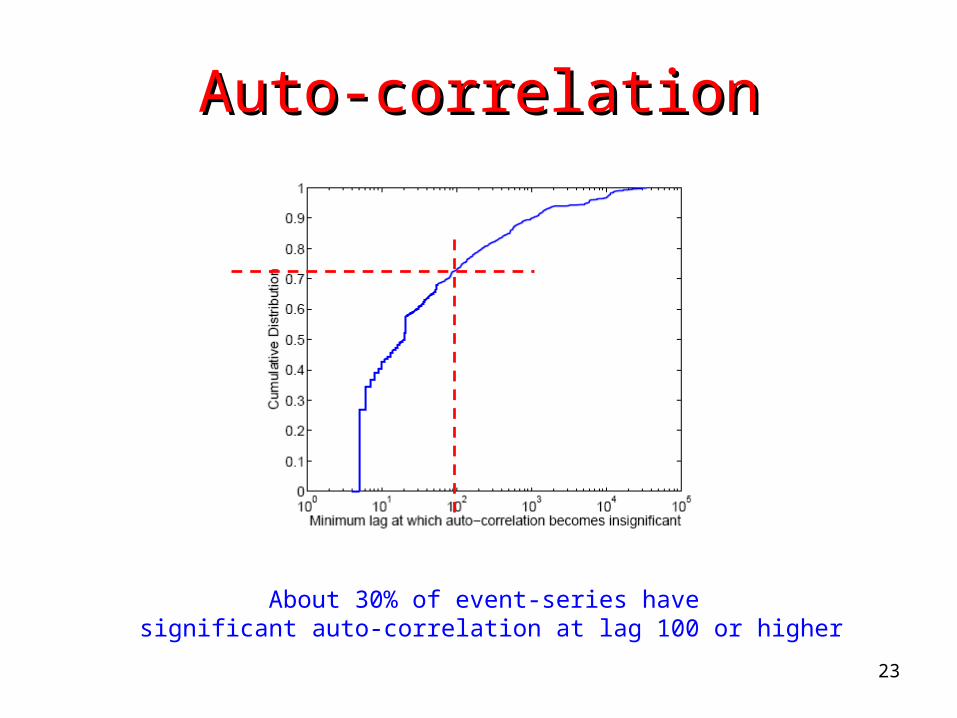
Auto-correlationAuto-correlation
About 30% of event-series have significant auto-correlation at lag 100 or higher
24
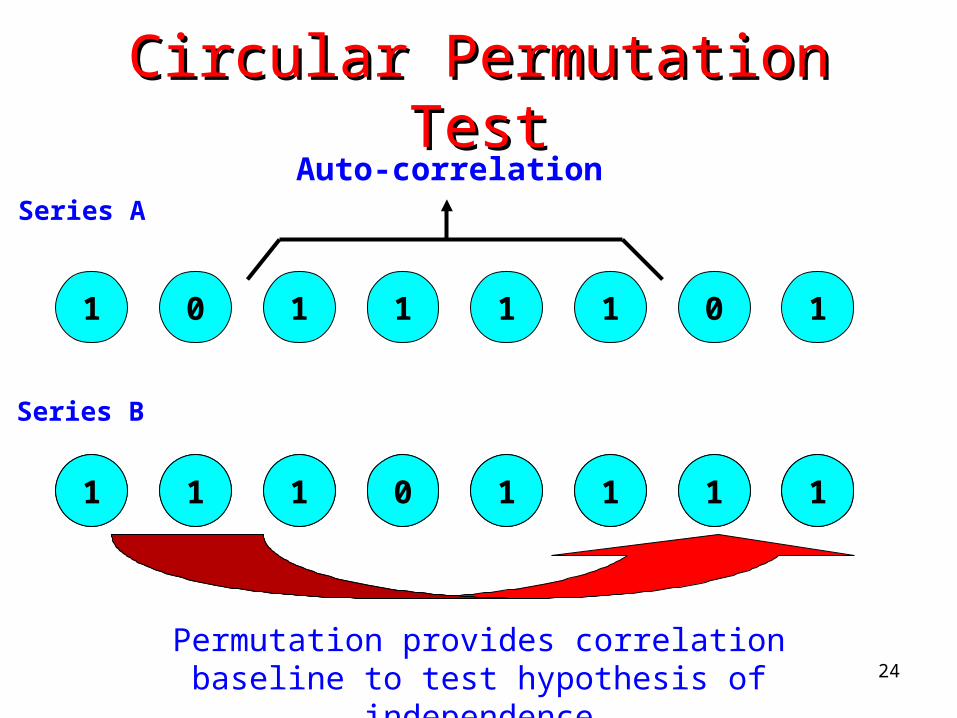
Circular Permutation TestCircular Permutation TestAuto-correlation
1
Series A
Series B
1 0 1 1 1 1 1
1 0 1 1 1 1 0 1
1 1 1 0 1 1 1 1
Permutation provides correlation baseline to test hypothesis of
independence
25
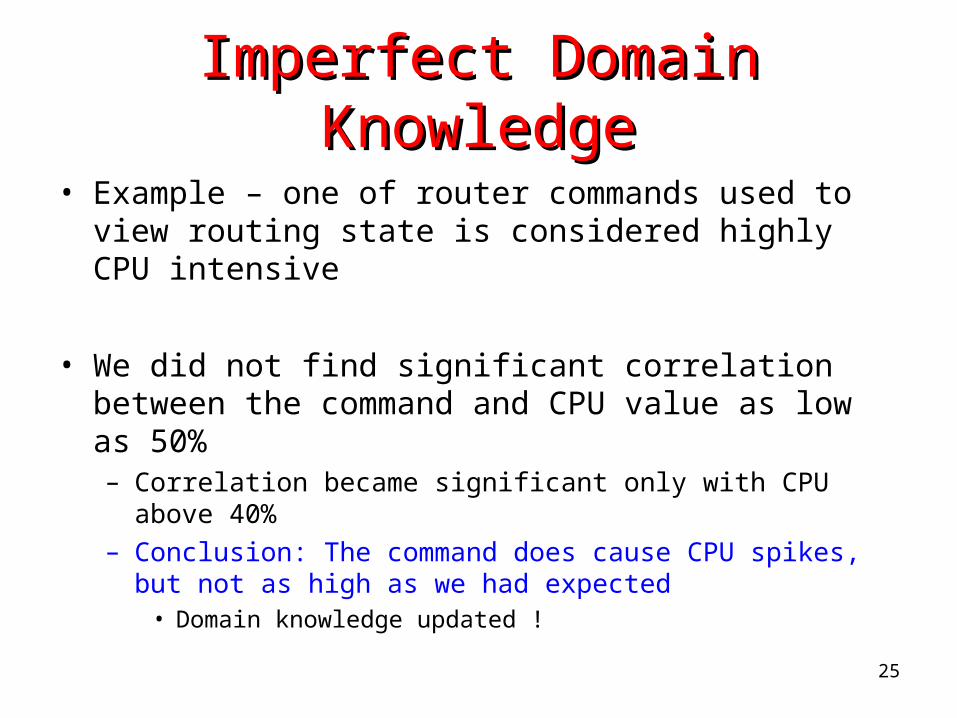
Imperfect Domain Imperfect Domain KnowledgeKnowledge
• Example – one of router commands used to view routing state is considered highly CPU intensive
• We did not find significant correlation between the command and CPU value as low as 50% – Correlation became significant only with CPU above 40% – Conclusion: The command does cause CPU spikes, but
not as high as we had expected • Domain knowledge updated !