Embed Size (px)
Citation preview

1
Today
Questions on risk management (Ch 9_Quiz5) PM skill survey (see note for article) Measuring IT success (Ch 13)

Jump to first page
Case Analysis for Quiz 5
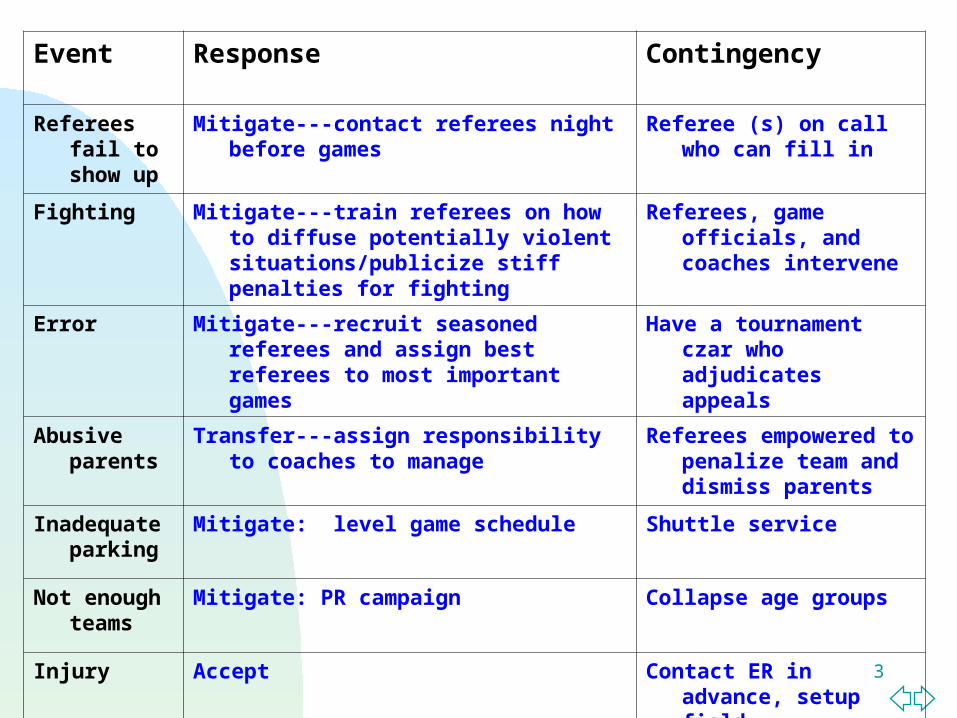
The Manchester United Soccer Tournament project team has identified the following potential risks to their project: Referees failing to show up at designated games. Fighting between teams. Pivotal error committed by a referee that determines the
outcome of a game. Abusive behavior along the sidelines by parents. Inadequate parking. Not enough teams sign up for different age brackets. Serious injury.
3
Event Response Contingency
Referees fail to show up
Mitigate---contact referees night before games Referee (s) on call who can fill in
Fighting Mitigate---train referees on how to diffuse potentially violent situations/publicize stiff penalties for fighting
Referees, game officials, and coaches intervene
Error Mitigate---recruit seasoned referees and assign best referees to most important games
Have a tournament czar who adjudicates appeals
Abusive parents
Transfer---assign responsibility to coaches to manage
Referees empowered to penalize team and dismiss parents
Inadequate parking
Mitigate: level game schedule Shuttle service
Not enough teams
Mitigate: PR campaign Collapse age groups
Injury Accept Contact ER in advance, setup field communication system

4
Project Management Skills1. Ability to understand the technical aspects of a project2. Ability to effectively communicate project information3. Ability to effectively document the flow of project information4. Ability to effectively manage project human resources5. Ability to clearly define project scope6. Ability to manage the project within the fiscal budget7. Ability to manage project changes8. Ability to maintain support for the project9. Ability to provide leadership10. Ability to effectively manage time11. Ability to properly close a project12. Ability to solve problems
Based on interviews with 47 project managers

5
Methodology To gauge the importance of these 12 skills, a 5
point Likert scale was used in our study. A clear definition of each skill was provided Respondents were asked to rate the importance
of each skill as:• 1. Not at all• 2. A little• 3. Moderate• 4. Much• 5. A great deal
A total of 42 individuals responded

6
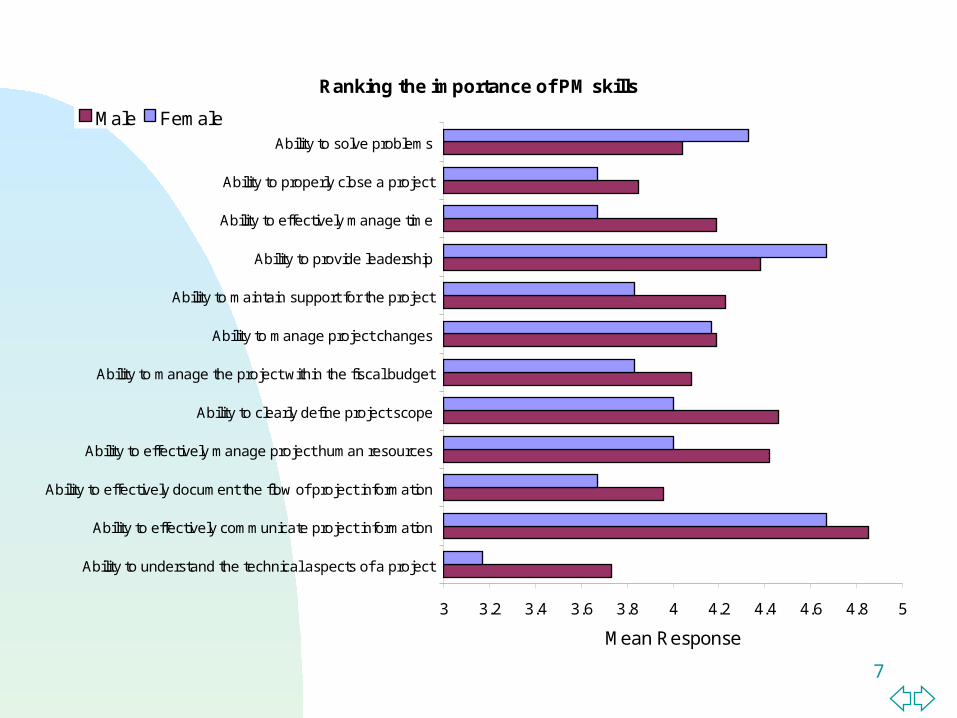
Ranking the importance of PM skills
3 3.2 3.4 3.6 3.8 4 4.2 4.4 4.6 4.8 5
Ability to understand the technical aspects of a project
Ability to properly close a project
Ability to effectively document the flow of project information
Ability to manage the project within the fiscal budget
Ability to maintain support for the project
Ability to solve problems
Ability to manage project changes
Ability to effectively manage time
Ability to effectively manage project human resources
Ability to clearly define project scope
Ability to provide leadership
Ability to effectively communicate project information
Mean Response
7
Ranking the importance of PM skills
3 3.2 3.4 3.6 3.8 4 4.2 4.4 4.6 4.8 5
Ability to understand the technical aspects of a project
Ability to effectively communicate project information
Ability to effectively document the flow of project information
Ability to effectively manage project human resources
Ability to clearly define project scope
Ability to manage the project within the fiscal budget
Ability to manage project changes
Ability to maintain support for the project
Ability to provide leadership
Ability to effectively manage time
Ability to properly close a project
Ability to solve problems
Mean Response
Male Female

8
Correlation matrix of PM skills1
2 0.40**
3 0.21 0.32*
4 0.18 0.42** 0.28
5 0.40** 0.56** 0.28 0.45**
6 0.43** 0.38* 0.42** 0.29 0.41**
7 0.31* 0.43** 0.29 0.21 0.39* 0.48**
8 0.24 0.52** 0.40** 0.39* 0.52** 0.53** 0.35*
9 0.20 0.30 0.13 0.10 0.10 0.24 0.21 0.20
10 0.50** 0.26 0.34* 0.18 0.06 0.50** 0.17 0.17 0.22
11 0.28 0.34 0.47** 0.32* 0.24 0.26 0.46** 0.42** 0.00 0.10
12 0.24 0.39* 0.20 0.10 0.23 0.42** 0.52** 0.29 0.41** 0.13 0.30
1 2 3 4 5 6 7 8 9 10 11 12
Mean 3.62 4.79 3.83 4.24 4.31 3.88 4.12 3.98 4.40 4.14 3.76 4.07
S.D. 0.85 0.47 0.88 0.76 0.72 0.80 0.74 0.68 0.63 0.65 0.97 0.75
** Correlation is significant at the 0.01 level (2-tailed).* Correlation is significant at the 0.05 level (2-tailed).

9
9. Discussion questions Is user involvement important to risk
management? Why? Comment on sources of risk:
continued management support top management style alignment with organizational needs user acceptance shifting goals and objectives

10
9. Discussion questions The study by DeMarco and Lister showed that
organizational issues had a much greater influence on programmer productivity than the technical environment or programming languages
Programmer productivity varied by a factor of one to ten across organizations, but only by 21% within the same organization.
Does this make sense?

11
9. Discussion questions The study found no correlation between
productivity and programming language, years of experience, or salary
A dedicated workspace and a quiet work environment were key factors to improving programmer productivity
Does this make sense to you?

12
10. Sample Pareto diagram

13
10.Sample Quality Control Chart

14
13. Project success To the extent that the information technology
empowers end-users to do their job more effectively and more efficiently it can be considered successful.
To the extent that a project outcome satisfies customer needs and accomplishes project specifications within time and budget it can be considered successful.

15
13. Failure events profile
Project event Failure rate
Cancellation High
Late delivery Medium to high
Over budget Medium to high
Quality problems Medium to high
Employee turnover Low to medium

16
13. Reasons for IT project failure Human issues
Employee turnover Conflict Motivation
Technical limitations Incompatible hardware and software platforms Limited bandwidth for data transfer Inadequate response time
Political game play By the individual to gain rewards By the team to create rivalry By the project manager to control

17
13. Reasons for IT project failure Funding issues
Erroneous estimates Poor budgetary control Run away costs
Leadership issues In dealing with people In dealing with technology In dealing with processes

18
13. Problem-solution examplesPossible problem Possible solution
Users cannot agree on business needs. This usually happens in the early stages of the project development.
Document all communications. Use prototype to allow users see the impact of their decisions.
Users and team members do not communicate.
Provide clear guidelines for communication.
Users want a solution without fully understanding the ramifications.
Facilitate meetings to walk users through various levels of the system. Share details with all parties to help understanding.
Stakeholders resist change. Document changes and assign priorities for them involving stakeholders. Monitor change continuously.
Employee turnover, new hire with insufficient expertise.
Have team members learn skills. Provide training. Have technical ‘gurus’ go around helping.

19
13. Signs of project failure
1 Your team gives you only good news at status meetings
2 The implementation date is getting near but the project manager has not yet seen a hands-on demonstration of the application
3 Team members complain about the lack of skills of other team members
4 Team members protect themselves at every opportunity
5 Team members are resigning on a regular basis
6 Team members either frustrated and constantly on edge or feel no pressure to get the job done
7 The project has missed milestones and is over budget
8 There has been no detailed walk-through of the design by independent reviewers
9 When you think of the project there is no thought of team but only individuals
10 There is no user involvement and the users are not interested

20
13. Barriers to project success
Activity group Activity item
Planning (32%)
Unclear definition (16%), poor decision making (9%), changes (4%), bad information (3%)
Directing (26%)
Poor coordination (9%), poor communication (6%), low commitment (6%), poor leadership (5%)
Scheduling (12%)
Not meeting schedule (5%), not managing schedule (3%), tight schedule (4%)
Staffing (12%)
Inadequate personnel (5%), incompetent project manager (4%), project member turnover (2%), poor staffing process (1%)
Organizing (11%)
Lack of responsibility or accountability (5%), weak project manager (5%), top management interference (1%)
Controlling (7%)
Poor follow-up (3%), poor monitoring (2%), no control system (1%), no recognition of problems (1%)

21
13. Project success factorsSuccess Criteria Freq. (%)
User involvement 19Top management support 16Clear statement of requirements 15Proper planning 11Realistic expectations 10Smaller project milestones 9Competent staff 8Project team ownership 6Clear vision and objectives 3hard-working, focused staff 3Total 100

22
13. User involvement Involvement equilibrium – balance between
desired and actual involvement End-users more receptive to learning,
improve their understanding of how to use the system, make suggestions that might improve system quality
Enhances trust and contributes to a sense of ownership and control, improves system acceptance
Users viewed involvement as a means of getting what they want

23
13. User involvement Involvement saturation – actual involvement
exceeds desired involvement Involvement is viewed as time consuming
interference with other activities; impediment to other opportunities
Involvement is unlikely to increase trust or sense of control
End-users are less receptive to learning about the system or improving their understanding of how to use it
User satisfaction is less plausible as end-users see little or no value in being involved

24
13. User involvement Involvement deprivation – desired
involvement exceeds actual involvement Users develop a sense of alienation There may be some involvement but users
perceive it as too little or inconsequential Little involvement may be resented as an act
of manipulation Increased resistance and reduced
acceptance Negative user satisfaction

25
13. User involvement These involvement episodes create
opportunities and challenges for the project manager Challenges exist in creating appropriate
involvement arrangements Ultimately, individuals want to benefit from
involvement arrangements and enhance their career opportunities
Eight activities are suggested for user involvement in system’s development

26
13. Measures of end-user involvement
Developmental activity Desired/Actual involvement
1 Initiating the project? 1 ---------- 5
2 Determining system objectives? 1 ---------- 5
3 Determining the user’s information needs? 1 ---------- 5
4 Assessing alternative ways of meeting the user’s information needs?
1 ---------- 5
5 Identifying sources of information? 1 ---------- 5
6 Outlining information flows? 1 ---------- 5
7 Developing input forms/screens? 1 ---------- 5
8 Developing output format? 1 ---------- 5

27
13. Measures of end-user satisfactionMeasures of user satisfaction Satisfaction
level
ContentExample: Does the system provide the precise
information you need?1 ---------- 5
Accuracy Example: Is the system accurate? 1 ---------- 5
Format Example: Do you think the output is presented in a
useful format?1 ---------- 5
Ease of useExample: Is the system user friendly? 1 ---------- 5
Timeliness Example: Does the system provide up-to-date
information? 1 ---------- 5

28
13. Percentile scores for satisfaction
Percentile Value (12 - 60)
10 37
20 43
30 46
40 48
50 51
60 53
70 54
80 57
90 59

29
13. Perceived usefulnessMeasures of usefulness Level of use
Task productivity This application saves me time This application increases my productivity This application allows me to accomplish more work
than would otherwise be possible
1 ---------- 51 ---------- 5
1 ---------- 5Task innovation This application helps me create new ideas This application helps me come up with new ideas This application helps me try out innovative ideas
1 ---------- 51 ---------- 51 ---------- 5
Customer satisfaction This application improves customer service This application improves customer satisfaction This application helps me meet customer needs
1 ---------- 51 ---------- 51 ---------- 5
Management control This application helps management control the work
process This application improves management control This application helps management control performance
1 ---------- 5
1 ---------- 51 ---------- 5
30
13. Benefits of reliable measures Historical data for comparative analysis Improves confidence in stakeholders Confidence in the reliability of results Ease of documentation Meaningful communication Improves user acceptance of project outcome Useful to evaluate project success Useful to design training programs Useful to evaluate team member Helps maintain top management support

31
13. Other success factors Business knowledge
Understanding what the business is about; organizational mission, goals and objectives
Understanding organizational culture and processes; how things are done
Expectation management Congruence between developers and sponsors views With respect to scope statement
Change management Change management committee Priorities and implementation

32

33
13. Discussion questions The Noble Laureate, Dr. Robert Solow said
that you can computer everywhere but the Productivity Index
There is a gap between the IT investment and the profit.
IT Productivity Paradox

34
13. Discussion questions Evaluating information system success is a
complex task that involves knowledge of business as well as technology. Information systems can be evaluated from the perspectives of the user, the developer, or both. What are some specific success features from the developer’s perspective? The user’s perspective?

35
13. Discussion questions Conduct a survey in class to determine the
level of usefulness for each of the four factors given in Table 13.7. Ask your respondents to think of an application that they use most frequently as they answer your questions. Use teams as focus groups.
Use your project team experience for this course and list factors of success or failure

36
13. Discussion questions Read the case for Household Credit Card
Services and discuss the followings:1. What are planning issues in this case?
2. What is unique about the project management framework in this industry?
3. What do you see interesting about this project management case?
4. How would you manage this project if you were appointed the project manager?
5. How would you summarize primary lessons learned from this case?


![WGIA9 presentaion-chart [โหมดความเข้ากันได้] · Industrial WW CH CH CH N O CO N O ... Microsoft PowerPoint - WGIA9 presentaion-chart [โหมดความเข้ากันได้]](https://img.dokumen.tips/doc/110x75/5f048f7b7e708231d40e935c/wgia9-presentaion-chart-aaaaaaaaaaaaaaaaaa.jpg)