Embed Size (px)
Citation preview

1
Title: Joint effects of habitat, zooplankton, host stage structure, and diversity on amphibian 1
chytrid 2
3
4
Jessica L. Hite1*, Jaime Bosch2,3, Saioa Fernández-Beaskoetxea2, Daniel Medina4, and Spencer 5
R. Hall1 6
71Department of Biology, Indiana University, Bloomington, IN 47405 82Museo Nacional de Ciencias Naturales, CSIC, José Gutiérrez Abascal 2, 28006 Madrid, Spain 93Centro de Investigación, Seguimiento y Evaluación, Parque Nacional de la Sierra de
Guadarrama, Cta. M-604, Km. 27.6, 28740 Rascafría, Spain
4Department of Biological Sciences, Virginia Tech, Blacksburg, Virginia, USA 10
11
* Corresponding author: 1001 East 3rd St.; phone: 812-855-6013; email: [email protected] 12
13
2
ABSTRACT 14
Why does the severity of parasite infection differ dramatically across habitats? This question 15
remains challenging to answer because multiple correlated pathways drive disease. Here, we 16
examined habitat-disease links through direct effects on parasites and indirect effects on parasite 17
predators (zooplankton), host diversity, and key life stages of hosts. We used a case study of 18
amphibian hosts and the chytrid fungus, Batrachochytrium dendrobatidis, in a set of permanent 19
and ephemeral alpine ponds. A field experiment showed that ultraviolet radiation (UVR) killed 20
the free-living infectious stage of the parasite. Yet, permanent ponds with more UVR exposure 21
had higher infection prevalence. Two habitat-related indirect effects worked together to 22
counteract parasite losses from UVR: (1) UVR reduced the density of parasite predators, and (2) 23
permanent sites fostered multi-season host larvae that fueled parasite production. Host diversity 24
was unlinked to hydroperiod or UVR but counteracted parasite gains; sites with higher diversity 25
of host species had lower prevalence of infection. Thus, while habitat structure explained 26
considerable variation in infection prevalence through two indirect pathways, it could not 27
account for everything. This study demonstrates the importance of creating mechanistic, food 28
web-based links between multiple habitat dimensions and disease. 29
30
31
32
Key Words: Chytrid, habitat, UV, zooplankton, diversity, stage structure 33

3
INTRODUCTION 34
Parasite infection differs dramatically across habitats. In some cases, parasites exert strong 35
negative effects on host populations. Yet, severe epidemics occur infrequently and in a relatively 36
small subset of habitats [1]. For example, epidemics of the virulent amphibian chytrid, 37
Batrachochytrium dendrobatidis (hereafter, Bd) erupt catastrophically in some habitats and 38
locations (e.g., geothermal ponds, undisturbed forests) but not others (e.g., non-geothermal 39
ponds, disturbed forests) [1-8]. Why? It remains challenging to answer this question because 40
multiple correlated pathways drive disease [9-11]. Furthermore, these pathways may have 41
contrasting effects, as some factors enhance disease while others diminish it. Thus, disease 42
dynamics reflect tension between multiple driving factors linked via habitat. 43
Here, we disentangle multiple pathways governing variation in Bd infection in amphibian 44
hosts. In a set of alpine ponds, prevalence and severity of Bd infections differ dramatically across 45
sites and across the ten different species of amphibian hosts inhabiting them [12-14]. Currently, 46
however, the factors driving this pronounced variation in infection prevalence among sites 47
remain unknown. We focus on infection prevalence in two native hosts that are highly 48
susceptible to Bd (fire salamander: Salamandra salamandra and the midwife toad: Alytes 49
obstetricans)[14-16]. Both species act as key drivers of disease in this system [13, 15]. To 50
explain variation in infection prevalence, we examine direct and indirect factors that connect to 51
Bd epidemics via gains and losses of zoospores [14, 16, 17]. Zoospores are free-swimming 52
propagules, which attach to and then replicate on the epidermis of amphibian hosts [18]. Infected 53
hosts release new zoospores, which then infect other hosts. Hence, Bd dynamics depend 54
sensitively on zoospore survival [19]. 55
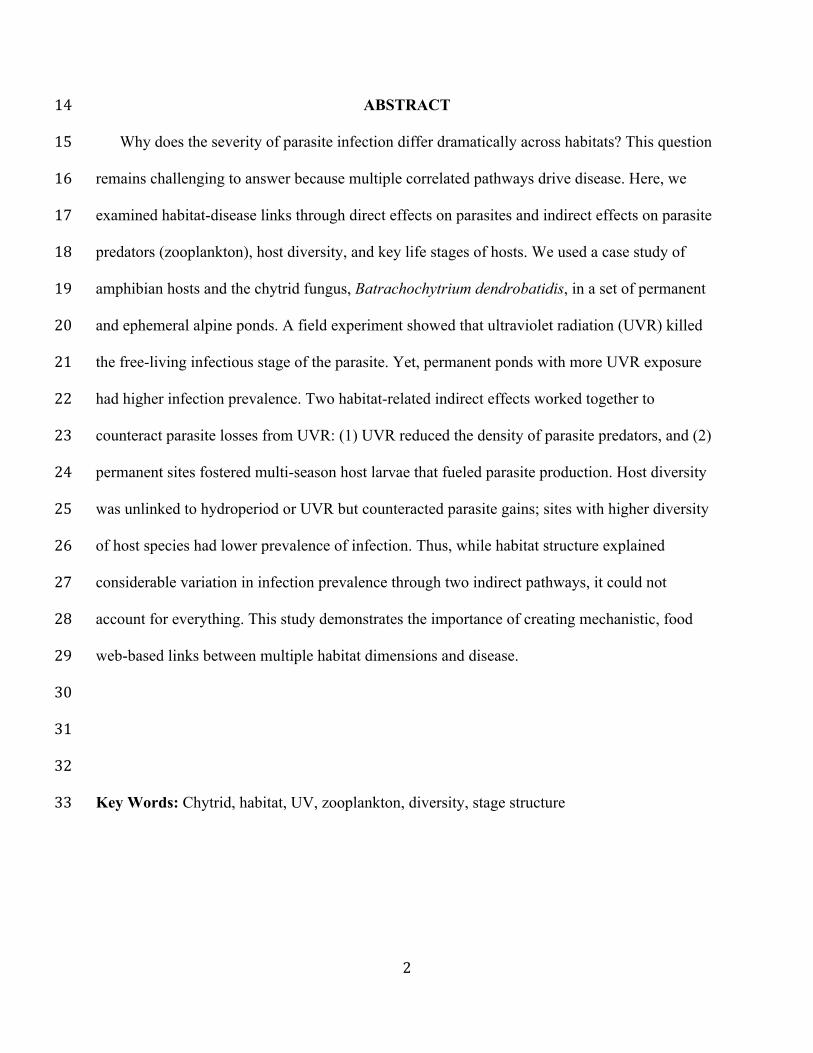
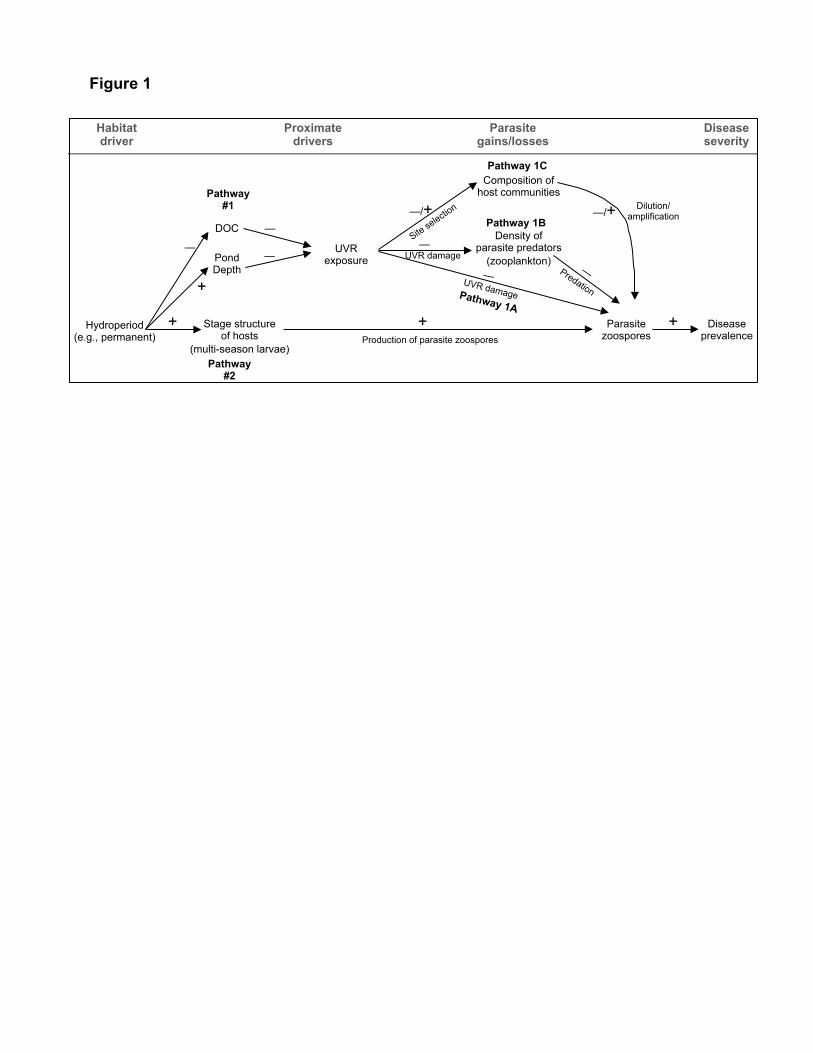
The first main pathway governing Bd epidemics involves direct and indirect effects of 56
4
ultraviolet radiation (UVR). UVR exposure may either directly damage Bd zoospores or alter the 57
distribution of key species that influence disease (via multiple food web interactions; Fig. 1, 58
Pathways 1A-C). In these mountainous regions, variation in UVR exposure starts with 59
differences in underlying geology (e.g., bedrock, hydrology [20]) that governs pond depth and 60
hydroperiod (permanent vs. ephemeral). Hydroperiod largely determines the type of habitat and 61
vegetation surrounding ponds (e.g., moss in bogs vs. grass in knolls). These characteristics then 62
influence the quality and quantity of dissolved organic carbon (DOC) in ponds. DOC acts as a 63
natural aquatic ‘sunscreen’ that strongly regulates exposure of aquatic organisms to UVR. 64
Together, variation in depth and DOC govern attenuation of UVR in the water column [21, 22]. 65
Hence, hosts and parasites in different ponds experience dramatically different UVR exposures. 66
Based on previous evidence [15, 23], solar radiation should damage Bd zoospores, thereby 67
depressing infection prevalence via direct, damaging effects of UVR (Pathway 1A). 68
Variation in UVR could also indirectly alter disease by modulating the distribution of other 69
key species (e.g., predators and hosts) that influence disease (Pathway 1B,C; Fig. 1). First, UVR 70
could constrain predators that consume infectious stages of parasites (Pathway 1B) [24, 25]. 71
Zooplankton eat Bd zoospores [17, 26-28] and respond sensitively to UVR— especially in alpine 72
habitats [reviewed by 21]. Therefore, high-UVR ponds could support fewer zooplankton that 73
consume Bd zoospores. If zooplankton respond more sensitively to UVR than zoospores 74
themselves, this indirect release from predation could overwhelm the direct mortality effect of 75
UVR on zoospores (Pathway 1B, Fig 1). In other words, epidemics could become larger in ponds 76
with more UVR due to the loss of key parasite predators that are sensitive to UVR. Second, 77
habitat variation could influence the abundance of other host species that also govern disease 78
(Pathway 1C, Fig 1). Here, habitat-diversity links could arise if hosts selectively oviposit based 79

5
on UVR exposure and/or other species [29-31]. In turn, selective oviposition (which determines 80
the diversity of larval hosts found in a given pond) could drive variation in disease because hosts 81
vary in disease competency [14, 16]. These other species, then, could produce a dilution effect 82
(i.e., reduced disease with higher diversity) if highly competent focal hosts are less common in 83
more diverse communities [32]. Alternatively, an amplification effect could arise if higher 84
diversity reflects higher frequencies of more competent (non-focal) hosts [33]. 85
The second main pathway directly links variation in hydroperiod, stage structure of focal 86
hosts, and parasite (zoospore) production (Pathway 2, Fig. 1). Here, hydroperiod could influence 87
the distribution of key host stages that influence disease. Many amphibian species, including our 88
two focal hosts, can have multi-season larvae. These multi-season larvae can delay 89
metamorphosis. However, delayed metamorphosis requires a permanent water body since pond 90
drying will catalyze larvae (which require ample water for respiration) to metamorphose. 91
Importantly, these multi-season larvae often produce heavy Bd loads — an order of magnitude 92
higher than single-season larvae [16, this study]. High production of zoospores by these life 93
stages often explains Bd prevalence better than host density [2, 16, 19]. Here, strong links 94
between hydroperiod and stage structure of focal hosts might predict infection prevalence better 95
than any of the UVR-driven mechanisms. 96
We used an experiment, field observations, and a partition of variation based on partial 97
regression analysis to evaluate the primary direct and indirect pathways driving infection 98
prevalence in this system. All of these pathways involve gains and losses of zoospores. An in-99
situ experiment revealed that incident UVR exposure increased mortality of zoospores. Yet 100
ponds with more UVR penetration (permanent ponds with low DOC) had higher prevalence of 101
disease. These results suggest that the direct effect of UVR on mortality was overwhelmed by 102

6
other factors. We explored additional direct and indirect effects with bivariate analyses and then 103
synthesized them with a regression-based partition of variation in prevalence [34]. (Small sample 104
sizes and co-linearity problems prevented a path analysis.) This partition supported the dilution 105
pattern; host diversity alone explained 42% of the variation in disease prevalence. However, 106
diversity was unrelated to either hydroperiod or UVR, hence it could not explain why disease 107
was higher in permanent ponds with more UVR. Instead, the combined effects of parasite 108
predators (zooplankton) and multi-season larvae — both strongly regulated by UVR and 109
hydroperiod, respectively — explained 33.9% of the variation in infection prevalence (i.e., 110
rivaling diversity effects). Together, these results highlight that indirect effects of habitat (and 111
diversity) can outweigh direct environmental constraints on disease. 112
113
MATERIALS AND METHODS 114
Study system 115
We examined our different habitat-disease hypotheses using a field survey of amphibian 116
communities in the Peñalara Massif (Guadarrama Mountains National Park, central Spain: 117
40º50’N, 3º57’W). Ten different species of amphibian hosts occur in these sites (see Results for 118
frequencies of each species). However, the outcome of infection varies markedly among host 119
species and stage [12-14, 16]. Again, we focused on two native hosts, the fire salamander and the 120
midwife toad, because these hosts act as key drivers of disease in this system [14, 16]. All 121
samples were collected on site and no animals were harmed during this study. Indiana University 122
Animal Care and Use Committees and Consejería de Medio Ambiente de la Comunidad de 123
Madrid approved sampling protocols and provided permits. 124
125

7
Determinants of UVR: The environmental component of Pathways 1A-C 126
Pathways 1A-C start with hydroperiod but all involve variation in penetration of ultraviolet 127
radiation (UVR) into ponds (left hand side of Pathway 1, Fig. 1). To characterize UVR, we 128
pooled water samples from three different locations in the pond bi-weekly throughout the 2011 129
breeding season. We filtered these samples (pre-combusted, Whatman GF/F, 0.7 µm) and 130
estimated: (i) dissolved organic carbon (DOC; mg C-L, using a Shimadzu TOC-5000 total 131
Organic Carbon Analyzer) and (ii) the absorption coefficient, ad320 m-1 (using a 132
spectrophotometer). DOC and ad320 are generally inversely related to UVR penetration [22, 35]. 133
We then calculated a ‘UVR index’, which combines mean depth of habitat used by larvae, z 134
(measured at 2-15 locations, depending on pond size) and ad320 (m-1). We estimated the mean 135
exposure in the water column, p, by integrating UVR penetration from surface, Lin, to depth (z), 136
L(z), using Lambert-Beer’s law: 137
𝑝𝑝 = !(!)!!"
= 1− !"# (!!")!" (eq. 1) 138
where k is the absorption coefficient (assumed here to equal ad320). This UVR index essentially 139
assesses the relative exposure experienced by a Bd zoospore suspended in the water column 140
[based on: 36, 37]. This metric strongly correlates with UVR reaching depth z, L(z) (Pearson r = 141
0.993, p < 0.0001). We compared variation in depth, DOC, and the UVR index between 142
ephemeral and permanent sites using unpaired, two-tailed t-tests. We tested the directional 143
hypothesis that larvae occupy deeper depths in permanent ponds with one-tailed t-tests and 144
Welch’s heteroscedasticity correction. 145
146
Pathway 1A: UVR Directly Regulates Parasites 147
Experimental Evidence 148

8
We used an in-situ field experiment to examine the direct effect of natural solar radiation 149
(UV-B, UV-A, and photosynthetically active radiation [PAR] combined) on parasite survival 150
(Pathway 1A, Fig. 1A). Specifically, we exposed parasite zoospores to ambient solar radiation in 151
two highly transparent ponds [following 35]. We incubated zoospores [collected following 17] 152
on a standard growth substrate [following 38] in quartz vials (12 replicates per treatment). Vials 153
received either full exposure to radiation (Aclar sleeves, which transmits 100% of PAR [400-800 154
nm] and 99% of UVR [250-399 nm]) or no radiation (thick black polyethylene sleeves) [see 35]. 155
To mimic exposure of zoospores to solar radiation, we suspended vials just below the surface for 156
48 hours. Both ponds experienced nearly identical water temperatures and PAR levels (see 157
supplementary material). At the end of the incubation, we looked for differences in parasite 158
levels (i.e., Bd zoospores) using qPCR [following 39]. We ran each sample in duplicate against 159
replicated standards of 0.1, 1, 10 and 100 genomic equivalents (GE) of zoospores and two 160
negative controls. We considered hosts infected if both duplicates amplified with a mean 161
genomic equivalent ≥ 0.1. From these samples, we calculated infection load (i.e., genomic 162
equivalents of zoospores per host). We tested for an effect of incubation site with ANOVA, 163
sequentially dropping non-significant terms [40]. Our results were qualitatively the same with 164
and without dropping non-significant terms. 165
166
Field Survey 167
Next, we looked for links between UVR (and hydroperiod) and disease using field patterns 168
from natural epidemics in eight permanent and six ephemeral ponds. Data on amphibian hosts 169
(infection prevalence, infection load, relative abundance, and frequency) come from a larger 170
survey conducted throughout the breeding seasons (after ice-melt in May through September) of 171

9
2009 – 2012. At each pond, we collected Bd samples (from epidermal swabs and tissue samples) 172
at approximately the beginning and end of the season. (For ephemeral ponds, the end of the 173
season depended on the hydroperiod of each pond). We estimated the average infection 174
prevalence (proportion infected/total number sampled) from these samples of focal hosts. For 175
each sample, we also recorded host species and stage to compare differences in mean infection 176
load. We fit a linear relationship between UVR and Bd prevalence (i.e., averaged over 2009 - 177
2012) among sites using a generalized linear model (GLM) with binomial errors [40]. We 178
assessed GLM model fit with the coefficient of discrimination, D (similar to an R2 for logistic 179
regression) [41]. 180
181
Pathway 1B: UVR Effect on the Parasite Predator (Zooplankton) Community 182
To characterize zooplankton communities, we collected plankton samples bi-weekly 183
throughout the 2011 breeding season. From each sampling date at each pond, we collected 1L of 184
water from three different locations in the pond and then filtered the entire sample with mesh 185
(153 µm). We preserved zooplankton samples with 70% ethanol for subsequent identification 186
using a dissecting scope at 20 – 50X magnification [20]. The zooplankton sample from one 187
ephemeral site was accidentally lost. Univariate relationships involving log-transformed 188
zooplankton were tested using correlations (where the log-scale preserves normality 189
assumptions). We examined whether community composition of zooplankton varied with UVR 190
penetration (or hydroperiod) using constrained ordination methods [34]. We first log(X +1) 191
transformed these data to help homogenize the variance. Then, we used the Hellinger distance 192
transformation [following 42] prior to a redundancy analysis using 9,999 permutations to test for 193
significance of the relationship (RDA; R package vegan). 194

10
Pathway 1C: UVR Effect on the Composition and Diversity of Host Communities 195
We estimated frequencies of each taxon in the amphibian community using abundance data 196
from the larger multi-year survey (2009-2012). To account for differences in host richness and 197
relative abundance among sites, we calculated the mean inverse Simpson’s diversity index 198
(where larger numbers denote higher diversity) for each site. We tested relationships between 199
UVR and diversity indices using correlations. We also tested for links between UVR and 200
community composition (index by Hellinger distance) using the RDA described for Pathway 1B. 201
202
Pathway 2: Hydroperiod, Stage Structure of Focal Hosts, and Parasite Production 203
We estimated differences in infection load among host stages from the larger multi-year 204
survey (2009-2012). These larval stages are easily differentiated (based on size and distinct color 205
patterning). Infection load data (genomic equivalents per host) were overdispersed. Therefore, 206
we fit zero inflated negative binomial models [43] to log transformed data (R package pscl). We 207
tested the relationship between pond hydroperiod and presence of multi-season larvae of focal 208
hosts using a Fisher’s exact test. 209
210
Synthesis of Indirect Effects Using Variation Partitioning 211
To identify the relative contributions of our three main indirect effects (parasite predators, 212
host diversity, and multi-season larvae), we used a partition of variation based on partial 213
regression analysis [44]. The method separates fractions of variation attributable to each driver 214
alone, independently (a-c), or to fractions shared due to correlation among drivers (d-g). The 215
remaining fraction, the left-over variation unexplained (h), is also calculated. Estimates of 216
independent and shared variation use adjusted R2 values, which provide unbiased estimates [45]. 217

11
Negative fractions indicate that shared partitions explain less variation than random normal 218
variables [34]. Hence, we depict negative fractions of variation in the accompanying Venn 219
diagram as zero overlap. 220
221
RESULTS 222
Determinants of UVR: The environmental components of Pathways 1A-C 223
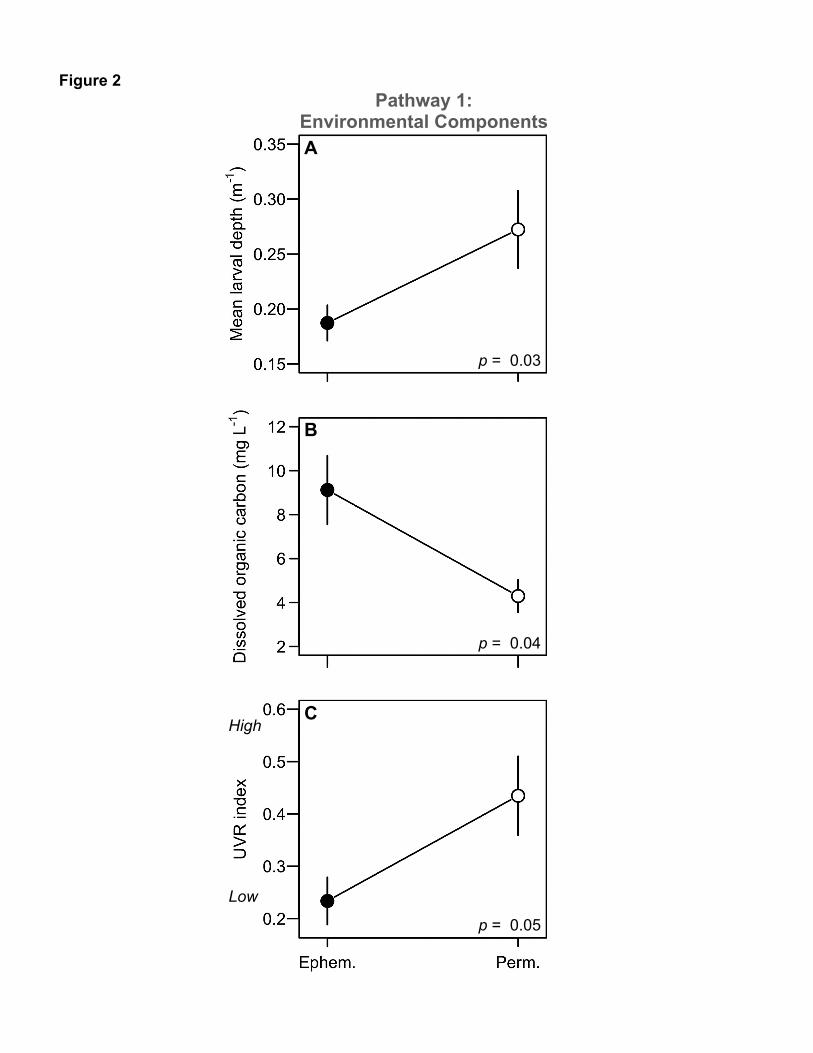
Permanent and ephemeral ponds differed in two key factors that regulate exposure of 224
aquatic organisms to UVR: larval depth and dissolved organic carbon (DOC). Larval hosts in 225
permanent ponds occupied slightly deeper depths relative to hosts in more-shallow, temporary 226
ponds (t-test; t = 2.05, df = 9.69, p = 0.03, n = 14, Fig. 2a). Thus, all else equal, hosts in 227
permanent ponds should have lower UVR exposure. However, permanent sites had lower 228
concentrations of DOC (t-test; t = -2.57, df = 7.18, p = 0.04, n = 14, Fig. 2b). DOC correlated 229
strongly with the absorption coefficient (ad320 m-1) used to calculate the UVR index (Pearson r = 230
0.77, p < 0.0001). Together, DOC and ad320 overwhelmed larval depth as drivers of mean UVR 231
penetration, since permanent sites (slightly deeper but lower DOC) had higher mean penetration 232
of UVR compared to ephemeral sites (UVR index; t-test; t = 2.15, df = 11.10, p = 0.05, n = 14, 233
Fig. 2c). Thus, higher levels of UVR penetrated into the water column in permanent relative to 234
ephemeral sites. 235
236
Pathway 1A: UVR Directly Regulates Parasites 237
The field experiment confirmed that UVR harms zoospores, but epidemics grew larger in 238
ponds with more, not less, UVR. In the field experiment, exposure to solar radiation significantly 239
reduced zoospore levels. There was a main effect of solar radiation (ANOVA, radiation 240

12
treatment: F1,40 = 4.91, p = 0.03, Fig. 3a) but no difference between incubation ponds (pond: F1,39 241
= 2.82, p = 0.10) or their interaction (radiation treatment x pond: F1,38 = 0.55, p = 0.46). These 242
experimental results support the hypothesis that UVR exposure could regulate Bd by directly 243
reducing parasite (zoospore) survival. Yet, sites with higher UVR exposure (permanent sites) had 244
higher — not lower — prevalence of infection (GLM: χ2 = 39.12, df = 1, p < 0.001, D = 0.357, 245
Fig. 3b-c). These field patterns contradict the experimental results that UVR directly regulates 246
parasites via mortality on zoospores. Instead, other factors might overwhelm the direct effects of 247
UVR on parasite survival. 248
249
Pathway 1B: UVR Effect on the Parasite Predator (Zooplankton) Community 250
The UVR-zooplankton-disease link of Pathway 1B was supported. As predicted, sites with 251
higher UVR had lower densities of these parasite predators (Pearson r = 0.611, p = 0.026, Fig. 252
4a). Sites with fewer zooplankton, then, had higher infection prevalence (GLM, χ2 = 13.45, df = 253
1, p < 0.001, D = 0.117, Fig. 4d). Zooplankton density, not zooplankton composition, drove 254
these effects. The community composition of zooplankton was fairly homogenous across focal 255
ponds. Ceriodaphnia spp. (mean frequency: 45%) and copepods (mean: 34%) dominated 256
zooplankton communities. Larger Daphnia spp. were present in only two sites. Composition did 257
not vary with UVR (RDA: F1,11 = 1.65, p = 0.16). Hence, the zooplankton effect involved 258
depression of density of these parasite predators with higher UVR. 259
260
Pathway 1C: UVR Effect on the Composition and Diversity of Host Communities 261
Only part of the UVR-host diversity-disease pathway (1C) was supported. UVR was not 262
related to host composition. Fire salamanders dominated host communities (mean frequency: 263

13
56%; maximum frequency: 100%). The second focal host, the midwife toad (mean: 2%; max: 264
33%) was rarer. The introduced alpine newt, Ichthyosaura alpestris, was the second most 265
common host (mean: 23%; max: 94%). All ‘other’ taxa were considerably less common: the 266
Iberian green frog, Pelophylax perezi (mean: 5%; max: 49%); the treefrog, Hyla molleri (mean: 267
5%; max: 60%); the Iberian frog, Rana iberica (mean: 5%; max: 87%); the native newt, Triturus 268
marmoratus (mean: 2%; max: 17%), and the European toad, Bufo spinosus (mean: 0.04%; max: 269
6%). Hence, UVR could account for variation in community composition among ponds. 270
However, overall host composition did not vary along the UVR gradient (RDA: F1,12 = 1.42, p = 271
0.21). Not surprisingly then, no strong relationships arose between the UVR index and overall 272
host diversity (Pearson r = 0.216, p = 0.458, Fig. 4b), the frequency of focal hosts (r = 0.391, p = 273
0.167, Fig. 4c), or frequency of the second most abundant taxa, the introduced alpine newt (see 274
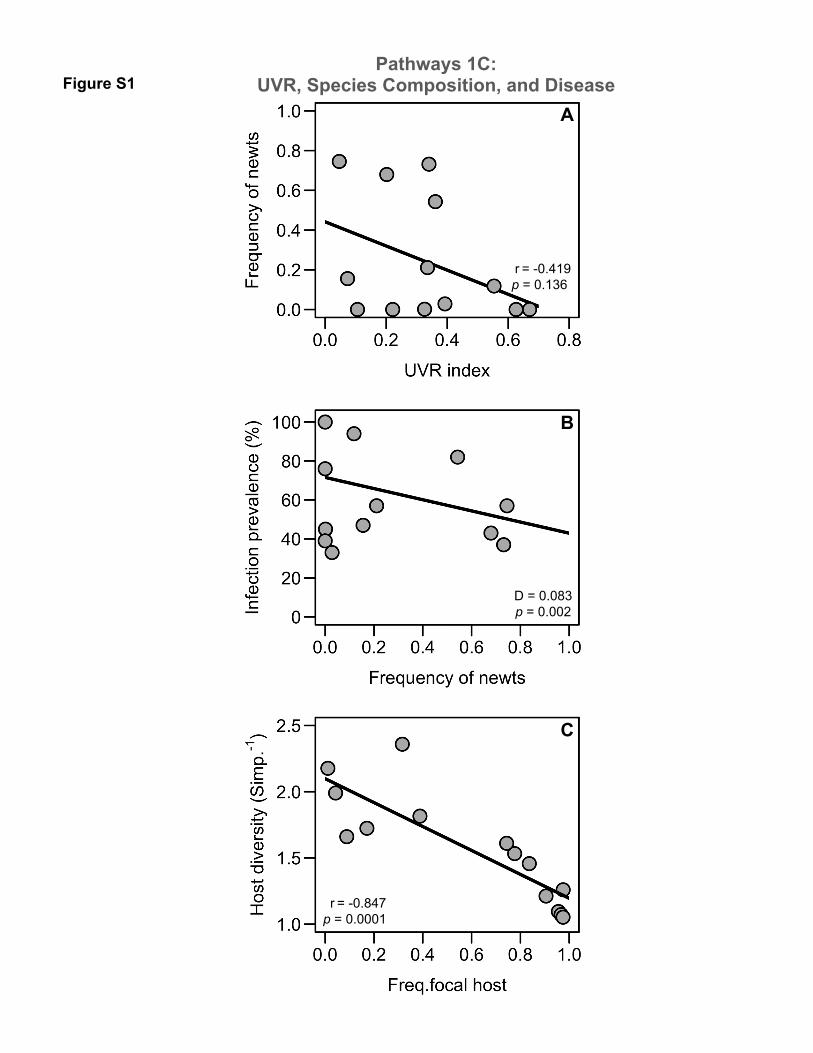
electronic supplementary material; r = -0.419, p = 0.136, Fig. S1a). 275
However, strong host composition-disease links did emerge (in the second part of Pathway 276
1C). Consistent with the dilution effect, sites with high host diversity had lower infection 277
prevalence (GLM, χ2= 27.19, df = 1, p < 0.001, D = 0.265, Fig. 4e). This diversity-disease 278
pattern likely arose because higher diversity of host reflects lower frequencies of our focal hosts 279
(r = -0.847, p = 0.0001, supplementary material Fig. S1c). Indeed, sites dominated by our focal 280
hosts had higher infection prevalence (GLM, χ2= 28.34, df = 1, p < 0.001, D = 0.269, Fig. 4f). 281
Whereas, sites dominated by the introduced alpine newt had lower infection prevalence (GLM, 282
χ2= 9.45, df = 1, p = 0.002, D = 0.083, electronic supplementary material, Fig. S1b). Thus, we 283
found evidence for potential dilution-like effects (but no amplification effects) unrelated to UVR. 284
285
Pathway 2: Hydroperiod, Stage Structure of Focal Hosts, and Parasite Production 286

14
Habitat structure, however, did connect with disease through multi-season larvae. Larger, 287
multi-season larvae produced higher levels of Bd zoospores than conspecific single-season 288
larvae (planned contrasts: p < 0.001; Fig. 5a) or multi-season larvae of newts and ‘other’ hosts 289
(both p < 0.001). Within focal hosts, multi-season larvae of rarer mid-wife toads produced more 290
zoospores than single season conspecific larvae or any stage of salamanders (p values < 0.001; 291
Fig. 5b). Similarly, for salamanders, multi-season larvae supported higher infection loads than 292
their single-season counterparts (p = 0.019). Multi-season larvae of our focal hosts were found in 293
all eight permanent ponds but in none of the six ephemeral ponds (which is very unlikely by 294
chance alone: Fisher’s exact test: p = 0.0003; Fig. 5c). Thus, multi-season partially explain why 295
permanent sites have higher infection prevalence (t-test; t = 2.27, df = 10.98, p = 0.04, n = 14, 296
Fig. 5d), despite having more damaging UVR penetration (Fig. 2c). 297
298
Synthesis of Indirect Effects Using Variation Partitioning 299
The variation partition emphasizes a strong effect of diversity on disease, but it also indicates 300
important, joint effects of parasite predators and multi-stage larvae (Fig. 6). Infection prevalence 301
was well predicted by multiple linear regression with parasite predators (zooplankton), host 302
diversity, and multi-season larvae. Together, all factors explained 64% (R2adjusted = 0.639; Fig. 6) 303
of the variation in infection prevalence across these sites. These indirect effects together 304
overwhelmed the direct damaging effects of UVR on parasite survival. Independently neither 305
zooplankton [fraction a, 1.6% of variation] nor multi-season larvae [c, 4.1%] explained much 306
variation in prevalence. However, together these correlated drivers explained considerably more 307
[f, 28.2%]. Overall, they explained 33.9% of variation in prevalence [a + c + f] — rivaling that 308
explained by host diversity alone [b, 42.4%]. Additionally, host diversity and multi-season larvae 309
15
jointly explained even more variation [e, 9.74%], despite being uncorrelated themselves. 310
Together, host diversity and multi-season larvae uniquely explained much variation in 311
prevalence [b + c + e, 56.2%]. When accounting for the full partition of variation, we found 312
negative variation explained by diversity and zooplankton together [d, -8.75%] and the joint, 313
three-way intersection [g, -13.33%]. Again, these negative fractions seem nonsensical, but they 314
indicate that these shared partitions explain less variation than random normal variables. Hence, 315
these negative fractions are drawn graphically in the Venn diagram as regions with zero overlap 316
[Fig. 6; 34]. The essential point here: together, predators of parasites and host stage structure, 317
linked together via UVR and hydroperiod, explain a similar amount of variation in prevalence as 318
host diversity alone. For completeness, we repeated the analysis replacing host diversity with the 319
frequency of focal hosts or the frequency of introduced newts, the second most common taxa; 320
each additional analysis yielded similar results (see Table S1, electronic supplementary 321
material). 322
323
DISCUSSION 324
We examined whether variation in a key habitat characteristic (hydroperiod) could explain 325
differences in infection prevalence of Bd across natural populations. We tracked factors 326
governing gains and losses of parasite zoospores through two main pathways, all originating with 327
hydroperiod. One suite of habitat-based pathways (Pathway 1A-C) started proximately with 328
variation in penetration of ultraviolet radiation (UVR) into pond water. An in-situ experiment 329
revealed that incident UVR exposure killed the infectious stage of the parasite (Pathway 1A). In 330
the field, however, sites with higher UVR exposure had higher infection prevalence; thus, any 331
direct effects of UVR on zoospores must become overwhelmed by other factors. Indeed, other 332
16
direct and indirect pathways better predicted prevalence. Permanent, high UVR sites had lower 333
density of predators of zoospores (zooplankton, Pathway 1B) and harbored multi-season larval 334
that fueled disease (Pathway 2). Host diversity was unlinked to hydroperiod or UVR (Pathway 335
1C). Nonetheless, sites with higher diversity of hosts (and thus, lower frequencies of focal hosts) 336
had lower prevalence of infection. Thus, while habitat structure explained considerable variation 337
in infection prevalence via pathways involving zooplankton and multi-season larvae, it could not 338
explain everything. Clearly, a multi-pathway approach was needed here: focus on any one 339
pathway alone would have prompted incorrect, incomplete, or potentially misleading 340
conclusions. Armed with additional data, path analysis might further delineate among the 341
correlated pathways that modulate disease in this and other systems [46, 47]. In the meantime, 342
these present results demonstrate the importance of creating mechanistic, food web based links 343
between multiple habitat dimensions and disease [9-11]. 344
Infection reached higher prevalence in ponds with more UVR, despite that UVR reduced 345
survival of the free-living stage of the parasite (i.e., Bd zoospores) by approximately 50%. 346
Additionally, UVR potently regulates a wide-array of terrestrial [reviewed by 48] and aquatic 347
pathogens [see 35 and citations therein]. Could these contrasting results arise because UVR 348
increased host susceptibility (as sometimes seen in other systems [49, 50])? More detailed 349
experiments that account for both negative and beneficial effects of UVR (e.g., UV-A used for 350
photorepair [51]) across a wide range of host species are needed to address this question. 351
Currently, the only study to address this question (to our knowledge) indicates that natural UV-B 352
exposure increased survival of Bd infected toads [13]. Further, in other alpine systems 353
amphibians exhibit behavioral and physiological responses that, combined with natural DOC 354
‘sunscreen’, drastically reduce the deleterious effects of UVR [52, 53]. Together, these results 355

17
(though admittedly limited) do not suggest that UVR exposure increased host susceptibility. 356
Instead, our results indicate that the net effect of UVR on disease depends on both direct and 357
indirect effects mediated through community ecology [10, 35]. 358
Variation in UVR penetration indirectly influenced disease prevalence by constraining 359
predators that consume parasites. Sites with higher UVR had lower zooplankton densities and 360
higher infection prevalence. Lower density of zooplankton matters because they can consume Bd 361
zoospores; therefore, these parasite predators potentially reduce disease risk for hosts [17, 26, 362
54]. The field patterns here suggest that smaller plankton (e.g., Ceriodaphnia and copepods) that 363
dominated these alpine ponds may act as important predators. Bd zoospores [3–5 μm; 18] fall 364
well within the size range of food particles eaten by these plankton [55, 56]; yet, confirmation 365
with experiments (as done with Daphnia) remains important. Nonetheless, this study contributes 366
more broadly to growing evidence that predators play a key role in regulating disease by 367
consuming parasites [reviewed by 57]. This potential has sparked discussion about using 368
predators of parasites such as zooplankton as ‘biocontrols’. However, any intentional 369
introduction of predators could be undermined by environmental (e.g., UV) or food web 370
constraints [11]. Here, for example, introducing zooplankton in these alpine sites could be 371
undermined by strong UVR constraints. Such environmental constraints and food web effects 372
associated with predators of parasites should be taken into account in disease management plans 373
attempting to use them [11, 57, 58]. 374
Hydroperiod also influenced epidemic size because permanent ponds supported multi-season 375
larvae, key producers of parasite propagules.More specifically, multi-season larvae of the focal 376
hosts — not the introduced newt or ‘other’ hosts — harbored high infection loads that drove 377
disease. In a comparable amphibian system in California, multi-season larvae with high infection 378

18
loads also serve as intraspecific reservoirs that maintain Bd infections [2]. Furthermore, this 379
result adds to mounting evidence that stage structure of hosts matters for disease more broadly 380
[59-62]. Here, as in other systems, larger hosts produce more parasites, which can increase 381
disease [63-65]. Thus, stage-specific differences in key epidemiological traits could inform 382
management strategies in various host-parasite systems. For example, across many sites, Bd has 383
reached an endemic state. Thanks to successful captive breeding programs, host re-introduction 384
plans now become feasible. The results here caution that the reintroduction of certain hosts with 385
extended larval stages could undermine post-epidemic reintroduction efforts if they produce 386
large numbers of parasites. Thus, management plans that do not consider the effects of host 387
stage-structure could catalyze reemerging epidemics. 388
The composition of host communities was linked to lower infection prevalence (potentially 389
through various mechanisms discussed below). Somewhat surprisingly, UVR did not shaped host 390
composition, as seen in other alpine-amphibian communities [52]. Perhaps other unmeasured 391
habitat characteristic structure the host communities focused on here. Regardless, sites with 392
higher host diversity had lower infection prevalence. This diversity-disease link could arise 393
through a potential dilution effect whereby highly competent and abundant species (our focal 394
host species) become less common in more diverse amphibian communities [32]. Future studies 395
combining experiments and field surveys (with more accurate density estimates of host species) 396
will help pinpoint the key species and their epidemiological traits that regulate Bd via dilution. 397
That information would enable a more mechanistic valuation of dilution in this host-parasite 398
system [66, 67]. 399
400
CONCLUSIONS 401
19
Habitat-mediated indirect effects joined host diversity to shape infection prevalence via 402
losses and gains of parasites. UVR reduced parasite survival by ~50%. Despite these direct 403
effects, permanent, high UVR sites likely experienced net gains of parasites due to the reduction 404
of UV-sensitive predators and high parasite production from multi-season larvae. Therefore, 405
indirect pathways created double jeopardy for hosts in permanent ponds with higher UVR. Host 406
diversity may sometimes counter these gains of parasites: more diverse sites had lower infection 407
prevalence. However, diversity was unconnected to UVR penetration. Thus, while host diversity 408
may regulate Bd [as seen in 66, 67], it could not explain why Bd became more prevalent in 409
permanent ponds having higher UVR penetration. More broadly, this work highlights the need 410
for a more integrative approach to linking habitat variation (e.g., UVR) to disease. 411
412
ACKNOWLEDGMENTS 413
We thank the Park service at Guadarrama Mountains National Park and Bárbara Martín for 414
invaluable assistance with this project. Matthew C. Fisher provided zoospores for the field 415
experiment. Indiana University Animal Care and Use Committees and Consejería de Medio 416
Ambiente de la Comunidad de Madrid provided permits. JLH was supported by a STAR 417
Fellowship from the USA EPA and Grants from Indiana University. Data and code used in this 418
manuscript are available from the Dryad Digital Repository:doi:10.5061/dryad.gt57f 419
420 421
REFERENCES422
1. Castro F.d., Bolker B. Mechanisms of disease-induced extinction. Ecology Letters 8, 117-423126. 424
2. Briggs C.J., Knapp R.A., Vredenburg V.T. 2010 Enzootic and epizootic dynamics of the 425chytrid fungal pathogen of amphibians. Proceedings of the National Academy of Sciences 426107(21), 9695-9700. (doi:10.1073/pnas.0912886107). 427

20
3. Vredenburg V.T., Knapp R.A., Tunstall T.S., Briggs C.J. 2010 Dynamics of an emerging 428disease drive large-scale amphibian population extinctions. Proceedings of the National 429Academy of Sciences 107(21), 9689-9694. (doi:10.1073/pnas.0914111107). 430
4. Bosch J., Martinez-Solano I., Garcia-Paris M. 2001 Evidence of a chytrid fungus 431infection involved in the decline of the common midwife toad (Alytes obstetricans) in protected 432areas of central Spain. Biological Conservation 97(3), 331-337. (doi:10.1016/s0006-4333207(00)00132-4). 434
5. Muths E., Corn P.S., Pessier A.P., Green D.E. 2003 Evidence for disease-related 435amphibian decline in Colorado. Biological Conservation 110(3), 357-365. (doi:10.1016/s0006-4363207(02)00239-2). 437
6. Murray K.A., Skerratt L.F., Speare R., McCallum H. 2009 Impact and dynamics of 438disease in species threatened by the amphibian chytrid fungus, Batrachochytrium dendrobatidis. 439Conservation Biology 23(5), 1242-1252. (doi:10.1111/j.1523-1739.2009.01211). 440
7. Savage A.E., Becker C.G., Zamudio K.R. 2015 Linking genetic and environmental 441factors in amphibian disease risk. Evolutionary Applications 8(6), 560-572. 442(doi:10.1111/eva.12264). 443
8. Becker C.G., Zamudio K.R. 2011 Tropical amphibian populations experience higher 444disease risk in natural habitats. Proceedings of the National Academy of Sciences of the United 445States of America 108(24), 9893-9898. (doi:10.1073/pnas.1014497108). 446
9. Johnson P.T.J., Chase J.M. 2004 Parasites in the food web: linking amphibian 447malformations and aquatic eutrophication. Ecology Letters 7(7), 521-526. (doi:10.1111/j.1461-4480248.2004.00610). 449
10. Penczykowski R.M., Hall S.R., Civitello D.J., Duffy M.A. 2014 Habitat structure and 450ecological drivers of disease. Limnology and Oceanography 59(2), 340-348. 451(doi:10.4319/lo.2014.59.2.0340). 452
11. Hall S.R., Tessier A.J., Duffy M.A., Huebner M., Cáceres C.E. 2006 Warmer does not 453have to mean sicker: temperature and predators can jointly drive timing of epidemics. Ecology 45487(7), 1684-1695. (doi:10.1890/0012-9658). 455
12. Garner T.W.J., Walker S., Bosch J., Leech S., Marcus Rowcliffe J., Cunningham A.A., 456Fisher M.C. 2009 Life history tradeoffs influence mortality associated with the amphibian 457pathogen Batrachochytrium dendrobatidis. Oikos 118(5), 783-791. (doi:10.1111/j.1600-4580706.2008.17202.x). 459
13. Bosch J., Martinez-Solano I. 2006 Chytrid fungus infection related to unusual mortalities 460of Salamandra salamandra and Bufo bufo in the Penalara Natural Park, Spain. Oryx 40(1), 84-46189. (doi:10.1017/s0030605306000093). 462

21
14. Fernández-Beaskoetxea S., Bosch J., Bielby J. 2016 Infection and transmission 463heterogeneity of a multi-host pathogen (Batrachochytrium dendrobatidis) within an amphibian 464community. Diseases of Aquatic Organisms 118(1), 11-20. (doi:10.3354/dao02963). 465
15. Ortiz-Santaliestra M.E., Fisher M.C., Fernández-Beaskoetxea S., Fernández-Benéitez 466M.J., Bosch J. 2011 Ambient ultraviolet B padiation and prevalence of infection by 467Batrachochytrium dendrobatidis in two amphibian species. Conservation Biology 25(5), 975-468982. (doi:10.1111/j.1523-1739.2011.01700). 469
16. Medina D., Garner T.W.J., Carrascal L.M., Bosch J. 2015 Delayed metamorphosis of 470amphibian larvae facilitates Batrachochytrium dendrobatidis transmission and persistence. 471Diseases of Aquatic Organisms 117(2), 85-92. (doi:10.3354/dao02934). 472
17. Searle C.L., Mendelson J.R., III, Green L.E., Duffy M.A. 2013 Daphnia predation on the 473amphibian chytrid fungus and its impacts on disease risk in tadpoles. Ecology and Evolution 4743(12), 4129-4138. (doi:10.1002/ece3.777). 475
18. Longcore J.E., Pessier A.P., Nichols D.K. 1999 Batrachochytrium dendrobatidis gen et 476sp nov, a chytrid pathogenic to amphibians. Mycologia 91(2), 219-227. (doi:10.2307/3761366). 477
19. Mitchell K.M., Churcher T.S., Garner T.W.J., Fisher M.C. 2008 Persistence of the 478emerging pathogen Batrachochytrium dendrobatidis outside the amphibian host greatly increases 479the probability of host extinction. Proceedings of the Royal Society B-Biological Sciences 480275(1632), 329-334. (doi:10.1098/rspb.2007.1356). 481
20. Toro M., Granados I. 1998 Inventario, cartografía y caracterización de las charcas y 482lagunas del parque natural de la cumbre, circo y lagunas de Peñalara. Consejería de Medio 483Ambiente y Desarrollo Regional Comunidad de Madrid 484
21. Williamson C.E., Fischer J.M., Bollens S.M., Overholt E.P., Breckenridge J.K. 2011 485Toward a more comprehensive theory of zooplankton diel vertical migration: Integrating 486ultraviolet radiation and water transparency into the biotic paradigm. Limnology and 487Oceanography 56(5), 1603-1623. (doi:10.4319/lo.2011.56.5.1603). 488
22. Rose K.C., Williamson C.E., Saros J.E., Sommaruga R., Fischer J.M. 2009 Differences in 489UV transparency and thermal structure between alpine and subalpine lakes: implications for 490organisms. Photochemical & Photobiological Sciences 8(9), 1244-1256. 491(doi:10.1039/b905616e). 492
23. Walker S.F., Bosch J., Gomez V., Garner T.W.J., Cunningham A.A., Schmeller D.S., 493Ninyerola M., Henk D.A., Ginestet C., Arthur C.-P., et al. 2010 Factors driving pathogenicity vs. 494prevalence of amphibian panzootic chytridiomycosis in Iberia. Ecology Letters 13(3), 372-382. 495(doi:10.1111/j.1461-0248.2009.01434.x). 496
24. Hall S.R., Smyth R., Becker C.R., Duffy M.A., Knight C.J., MacIntyre S., Tessier A.J., 497Cáceres C.E. 2010 Why are Daphnia in some lakes sicker? Disease ecology, habitat structure, 498and the plankton. Bioscience 60(5), 363-375. (doi:10.1525/bio.2010.60.5.6). 499

22
25. Johnson P.T.J., Dobson A., Lafferty K.D., Marcogliese D.J., Memmott J., Orlofske S.A., 500Poulin R., Thieltges D.W. 2010 When parasites become prey: ecological and epidemiological 501significance of eating parasites. Trends in ecology & evolution (Personal edition) 25(6), 362-502371. (doi:10.1016/j.tree.2010.01.005). 503
26. Hamilton P.T., Richardson J.M.L., Anholt B.R. 2012 Daphnia in tadpole mesocosms: 504trophic links and interactions with Batrachochytrium dendrobatidis. Freshwater Biology 57(4), 505676-683. (doi:10.1111/j.1365-2427.2011.02731.x). 506
27. Buck J., Truong L., Blaustein A. 2011 Predation by zooplankton on Batrachochytrium 507dendrobatidis: biological control of the deadly amphibian chytrid fungus? Biodivers Conserv 50820(14), 3549-3553. (doi:10.1007/s10531-011-0147-4). 509
28. Douglas C. Woodhams J.B., Cheryl J Briggs, Scott Cashins, Leyla R Davis, Antje Lauer, 510Erin Muths, Robert Puschendorf, Benedikt R Schmidt, Brandon Sheafor, and Jamie Voyles. 5112011 Mitigating amphibian disease: strategies to maintain wild populations and control 512chytridiomycosis. Frontiers in Zoology 8(8), 1-23. 513
29. Resetarits W.J., Wilbur H.M. 1989 Choice of oviposition site by Hyla chrysoscelis: the 514role of predators and competitors 515. Ecology 70(1), 220-228. (doi:10.2307/1938428). 516
30. Bosch J., Martinez-Solano I. 2003 Factors influencing occupancy of breeding ponds in a 517Montane amphibian assemblage. Journal of Herpetology 37(2), 410-413. (doi:10.1670/0022-5181511). 519
31. Rudolf V.H.W., Rodel M.O. 2005 Oviposition site selection in a complex and variable 520environment: the role of habitat quality and conspecific cues. Oecologia 142(2), 316-325. 521(doi:10.1007/s00442-004-1668-2). 522
32. Keesing F., Belden L.K., Daszak P., Dobson A., Harvell C.D., Holt R.D., Hudson P., 523Jolles A., Jones K.E., Mitchell C.E., et al. 2010 Impacts of biodiversity on the emergence and 524transmission of infectious diseases. Nature 468(7324), 647-652. (doi:10.1038/nature09575). 525
33. Borer E.T., Mitchell C.E., Power A.G., Seabloom E.W. 2009 Consumers indirectly 526increase infection risk in grassland food webs. Proceedings of the National Academy of Sciences 527of the United States of America 106(2), 503-506. (doi:10.1073/pnas.0808778106). 528
34. Legendre L., Legendre, P. . 1998 Numerical Ecology. Second ed. Amsterdam, 529Netherlands, Elsevier 530
35. Overholt E.P., Hall S.R., Williamson C.E., Meikle C.K., Duffy M.A., Cáceres C.E. 2012 531Solar radiation decreases parasitism in Daphnia. Ecology Letters 15(1), 47-54. 532(doi:10.1111/j.1461-0248.2011.01707.x). 533
36. Walker S.F., Salas M.B., Jenkins D., Garner T.W.J., Cunningham A.A., Hyatt A.D., 534Bosch J., Fisher M.C. 2007 Environmental detection of Batrachochytrium dendrobatidis in a 535temperate climate. Diseases of Aquatic Organisms 77(2), 105-112. (doi:10.3354/dao01850). 536
23
37. Kirshtein J.D., Anderson C.W., Wood J.S., Longcore J.E., Voytek M.A. 2007 537Quantitative PCR detection of Batrachochytrium dendrobatidis DNA from sediments and water. 538Diseases of Aquatic Organisms 77(1), 11-15. (doi:10.3354/dao01831). 539
38. Piotrowski J.S., Annis S.L., Longcore J.E. 2004 Physiology of Batrachochytrium 540dendrobatidis, a chytrid pathogen of amphibians. Mycologia 96(1), 9-15. (doi:10.2307/3761981). 541
39. Boyle D., Boyle D., Olsen V., Morgan J., Hyatt A. 2004 Rapid quantitative detection of 542chytridiomycosis (Batrachochytrium dendrobatidis) in amphibian samples using real-time 543Taqman PCR assay. Diseases of aquatic organisms 60, 141-148. (doi:10.3354/dao060141). 544
40. Crawley M.J. 2007 The R Book. West Sussex, England., John Wiley and Sons, Ltd. 545
41. Tjur T. 2009 Coefficients of determination in logistic regression models-A new proposal: 546the coefficient of discrimination. American Statistician 63(4), 366-372. 547(doi:10.1198/tast.2009.08210). 548
42. Legendre P., Gallagher E.D. 2001 Ecologically meaningful transformations for 549ordination of species data. Oecologia 129(2), 271-280. (doi:10.1007/s004420100716). 550
43. Long J.S. 1997 Regression models for categorical and limited dependent variables. 551Thousand Oaks, CA. USA, Sage Publications. 552
44. Legendre P., L. Legendre. 1998 Numerical ecology. Second ed. Amsterdam, Elsevier. 553
45. Peres-Neto P.R., Legendre P., Dray S., Borcard D. 2006 Variation partitioning of species 554data matrices: Estimation and comparison of fractions. Ecology 87(10), 2614-2625. 555(doi:10.1890/0012-9658(2006)87[2614:vposdm]2.0.co;2). 556
46. Civitello D.J., Penczykowski R.M., Smith A.N., Shocket M.S., Duffy M.A., Hall S.R. 5572015 Resources, key traits and the size of fungal epidemics in Daphnia populations. Journal of 558Animal Ecology 84(4), 1010-1017. (doi:10.1111/1365-2656.12363). 559
47. Strauss A.T., Shocket M.S., Civitello D.J., Hite J.L., Penczykowski R.M., Duffy M.A., 560Cáceres C.E., Hall S.R. 2016 Habitat, predators, and hosts regulate disease in Daphnia through 561direct and indirect pathways. Ecological Monographs, n/a-n/a. (doi:10.1002/ecm.1222). 562
48. Raviv M., Antignus Y. 2004 UV radiation effects on pathogens and insect pests of 563greenhouse-grown crops. Photochemistry and Photobiology 79(3), 219-226. (doi:10.1562/si-03-56414.1). 565
49. Giannini M.S.H. 1986 Suppresion of pathenogenesis in cutaneous Leishmaniasis by UV 566irradiation. Infection and immunity 51(3), 838-843. 567
50. Goettsch W., Garssen J., Deijns A., Degruijl F.R., Vanloveren H. 1994 UV-B exposure 568impairs resistance to infection by trichinella-spiralis Environmental Health Perspectives 102(3), 569298-301. 570

24
51. Williamson C.E., Neale P.J., Grad G., De Lange H.J., Hargreaves B.R. 2001 Beneficial 571and detrimental effects of UV on aquatic organisms: Implications of spectral variation. 572Ecological Applications 11(6), 1843-1857. (doi:10.2307/3061100). 573
52. Palen W.J., Williamson C.E., Clauser A.A., Schindler D.E. 2005 Impact of UV-B 574exposure on amphibian embryos: linking species physiology and oviposition behaviour. 575Proceedings of the Royal Society B-Biological Sciences 272(1569), 1227-1234. 576(doi:10.1098/rspb.2005.3058). 577
53. Palen W.J., Schindler D.E. 2010 Water clarity, maternal behavior, and physiology 578combine to eliminate UV radiation risk to amphibians in a montane landscape. Proceedings of 579the National Academy of Sciences of the United States of America 107(21), 9701-9706. 580(doi:10.1073/pnas.0912970107). 581
54. Gleason F.H., Kagami M., Lefevre E., Sime-Ngando T. 2008 The ecology of chytrids in 582aquatic ecosystems: roles in food web dynamics. Fungal Biology Reviews 22(Part 1), 17-25. 583(doi:10.1016/j.fbr.2008.02.001). 584
55. Porter K.G., Feig Y.S., Vetter E.F. 1983 Morphology, flow regimes, and filtering rates of 585Daphnia, Ceriodaphnia, and Bosmina fed natural bacteria 586. Oecologia 58(2), 156-163. (doi:10.1007/bf00399211). 587
56. Kagami M., Helmsing N.R., van Donk E. 2011 Parasitic chytrids could promote copepod 588survival by mediating material transfer from inedible diatoms. Hydrobiologia 659(1), 49-54. 589(doi:10.1007/s10750-010-0274-z). 590
57. Johnson P.T.J., Dobson A., Lafferty K.D., Marcogliese D.J., Memmott J., Orlofske S.A., 591Poulin R., Thieltges D.W. 2010 When parasites become prey: ecological and epidemiological 592significance of eating parasites. Trends in ecology & evolution 25(6), 362-371. 593
58. Packer C., Holt R.D., Hudson P.J., Lafferty K.D., Dobson A.P. 2003 Keeping the herds 594healthy and alert: implications of predator control for infectious disease. Ecology Letters 6(9), 595797-802. (doi:10.1046/j.1461-0248.2003.00500). 596
59. Hite J.L., Penczykowski R.M., Shocket M.S., Strauss A.T., Orlando P.A., Duffy M.A., 597Cáceres C.E., Hall S.R. 2016 Parasites destabilize host populations by shifting stage-structured 598interactions. Ecology 97(2), 439-449. (doi:10.1890/15-1065.1). 599
60. Hall S.R., Becker C., Simonis J., Brown C.A., Nisbet R.N., Tessier A.J., Cáceres C.A. 6002007 Eating yourself sicker: Resource ecology of virulence in planktonic and plant systems. 601Ecological Society of America Annual Meeting Abstracts. (doi:10.1086/600086). 602
61. Dwyer G. 1991 The Roles of Density, Stage, and Patchiness in the Transmission of an 603Insect Virus. Ecology 72(2), 559-574. (doi:10.2307/2937196). 604
62. Tate A.T., Rudolf V.H.W. 2012 Impact of life stage specific immune priming on 605invertebrate disease dynamics. Oikos 121(7), 1083-1092. (doi:10.1111/j.1600-0706.2011.19725). 606

25
63. Auld S.K., Hall S.R., Housley Ochs J., Sebastian M., Duffy M.A. 2014 Predators and 607patterns of within-host growth can mediate both among-host competition and evolution of 608transmission potential of parasites. Am Nat 184 Suppl 1, S77-90. (doi:10.1086/676927). 609
64. Krist A.C., Jokela J., Wiehn J., Lively C.M. 2004 Effects of host condition on 610susceptibility to infection, parasite developmental rate, and parasite transmission in a snail-611trematode interaction. Journal of Evolutionary Biology 17(1), 33-40. (doi:10.1046/j.1420-6129101.2003.00661.x). 613
65. Duffy M.A., Housley J.M., Penczykowski R.M., Caceres C.E., Hall S.R. 2011 Unhealthy 614herds: indirect effects of predators enhance two drivers of disease spread. Functional Ecology 61525(5), 945-953. (doi:10.1111/j.1365-2435.2011.01872). 616
66. Searle C.L., Biga L.M., Spatafora J.W., Blaustein A.R. 2011 A dilution effect in the 617emerging amphibian pathogen Batrachochytrium dendrobatidis. Proceedings of the National 618Academy of Sciences. (doi:10.1073/pnas.1108490108). 619
67. Han B.A., Kerby J.L., Searle C.L., Storfer A., Blaustein A.R. 2015 Host species 620composition influences infection severity among amphibians in the absence of spillover 621transmission. Ecology and Evolution 5(7), 1432-1439. (doi:10.1002/ece3.1385). 622
623
26
FIGURE LEGENDS 624
Figure 1. Hypothesized pathways connecting habitat to infection prevalence of Bd in 625
communities of amphibian hosts. Hydroperiod (ephemeral vs. permanent) is the ultimate driver 626
of disease in this alpine system. However, it influences disease via two pathways that modulate 627
gains and losses of parasite propagules (zoospores). Pathway 1A-C: Permanent ponds are deeper, 628
but have less dissolved organic carbon (DOC) and therefore higher exposure to damaging 629
ultraviolet radiation (UVR). UVR could directly damage zoospores (bottom, pathway 1A), 630
reduce zooplankton predators of zoospores (1B), or alter host composition (top, 1C). Dilution (—631
) or amplification (+) effects could arise from UVR-mediated changes in host community 632
composition. Pathway 2: Permanent ponds harbor multi-season larvae that produce high 633
densities of parasite zoospores. Positive (+) and negative (—) symbols denote the sign of 634
predicted relationships. 635
Figure 2. Environmental components linking habitat features of alpine ponds with changes 636
in ultraviolet radiation (UVR) —Pathway 1:(A) All else equal, permanent (Perm.) sites were 637
deeper than ephemeral (Ephem.) ones. (B) However, permanent sites had less dissolved organic 638
carbon (DOC). (C) Thus, UVR exposure was higher in deeper, permanent sites (large values of 639
“UVR index” indicate higher mean penetration of UVR in the water column [equ. 1]). Data are 640
means ± bootstrapped SE. 641
Figure 3. Pathway 1A, UVR directly regulates parasites: (A) In situ, exposure to solar 642
radiation (UVR + PAR) reduced survival of zoospores. However, (B) sites with higher UVR had 643
more disease. (C) Permanent sites have higher UVR exposure and prevalence (E: ephemeral; P: 644
permanent). Data are means ± bootstrapped SE. 645
Figure 4. Connections between habitat and disease via parasite predators (zooplankton; 646
27
Pathway 1B) and host communities (Pathway 1C). (A-C) Habitat-composition links: (A) Sites 647
with higher UVR index (i.e., higher mean levels of UVR) had lower density of zooplankton. 648
There was no relationship between UVR and (B) overall host diversity or (C) the frequency of 649
our focal hosts. (D-F) Composition-disease links: Infection prevalence was higher in ponds with 650
(D) lower zooplankton density, (E) lower host diversity, and (F) higher frequency of focal hosts. 651
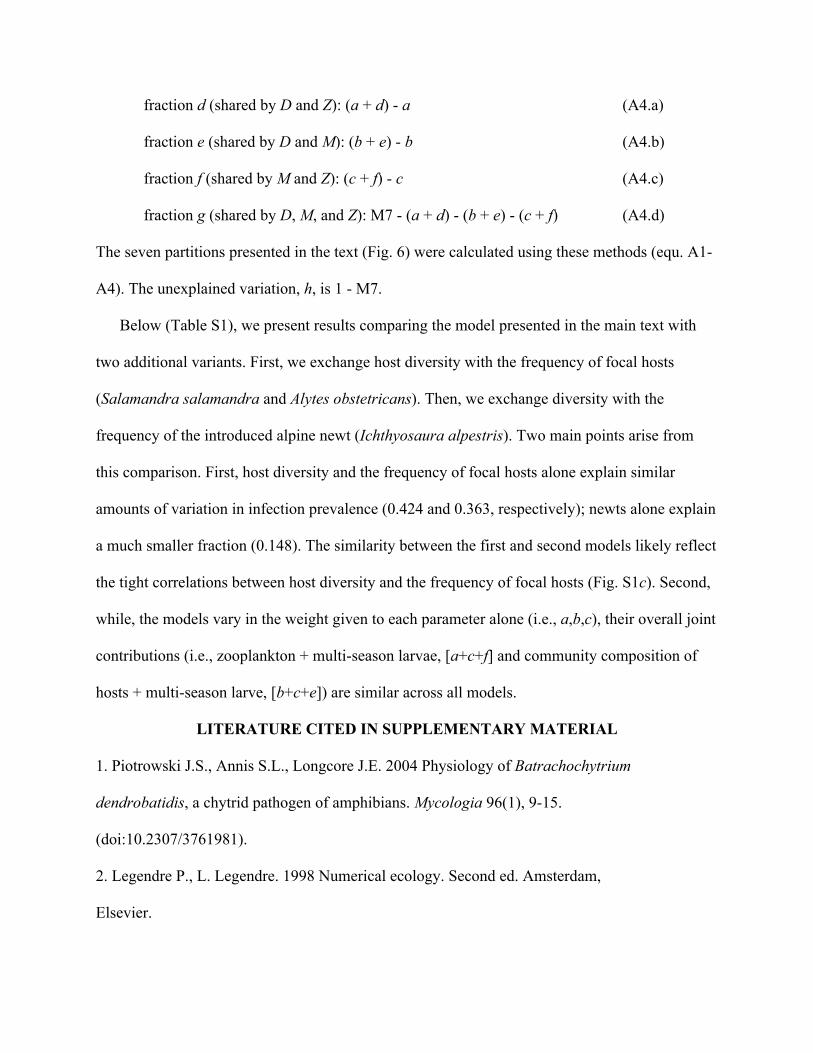
Figure 5. Linking habitat, host stage structure, and disease (Pathway 2). (A-B) Infection 652
loads from host stages. (A) Infection loads were ~ an order of magnitude higher in multi-season 653
larvae of focal hosts (triangles) than in their single-season counterparts, newts (squares), or the 654
‘other’ host species (circles). (B) Infection loads were higher in rarer mid-wife toads than in 655
more dominant salamander hosts. Different letters indicate significant differences in planned a 656
priori contrasts. (C) Multi-season larvae of the focal hosts lived in all permanent but no 657
ephemeral sites. Data are means ± bootstrapped SE. 658
Figure 6. Variation partitioning of infection prevalence of Bd across 14 alpine ponds 659
(Pathways 1 and 2). The rectangle represents total variation in prevalence (100%). Together, 660
parasite predators (zooplankton, Z), multi-season larvae, MSL (M), and host diversity (D) 661
explained (64%, i.e., R2adjusted = 0.639) of the variation (filled in circles, accounting for negative 662
variation). This leaves the fraction h, 36.1%, as unexplained variation (white area). However, 663
zooplankton [fraction a, 1.6%] and MSL [c, 4.1%] explained only a small fraction of prevalence 664
themselves. Yet due to habitat-mediated correlation between them, they jointly explained a larger 665
fraction [f, 28.2%]. Hence, together, they explain 33.9% of variation [a + c + f]. That fraction 666
rivals the amount explained by diversity alone [b, 42.4%]. Additionally, diversity and MSL 667
shared variation [e, 13.8%], despite being uncorrelated themselves. Together, diversity and MSL 668
uniquely explained high variation in prevalence [b + c + e, 56.2%]. The full partition includes 669

28
negative variation explained by diversity and zooplankton together [d, -4.7%] and the joint, 670
three-way intersection [g, -17.38%] (see text for explanation). Those regions of negative 671
variation are drawn here as zero overlap. 672
Hydroperiod (e.g., permanent)
Stage structure of hosts
(multi-season larvae)
UVR exposure
Density of parasite predators
(zooplankton)
Disease prevalence
Pathway #1
Pathway #2
Habitat driver
Proximate drivers
Parasite gains/losses
Composition of host communities
—
—/+ —/+
Pond Depth
DOC
—
Dilution/ amplification
—
+
+
+
— UVR damage
Production of parasite zoospores
UVR damage
Figure 1
Parasite zoospores
+
Disease severity
Pathway 1B
Pathway 1C
Pathway 1A
—
A
B
C
p = 0.05
p = 0.04
p = 0.03
Pathway 1: Environmental Components
Low
Figure 2
High

A
B
C
D = 0.357 p < 0.001
E
P
p = 0.03
Figure 3
Pathway 1A: UVR Directly Regulates Parasites

A
B
C
D
E
F
r = 0.611 p = 0.026
D = 0.117 p < 0.001
D = 0.265 p < 0.001
r = 0.391 p = 0.167
D = 0.269 p < 0.001
r = 0.216
p = 0.458
Pathways 1B & C: UVR, Species Composition, and Disease
Figure 4

Pathway 2: Hydroperiod, Host Stage Structure, & Parasite Production
A
Focal
All hosts
Others a
Newts
b
cc
Salamander
Mid-wife toad
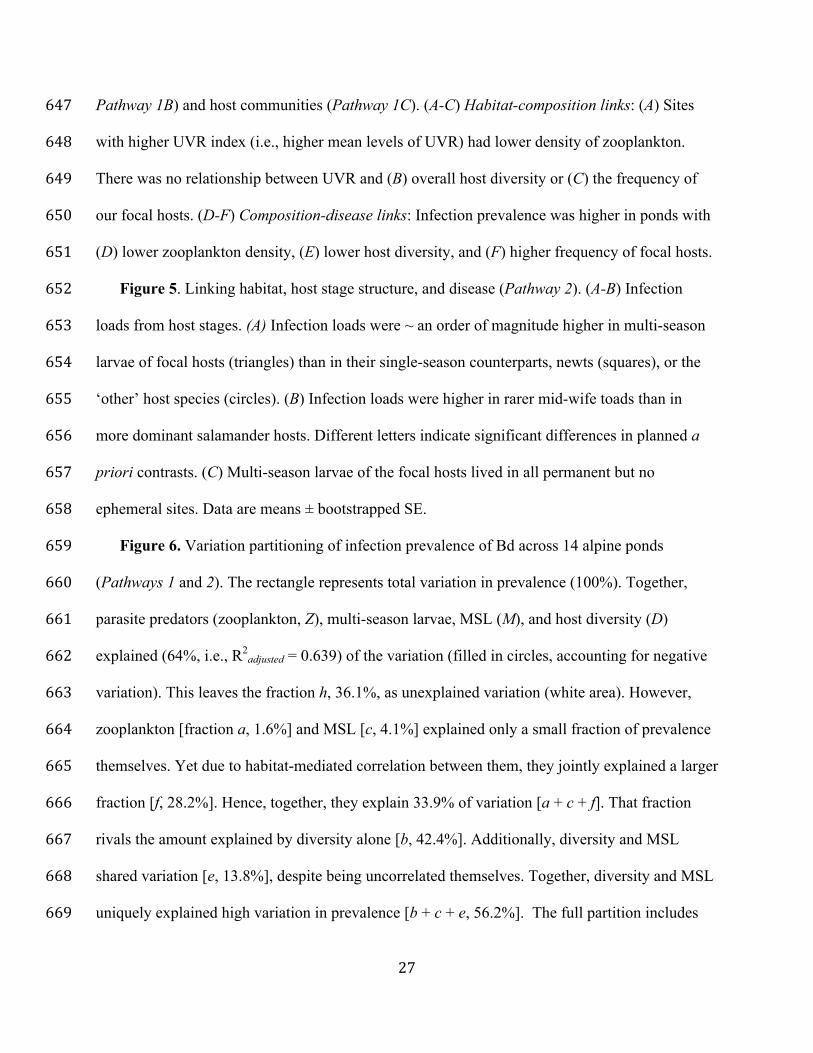
c
b
a
B
C
Figure5
p = 0.0003

Shared Z&D, [d]: -0.088 Shared D, M, Z, [g]: -0.133
Zooplankton, Z, alone [a]
(0.016)
Diversity, D, alone [b]
(0.424)
Multi-season larvae, M, alone [c]
(0.041)
Shared Z&M, [f] (0.282)
Shared D&M, [e] (0.097)
Unexplained [h] = 0.361

ELECTRONIC SUPPLEMENTARY MATERIALS
In this supplement we present additional methods, and results from the in situ experiment, the
field survey, and variation partitioning based on partial regression analysis. We also present two
additional versions of the variation partitioning first substituting the frequency of focal hosts and
then the frequency of the introduced alpine newt (Table S1).
ADDITIONAL METHODS AND RESULTS
Estimates of UVR exposure in the field experiment
During the incubation period, we measured PAR in the water column and water temperature
to characterize differences between ponds. Accurately measuring UVR in the field is
challenging, and due to logistical constraints, equipment was limited. Therefore, to provide an
index of solar radiation, we measured photosynthetically active radiation (PAR) using a light
meter (Li-Cor, Lincoln, Nebraska USA). Specifically, we measured (PAR) at three depths in
each pond, once every hour during mid-day from 11:00 hours – 13:00 hours, then calculated the
average solar radiation for each pond. There was no significant difference in mean PAR levels
between the two incubation ponds (PAR t-test; t = 0.72, df = 30, p = 0.48, n = 33).
We also measured water temperature in each incubation pond for a portion of the assay. We
measured water temperature every thirty minutes throughout from 9:30 – 14:00 hours (using a
hand-held Horiba D55 meter, Southwest Scientific), and calculated the mean temperature. There
was no significant difference in mean water temperature levels between the two incubation
ponds (PAR t-test; t = 0.85, df = 20.78, p = 0.40, n = 23).
Pathway 1C: UVR Effect on the Composition and Diversity of Host Communities
There was no relationship between UVR and the frequency of the introduced alpine newt

(Pearson r = 0.419, p = 0.136 Fig. S1a). Sites dominated by the introduced alpine newt had lower
infection prevalence (GLM, χ2= 9.45, df = 1, p = 0.002, D = 0.083, Fig. S1b). Higher host
diversity reflected lower frequencies of the focal hosts (r = -0.847, p = 0.0001, Fig S1c).
Synthesis: Variation Partitioning
In the text, we briefly describe a partition of variation using three potentially correlated
explanatory variables. The partition using three variables requires an extension of the two
variable method described previously (Legendre and Legendre 2012). Readers of the recipe
below must understand the two variable case first, as we merely aim here to describe, in words,
the strategy used in Legendre’s varpart code for R (part of the vegan package); we borrow that
code’s strategy directly. Here, we partition variation in prevalence (P) as functions of host
diversity (D), abundance of zooplankton predators (Z), and presence or absence of multi-season
larvae (M). The partition involves three steps.
Step 1: Five simple or multiple regression analyses (all linear) are needed. The format
below for the regression models is, e.g., dependent variable ~ sum of independent variables
Model 1 (M1), fractions a, f, d, g: P ~ Z (A1.a)
Model 2 (M2), fractions c, e, f, g: P ~ M (A1.b)
Model 3 (M3), fractions b, d, e, g: P ~ D (A1.c)
Model 4 (M4), fractions a, b, d, e, f, g: P ~ Z + D (A1.d)
Model 5 (M5), fractions a, c, d, e, f, g: P ~ Z + M (A1.e)
Model 6 (M6), fractions b, c, d, e, f, g: P ~ D + M (A1.f)
Model 7 (M7), all fractions a through g: P ~ D + M + Z (A1.g)

where models M1 to M3 (equs. A1.a-c) are simple linear regression of each biological driver on
infection prevalence; M4-M6 (equs. A1.d-f) are the various combinations of two of each driver;
and M7 (equ. A1.g) is the three driver regression model. For each model, we calculate the
adjusted R2 (hereafter: Ra2). (The fractions a through g encompassed by each regression model
are defined below). The variation unexplained by the sum of the three drivers is then 1 - the Ra2
value from M7, written in shorthand here and below as ‘1 - M7’. Then, to calculate the first three
partitions, we must subtract the Ra2 values of each two-driver model (M4, M5, and M6) from the
first full, three driver model, M7, each in turn. These first three partitions characterize the
fraction of variation in infection prevalence explained by each driver (Z, D, M) alone:
fraction a (Z alone): M7 - M6 (A2.a)
fraction b (D alone): M7 - M5 (A2.b)
fraction c (M alone): M7 - M4 (A2.c)
The fractions d through f involve variation shared between pairs of drivers, where d is the
fraction shared between D and Z, e is that between D and M, and f is that between M and Z. To
calculate them, the second step is needed; this intermediate step calculates the sum of one of the
driver-alone fractions (a, b, or c) with one of the shared fractions (d, e, or f). Thus, these
intermediate fractions involve subtracting Ra2 values from the regressions models (equ. A1) in
different ways:
fraction (a + d): M5 - M3 (A3.a)
fraction (b + e): M4 - M1 (A3.b)
fraction (c + f): M6 - M2. (A3.c)
These sums of variation then provide the core ingredients to isolate the remaining shared
fractions in the third step (i.e., by subtracting particular combinations of equs. A1-3):
fraction d (shared by D and Z): (a + d) - a (A4.a)
fraction e (shared by D and M): (b + e) - b (A4.b)
fraction f (shared by M and Z): (c + f) - c (A4.c)
fraction g (shared by D, M, and Z): M7 - (a + d) - (b + e) - (c + f) (A4.d)
The seven partitions presented in the text (Fig. 6) were calculated using these methods (equ. A1-
A4). The unexplained variation, h, is 1 - M7.
Below (Table S1), we present results comparing the model presented in the main text with
two additional variants. First, we exchange host diversity with the frequency of focal hosts
(Salamandra salamandra and Alytes obstetricans). Then, we exchange diversity with the
frequency of the introduced alpine newt (Ichthyosaura alpestris). Two main points arise from
this comparison. First, host diversity and the frequency of focal hosts alone explain similar
amounts of variation in infection prevalence (0.424 and 0.363, respectively); newts alone explain
a much smaller fraction (0.148). The similarity between the first and second models likely reflect
the tight correlations between host diversity and the frequency of focal hosts (Fig. S1c). Second,
while, the models vary in the weight given to each parameter alone (i.e., a,b,c), their overall joint
contributions (i.e., zooplankton + multi-season larvae, [a+c+f] and community composition of
hosts + multi-season larve, [b+c+e]) are similar across all models.
LITERATURE CITED IN SUPPLEMENTARY MATERIAL
1. Piotrowski J.S., Annis S.L., Longcore J.E. 2004 Physiology of Batrachochytrium
dendrobatidis, a chytrid pathogen of amphibians. Mycologia 96(1), 9-15.
(doi:10.2307/3761981).
2. Legendre P., L. Legendre. 1998 Numerical ecology. Second ed. Amsterdam,
Elsevier.

SUPPLEMENTARY MATERIAL FIGURE LEGENDS
Figure S1. Habitat-disease connections via composition of host communities (Pathway 1C).
(A) There was no relationship between UVR and the frequency of the introduced alpine newt. (B)
Sites dominated by the introduced alpine newt had lower infection prevalence. (C) Relationship
between host diversity and frequency of focal hosts. As pond communities became more
dominated by focal hosts (fire salamanders and mid-wife toads), host diversity decreased. Each
point is the mean of relative abundance surveys collected throughout the breeding season from
2009-2012.

Table S1. Three different versions of the multiple regression-based partition that explains variation in 1prevalence of Bd infection in focal hosts. The versions differ in the index used to characterize the host 2community, D. In model 1, Simpson's diversity characterizes it (as visualized in Fig. 6). In model 2, D is 3the closely correlated frequency of focal hosts. In model 3, D is frequency of alpine newts. 4
*Negative fractions indicate partitions that explain less variation than random normal variables. Hence, 5they are interpreted as zeros [2]. 6
Parameter(s) Fractions of
variation
Model 1 Host diversity
Ra2
Model 2 Freq. focal hosts
Ra2
Model 3 Freq. alpine newt
Ra2
Full model [a] – [g] 0.639 0.684 0.364 Zooplankton (Z) alone [a] 0.016 -0.033* -0.009*
Multi-season larvae (M) alone
[c] 0.041 0.102 0.327
Shared Z & M [f] 0.282 0.211 0.027 Z & M, no D [a+c+f] 0.339 0.314 0.345
Hosts (D) alone [b] 0.424 0.363 0.148 Shared D & M [e] 0.097 0.036 -0.188* D & M, no Z [b+c+e] 0.562 0.501 0.475 Shared D & Z [d] -0.087* -0.038* -0.063*
Shared D, M, & Z [g] -0.133* -0.063* 0.122 Residuals [h] 0.361 0.316 0.636
A
B
D = 0.083 p = 0.002
r = -0.419 p = 0.136
Figure S1
Pathways 1C: UVR, Species Composition, and Disease
C
r = -0.847 p = 0.0001