Embed Size (px)
Citation preview
11/11/2013
1
Measuring Trade in Value Added, and Beyond
Friends of Chair Group on Internationalization6-8 November 2013, New York
1: THE SECOND UNBUNDLING:
GLOBAL VALUE CHAINS
2

11/11/2013
2
The rise of GVCs: apparel, cars, toys, planes, electronics…
3
Source: Rivoli (2005), WTO (1998), Feenstra (1998), www.newairplane.com, Linden et al. (2009)
2: THE FOG –THE POTENTIAL FOR
MISLEADING POLICIES
4

11/11/2013
3
So…
Gross trade statistics increasingly ‘multiple count’ flows in intermediates as the production process develops over several
countries…
5
AB
C
Gross exports (110)
Value-added (10)
Value-added (100)
CountryCountry Country
Gross exports (intermediates) (100)
………
…meaning that gross trade statistics may create ‘misleading perceptions’ and imperfect policies
6

11/11/2013
4
For example….
• Where are our export markets?
• What do we specialise in?
• Which sectors create most value and jobs?
• Does protectionism work? Is it counter-productive. Are imports ‘bad’?– Are there costs on importers of intermediates,
particularly when they are significant exporters.
– What about those firms further upstream providing inputs to the imports?
• How should we interpret bilateral trade balances?
7
How can we respond?
• By measuring the value that is added by individual firms in the production process
8
AB
C
Gross exports (110)
Value-added (10)
Value-added (100)
CountryCountry Country
Gross exports (intermediates) (100)
11/11/2013
5
3: FOGLIGHTS –WHAT STATISTICS ARE
NEEDED TO RESPOND TO GVCS
9
How do we measure TiVA?
• Using a global Input-Output table
10

11/11/2013
6
OECD Inter-country I-O table
Sector 1 Sector 2 Sector 1 Sector 2 Country A Country B
Sector 1: Goods Z11AA Z12
AA Z11AB Z12
AB F1AA F1
AB
Sector 2: Services Z21AA Z22
AA Z21AB Z22
AB F2AA F2
AB
Sector 1: Goods Z11BA Z12
BA Z11BB Z12
BB F1BA F1
BB
Sector 2: Services Z21BA Z22
BA Z21BB Z22
BB F2BA F2
BB
NTZ1A NTZ2
A NTZ1B NTZ2
B NTFA NTFB
TIZ1A TIZ2
A TIZ1B TIZ2
B TIFA TIFB
Value- Labor compensation VL1A VL2
A VL1B VL2
B
Added Operating surplus VO1A VO2
A VO1B VO2
B
Tax less subsidy on production VT1A VT2
A VT1B VT2
B
X1A X2
A X1B X2
BOutput
Tax less subsidy on products
International trade margin and insurance
Final DemandCountry BCountry A
Country A
Country B
National I-O tablesProduction linkageFinal expenditureIncome (Value-added)Import procurement info
+Bilateral Trade Database
by industry and end-use categories (intermediates, capital and consumption goods)
58 countries, 1995-2009, 37 sectors, consistent with SNA
11
12
Trade partner shares of published and harmonised database (Goods, China 2008)
Sources: OECD BTDIxE 2012ed, OECD ICIO May 2013
(reported by China)

11/11/2013
7
Export partner shares of published and harmonised database (Services, Germany 2008)
13
Sources: TIS: OECD Trade in Services by partner country, ex = exports, im = importsOECD ICIO May 2013
OECD Inter-Country I-O model
57 economies + Row, 1995-2009, 37 sectors
14
OECD All OECD 34 countries
BRIICSBrazil, China, India, Indonesia, RussianFederation, South Africa
Other EU27Bulgaria, Cyprus, Latvia, Lithuania, Malta, Romania
Other G20 Argentina, Saudi Arabia
Other South Eastern Asia
Brunei Darussalam, Cambodia, Malaysia, Philippines, Singapore, Thailand, Viet Nam
Other Eastern Asia Chinese Taipei, Hong Kong ChinaOther Rest of the World

11/11/2013
8
Industry
15
ISIC rev3 Industry ISIC rev3 Industry
01,02,05 Agriculture, hunting, forestry and f ishing 40 - 41 Utility
10 - 14 Mining and quarrying 45 Construction
15 - 16 Food products, beverages and tobacco 50 - 52 Wholesale and retail trade; repairs
17 - 19 Textiles, textile products, leather and footw ear 55 Hotels and restaurants
20 Wood and products of w ood and cork 60 - 63 Transport and storage
21 - 22 Pulp, paper, paper products, printing and publishing 64 Post and telecommunications
23 Coke, ref ined petroleum products and nuclear fuel 65 - 67 Finance and insurance
24 Chemicals 70 Real estate activities
25 Rubber and plastics products 71 Renting of machinery and equipment
26 Other non-metallic mineral products 72 Computer and related activities
27 Basic metals 73 Research and development
28 Fabricated metal products 74 Other Business Activities
29 Machinery and equipment, nec 75 Public admin. and defence; compulsory social security
30 Off ice, accounting and computing machinery 80 Education
31 Electrical machinery and apparatus, nec 85 Health and social w ork
32 Radio, television and communication equipment 90 - 93 Other community, social and personal services
33 Medical, precision and optical instruments 95 Private households w ith employed persons
34 Motor vehicles, trailers and semi-trailers
35 Other transport equipment
36 - 37 Manufacturing nec; recycling (include Furniture)
4: DRIVING WITH THE LIGHTS ON
WHAT DOES THE TIVADATABASE REVEAL?
16
11/11/2013
9
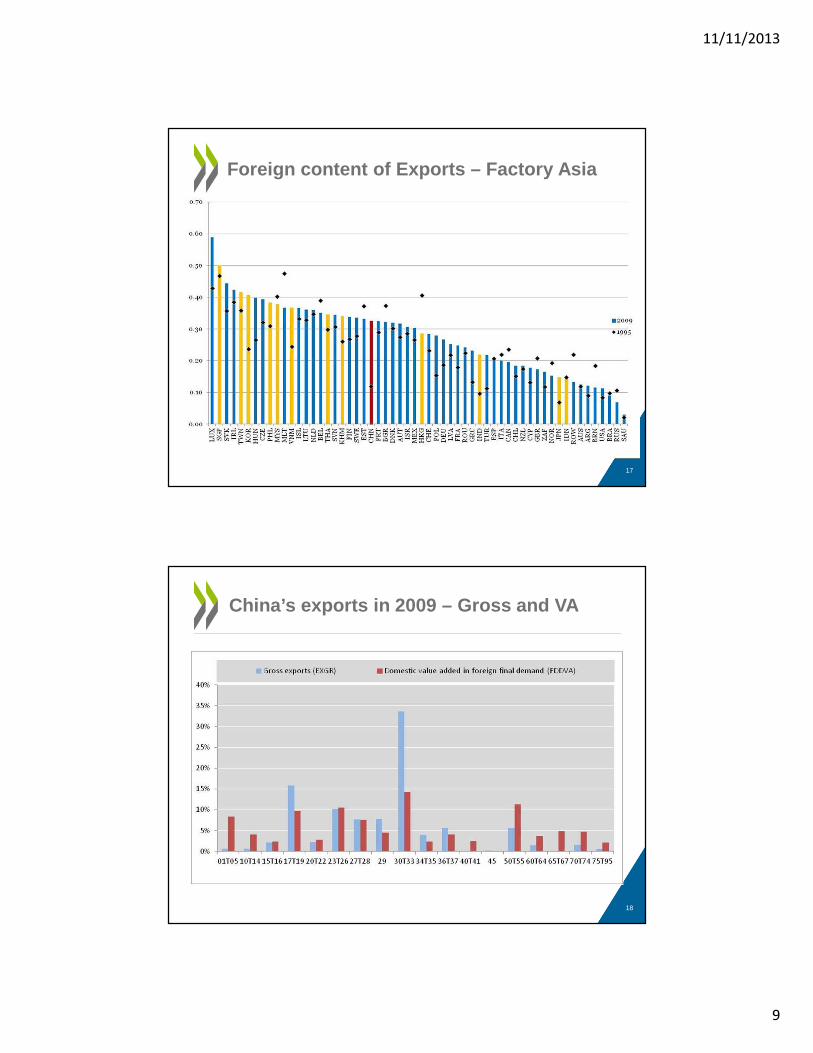
Foreign content of Exports – Factory Asia
17
China’s exports in 2009 – Gross and VA
18

11/11/2013
10
Exports - % of GDP
19
Only marginally
higher than in 1995
Foreign value added content of gross exports, by
industry, % (EXGR_FVASH )Exports require imports
• UK
• China
20
0%
5%
10%
15%
20%
25%
30%
35%
Agric
ultu
re
Min
ing
Food
pro
duct
s
Tex
tiles
&
appa
rel
Woo
d &
pape
r
Che
mic
als &
m
iner
als
Basi
c m
etal
s
Mac
hine
ry
Ele
ctric
al
equi
pmen
t
Tra
nspo
rt eq
uipm
ent
Oth
er
man
ufac
ture
s
Who
lesa
le &
re
tail
Tra
nspo
rt &
tele
com
s
Fin
ance
&
insu
ranc
e
Busi
ness
se
rvic
es
Oth
er se
rvic
es
Tota
l
2009 1995
0%
10%
20%
30%
40%
50%
Agric
ultu
re
Min
ing
Food
prod
ucts
Texti
les &
ap
pare
l
Woo
d & pa
per
Chem
icals
& m
iner
als
Basic
met
als
Mac
hine
ry
Elec
trica
l eq
uipm
ent
Tran
spor
t eq
uipm
ent
Oth
er
man
ufac
ture
s
Who
lesa
le &
re
tail
Tran
spor
t &
tele
com
s
Fina
nce &
in
sura
nce
Busin
ess
serv
ices
Oth
er se
rvice
s
Tota
l
2009 1995

11/11/2013
11
Export dependencies?VA exports as a per cent of sector value-added
21
Imported intermediate inputs used in exports, 1995 and 2009
OECD Trade and Agriculture Directorate 22

11/11/2013
12
Significant share of total intermediate imports used in exports in many countries
23
With hubs playing an important role
24
Domestic, 60.7%
Germany, 8.2%
US, 3.6%
Italy, 3.2%
OtherEurope, 14.8%
Asia, 4.4%Rest of the world, 5.1%
France: Motor vehicles, 2009
Domestic, 69.1%US, 2.4%
UK, 2.4%
France, 2.1%
OtherEurope, 16.3%
Asia, 3.4%Rest of the world, 4.4%
Germany: Motor vehicles, 2009
Domestic, 40.6%
US, 20.1%
China, 9.6%
Japan, 9.4%
Europe, 7.4%
Other Asia, 6.8%
Rest of the world, 6.1%
Mexico: Electronics, 2009
Domestic, 55.4%
China, 12.1%
Chinese Taipei, 4.7%
Japan, 4.1%
Europe, 5.6%
Other Asia, 8.3%
Rest of the world, 9.9%
Korea: Electronics, 2009

11/11/2013
13
Foreign value added in Chinese Electrical equipment, by originating region & industry %
25
0.0
2.0
4.0
6.0
8.0
10.0
12.0
14.0
1995 2009 1995 2009 1995 2009 1995 2009 1995 2009 1995 2009 1995 2009 1995 2009 1995 2009 1995 2009
Mining Chemicals
& minerals
Basic
metals
Electrical
equipment
Transport
equipment
Wholesale
and retail
Transport &
telecoms
Finance &
insurance
Business
services
Other
East and S.E. Asia Europe North America Other regions South America
Services matterServices Value-Added: % of exports, 2009
26
0
10
20
30
40
50
60
70
80
90
Foreign Domestic

11/11/2013
14
Design, R&D, software etc becoming more important - Services content of transport equipment
27
0
10
20
30
40
50
2009 1995 2009 1995 2009 1995 2009 1995 2009 1995 2009 1995 2009 1995 2009 1995 2009 1995 2009 1995 2009 1995 2009 1995 2009 1995 2009 1995
FRA DEU ITA JPN KOR MEX SVK ESP SWE GBR USA BRA CHN IDN
Foreign Domestic
Significantly for some countries - China
28
0.0
5.0
10.0
15.0
20.0
25.0
30.0
USA JPN DEU GBR FRA CAN KOR RUS ITA AUS IND ESP MEX NLD HKG
Gross exports (EXGRSH) Domestic value added in foreign final demand (FDDVASH)
0.0
5.0
10.0
15.0
USA JPN DEU KOR AUS SAU TWN RUS BRA FRA IND ITA GBR CAN MYS
Gross imports (IMGRSH) Foreign value added in domestic final demand (FDFVASH)
-100,000
-50,000
0
50,000
100,000
150,000
200,000
250,000
USA GBR MEX FRA NLD VNM THA JPN BRA MYS TWN KOR
2009 Gross Trade surplus/deficit (TSGR) 2009 Value Added surplus/deficit (TSVAFD)

11/11/2013
15
And throughout Factory Asia
29
0
5
10
15
20
25
30
35
40
2009 1995 2009 1995 2009 1995 2009 1995 2009 1995 2009 1995 2009 1995 2009 1995 2009 1995 2009 1995 2009 1995 2009 1995 2009 1995
Chinese
Taipei
Japan Korea Malaysia Thailand Hong Kong,
China
Singapore Philippines India Indonesia Viet Nam Cambodia Brunei
Darussalam
Value-Added Gross
Exports to China: Gross and Value-added terms, % of total
In general – the more distant the countries the more likely that gross trade statistics underestimate the relationsh ip
30
• Change in trade shares based on Value-Added in
-6
-4
-2
0
2
4
6
8
10
TWN
KOR
PHL
JPN
MYS
AUS
THA
SAU
RUS
EU27
IDN
TUR
ARG
BRA
IND
CHN
ZAF
VNM ISR
KHM
CAN
MEX
Exports Imports
United States

11/11/2013
16
OECD Trade and Agriculture Directorate
31
-3.5
-3
-2.5
-2
-1.5
-1
-0.5
0
0.5
1PHL
TWN
THA
MYS
JPN
KOR
ISR
AUS
USA
RUS
EU27
ZAF
IND
IDN
CAN
VNM
MEX
TUR
CHN
KHM
CHL
ARG
Exports Imports
5: INCREASING THE LUMINOSITY
WHAT ASSUMPTIONS ARE USED TO CREATE TIVA AND
WHAT’S NEEDED TO IMPROVE QUALITY: CHALLENGES FOR
NATIONAL STATISTICS
32

11/11/2013
17
33
34
Whilst there are limitations to the widespread calculation of trade in value-added data, the OECD-WTO initiative is to be applauded for providing a more revealing look into global trade and integration and for paving the way for further development in this area.

11/11/2013
18
But it is important to stress
• That this is a work in progress and that results are
estimates (with two key assumptions)• But they are robust enough to already begin to highlight
– the need for policies to account for GVCs
• But perhaps more importantly, they highlight
– the importance of capacity building and better statistics
• Improving data quality is essential
– Coherent estimates of trade in goods and services
– A new approach to Supply-Use Tables?
• With a focus on stages and tr ade rather than industries, per se, to better reflect firm heterogeneity (particularly MNEs).
• Import/export intensities, factoryless firms, processors, ownership35
What can be done now?
• Improved GROSS trade data
• Import flow matrices
• Better bilateral trade statistics (integrated with SU tables) and globally consistent
• Intelligent confidentiality rules (suppress 6 digit not 2 digit HS)
• Re-export data
• Second hand goods, scrap and waste.
• SERVICES –EBOPS 2012.
36

11/11/2013
19
Examples of current inconsistencies in bilateral trade statistics (Services 2009)
37
What else can be done…..now?• Capitalise on existing data to create new indicators on exporting and importing firms
• Beyond TEC: Linking trade registers, business registers and SBS• OECD Workshop on linking business and trade statistics: 25-26
October 2012
• Exploring feasibility of creating new indicators based on export (and import) intensities, ownership and size.
• And also provides stepping stone for trade in income related to investment
• Changes to classification systems to better reflect globalisation:– Factoryless producers (UNECE Task Force on Global
Production)38

11/11/2013
20
6.1 GOING BEYOND TIVA –‘STAGES’ AND ‘TASKS’
39
Extensions
• Trade in jobs and skills
– But requires
• Coherent employment and value-added data
– Also important for productivity estimates
• And significant improvement in skills data (and occupations)
40

11/11/2013
21
Jobs in the business sector sustained by foreign final demand,
1995 and 2008
41
6.2 GOING BEYOND TIVAINVESTMENT
42

11/11/2013
22
Extensions
• Trade in Income related to Investment: Ownership matters: – Because value added does not always stick (compensation for use of knowledge
based assets – where increasingly registration is determined by tax environment)
– And because flows for use of IPPs are often recorded as property income and not trade in services.
– 30% of total business sector VA in 2009 in the UK generated by foreign owned firms, 15% of GDP. Accounting for the underlying flows could further change trade relationships, even though differences between GNI and GDP are small.
– In Japan for example Primary income flows (GNI minus GDP) were equivalent to about one-quarter of total TiVA flows.
• Need better FATS data, particularly on value-added and employment.
– MSITS 2010 Compilers Guide
43
Trade in Income?
• How important is it?
– Potentially – Very
• About 70% of China’s gross exports made by foreign affiliates
• E.g. between 1995 and 2007, Japanese foreign affiliates increased their employment in China eightfold from just over 100,000 employees to over 1000,0000 and by 300,000 (to over 400,000) in Thailand, with similar patterns in other ASEAN countries, such as the Philippines, Malaysia and Indonesia.
• And Japan's primary income trade surplus increased by around $100 billion over the period to 2009, more than offsetting the $50 billion reduction in its gross trade surplus over the same period.
44
11/11/2013
23
0%
10%
20%
30%
40%
50%
60%
70%
80%
90%
100%
2002 2003 2004 2005 2006 2007 2008 2009
Others
Foreign wholly ownedcompanies
Sino-Foreign JointVentures
Chinese State Owned
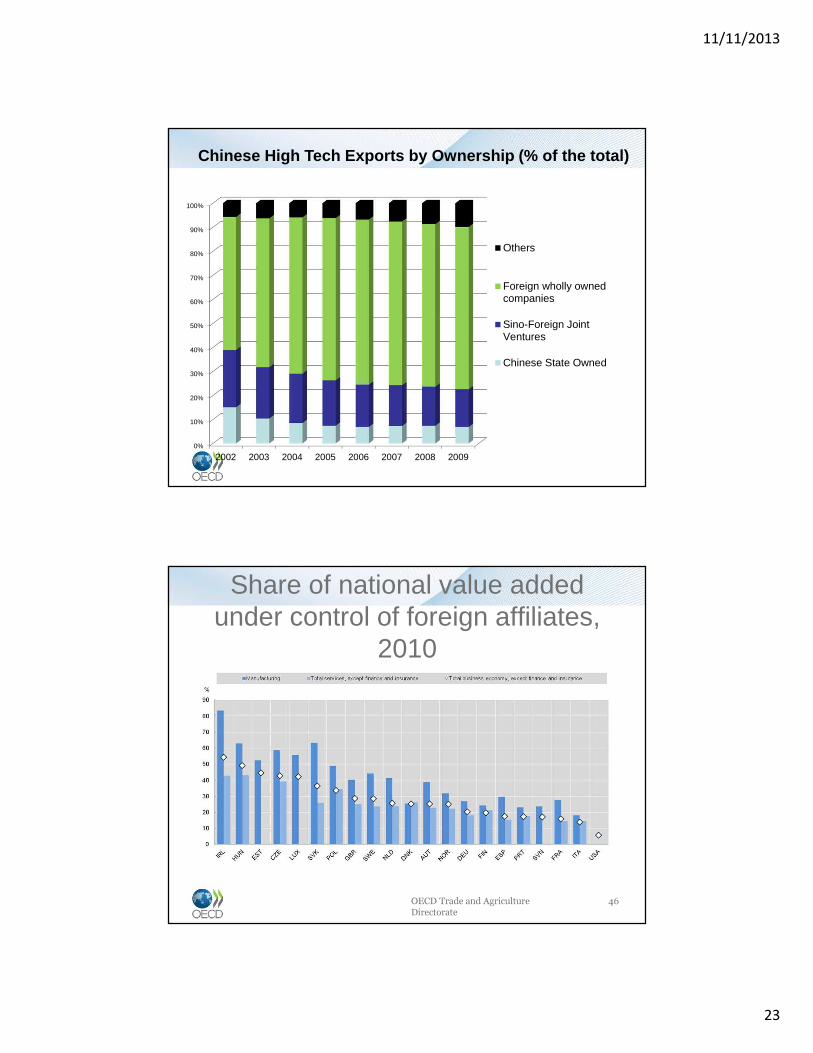
Chinese High Tech Exports by Ownership (% of the to tal)
Share of national value added under control of foreign affiliates,
2010
OECD Trade and Agriculture Directorate
46

11/11/2013
24
Share of national employment under control of foreign affiliates,
2010
OECD Trade and Agriculture Directorate
47
Summary – What’s needed
• New thinking on SU tables
• Better gross trade data
• Links to microdata
• Income, Ownership and FATS
48

11/11/2013
25
Further information
• www.oecd.org/trade/valueadded
• Video: http://www.youtube.com/watch?feature=player_embedded&v=RZKX-0SK41U
• OECD Workshop on Measuring TiVA5-6 December 2013
49