Embed Size (px)
Citation preview


1. THE ROLE AND NATURE OF INVESTMENT
Learning Objectives1. Draw a Phillips curve and describe the relationship
between inflation and unemployment that it expresses.2. Describe the other relationships or phases that have been
observed between inflation and unemployment.

1.1 The Phillips Curve
• The Phillips curve is a curve that suggests a negative relationship between inflation and unemployment.

1.2 The Phillips Curve Goes Awry
The Phillips Curve in the 1960’s (U.S.)

1.2 The Phillips Curve Goes Awry
When considering Unemployment and Inflation (U.S.) from 1961-2008 the data does not appear consistent with the theory behind the Phillips curve!

1.3 Cycles of Inflation and Unemployment
Unemployment and Inflation (U.S.) 1961-2002Sequential connections suggest a clockwise cyclical pattern

1.3 Cycles of Inflation and Unemployment
• The Phillips phase is the period in which inflation rises as unemployment falls.
• The stagflation phase is the period in which inflation remains high while unemployment increases.
• The recovery phase is a the period in which inflation and unemployment both decline.
• The Inflation-unemployment cycle is a pattern consisting of a Phillips phase, followed by stagflation, and then a recovery.

1.3 Cycles of Inflation and Unemployment
Phases of the Inflation-Unemployment cycle

2. EXPLAINING INFLATION-UNEMPLOYMENT RELATIONSHIPS
Learning Objectives1. Use the model of aggregate demand and aggregate
supply to explain a Phillips phase, a stagflation phase, and a recovery phase.

2.1 The Phillips Phase: Increasing Aggregate Demand
Phillips phase
3
21
3
21
LRAS
SRAS1,2,3
AD1 AD2
AD3

2.1 The Phillips Phase: Increasing Aggregate Demand
Real GDP (billions) Rate of unemployment (%)
$880 9.0
910 8.0
940 7.0
970 6.0
1,000 5.0
1,030 4.0
1,060 3.0
1,090 2.0
The relationship between GDP and unemployment from the previous slide.

2.2 Changes in Expectations and the Stagflation Phase
Phillips phase
3
21
32
1
LRAS
SRAS1,2,3
AD3,4
SRAS44
4
Stagflation phase

2.3 The Recovery Phase
3
21
LRAS
SRAS1,2,3
AD1 AD2
AD3,4
4
5AD5
SRAS4
Phillips phase
3
21
4
Stagflation phase
5 Recovery phase

3. INFLATION AND UNEMPLOYMENT IN THE LONG RUN
Learning Objectives1. Use the equation of exchange to explain what determines the inflation rate
in the long run.2. Explain why in the long run the Phillips curve is vertical.3. Describe frictional and structural unemployment and the factors that may
affect these two types of unemployment.4. Describe efficiency wage theory and its predictions concerning cyclical
unemployment.

3.1 The Inflation Rate in the Long Run
EQUATION 3.1
EQUATION 3.2
EQUATION 3.3
• Inflation rates and economic growth
YPVM %%%%
YMP %%%
PYPVM %%%%
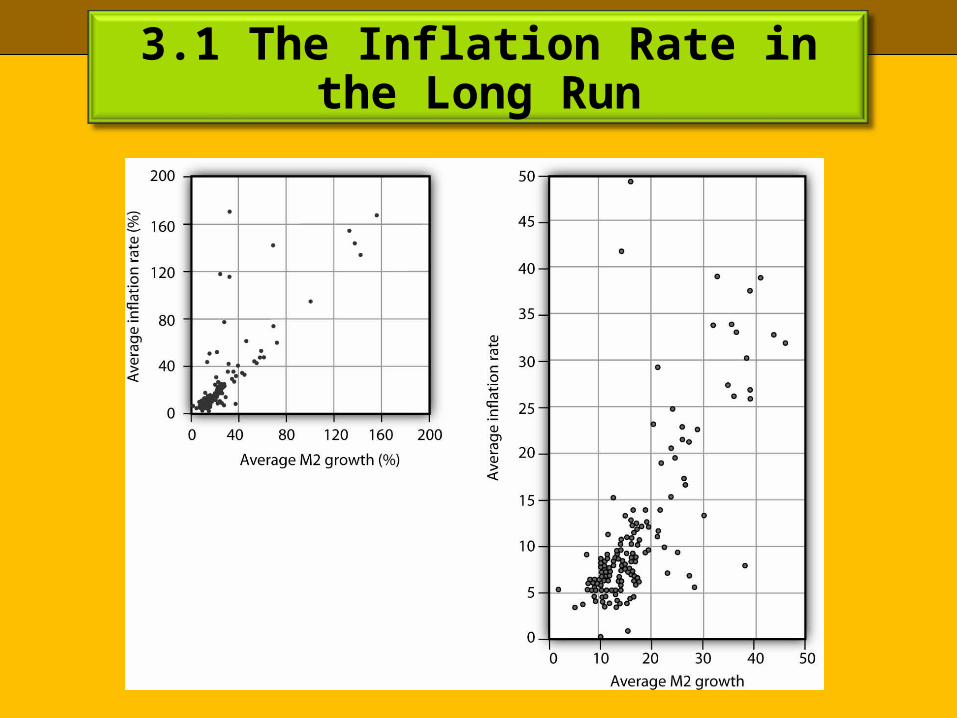
3.1 The Inflation Rate in the Long Run

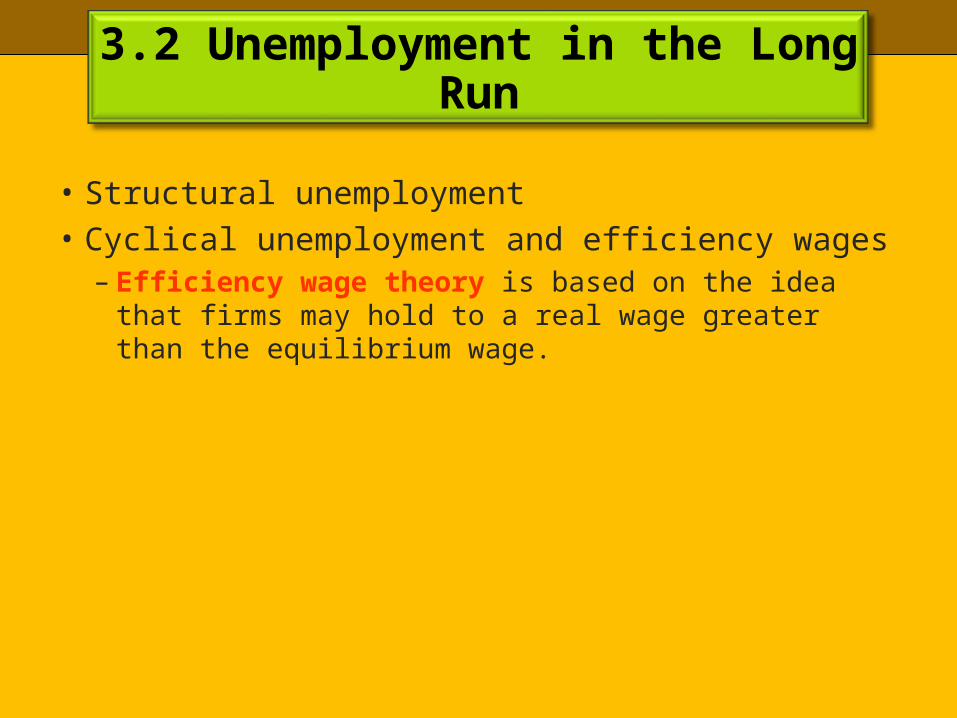
3.2 Unemployment in the Long Run

3.2 Unemployment in the Long Run
• Frictional unemployment– A reservation wage is the lowest wage that
an unemployed worker would accept, if it were offered.

Public Policy and Frictional Unemployment
t0 t2 t1
W1
W2
W0
BOR1BOR2
RW1
t0 t2t1
W1
W2
W0
BOR1
RW2
RW1
Programs that provide labor market information tend to shift the BOR cures of individual workers to the left, reducing the duration of the job search and unemployment, and increasing the wage.
Unemployment compensation tends to increase the duration over which a worker will hold out for a higher wage, shifting the RW curve to the right, increasing unemployment and the wage.
3.2 Unemployment in the Long Run
• Structural unemployment• Cyclical unemployment and efficiency wages
– Efficiency wage theory is based on the idea that firms may hold to a real wage greater than the equilibrium wage.