Embed Size (px)
Citation preview

1
The Primary Objectives of Financial Reporting
How Are We Doing?


4
So, how are we doing?
Results of a survey by the Chartered Financial Analysts (CFAs) (1994)

5
Survey . . .
The CFA survey was sent to 1,300 CFAs in the United States.
Completed questionnaires were returned by 508 members.
The majority of respondents had 11 years or more of experience.

6
Sample members were told
“Your frame of reference should be that of a financial analyst evaluating a common stock in a manufacturing firm.”

7
The annual report is your only source of information for decision-making.
Sample members were told

8
Members were asked . . .
To evaluate the adequacy of the information disclosed in annual reports for investment decisions.

9
If information is lacking
What information would you like to see included?
Hmm!

Balance Sheet
Income Statement
Stmt of CF
Stmt of OE
Assign a score to . . .
Com
parative
Summ
ary
Notes
That reflects the usefulness to investment decisions.

11
Scores Assigned . . .
1. No usefulness,
2. Slightly useful,
3. Moderately useful,
4. Average usefulness,
5. Very useful, and
6. Extremely useful

So, what were the results?

Said information in annual reports is adequate for investment decisions.
10 10 10
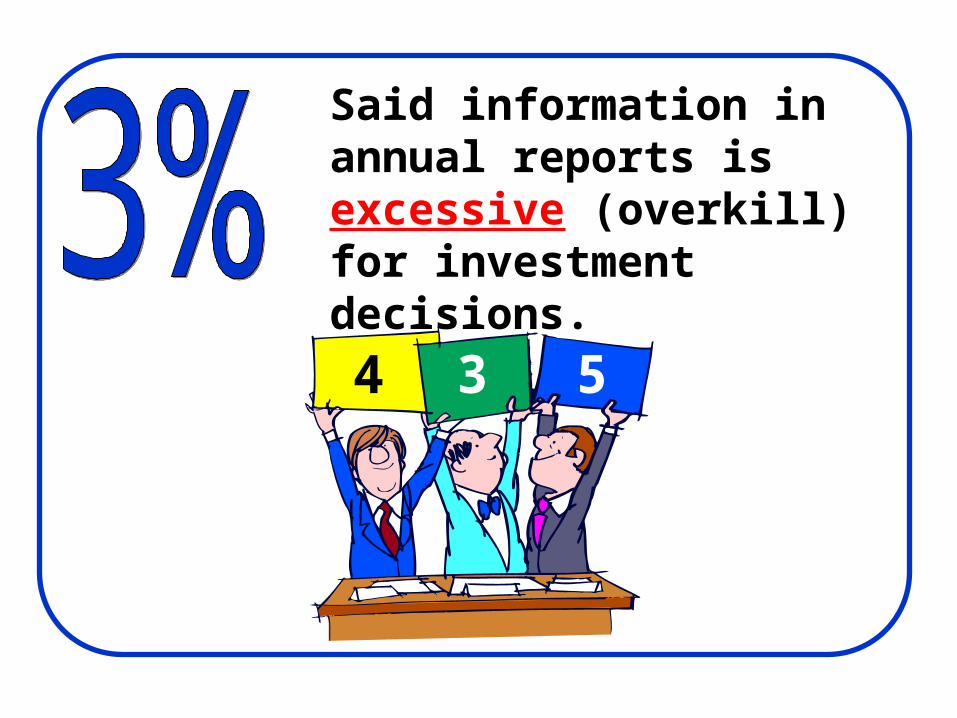
Said information in annual reports is excessive (overkill) for investment decisions.
4 3 5

Said information in annual reports is deficient (more is needed).
5 6 3

Additional Information DesiredAdditional Information Desired
A Company’s Competitive PositionA Company’s Competitive Position 93.093.0
Industry TrendsIndustry Trends 91.691.6
Long-Term Corporate GoalsLong-Term Corporate Goals 78.078.0
Plant CapacityPlant Capacity 58.458.4
Dividend PolicyDividend Policy 49.549.5
Budgeting For Next Five YearsBudgeting For Next Five Years 42.542.5
Pricing PoliciesPricing Policies 39.339.3
Quality of ManagementQuality of Management 37.937.9
Forecasts of SalesForecasts of Sales 31.831.8
Forecasts of Earnings Per ShareForecasts of Earnings Per Share 29.429.4

17
The Results . . .
Other items requested by ten percent of those responding . . ..
Detailed cost data;
New products;
Environmental litigation;
Additional cash flow data, and
Segment breakdowns.

18
The Results . . .
Other disclosures desired . . .
Variances from budgeted amounts;
Product life cycle;
Debt policies
R&D goals;
Operating problems;
Capital projects

Average Usefulness of Annual Report SectionsAverage Usefulness of Annual Report Sections
Income StatementIncome Statement 5.935.93
Cash Flow StatementCash Flow Statement 5.345.34
Balance SheetBalance Sheet 5.315.31
Notes to the Financial StatementsNotes to the Financial Statements 4.424.42
Comparative Summary of DataComparative Summary of Data 3.663.66
Stockholders’ Equity StatementStockholders’ Equity Statement 2.042.04

The primary financial statements fall into this area of the continuum . . .
Level of Adequacy
Not
Slightly
Moderately
Average
Very
Extrem
ely

The notes to the financial statements fall into this area of the continuum . . .
Level of Adequacy
Not
Slightly
Moderately
Average
Very
Extrem
ely

Individual financial statement line
items and notes . . .
Level of Adequacy
Not
Slightly
Moderately
Average
Very
Extrem
ely