Embed Size (px)
Citation preview
1
The Financial Melt-Down Of 2008-The Financial Melt-Down Of 2008-20092009
A Demon Of Our Own DesignA Demon Of Our Own Design
Online Economic SeminarsOnline Economic Seminars
www.econseminars.comwww.econseminars.com
March 30, 2009March 30, 2009

2
Capitalism Without Failure Is like Capitalism Without Failure Is like
Religion without Sin Religion without Sin Alan MeltzerAlan Meltzer
The Foot Bone’s Connected To The Leg The Foot Bone’s Connected To The Leg
BoneBone
The Leg Bone’s Connected To The Knee The Leg Bone’s Connected To The Knee BoneBone
The Knee Bone’s Connected To The Thigh The Knee Bone’s Connected To The Thigh BoneBone
Now Hear The Word Of The Lord! Now Hear The Word Of The Lord!
Gospel SongGospel Song

3
The Great Depression:The Great Depression:
Is It… Is It…
BAAAAACCCCKKKKK?!
4
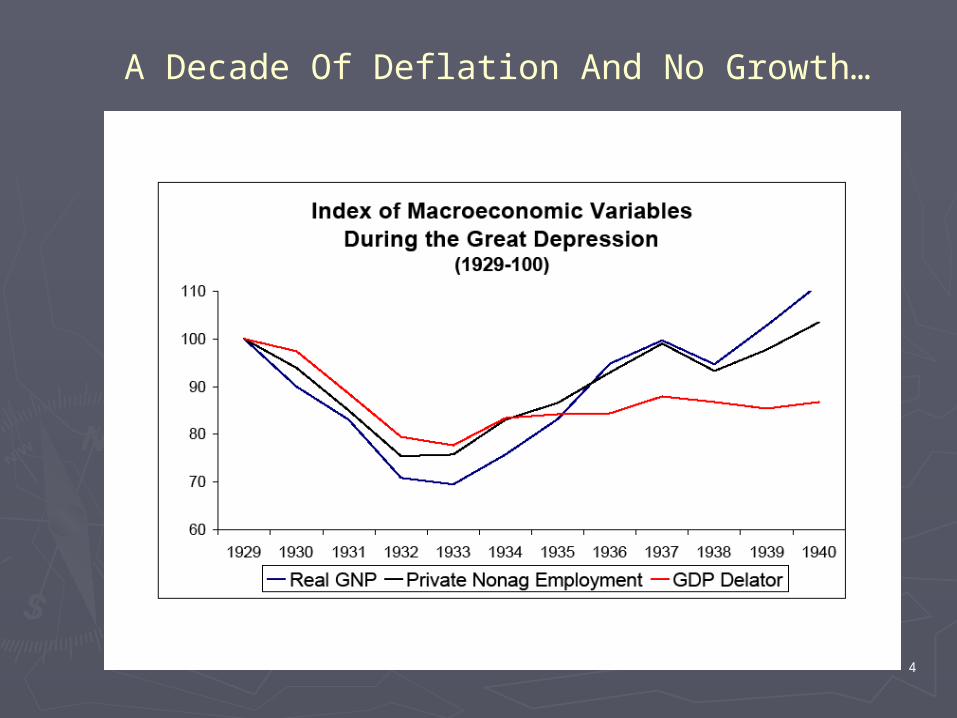
A Decade Of Deflation And No Growth…

5
With High Real Interest Rates In The Worst Years…

6
And A Stock Market That Sucked!
7
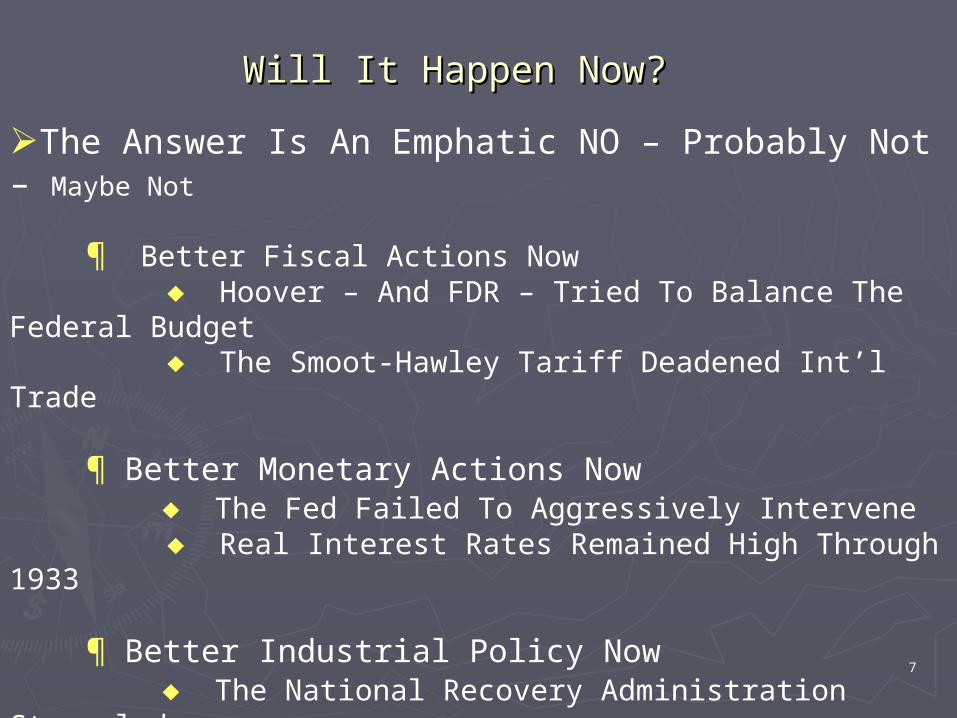
Will It Happen Now?Will It Happen Now?
The Answer Is An Emphatic NO – Probably Not – Maybe Not
¶ Better Fiscal Actions Now Hoover – And FDR – Tried To Balance The Federal Budget The Smoot-Hawley Tariff Deadened Int’l Trade
¶ Better Monetary Actions Now The Fed Failed To Aggressively Intervene Real Interest Rates Remained High Through 1933
¶ Better Industrial Policy Now The National Recovery Administration Strangled Business With Regulation AND Wage-Price Controls NRA Found Unconstitutional After 2 Years But Labor Relations Legislation Quickly Passed

8
The Financial InstrumentsThe Financial Instruments
9
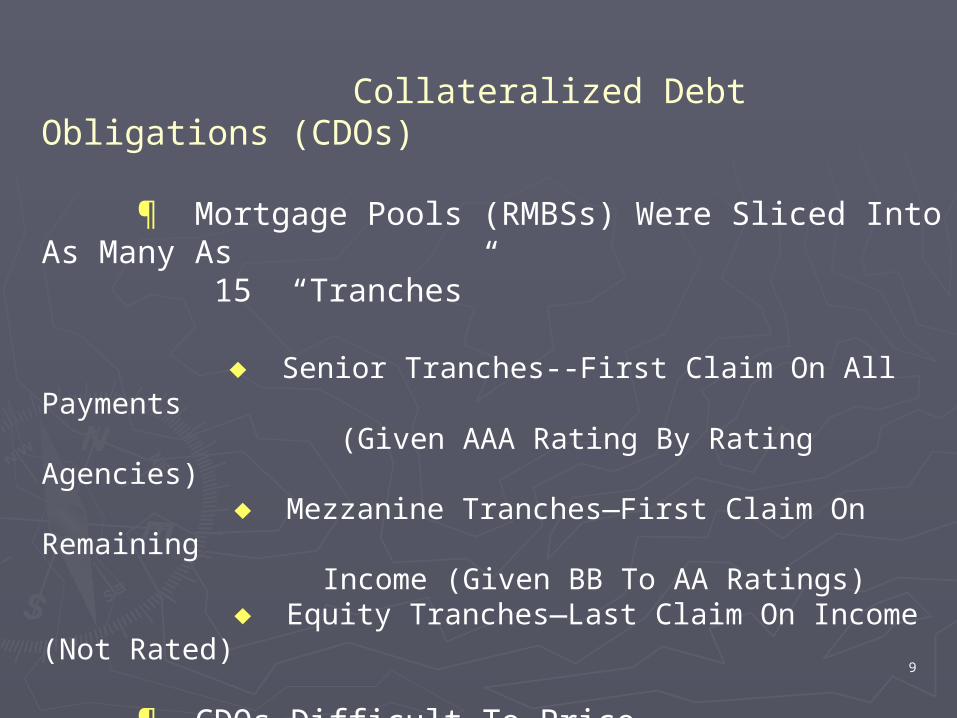
Collateralized Debt Obligations (CDOs)
¶ Mortgage Pools (RMBSs) Were Sliced Into As Many As 15 “Tranches”
Senior Tranches--First Claim On All Payments (Given AAA Rating By Rating Agencies) Mezzanine Tranches—First Claim On Remaining Income (Given BB To AA Ratings) Equity Tranches—Last Claim On Income (Not Rated)
¶ CDOs Difficult To Price Repayments Uncertain In Amount And Timing Especially Difficult For Lower-Quality Tranches
10
Collateralized Debt Obligations (CDOs)
¶ Sponsors (Securitizers) Sold Senior And High Mezzanine Tranches To Hedge Funds Equity and Low Mezzanine Tranches To Special Investment Vehicles (SIVs)
¶ SIVs Were “Independent” Entities Unregulated And Off Of The Sponsor’s Balance Sheet Financed Largely By Short-Term Commercial Paper (90%), With Some Equity And Senior Debt(10%) Sponsors Were Obligated To Provide Short-Term Loans If Commercial Paper Couldn’t Be Rolled Over Sponsors Gave SIVs A Free “Reputational Put”

11
Mortgage-Backed Securities (MBSs)
¶ Primary Source of Funds For GSEs: Two Forms Straight Bonds: Long-Term Bonds, Fixed Coupon Pass-Through Securities: GSE Forms Mortgage Pools Like RMBss, Sells Securities Paying Whatever Income Is Received By The Pool Borrower Repayments (Home Sales, Refinancing, Optional Pre-Payments) Create Uncertainty About The Income Stream

12
Credit Default Swaps (CDSs)
¶ CDSs Are Insurance Contracts For “Credit Events” Unregulated Over-The-Counter (OTC) Contracts Customized, Not Standardized Bilateral Contracts, Not Clearing House Contracts Definition of “Credit Event” Is Contract-Specific Settlement Might Be “Physical” (Purchase At Face Value) Or “Cash” (Payment Of Difference Between Face Value And Fair Value ¶ CDSs Sold By Investment Banks To Holders Of CDOs And Corporate Or Municipal Bonds
Sellers Had Little Capital Potentially High Counter-Party Risk Existed

13
The The ParticipantsParticipants

14
Government-Sponsored Entities (GSEs)
¶ Federal National Mortgage association (Fanny Mae) Formed in 1938 To Buy FHA-Insured Loans Privatized” In 1968 To Remove It From The Federal Budget FNMA Mandate Broadened To All Mortgages In 1968; (GNMA Formed To Take Buy FHA Loans) ¶ Federal Home Loan Mortgage Corp (Freddy Mac)
Formed in 1970 To Buy Conventional Mortgages Designed To Provide Competition In Secondary Mortgage Market

15
Government-Sponsored Entities (GSEs)
¶ FNMA And FHLMC Bought Mortgage Loans And
Held Them For Own Portfolio, Selling Bonds To Finance Them OR Sold And Serviced Mortgage-Backed Securities

16
Investment Banks ¶ Bear Sterns, CitiGroup, And Others Began To Securitize Mortgages In 1997
Placed Mortgages Into Pools Called Residential Mortgage Backed Securities (RMBSs) Split Each RMBS Into Risk Categories, Called “Tranches” Sold Each Tranch As A CDO To Hedge/Private Equity Funds CDO Funds Were Long-Term Risky CDOs Financed With Short-Term Commercial Paper
17
The U.S. Congress ¶ The Community Reinvestment Act (1977)
Required Banks To Meet The “Credit Needs” Of Their Local Communities CRA Had No Clear Criteria Or Monitoring Process ¶ FIRREA (1989) Created Four CRA “Grades” For Banks Required CRA Grades Be Made Public
¶ Federal Housing Enterprises Safety and Soundness Act (1992) Lending Goals for GSE Lending to Low-Income and Underserved Areas Created the Office of Hosing Enterprise Oversight (OFHEO) To Set Risk-Based Minimum Capital Requirements for GSEs

18
The U.S. Congress ¶ The Gramm-Leach-Bliley Act (1999)
Repealed Glass-Steagall Act of 1938 That Prohibited Commercial Banks From Buying Investment Banks And Insurance Companies Required Banks Acquiring Insurance Companies Or Investment Banks To Have An Acceptable CRA Status

19
Regulatory Agencies ¶ Department Of Housing And Urban Development (HUD)
Defined “Special Affordable Loans” As Loans To Borrowers With Income Less Than 60% Of Local Median Income Applied SAL Quotas For FNMA and FHLMC Raised Quotas From 12% in 1996, 20% n 2000, 22% In 2005, 28% in 2008 (not implemented)
¶ The Securities And Exchange Commission (SEC)
Abolished “Net Capital Rule” For Broker-Dealers In 2004 Investment Banks Divert Capital From Broker-Dealer Division To Trading Division Investment Bank Traders Buy CDOs, Helping Fuel The Subprime Market

20
The Origins OfThe Origins Of
The Melt-Down The Melt-Down

21
After the mid-1990s There Was A Foreign Savings Glut Looking For Investment Opportunities In The U.S.

22
Almost All Coming From Asia And The Middle East, Areas That Had Overvalued Their Currencies vs. The Dollar

23
The Easy Money From The China Syndrome Was Accompanied By Unusually Easy Monetary Policy
24
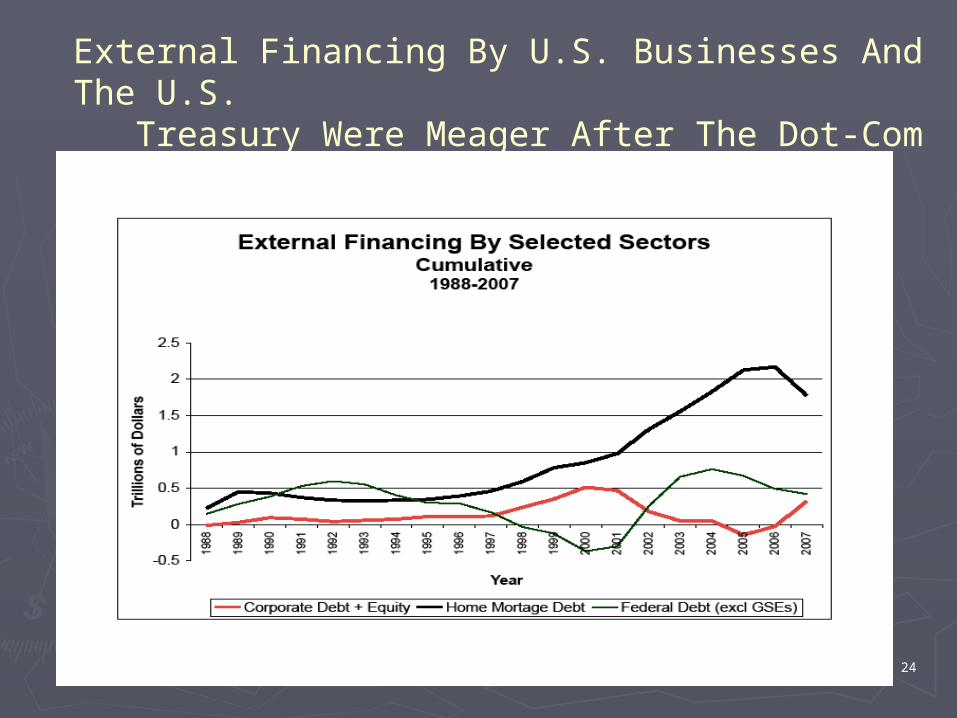
External Financing By U.S. Businesses And The U.S. Treasury Were Meager After The Dot-Com Crash
25
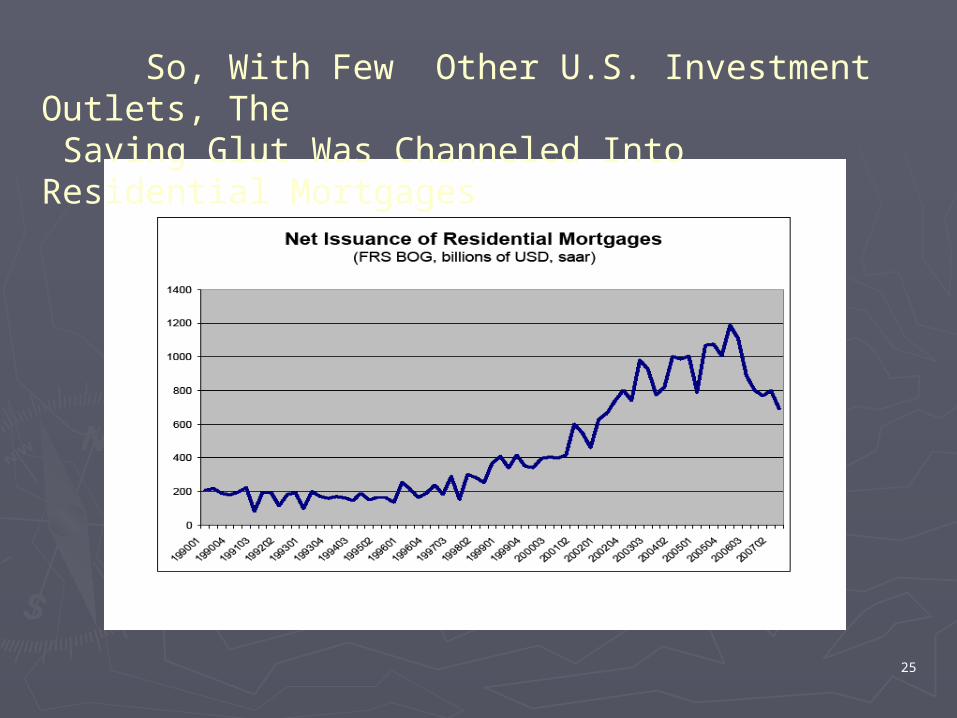
So, With Few Other U.S. Investment Outlets, The Saving Glut Was Channeled Into Residential Mortgages

26
Since “Good” Creditors Already Had Mortgages, A “Subprime” Mortgage Market Was Created…
¶ Characteristics Of A Subprime Mortgage
Borrower Has One Or More Of Following: • High Debt-Service-To-Income Ratio (50% Or More) • High Loan-To-Value Ratio (Perhaps 100%) • Low FICO Credit Score (640 Or Less) • Recent Delinquencies In Credit Payments • Declared Bankruptcy In The Past
Subprime Mortgage Contracts Had • Low Fixed Rate For A Few Years, Reset To Higher And Variable Rate For Remainder (e.g., a 3/27 Mortgage) • Reset Rate Is Based On Premium Over UST Or LIBOR • Significant Prepayment Penalties
27
¶ The “Lender’s Lock”
Lenders Assumed House Prices Will Increase, Creating More Equity In The Subprime Borrower’s Home High Reset Rate Will Force Borrower To Seek New Terms From The Original Lender Prepayment Penalties Will Discourage Refinancing With Other Lenders Giving The Original Lender A Valuable Option—To Renegotiate The Loan Or To Foreclose
The Subprime Mortgage Structure Favored Lenders

28
The Easy Credit Led To An Explosion Of Mortgage Lending

29
Of Which About 12 Per Cent Was Subprime, Much Of It Adjustable Rate And Half Of It From GSE’s
30
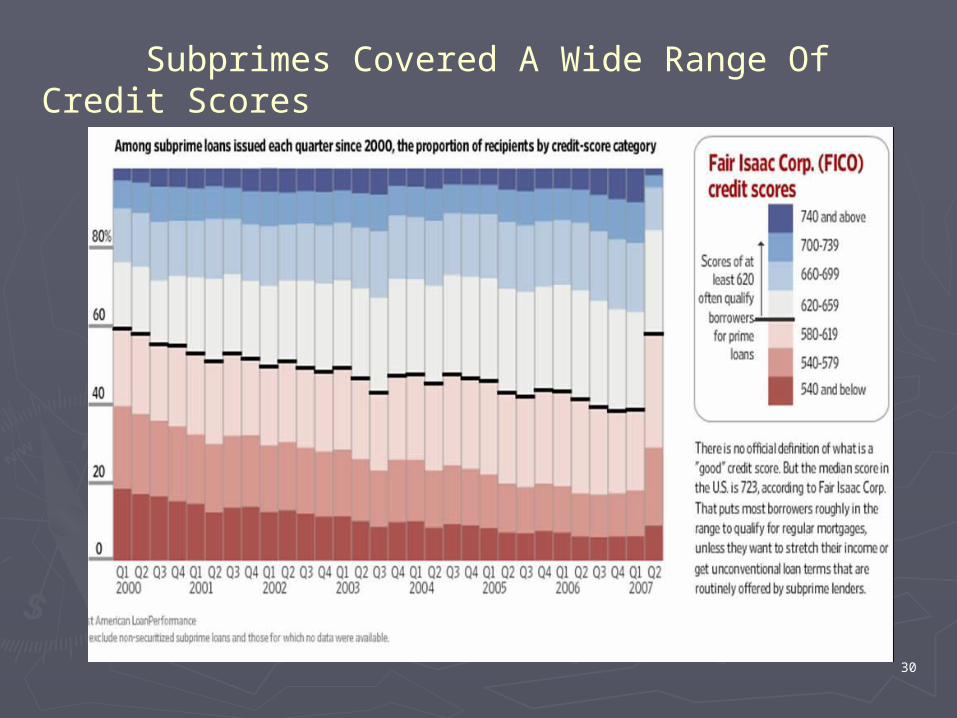
Subprimes Covered A Wide Range Of Credit Scores

31
…And An Array Of New-Style Mortgages

32
Banks Were Happy To Help – With The Aid Of New Risk Management Technology
Residential Mortgage-Backed Securities (RMBSs)
CDO Senior Tranches (RMBSs)
CDO Mezzanine Tranches (RMBSs)
CDO Equity Tranches (RMBSs) “Natural”
AAA – AA Rated
“Natural” A - BB Rated (RMBSs)
Unrated (Toxic) (RMBSs)
Regulated Insurers (ANBAC)
AAACredit Default Swap Sellers (Bear, Merrill, Wachovia, AIG)
Artificial AAA Rating Mezzanine Tranches (RMBSs)
33
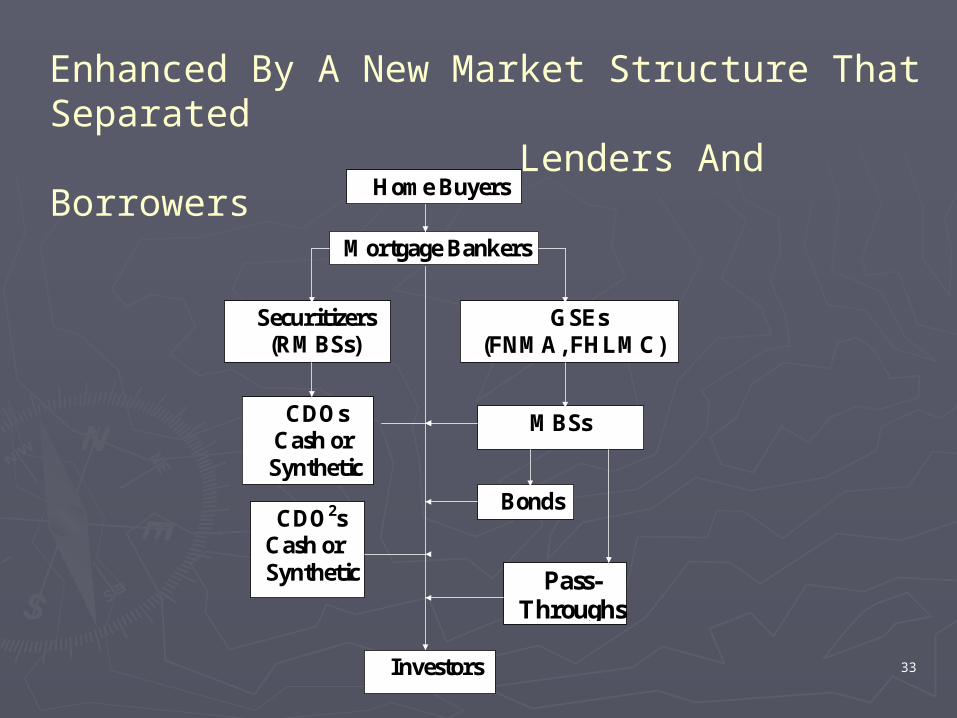
Enhanced By A New Market Structure That Separated Lenders And Borrowers
Home Buyers
Mortgage Bankers
Securitizers (RMBSs) Stearns)
GSEs (FNMA, FHLMC)
CDOs Cash or Synthetic
MBSs
Investors
CDO2s Cash or Synthetic
Bonds
Pass-Throughs

34
Bank Eagerness Was Aided By A Steep Yield Curve That Encouraged Use Of Short-Term Borrowing To Finance Long-Term Assets

35
With The Consequence Of Extremely High Leverage And Unmatched Balance Sheets
¶ $30-$40 Of Debt For Each Dollar Of Capital Was Common (eg., Bear, Lehman, GSEs)
¶ The Debt Was Largely Short-Term
Subject To Interest Rate Fluctuations Subject To Non-Renewal If Lenders Balked Or Contracts Were Violated
36
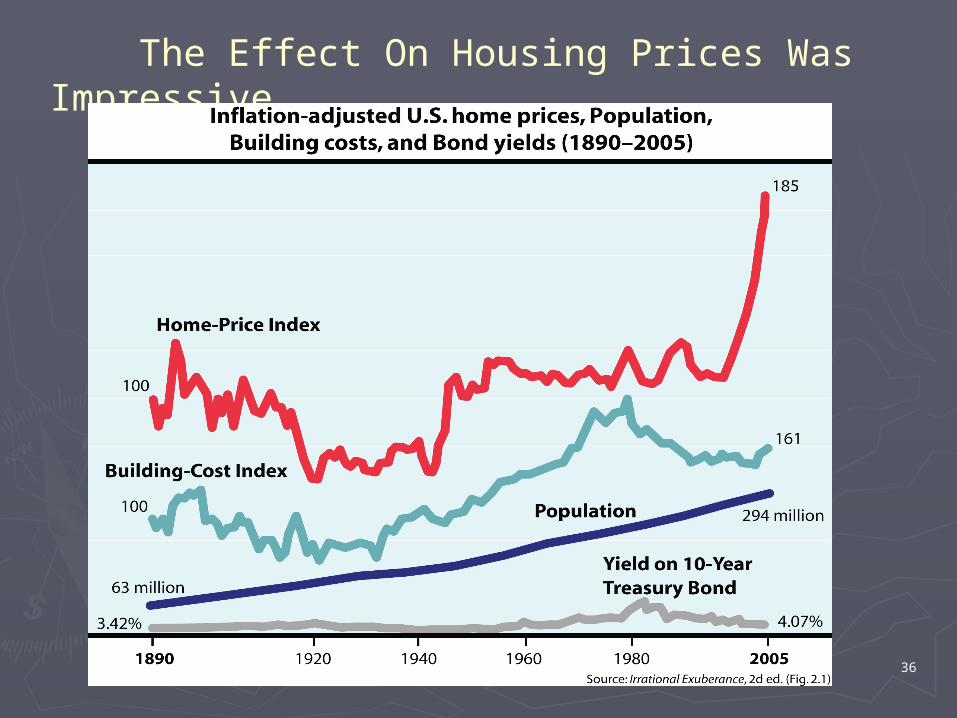
The Effect On Housing Prices Was Impressive
37
The Downfall:The Downfall:
The Devil Is In The The Devil Is In The DetailsDetails

38
How Can Such Devastation Start From Such How Can Such Devastation Start From Such SmallSmall Beginnings? Beginnings?
¶ Subprimes are Part Of A Spectrum Of Qualities Subprimes are Part Of A Spectrum Of Qualities
¶ The Effects Of Falling Home Prices Are Magnified The Effects Of Falling Home Prices Are Magnified By Credit Derivatives By Credit Derivatives
¶ The Butterfly Effect: Small Disturbanced Can Create The Butterfly Effect: Small Disturbanced Can Create Large Responses in Highly Interactive Systems Large Responses in Highly Interactive Systems

39
The Butterfly Effect:The Butterfly Effect:Mountains From MolehillsMountains From Molehills
Click Camera To Play Video(Requires Internet Connection And Windows Media Player)

40
In 2006-2007 Short-To-Intermediate Term Interest Rates Rose, The Yield Curve Flattened, And Profitability Declined For Mortgage Holders Relying On Short-Term Financing

41
ARM Resets Increased As Interest Rates Rose, And In Mid-2006 House Prices Began To Fall…
42
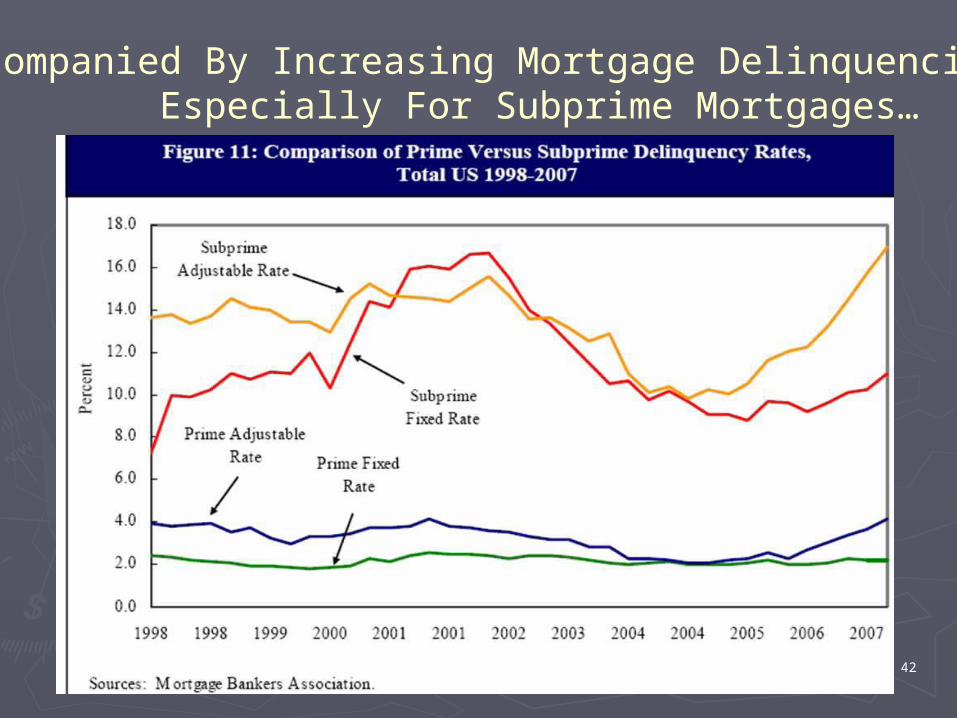
Accompanied By Increasing Mortgage Delinquencies, Especially For Subprime Mortgages…
43
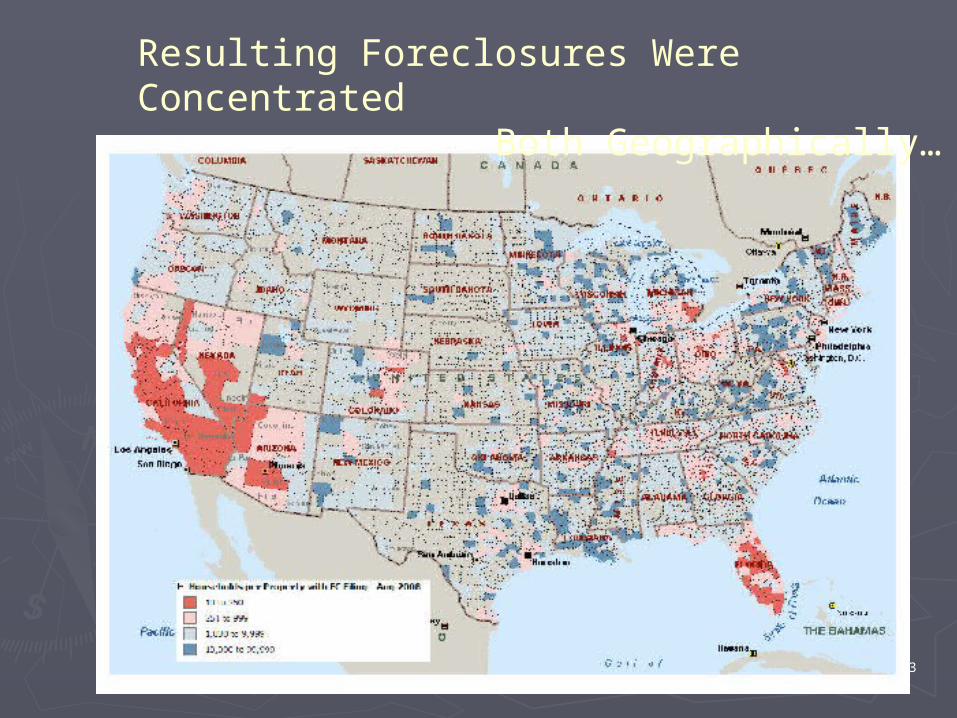
Resulting Foreclosures Were Concentrated Both Geographically…
44
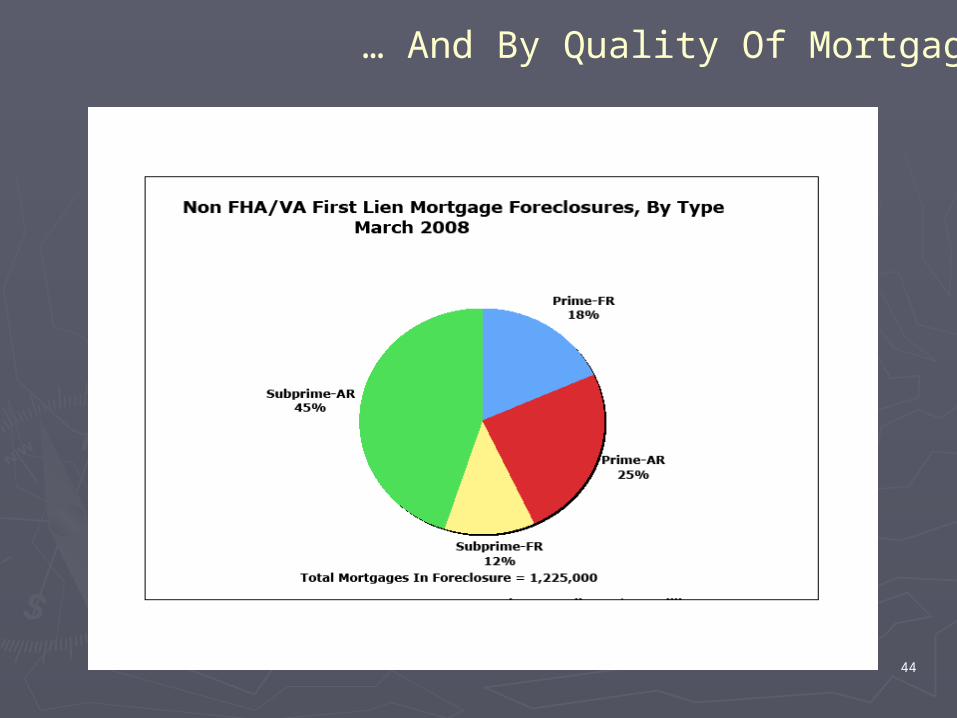
… And By Quality Of Mortgage

45
In 2007 Prices Of Subprime Mortgage Credit Default Swaps Began To Fall, Particularly At Lower Ratings

46
Creating Impaired Capital, A “Run” On Commercial Paper And A Severe Credit Crunch

47
And A Rise In Anticipated Stock Market Volatility

48
All This In Spite Of A Massive Federal Reserve Action To Increase Bank Reserves And Restart Lending
49
The Credit Crunch Kicked Off A Chain Of Events…
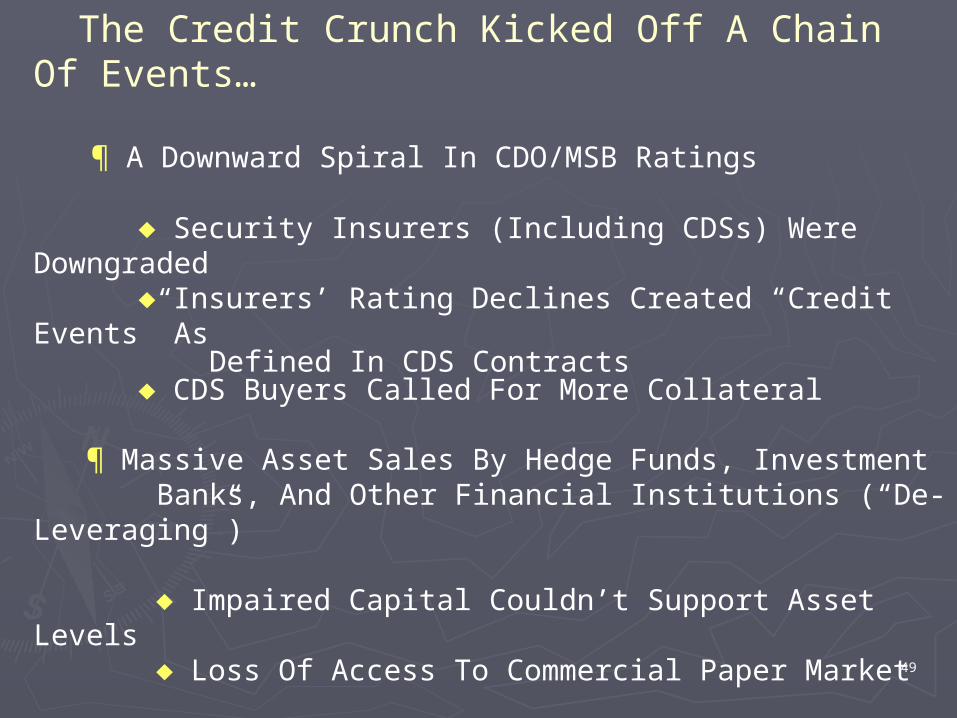
¶ A Downward Spiral In CDO/MSB Ratings
Security Insurers (Including CDSs) Were Downgraded Insurers’ Rating Declines Created “Credit Events” As Defined In CDS Contracts CDS Buyers Called For More Collateral
¶ Massive Asset Sales By Hedge Funds, Investment Banks, And Other Financial Institutions (“De-Leveraging”)
Impaired Capital Couldn’t Support Asset Levels Loss Of Access To Commercial Paper Market ¶ Forced Liquidations Of Collateralized Securities
Margin Loans And Personal Loans On Security Collateral Redemptions At Mutual Funds And Hedge Funds Runs On Banks (WAMU)

50
And The Fog Of War Set In…
¶ Uncertainty About Prices Of Mortgage Pools, Especially Equity Tranches
Prepayment / Repayment / Default Schedule Uncertainty CDOs and MSBs Were “Priced-to-Model,” Creating Inherently Uncertain Prices As Models Differed Wildly As CDO/MSB Holders Sold, Bids Dried Up Investment Banks Were Forced To “Mark-to-Market,” By FASB 157 Effective In 2007
¶ Creating Even Greater Price Declines…
¶ Resulting In Evden Greater Price Uncertainty

51
Big Banks Begin To Collapse In March, 2008… Financial Institution Failures
Failed Savior
Mar
July
Sep
Bear Stearns Major Securitizer CP Issuer Loan Guarantees Reputational Puts
JPMorganChase $2 Per Share FED Guarantee ($29B)
FNMA/FHLMC Major Securitizers MSB Issuer
FNMA/FHLMC Major Securitizers MSB Issuer
U.S. Government UST Buys Preferred Shares FED Loan Facility
Private Sector Buys Preferred Shares
U.S. Government FHFA Takes Over Mortgage GSEs
Re-Nationalized
Lehman Brothers Major CDS Seller Heavy Reliance on CP
American Int’l Group Major CDS Seller Lehman is “Credit Event” Triggering CDS Claims
U.S. Government UST Buys 80% of Shares UST Extends Credit at LIBOR+8.5% FED Backs Credit Line
52
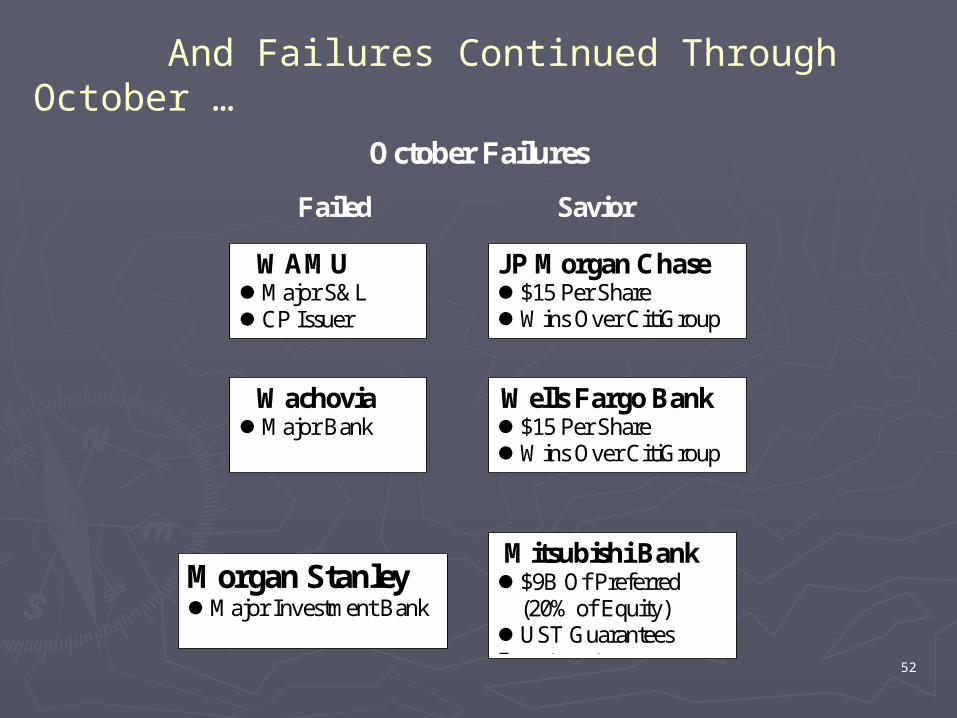
October Failures
Failed Savior
Wachovia Major Bank
Wells Fargo Bank $15 Per Share Wins Over CitiGroup Offer of $2
Morgan Stanley Major Investment Bank
Mitsubishi Bank $9B Of Preferred (20% of Equity) UST Guarantees Investment
WAMU Major S&L CP Issuer
JP Morgan Chase $15 Per Share Wins Over CitiGroup Offer of $2
And Failures Continued Through October …

53
And Into November
Failed Savior
CitiGroup News Of TARP I-A Disrupts Citi Sales Of Mortgages To UST
Citi Stock Tanks
UST, Fed, FDIC Gives Citi A Put Option Citi Losses Capped At $29B Plus 10% Of Additional Losses

54
Who’s To Blame?Who’s To Blame?

55
Human Greed ¶ Gullible (At Best) And Mendacious (At Worst) Home Buyers
¶ Mendacious (At Best) And Criminal (At Worst) Mortgage Brokers And Lenders
¶ Nothing New Here
56
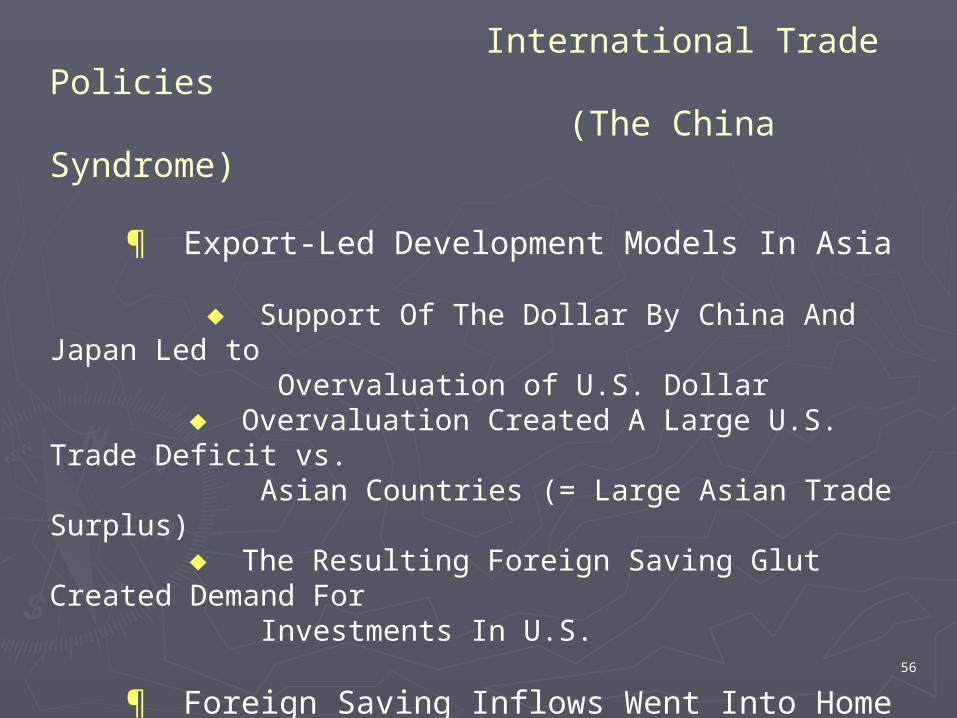
International Trade Policies (The China Syndrome)
¶ Export-Led Development Models In Asia
Support Of The Dollar By China And Japan Led to Overvaluation of U.S. Dollar Overvaluation Created A Large U.S. Trade Deficit vs. Asian Countries (= Large Asian Trade Surplus) The Resulting Foreign Saving Glut Created Demand For Investments In U.S. ¶ Foreign Saving Inflows Went Into Home Mortgages
U.S. Businesses And U.S. Treasury Borrowing Was Unusually Low Prime Mortgage Market Was Saturated A Market For Subprime and Alt-A Mortgages Arose

57
Macroeconomic Policy: Easy Monetary PolicyMacroeconomic Policy: Easy Monetary PolicyIn The Greenspan YearsIn The Greenspan Years
58
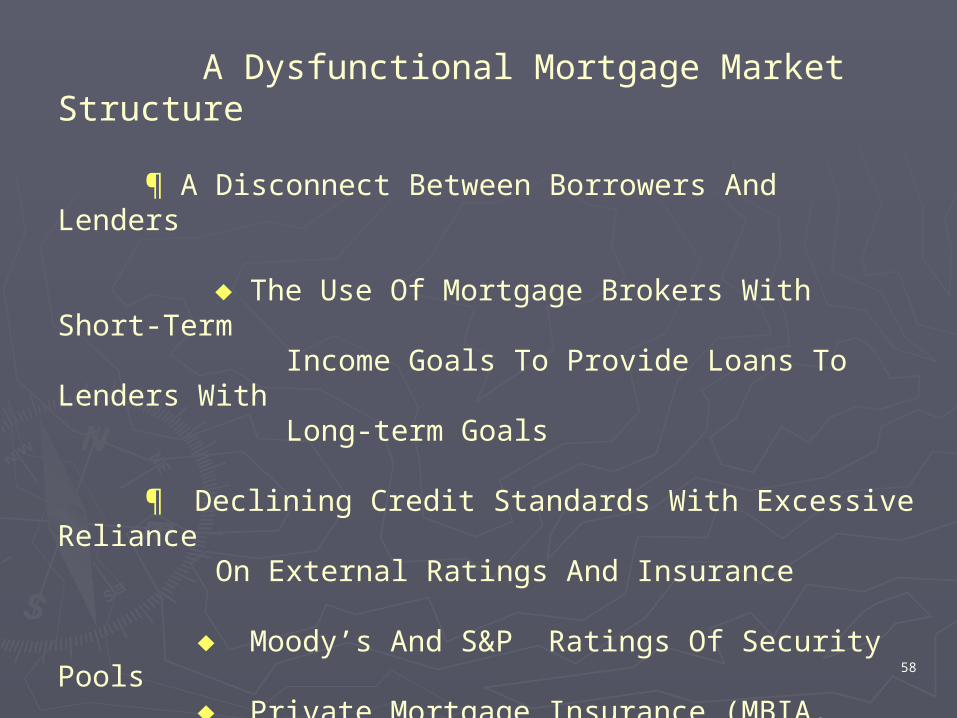
A Dysfunctional Mortgage Market Structure ¶ A Disconnect Between Borrowers And Lenders
The Use Of Mortgage Brokers With Short-Term Income Goals To Provide Loans To Lenders With Long-term Goals ¶ Declining Credit Standards With Excessive Reliance On External Ratings And Insurance
Moody’s And S&P Ratings Of Security Pools Private Mortgage Insurance (MBIA, ANBAC, FSA) Credit Default Swaps Sold By Investment Banks

59
A Dysfunctional Mortgage Market Structure ¶ Subprimes Were Especially Sensitive To Housing Prices
Credit-Worthy Loans Had Low LTV Ratio So Equity Was Secure Subprimes Were Predicated On Equity Buildup From Price Increases
60
Complex And Opaque Financial Instruments
¶ The CDO – CDS Structure Hid Important Information
Poor “Price Discovery” • CDOs Extremely Difficult To Value • Layering Of CDOs (CDO2, Synthetic CDOs, Synthetic CDO2) Compounded Pricing Problems
Unclear Locus Of Ultimate Risks • Insurance via CDSs Laid The Risks Off Onto Unknown Risk-Buyers
No Firm Knew The Positions Of Other Firms • CDOs And CTSs OTC-Products—No Clearing House
61
Obtuse Risk Management
¶ The Myth Of Systemic Safety Through Portfolio Diversification Defective Risk-Management-By-Bell-Curve (“Black Swans”) Reliance On Unregulated Credit Derivatives (CDSs) And Private Mortgage Insurance Companies Failure To Appreciate That What Is Good For One Can Be Bad For All
¶ The “Investment Banking Model” Holding An Unbalanced Book (Duration Exposure) High Leverage To Hold Inventory Of Assets

62
Ideology
¶ Financial De-Regulation
The Reagan-Greenspan Model Of Self-Regulation Implementation Of Opaque Proprietary Risk-Management Models At Major Banks (Basel II) Relaxation Of Net Capital Rule For Investment Bank Brokerage Divisions (SEC, 2004) Low Capital Requirements For GSEs (30:1 Debt/Equity) In 2000 The CFTC Excluded OTC Swap Agreements From Regulation
63
Politics
¶ Political Pressures For “Affordable” Homeownership
The CRA of 1977 And GLB of 1999 HUD’s “Special Affordable Loan” Quotas For GSEs: (12% in 1996, 22% in 2005, 28% in 2008) Strong Bipartisan Support • President Bush Advocated Broadened Home Ownership • Congressional Leaders Pushed GSE Lending To “Needy” Homebuyers Starting with The Federal Housing Enterprises Financial Safety and Soundness Act (1992)
¶ Tax Policy
1997 Shift In Capital Gains Taxes on Housing Profits to $500K Exclusion ($125K Single Taxpayer)

64
Poorly-Timed Improvements In Transparency
¶ FASB 157 “Mark-To-Market” Requirement For Level 3 (“Toxic”) Assets, Effective Nov. 2007
¶ Introduction In 2006 Of The ABX Index Of CDO Prices Ended The “Assymetric Information”

65
Policy Responses:Policy Responses:
Bailing Out Wall Bailing Out Wall StreetStreet

66
67
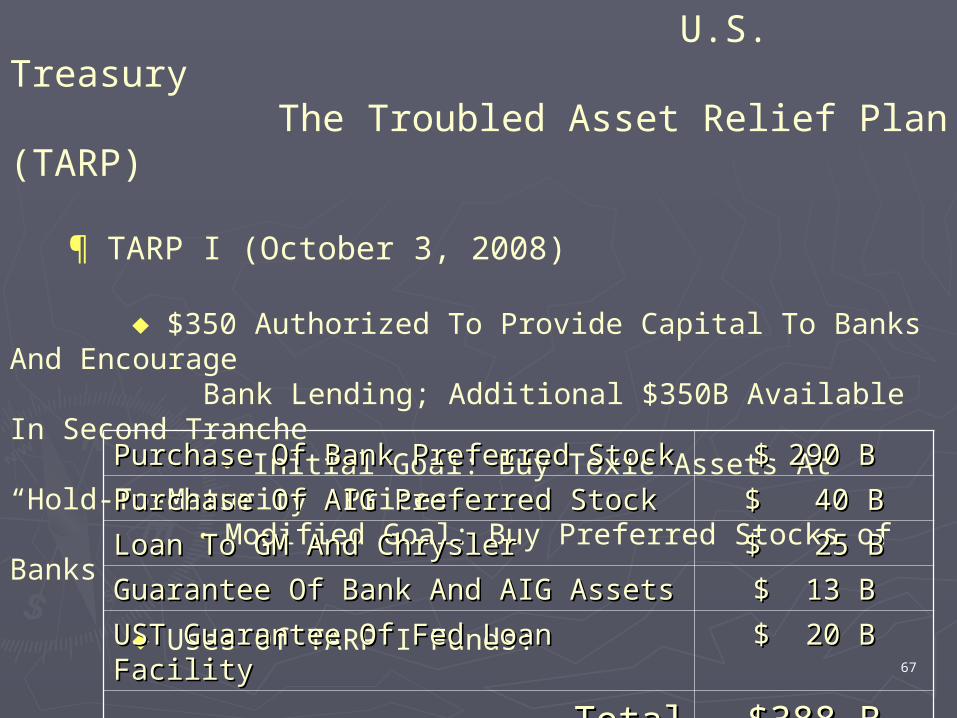
U.S. Treasury The Troubled Asset Relief Plan (TARP)
¶ TARP I (October 3, 2008)
$350 Authorized To Provide Capital To Banks And Encourage Bank Lending; Additional $350B Available In Second Tranche • Initial Goal: Buy Toxic Assets At “Hold-To-Maturity” Prices • Modified Goal: Buy Preferred Stocks of Banks
Uses Of TARP I Funds: Purchase Of Bank Preferred StockPurchase Of Bank Preferred Stock $ 290 B$ 290 B
Purchase Of AIG Preferred StockPurchase Of AIG Preferred Stock $ 40 B$ 40 B
Loan To GM And ChryslerLoan To GM And Chrysler $ 25 B$ 25 B
Guarantee Of Bank And AIG AssetsGuarantee Of Bank And AIG Assets $ 13 B$ 13 B
UST Guarantee Of Fed Loan FacilityUST Guarantee Of Fed Loan Facility $ 20 B$ 20 B
TotalTotal $388 B$388 B

68
U.S. Treasury The Troubled Asset Relief Plan (TARP)
¶ TARP II (February 11, 2009)
$312B Available After TARP I
• $100B UST Guarantee for Fed Levered Public- Private Toxic Asset Purchases • $ 75B Mortgage Modification Program • $ 30B Purchase Of Additional AIG Equity
$107B Still Available

69
U.S. TreasuryGovernment Sponsored Enterprise Support
Program
¶ $600B Asset Purchase And Loan Facility For Fannie Mae And Freddie Mac
$500B Purchase Of Mortgage Assets From GSEs $100B Loans to GSEs
70
Federal Reserve System Programs
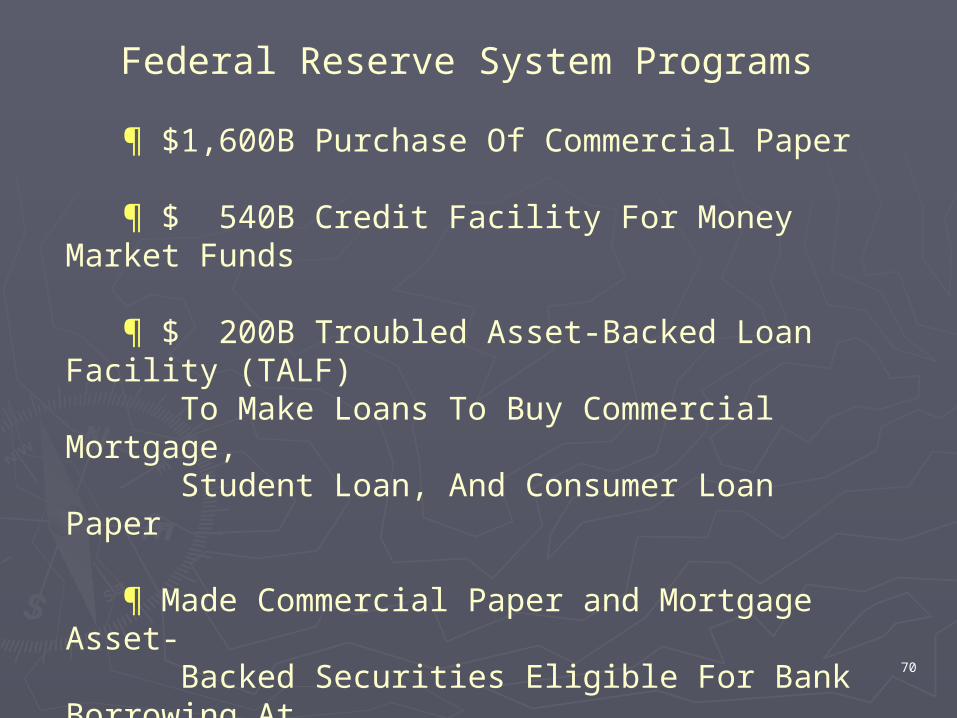
¶ $1,600B Purchase Of Commercial Paper
¶ $ 540B Credit Facility For Money Market Funds
¶ $ 200B Troubled Asset-Backed Loan Facility (TALF) To Make Loans To Buy Commercial Mortgage, Student Loan, And Consumer Loan Paper
¶ Made Commercial Paper and Mortgage Asset- Backed Securities Eligible For Bank Borrowing At Discount Window
¶ Unprecedented Expansion of Bank Reserves And Money Supply

71
Joint Treasury-Fed-FDIC Programs
¶ Public Private Investment Program (PPIP)
Designed To Create Market For Toxic Assets • Final Implementation Of Original TARP Mission • Announced March 23, 2009
The PPIP Plan • Private Sector Bids For Assets • For Each Dollar Of Assets Purchased - Private Party Pays 8 cents (Equity) - U.S. Treasury Pays 8 cents (Equity) - Fed Lends Private Party 84 cents in Non-Recourse Loan - FDIC Insures 84 cents of Non-Recourse Loans
72
Joint Treasury-Fed-FDIC Programs
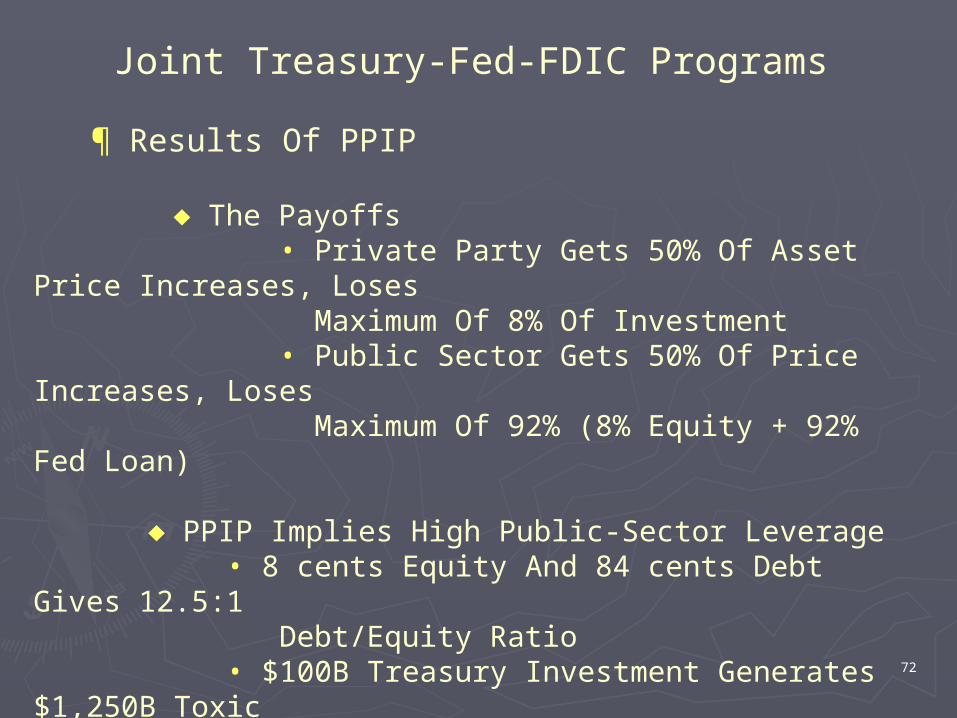
¶ Results Of PPIP
The Payoffs • Private Party Gets 50% Of Asset Price Increases, Loses Maximum Of 8% Of Investment • Public Sector Gets 50% Of Price Increases, Loses Maximum Of 92% (8% Equity + 92% Fed Loan)
PPIP Implies High Public-Sector Leverage • 8 cents Equity And 84 cents Debt Gives 12.5:1 Debt/Equity Ratio • $100B Treasury Investment Generates $1,250B Toxic Assets Purchased
73
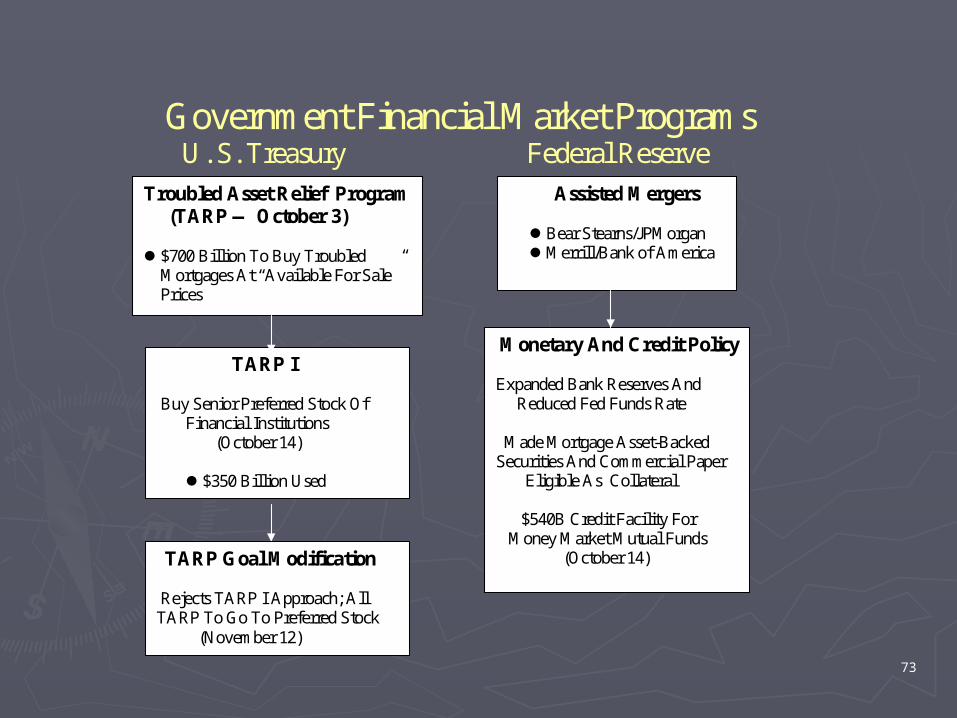
Government Financial Market Programs U. S. Treasury Federal Reserve
Troubled Asset Relief Program (TARP — October 3) $700 Billion To Buy Troubled Mortgages At “Available For Sale” Prices
TARP I Buy Senior Preferred Stock Of Financial Institutions (October 14) $350 Billion Used Never Implemented
Assisted Mergers Bear Stearns/JPMorgan Merrill/Bank of America Passed October 3
Monetary And Credit Policy Expanded Bank Reserves And Reduced Fed Funds Rate Made Mortgage Asset-Backed Securities And Commercial Paper Eligible As Collateral $540B Credit Facility For Money Market Mutual Funds (October 14)
TARP Goal Modification Rejects TARP I Approach; All TARP To Go To Preferred Stock (November 12)

74
Government Financial Market Support Programs U. S. Treasury Federal Reserve
GSE Mortgage Support Provides $500 Billion To Buy Mortgages From GSEs Buy $100B Of GSE Obligations (November 26,2008)
Troubled Asset-Backed Lending Facility (TALF) Provides $200 Billion For Purchases Of Asset-Backed Consumer Credit And Commercial Mortgages (November 26, 2008)
TARP II Congress Approves Second $350B Of TARP For Additional Assistance To Financial Institutions (January 15, 2009)

75
The Federal Financial Bailout BudgetThe Federal Financial Bailout Budget
76

77
Treasury And Fed Financial Bailout BudgetTreasury And Fed Financial Bailout Budget
AuthorizeAuthorizedd
CommittedCommitted
As InvestorAs Investor $2,350.0 $2,350.0 BB
$ 576.0 $ 576.0 BB
Fed – Commercial Paper Purchase Fed – Commercial Paper Purchase FacilityFacility
$ 1,600.0 $ 1,600.0 BB
$ 257.0 B$ 257.0 B
UST – Levered Fed TALFUST – Levered Fed TALF $ 100.0 $ 100.0 BB
$ 0.0 B$ 0.0 B
UST TARP I – Bank/AIG Capital UST TARP I – Bank/AIG Capital PurchasePurchase
$ 290.0 $ 290.0 BB
$ 290.0 $ 290.0 BB
UST TARP I – GM/Chrysler Preferred UST TARP I – GM/Chrysler Preferred StockStock
$ 24.8 $ 24.8 BB
$ 18.4 B$ 18.4 B
UST TARP I – Purchases from GSEs UST TARP I – Purchases from GSEs $ 500.0 $ 500.0 BB
$ 0.0 B$ 0.0 B
UST TARP II – Bank Capital PurchaseUST TARP II – Bank Capital Purchase $ 100.0 $ 100.0 BB
$ 0.0 B$ 0.0 B
UST TARP II – Toxic Asset-Backed PaperUST TARP II – Toxic Asset-Backed Paper $ 200.0 $ 200.0 BB
$ 0.0 B$ 0.0 B
As LenderAs Lender $1,502.0 $1,502.0 BB
$ 229.0 $ 229.0 BB
UST Loans to GSEsUST Loans to GSEs $ 100.0 $ 100.0 BB
$ 212.0 B$ 212.0 B
Fed Loans to Money Market Funds Fed Loans to Money Market Funds $ 540.0 $ 540.0 BB
$ 17.0 B$ 17.0 B
UST TARP II – Homeowner AssistanceUST TARP II – Homeowner Assistance $ 75.0 $ 75.0 BB
$ 0.0 B$ 0.0 B
As InsurerAs Insurer $ 397.5 $ 397.5 BB
$ 75.0 $ 75.0 BB
Total Total
$3,877.0 $3,877.0 BB
$ 983.0 B$ 983.0 B

78
Policy Responses:Policy Responses:
Bailing Out Main Bailing Out Main StreetStreet
79
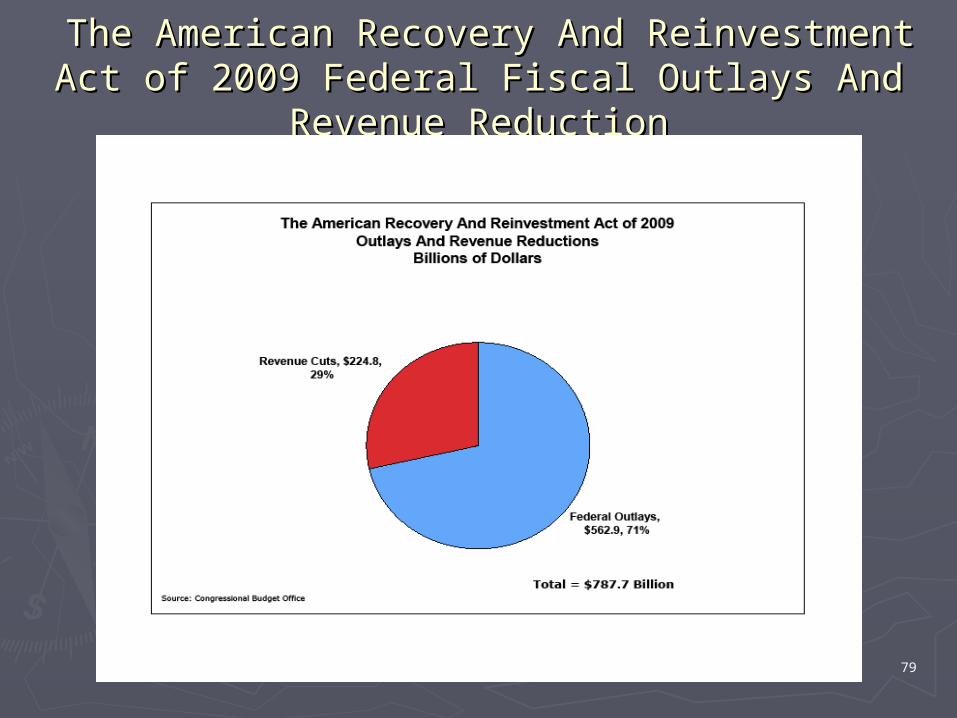
The American Recovery And Reinvestment Act of The American Recovery And Reinvestment Act of 2009 Federal Fiscal Outlays And Revenue 2009 Federal Fiscal Outlays And Revenue
ReductionReduction

80
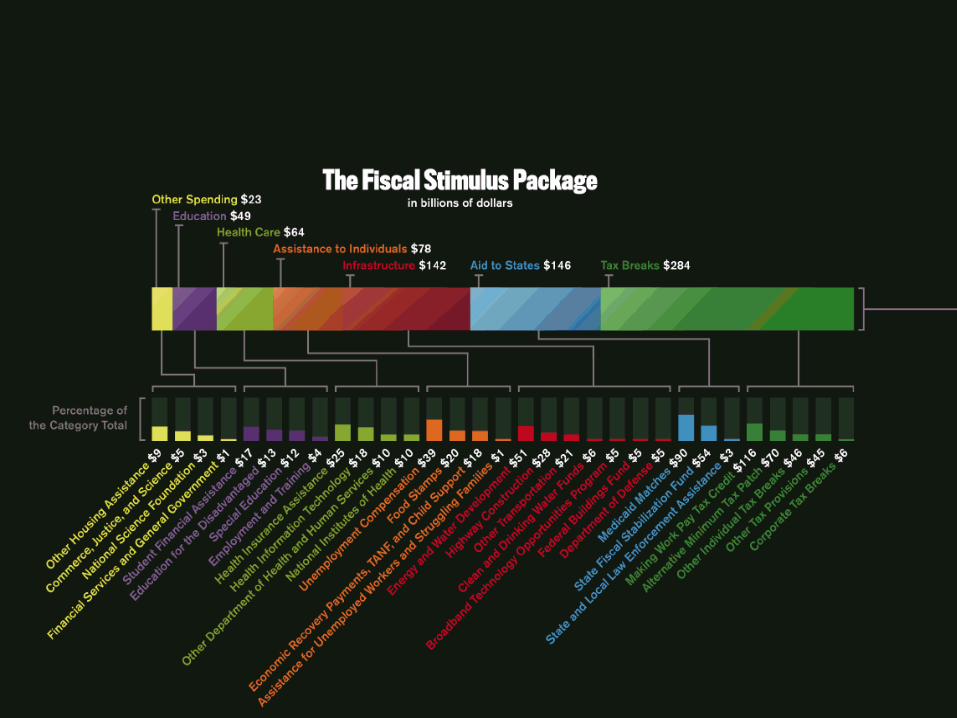
The American Recovery And Reinvestment Act The American Recovery And Reinvestment Act of 2009of 2009
The Allocation Of Increased Federal Fiscal The Allocation Of Increased Federal Fiscal OutlaysOutlays
81

82
Timing Of Outlays and Revenue ReductionsTiming Of Outlays and Revenue ReductionsUnder The ARRA Of 2009Under The ARRA Of 2009

83
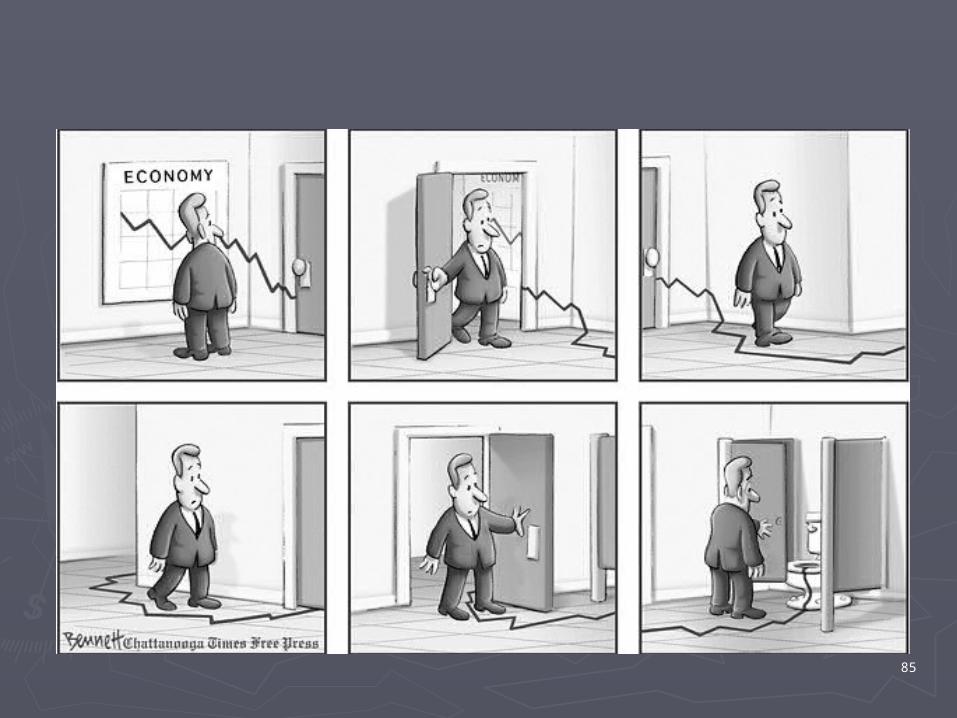
How Have The Rescue Plans Played In Peoria?

84
What’s Next ?What’s Next ?
85

86
……For Credit Markets?For Credit Markets?
More Shoes To Fall
¶ Credit Card ABSs
¶ Auto Loan ABSs
¶ Student Loan ABSs
¶ Commercial Mortgage ABSs

87
……For The Stock MarketFor The Stock Market¶ The Risk Premium On Stocks Has Risen Sharply (See Previous VIX Chart)
¶ Once The Market Bottoms It Will Appreciate At An Historically High Rate (Above the 8-9 % Annual Average)
¶ If The Risk Premium Falls The Remaining Slide Will Be Less And The Subsequent Rate Of Appreciation Will Be Even Greater
¶ But…Where IS The Bottom?

88
……For Main Street?For Main Street?
The U.S. Had Unprecedented Macroeconomic The U.S. Had Unprecedented Macroeconomic Stability Stability
From 1985 through 2007…From 1985 through 2007…

89
But Now The Sources Of Aggregate Demand Are Weak
¶ Weak Spending On Consumer Durable Goods
Automobiles Appliances And Household Furnishings Not Simply A Matter Of Credit Cost And Availability
¶ Weak Private Domestic Investment
A Chronic Problem Since The Dot Com / Tech Bust In 2000 Exacerbated By Weak Consumer Demand
90
But Now The Sources Of Aggregate Demand Are Weak
¶ Slow Recovery In Residential And Commercial Construction
Large Excess Inventory Tightening Credit Standards
¶ Uncertain Net Exports
Decline In International Trade As All Economes Weaken Strong Dollar Works Aginst U.S. Trade (Weakens Exports and Encourages Imports)
91
Leaving A Prognosis Of A Weak Economy Well Into 2010EVEN IF Federal Spending And Federal Deficit Increase ¶ Proposed Energy And Infrastructure Projects Take Significant Time To Ramp Up Even If Spending Is Approved Quickly
Could Be Too Much Too Late Will Divert Resources From Private Sector Long After Needed
¶ Fiscal Policy Is Less Powerful Than Was RThught
Temporary Tax Cuts Have Little Effect On Spending The Spending Multipler Is About 1.0

92
Leaving A Prognosis Of A Weak Economy Well Into 2010EVEN IF Federal Spending And Federal Deficit Increase ¶ Little Hope For Effective Federal Reserve Monetary Policy Short-Term Interest Rates Near Floor (Zero) Medium-To-Long Term Interest Rates Quite Low The Fed Has Shifted To “Quantitative Easing,” But The Japanese Experience Was Not Encouraging
93
The Case For A Slow U-Shaped Recovery
¶ Worst Macroeconomic Shock Since The 43-Mont Decline In 1930-1933
¶ No Clear Sector To Lead Recovery
¶ The Problems Are On An International Scale
¶ Massive Deleveraging With Tighter Credit Standards Will Create Little Room For Spending Increases

94
The FutureThe Future

95
New Financial Regulation
¶ New Regulatory Framework And Market Mechanisms
Consolidation Of Supervisors—A “Super Regulator” Extension Of Clearing Houses To Credit Derivatives And Related Insurance Products • Makes Positions Open To Public • Mitigates Counterparty Risk Improved Alignment Of Financial System Compensation With Public Interest In Financial Stability
¶ Development Of Uniform International Accounting And Regulatory Standards GAAP Now Being Replaced By IASB Standards Nascent Cooperation On Regulation (Basel II, Treasury Plan)
96
A New National Psyche
¶ Post-Depression Era Psychology
Saving Over Consumption Increased Risk Aversion In Investing An Anti-Business Environment A Shift Of New Capital Investment From Corporations To Government • Direct Government Investments (e.g., Infrastructure) • Government Subsidies And Guarantees (e.g., Energy, Environment)

97
A New International Financial Order
¶ International Skepticism About Cross-Border Investing
Growth In European Financial Markets Potential Reduction In Role Of U.S. Dollar As Reserve Currency • Loss Of U.S. Seignorage Rents • Dollar Depreciation And Consequent Inflation An Anti-Business Environment
98
Some Common-Some Common-SenseSense
Investment Lessons Investment Lessons
99
Some Common Sense Investment Lessons
¶ Understand Your Investments
COMPLEXITY Is Good For The Seller, Not The Buyer Price Transparency Is Good—Know How Assets Are Priced Liquidity Is Good—Allows an Exit Plan ¶ Very Bad Outcomes, Though Rare, Are More Common Than Experts Say
¶ No Free Lunch: If It Has High Returns, It Has High Risks
100
And More Common Sense Investment Lessons
¶ Market Timing Doesn’t Work
For Each Who Buys Low And Sells High, There Is Someone Who Sells Low And Buys High—Which are you? Evidence Is Strongly Against It
¶ Indexed Investments Are Good
Provide Broad Diversification Generally Have Low Operating Costs Much Expensive Active Management Is Really Closet Indexing

101
And Even More Common Sense Investment Lessons
¶ Avoid Well-Known Psychological Pitfalls
Excessive Loss Aversion—Realized vs. Unrealized Losses Over Confidence In Investment Skills—Excessive Trading Over-Reaction At Peaks And Troughs

102
FinisFinis