Embed Size (px)
Citation preview
1
The Economics of Food Insecurity in the United States
Craig Gundersen,* Brent Kreider, and John Pepper
Abstract
Food insecurity is experienced by millions of Americans, and its prevalence has increased
dramatically in recent years. Due to its prevalence and many demonstrated negative health
consequences, food insecurity is one of the most important nutrition-related public health issues
in the U.S. In this article, we cover how economic insights and models have improved our
understanding of the determinants of food insecurity, the effects of food insecurity on health
outcomes, and the impact of food assistance programs on food insecurity. We conclude with a
discussion of several issues where economists can provide further insights.
JEL Codes: I1, I3, D12
*Correspondence may be sent to: Craig Gundersen, [email protected].
Craig Gundersen is Professor in the Department of Agricultural and Consumer Economics,
University of Illinois. Brent Kreider is Professor in the Department of Economics, Iowa State
University. John Pepper is Associate Professor in the Department of Economics, University of
Virginia. Gundersen and Kreider acknowledge financial support from the Food Assistance and
Nutrition Research Program of ERS, USDA, contract number 59-5000-7-0109. Pepper
acknowledges financial support from the Bankard Fund for Political Economy. The views
expressed in this paper are solely those of the authors. The authors thank Ian Sheldon and an
anonymous referee for their comments and they thank Elizabeth Ignowski and Ben Wood for
their assistance in preparing the manuscript.
2
Introduction
Food insecurity is a serious challenge facing millions of Americans. In 2009, more than
50 million persons in the United States lived in households classified as food insecure, with over
one-third of these households experiencing more serious levels of food insecurity termed “very
low food security.” These rates have soared to unprecedented levels, having increased by more
than a third since 2007. The prevalence of food insecurity is of great concern to policymakers
and program administrators, a concern heightened by its many demonstrated negative health
consequences. The alleviation of food insecurity is a central goal of the Supplemental Nutrition
Assistance Program (SNAP, formerly known as the Food Stamp Program), the largest food
assistance program in the United States (USDA, 1999).
Due in large part to food insecurity’s status as one of the most important and high profile
nutrition-related public health issues in the U.S. today, a vast literature has emerged on the topic.
This literature has developed across several fields, with especially large contributions from the
nutrition and public health literatures. In recent years, economists have made key contributions
across two main dimensions. First, economists have provided a more cogent perspective on how
resources and budget constraints impact food insecurity. Second, by highlighting and addressing
key selection issues, economists have generated new insights for policymakers with emphasis on
identifying the causal impacts of food assistance programs on food insecurity. Of particular
concern from a methodological perspective, households are not randomly assigned to food
assistance programs but instead choose whether to participate based in part on characteristics
unobserved in the data, including their anticipated food insecurity status. If not carefully
addressed, such endogenous selection issues can seriously compromise our understanding of the
efficacy of such programs.

3
We begin with a description of how food insecurity is measured, followed by an
overview of the extent of food insecurity in the U.S. We then turn to three key questions where
economists have made contributions: (1) What are the determinants of food insecurity? After
covering the central non-income determinants of food insecurity, we consider the role of
economic shocks, the importance of assets, and the role of the macroeconomy. (2) What are the
causal effects of food insecurity on health outcomes? While there is intense concern about the
direct implications of food insecurity (e.g., that children may be skipping meals), increasing
attention is also being paid to associated negative health outcomes. We review the existing
literature along with a discussion of the identification problem that arises in the likely case where
unobserved factors associated with food insecurity and also associated with health outcomes.
This issue is referred to as the endogeneity or selection problem, and if not addressed, limits the
policy usefulness of these findings. (3) What is the impact of food assistance programs on food
insecurity? A central objective of food assistance programs in the United States is to alleviate
food insecurity. After an overview of such programs, we summarize the research on the effects
of the largest program, SNAP, on food insecurity. We then discuss what has been learned about
the effects of the National School Lunch Program (NSLP).
Economists have made contributions to the food insecurity literature for roughly a
decade. This work has generated some concrete policy recommendations that we highlight in the
conclusion. We follow up with several new areas of research in which economists’ perspectives
and methods have the potential to yield new, policy relevant insights.
Defining Food Insecurity
4
A series of questions designed to measure food insecurity debuted in the Current
Population Survey in 1996. After some modifications, the official set 18 questions used to
measure food insecurity in the United States was established as the Core Food Security Module
(CFSM). The measure is based on a set of 18 questions for households with children and a
subset of 10 of these 18 questions for households without children. Some of the conditions
people are asked about include: “I worried whether our food would run out before we got money
to buy more,” (the least severe item), “Did you or the other adults in your household ever cut the
size of your meals or skip meals because there wasn’t enough money for food,” “Were you ever
hungry but did not eat because you couldn’t afford enough food,” and “Did a child in the
household ever not eat for a full day because you couldn’t afford enough food” (the most severe
item for households with children). A complete list of questions is provided in Table 1.1
Each of the questions on the CFSM is qualified by the proviso that the conditions are due
to financial constraints. As a consequence, persons who have reduced food intakes due to, say,
fasting for religious reasons or dieting, should not respond affirmatively to these questions. It
should also be noted that answers to the questions are based on the perspective of the respondent.
Using the 18 questions, the USDA delineates households into food insecurity categories.
The idea underlying the use of multiple questions is that no single question can accurately
portray the concept of food insecurity. The number of affirmative responses is held to reflect the
level of food hardship experienced by the family. Based on the number of affirmative responses,
the following thresholds are established: (a) food security (defined as cases in which all
household members had access at all times to enough food for an active, healthy life), (b) low
food security (cases in which at least some household members were uncertain of having, or
unable to acquire, enough food because they had insufficient money and other resources for
5
food), and (c) very low food security (cases in which one or more household members were
hungry, at least some time during the year, because they couldn’t afford enough food).2
Categories (b) and (c) are often combined into the category of “food insecure.”
Households responding affirmatively to two or fewer questions are classified as food secure,
those responding affirmatively to three to seven questions are classified as food insecure without
hunger (three to five questions for households without children), and those responding
affirmatively to eight or more questions are classified as very low food secure (six or more for
households without children). Consistent with the language employed in the literature, a
household responding affirmatively to three or more questions is identified as food insecure.
One should note that all households defined as very low food secure are also food insecure, but
the converse is not true.
There are two other sets of food security categories coined by researchers. The first is
“marginal food insecure” which includes all households that respond affirmatively to one or
more of the questions. This is in contrast to the usual definition of food security described above
whereby households responding affirmatively to one or two questions are defined as food secure.
One justification for this measure is that marginally food insecure households often appear more
similar to food insecure households with respect to health outcomes and other characteristics
(e.g., income) than to food secure households further from the margin.
The second set of food insecurity questions is defined with respect to children in a
household. As a consequence, only the eight child-specific questions (i.e., those of the set of 18
questions that refer to the children in the household) are used. Under this set, a household is said
to be “child food insecure” if two or more questions are answered affirmatively and “very low
6
child food secure” if five or more questions are answered affirmatively. (For a discussion of the
child food insecurity measures see, e.g., Nord and Hopwood, 2007.)
In this review, we concentrate on binary measures of food insecurity since nearly all
research has focused on such indicators (e.g., food insecure versus food secure). These
comparisons are clear and straightforward, and they are relatively easy to implement in treatment
effect models. Still, considerable information is being suppressed in such cases. In particular,
information is not being utilized when broad categories are created from the 18 questions on the
CFSM. Consider, for example, two households with one responding affirmatively to eight
questions and the other responding affirmatively to 18 questions. Both are classified as very low
food secure yet, arguably, the latter household has a higher level of food insecurity. In response,
a series of food insecurity measures based on the Foster Greer Thorbecke class of poverty
measures were developed in Dutta and Gundersen (2007) and applied empirically in, e.g.,
Gundersen (2008).3 While we focus on binary indicators in this review, we encourage
researchers to consider more refined measures when feasible.
The Extent of Food Insecurity
In this section, we describe food insecurity trends for the United States from 2001 to
2009 based on the most recent available data from the CPS. Specifically, these data come from
the 2001-2009 December supplements, a monthly survey of approximately 50,000 households.
The CPS represents the official data source for official poverty and unemployment rates, and
official food insecurity rates for the U.S. are calculated using the CFSM component. The CFSM
has been included in the CPS in at least one month every year since 1995.
7
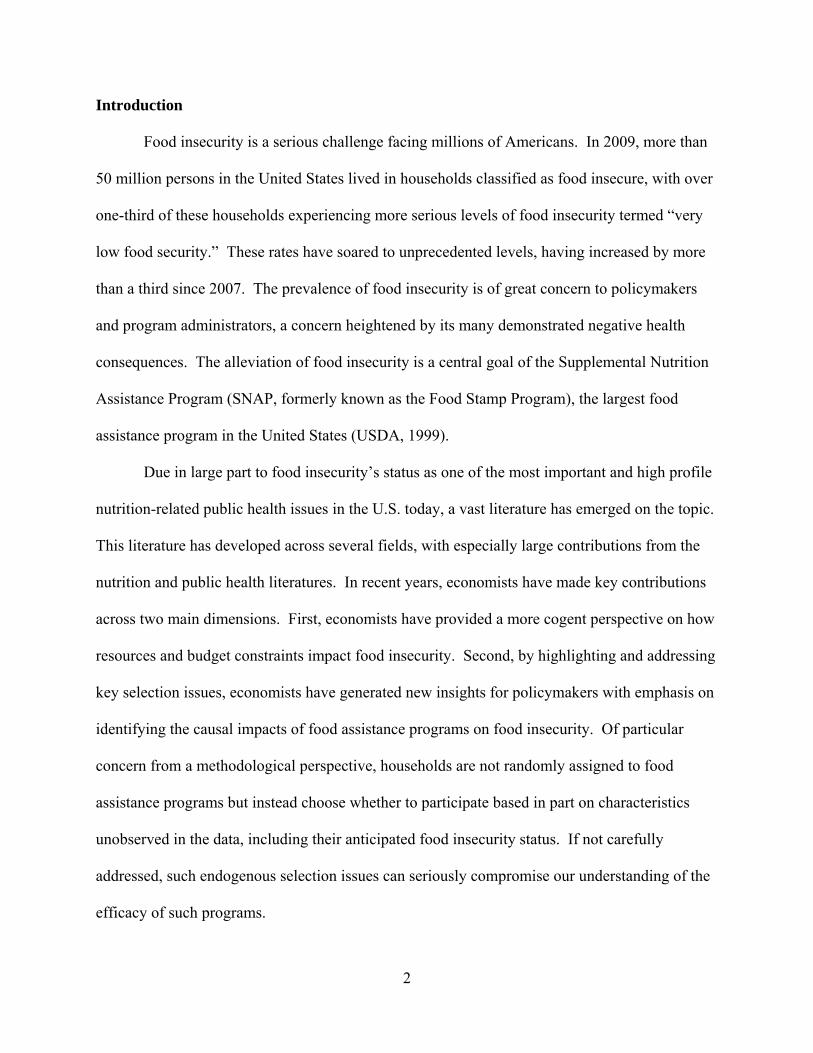
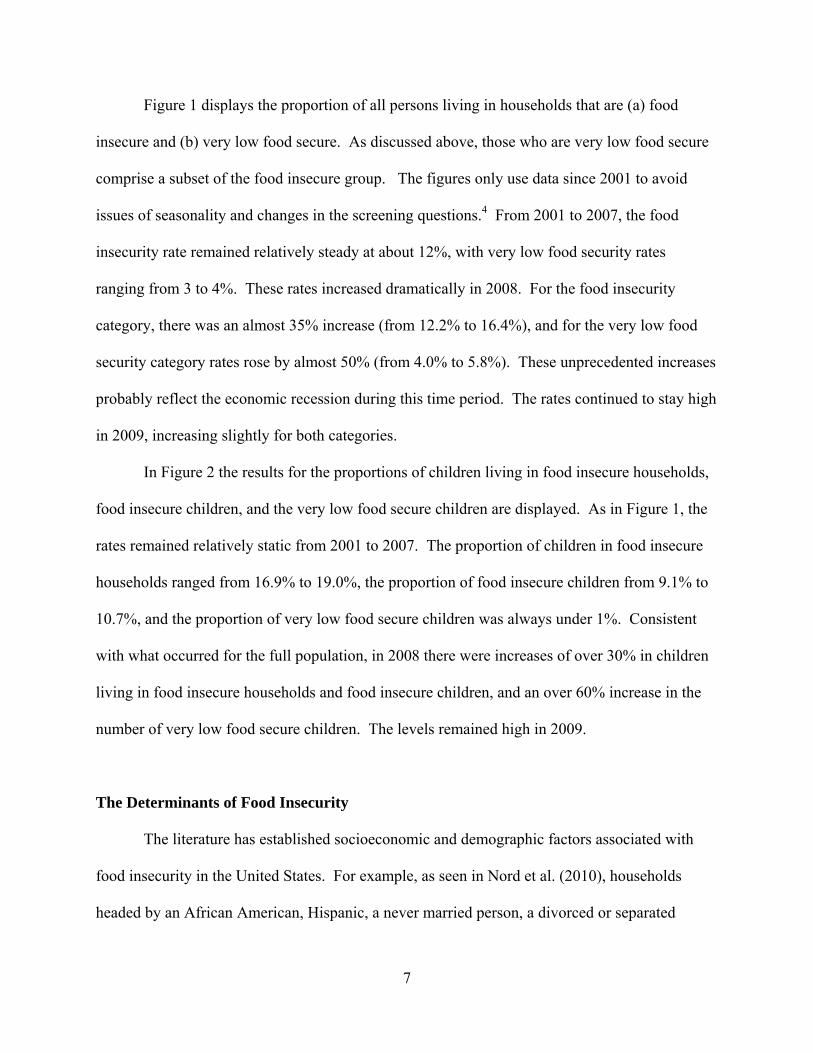
Figure 1 displays the proportion of all persons living in households that are (a) food
insecure and (b) very low food secure. As discussed above, those who are very low food secure
comprise a subset of the food insecure group. The figures only use data since 2001 to avoid
issues of seasonality and changes in the screening questions.4 From 2001 to 2007, the food
insecurity rate remained relatively steady at about 12%, with very low food security rates
ranging from 3 to 4%. These rates increased dramatically in 2008. For the food insecurity
category, there was an almost 35% increase (from 12.2% to 16.4%), and for the very low food
security category rates rose by almost 50% (from 4.0% to 5.8%). These unprecedented increases
probably reflect the economic recession during this time period. The rates continued to stay high
in 2009, increasing slightly for both categories.
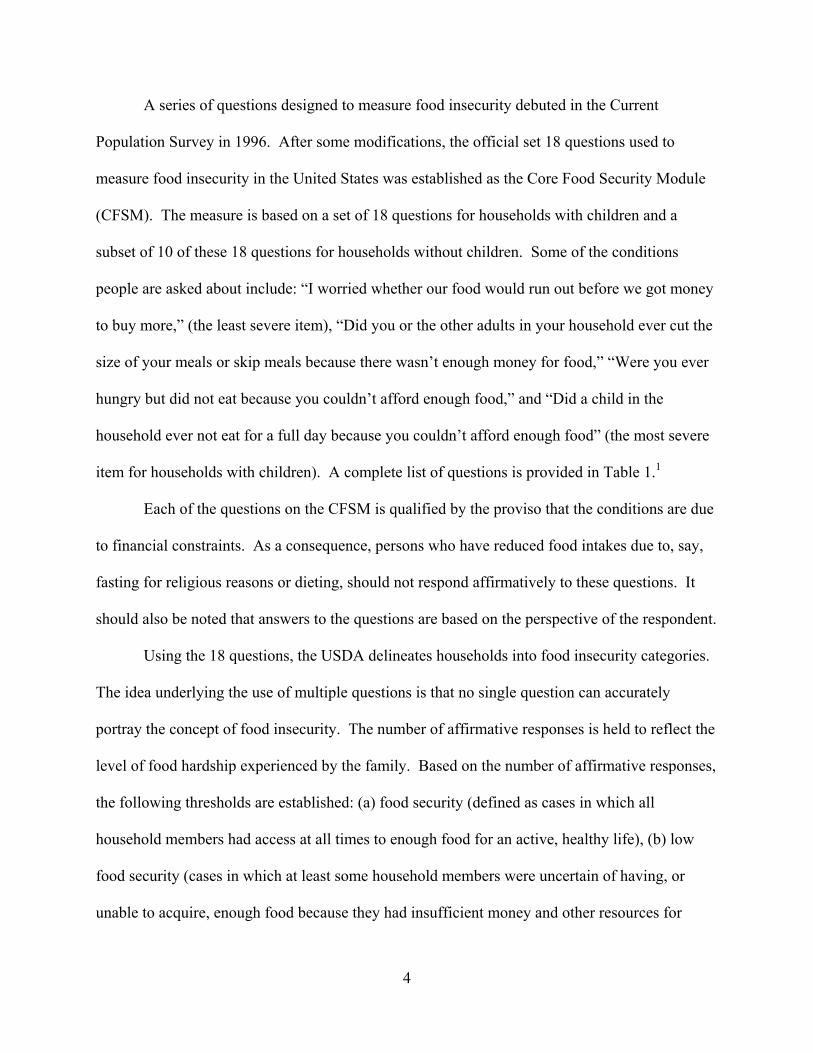
In Figure 2 the results for the proportions of children living in food insecure households,
food insecure children, and the very low food secure children are displayed. As in Figure 1, the
rates remained relatively static from 2001 to 2007. The proportion of children in food insecure
households ranged from 16.9% to 19.0%, the proportion of food insecure children from 9.1% to
10.7%, and the proportion of very low food secure children was always under 1%. Consistent
with what occurred for the full population, in 2008 there were increases of over 30% in children
living in food insecure households and food insecure children, and an over 60% increase in the
number of very low food secure children. The levels remained high in 2009.
The Determinants of Food Insecurity
The literature has established socioeconomic and demographic factors associated with
food insecurity in the United States. For example, as seen in Nord et al. (2010), households
headed by an African American, Hispanic, a never married person, a divorced or separated

8
person, a renter, younger persons, and less educated persons are all more likely to be food
insecure than their respective counterparts. In addition, households with children are more likely
to be food insecure than households without children. Research using multivariate methods has
generally found that, even after controlling for other factors, these characteristics are either
positively associated with food insecurity or are statistically insignificant. This general set of
findings holds whether the sample is all households, households with children, or households
without children.5 These findings have used data from each of the nationally representative data
sets which include the CFSM (or the full or portions of the six-item scale), namely the CPS,
Panel Study of Income Dynamics (PSID), the Early Childhood Longitudinal Study – Birth
Cohort (ECLS-B), the Early Childhood Longitudinal Study – Kindergarten Cohort (ECLS-K),
the Survey of Income and Program Participation (SIPP), the Three City Study (TCS), and the
National Health and Nutrition Examination Survey (NHANES). Along with these datasets, a
series of other smaller-scale datasets which are based on limited geographic areas have been used
in these studies.
Along with all these factors, perhaps the most important is the resources available to a
household. And, this is the research area where economists have especially advanced the food
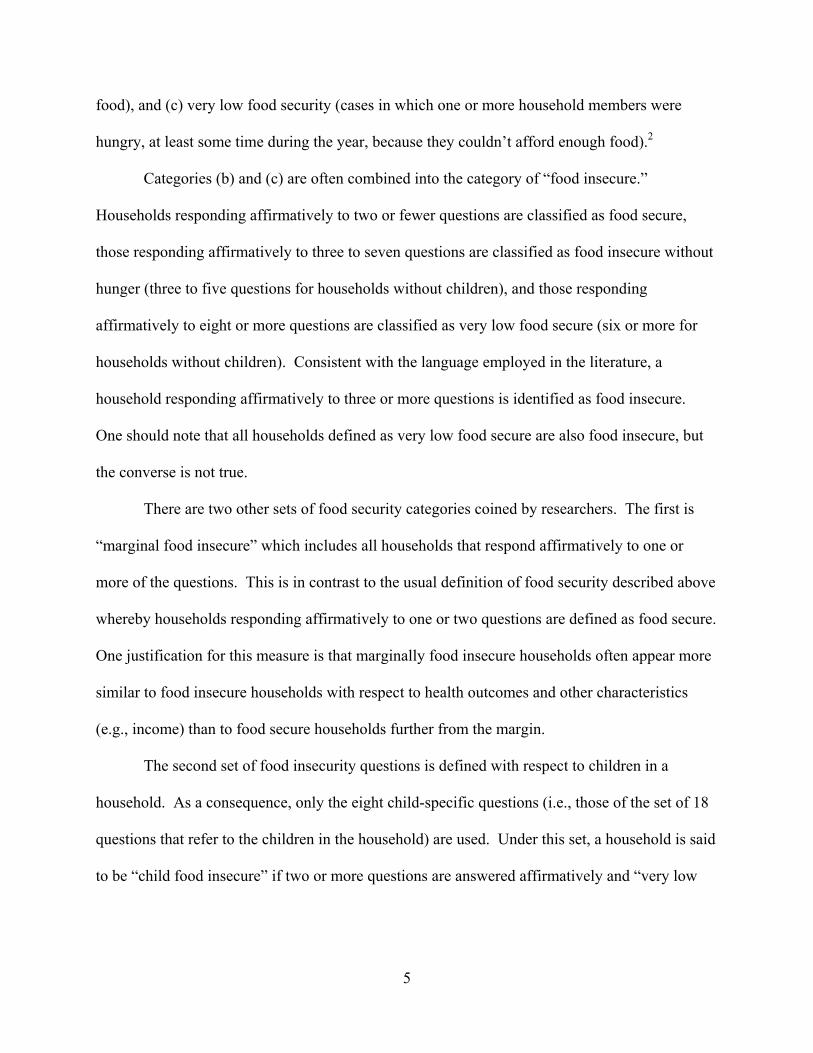
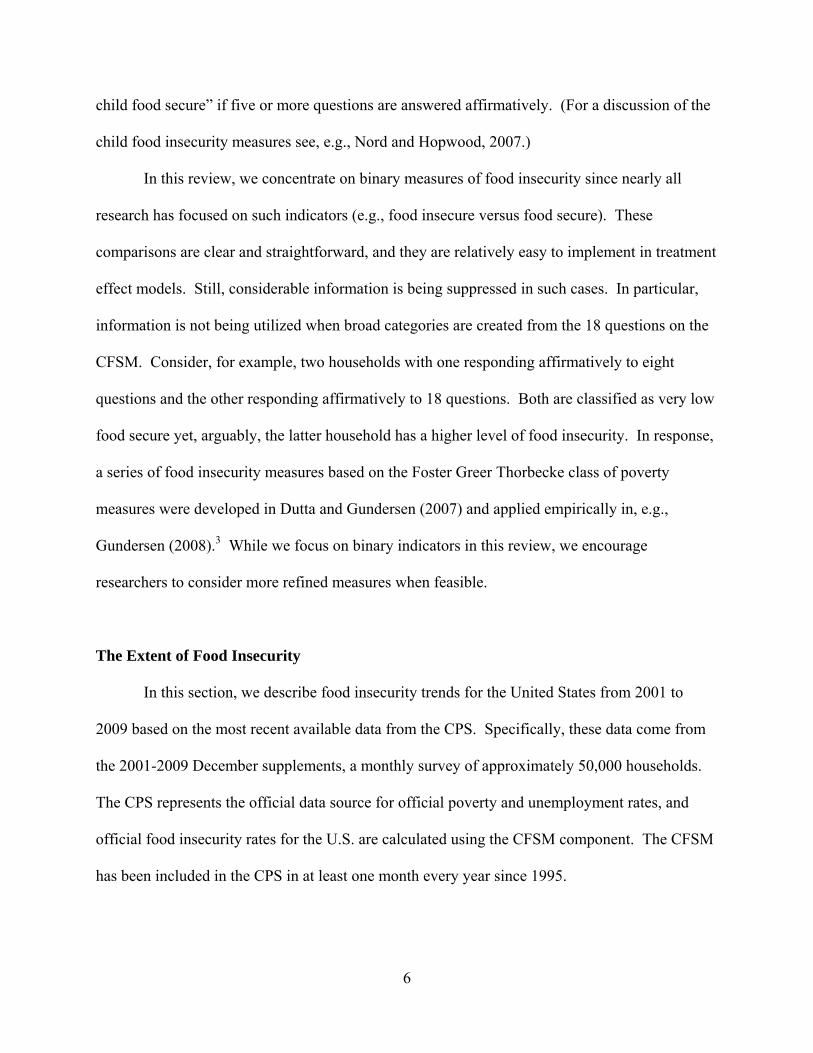
insecurity literature. The relationship between food insecurity and income (normalized by the
poverty line) can be found in Figure 3. (This is a nonparametric representation with a bandwidth
of 0.6. See Fox, 2000 for details on the estimation methods.) The figure is based on all
observations in the 2009 December Supplement of the CPS with incomes between 0 and 400%
of the poverty line. We emphasize three things from this figure. First, the probability of food
insecurity declines with income and the decline is more marked for food insecurity and marginal
food insecurity than for very low food security. Second, that poverty is not synonymous with
9
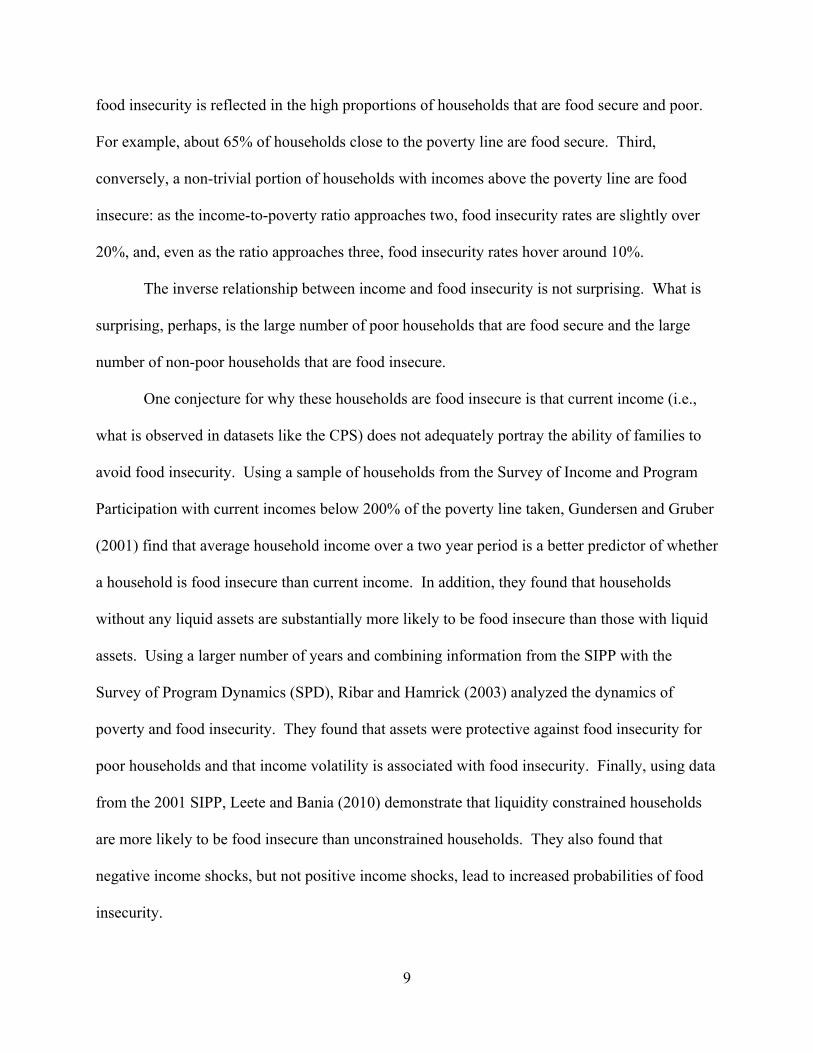
food insecurity is reflected in the high proportions of households that are food secure and poor.
For example, about 65% of households close to the poverty line are food secure. Third,
conversely, a non-trivial portion of households with incomes above the poverty line are food
insecure: as the income-to-poverty ratio approaches two, food insecurity rates are slightly over
20%, and, even as the ratio approaches three, food insecurity rates hover around 10%.
The inverse relationship between income and food insecurity is not surprising. What is
surprising, perhaps, is the large number of poor households that are food secure and the large
number of non-poor households that are food insecure.
One conjecture for why these households are food insecure is that current income (i.e.,
what is observed in datasets like the CPS) does not adequately portray the ability of families to
avoid food insecurity. Using a sample of households from the Survey of Income and Program
Participation with current incomes below 200% of the poverty line taken, Gundersen and Gruber
(2001) find that average household income over a two year period is a better predictor of whether
a household is food insecure than current income. In addition, they found that households
without any liquid assets are substantially more likely to be food insecure than those with liquid
assets. Using a larger number of years and combining information from the SIPP with the
Survey of Program Dynamics (SPD), Ribar and Hamrick (2003) analyzed the dynamics of
poverty and food insecurity. They found that assets were protective against food insecurity for
poor households and that income volatility is associated with food insecurity. Finally, using data
from the 2001 SIPP, Leete and Bania (2010) demonstrate that liquidity constrained households
are more likely to be food insecure than unconstrained households. They also found that
negative income shocks, but not positive income shocks, lead to increased probabilities of food
insecurity.
10
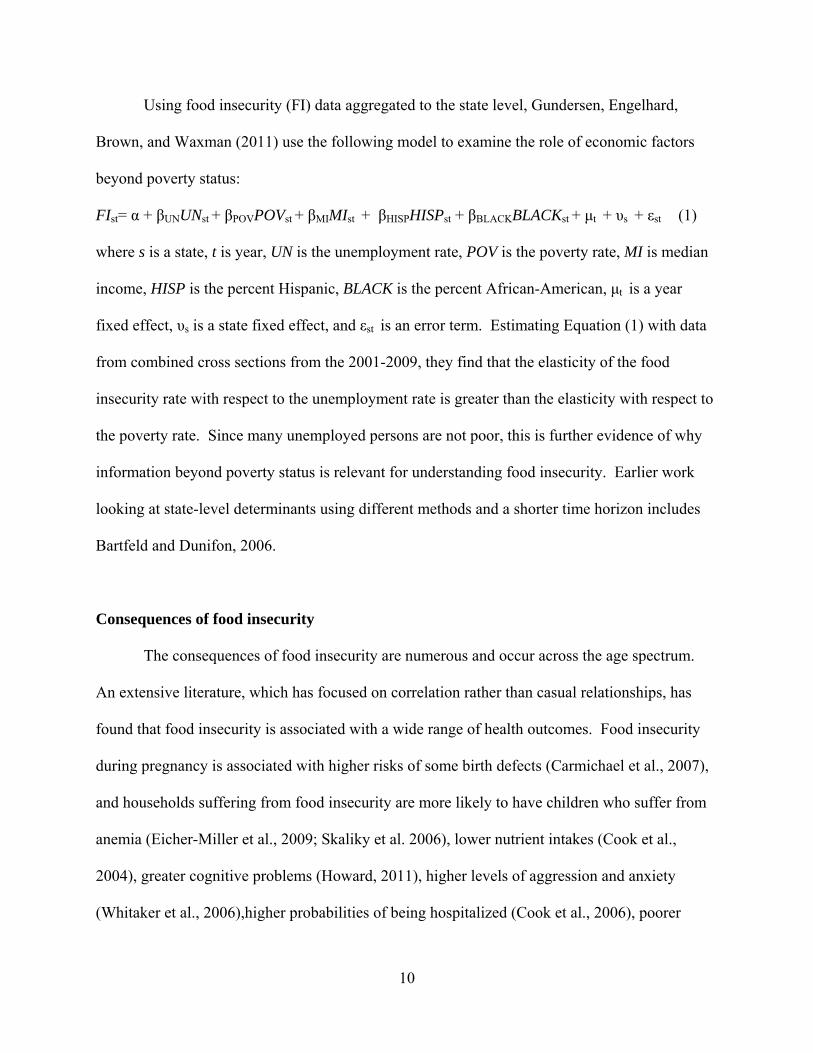
Using food insecurity (FI) data aggregated to the state level, Gundersen, Engelhard,
Brown, and Waxman (2011) use the following model to examine the role of economic factors
beyond poverty status:
FIst= α + βUNUNst + βPOVPOVst + βMIMIst + βHISPHISPst + βBLACKBLACKst + μt + υs + εst (1)
where s is a state, t is year, UN is the unemployment rate, POV is the poverty rate, MI is median
income, HISP is the percent Hispanic, BLACK is the percent African-American, μt is a year
fixed effect, υs is a state fixed effect, and εst is an error term. Estimating Equation (1) with data
from combined cross sections from the 2001-2009, they find that the elasticity of the food
insecurity rate with respect to the unemployment rate is greater than the elasticity with respect to
the poverty rate. Since many unemployed persons are not poor, this is further evidence of why
information beyond poverty status is relevant for understanding food insecurity. Earlier work
looking at state-level determinants using different methods and a shorter time horizon includes
Bartfeld and Dunifon, 2006.
Consequences of food insecurity
The consequences of food insecurity are numerous and occur across the age spectrum.
An extensive literature, which has focused on correlation rather than casual relationships, has
found that food insecurity is associated with a wide range of health outcomes. Food insecurity
during pregnancy is associated with higher risks of some birth defects (Carmichael et al., 2007),
and households suffering from food insecurity are more likely to have children who suffer from
anemia (Eicher-Miller et al., 2009; Skaliky et al. 2006), lower nutrient intakes (Cook et al.,
2004), greater cognitive problems (Howard, 2011), higher levels of aggression and anxiety
(Whitaker et al., 2006),higher probabilities of being hospitalized (Cook et al., 2006), poorer
11
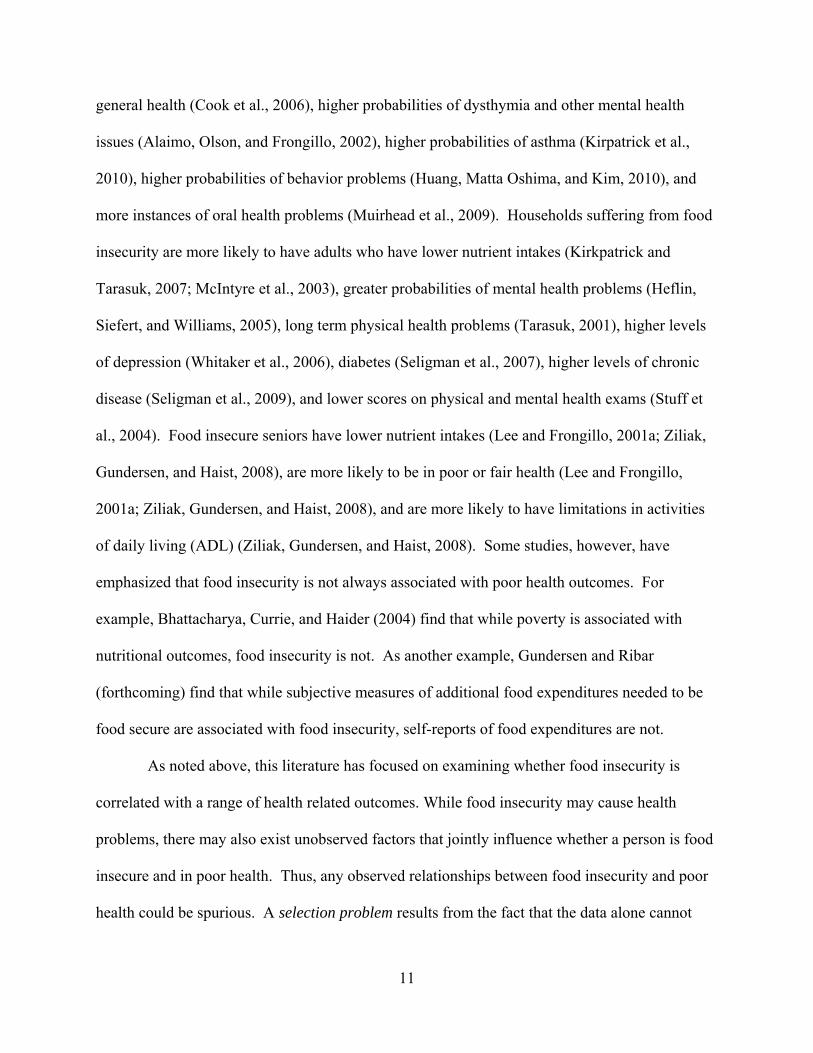
general health (Cook et al., 2006), higher probabilities of dysthymia and other mental health
issues (Alaimo, Olson, and Frongillo, 2002), higher probabilities of asthma (Kirpatrick et al.,
2010), higher probabilities of behavior problems (Huang, Matta Oshima, and Kim, 2010), and
more instances of oral health problems (Muirhead et al., 2009). Households suffering from food
insecurity are more likely to have adults who have lower nutrient intakes (Kirkpatrick and
Tarasuk, 2007; McIntyre et al., 2003), greater probabilities of mental health problems (Heflin,
Siefert, and Williams, 2005), long term physical health problems (Tarasuk, 2001), higher levels
of depression (Whitaker et al., 2006), diabetes (Seligman et al., 2007), higher levels of chronic
disease (Seligman et al., 2009), and lower scores on physical and mental health exams (Stuff et
al., 2004). Food insecure seniors have lower nutrient intakes (Lee and Frongillo, 2001a; Ziliak,
Gundersen, and Haist, 2008), are more likely to be in poor or fair health (Lee and Frongillo,
2001a; Ziliak, Gundersen, and Haist, 2008), and are more likely to have limitations in activities
of daily living (ADL) (Ziliak, Gundersen, and Haist, 2008). Some studies, however, have
emphasized that food insecurity is not always associated with poor health outcomes. For
example, Bhattacharya, Currie, and Haider (2004) find that while poverty is associated with
nutritional outcomes, food insecurity is not. As another example, Gundersen and Ribar
(forthcoming) find that while subjective measures of additional food expenditures needed to be
food secure are associated with food insecurity, self-reports of food expenditures are not.
As noted above, this literature has focused on examining whether food insecurity is
correlated with a range of health related outcomes. While food insecurity may cause health
problems, there may also exist unobserved factors that jointly influence whether a person is food
insecure and in poor health. Thus, any observed relationships between food insecurity and poor
health could be spurious. A selection problem results from the fact that the data alone cannot

12
reveal the health outcomes of a person who is food insecure if instead that person were to have
not been food insecure.
To formalize this identification problem, consider drawing inferences on the average
treatment effect:
ATE(1,0) = P[H(FI = 1)] − P[H(FI = 0)] (2)
where H(FI = 1) denotes a “bad health” outcome if a person were to be in a food insecure
household and H(FI = 0) denotes a “bad health” outcome if a person were to be in a food secure
household. Thus, the average treatment effect reveals how the probability of a bad health
outcome would differ if all persons were food insecure, P[H(FI = 1)], versus the probability if all
persons were food secure. Even if FI were accurately observed (i.e., there is construct validity
such that there were no conceptual or practical measurement issues), the outcome H(FI=1) is
counterfactual for all persons who were food secure. Similarly, the outcome H(FI=0) is
counterfactual for all persons who were food insecure. A statistical “selection” problem arises in
that households become food secure or food insecure based in part on factors unobserved to the
researcher. As a consequence, the mean health outcomes of the currently food insecure, should
they become food secure, may not reflect the mean health outcomes of the currently food secure.
To address this selection issue, Gundersen and Kreider (2009) estimate equation (2) for
children health outcomes through the use of three assumptions. The first is the Monotone
Treatment Response (MTR) assumption (Manski, 1997). In the present context, MTR requires
that a child’s health status would not decline by becoming food secure. This seems relatively
innocuous for most health outcomes in that most scenarios in which becoming food secure leads
to worse health outcomes do not seem plausible.6 The second is the Monotone Treatment
Selection (MTS) assumption (Manski and Pepper, 2000). This assumption has been used to
13
place restrictions on the selection mechanism through which children become food secure or
insecure. Under the MTS assumption, food insecure children under the status quo would tend to
remain less healthy than their food secure counterparts under the status quo under a policy that
made all households food secure or all households food insecure. This assumption is based on
well-established documentation that food insecure children are disadvantaged over other
dimensions (e.g., they have lower incomes), and these disadvantages are associated with worse
health outcomes (see, e.g., Currie, Shields, and Wheatley Price, 2007).
Kreider, Pepper, Gundersen, and Jolliffe (2011) impose a Monotone Instrumental
Variable (MIV) assumption introduced by Manski and Pepper (2000). In their context, children
residing in lower-income households on average are assumed to have no better health outcomes
than children residing in higher-income households. The MIV assumption is weaker than the
standard mean independence instrumental variable (IV) assumption in that the MIV assumption
does not imply any exclusion restriction. In particular, the mean health outcome is allowed to
vary (monotonically) with income though avenues distinct from the impact of income on food
security. The difficulty in finding credible standard instruments for food insecurity status that
satisfy mean independence makes the MIV assumption an appealing alternative.
Data from the 2001-2006 NHANES, when analyzed under the unrealistic assumption of
exogenous selection into food insecurity, indicate that children who are food insecure are 6.1
percentage points less likely to be in good, very good, or excellent health than those who are
food secure.7 When these three assumptions above are imposed, Gundersen and Kreider (2009)
find that food insecure children are between 1.4 percentage points and 3.5 percentage points less
likely to be in good or better health.

14
Alleviating food insecurity
The U.S. has a wide variety of food assistance programs designed to address numerous
health and nutrition outcomes. One outcome in particular is food insecurity. A great deal of
work by economists has examined the impact of SNAP on food insecurity. We review this work
after providing some background on SNAP. We then review some recent work that has
examined the impact of the second largest food assistance program, the National School Lunch
Program (NSLP).
Background on the Supplemental Nutrition Assistance Program
The Supplemental Nutrition Assistance Program (SNAP, formerly known as the Food
Stamp Program) is by far the largest US food assistance program. Participants receive benefits
for the purchase of food in authorized retail food outlets. Benefits are distributed via an
Electronic Benefit Transfer (EBT) card. Recipients can use these benefits at approved retail food
outlets. The level of benefits received by a household is determined by income level and family
size. SNAP, with a few exceptions, is available to all families and individuals who meet income
and, in some states, asset tests.
The program is large, both in terms of benefit size and in number of people served. In
2010, the average monthly benefit was $288/month for a family of four, with the maximum
benefit for a family of this size being $668. These benefits can represent a substantial
component of low-income households’ total income. In terms of number of people served, the
program reached about 40.3 million individuals in each month in 2010, with an annual benefit
distribution of about $68.3 billion. A recent study demonstrated that almost half of all American
15
children will have resided in a household that received food stamps by the time they reach 20
years of age (Rank and Hirschl, 2009).
To receive SNAP, households must meet a gross-income test, a net-income test, and in
about 20% of states, an asset test. In the majority of cases, the eligibility criteria are as follows.
First, a household’s gross income before taxes in the previous month cannot exceed 130% of the
poverty line. Second, net monthly income must be below the poverty line. Net income is
calculated by subtracting a standard deduction from a household’s gross income. In addition to
this standard deduction, households with labor earnings deduct 20 percent of those earnings
from their gross income. Deductions are also taken for child care and/or care for disabled
dependents, medical expenses, and excessive shelter expenses. Third, the federal guidelines
stipulate that assets must be less than $2,000. In many states, though, the gross income criterion
is higher than 130% of the poverty line (up to 200% in some cases) and even more states waive
the asset criteria.
The amount of SNAP benefits received depends on net income. Households with a net
income of zero receive the maximum benefit. As noted above, for a family of four in 2011, this
amounted to $668. As income increases, the benefit declines: for every additional dollar, the
amount of SNAP benefits is reduced by 30 cents (except income that comes in the form of
earnings, in which case the reduction is 24 cents).
Despite the potentially large benefit levels, a large fraction of households eligible for
SNAP do not participate. The most recently calculated food stamp participation data show that
about 67% of eligible people in the United States received food stamp benefits in 2008 (USDA,
2009). The decision to not participate is often ascribed to three main factors. First, there may be
stigma associated with receiving SNAP ranging from a person’s own distaste for receiving food

16
stamps to the fear of disapproval from others when redeeming food stamps to the possible
negative reaction of caseworkers (Ranney and Kushman, 1987; Moffitt, 1983). Recent
initiatives like fingerprinting can also increase the stigma associated with SNAP participation.
Second, transaction costs can diminish the attractiveness of SNAP participation. Examples of
such costs include travel time to a SNAP office and time spent in the office, the burden of
transporting children to the office or paying for childcare services, and the direct costs of
transportation. A household faces these costs on a repeated basis when it must recertify its
eligibility. Information costs – including overcoming language barriers and gaining
understanding about the validity of immigration consequences – are included under transaction
costs. Third, the benefit level can be quite small—for some families as low as $17 a month.
Effect of SNAP on Food Insecurity
As noted above, the central goal of SNAP is the reduction in food insecurity. Of concern,
then, is that rates of food insecurity among recipients are about double the rates among eligible
nonrecipients (Nord et al., 2010), and these higher rates remain even after controlling for
observed factors (e.g., Gundersen, Jolliffe, and Tiehen, 2009). This is a counterintuitive result,
both from a theoretical standpoint (it is difficult to see how shifting out the budget constraint can
lead to an increase in food insecurity), from an empirical standpoint (see Figure 3 above), and
from the perspective of what policymakers and program administrators expect the program to do.
Not surprisingly, economists have suggested that participation in SNAP is likely to be
endogenous, arguing that SNAP recipients are likely to differ from nonrecipients across
unobserved factors. In response, a series of papers have considered this selection effect. The
first paper on this topic was Gundersen and Oliveira (2001). Using data from the Survey of
17
Income and Program Participation (SIPP) and a simultaneous equation model, they found that
SNAP participants were no more likely to be food insecure than nonparticipants once they
control for selection into SNAP and selection into food insecurity. As instruments for SNAP
participation, they used imputed information on recipient’s perceptions of stigma associated with
SNAP receipt. Another identification approach exploits variation over time and across states in
the implementation of restrictions on the eligibility of immigrants for SNAP. Such restrictions
were put into place through the Personal Responsibility and Work Opportunity Reconciliation
Act (PRWORA) of 1996. This work (e.g., Van Hook and Balistreri, 2006) has generally found
that immigrants not facing restrictions on SNAP participation were less likely to be food insecure
than immigrants facing restrictions. Van Hook and Ballistreri (2006) therefore conclude that
SNAP leads to reductions in food insecurity for the general population as well. Other work has
also exploited variation in SNAP policy. A recent example is Nord and Prell (2011). They
showed that the temporary increase in SNAP benefits due to the passage of the American
Recovery and Reinvestment Act (ARRA) of 2009 led to reductions in food insecurity among
those in the SNAP eligible population but not among the SNAP ineligible population.8
This previous work addressed selection issues in the context of SNAP. Nonrandom
classification errors in SNAP participation can also confound identification of the effects of the
program. SNAP participation is systematically underreported in major surveys, with errors of
omission (i.e., responding that one doesn’t receive SNAP when one really does) being
substantially more likely than errors of commission (Bollinger and David, 1997; 2001). As a
result, a positive estimated sign of the effect of SNAP on food insecurity should be viewed as
valid only if the researcher is willing to place a great deal of confidence in the reporting of SNAP
participation within the dataset being used. As shown in Gundersen and Kreider (2008) even
18
when one imposes strong assumptions restricting the patterns of classification errors, SNAP
participation error rates much smaller than 12 percent (a lower bound on the extent of SNAP
misreporting derived from the literature) are sufficient to prevent one from being able to draw
firm conclusions about the relationship between SNAP participation and food insecurity.
Background on the National School Lunch Program
The National School Lunch Program (NSLP) is a federally-assisted meal program that
operates in over 101,000 public and nonprofit private schools and residential child care
institutions. It provides nutritionally balanced, low-cost, or free lunches to children each school
day. In 2010, over 31 million students participated in NSLP. Of these, over half received free
lunches and about a tenth received reduced price lunches. In addition to any commodities the
schools received, cash payments to schools for the NSLP in 2010 exceeded $10 billion.
Generally, public or nonprofit private schools and residential child care institutions may
participate in the NSLP. School districts and independent schools that choose to participate in the
lunch program receive cash subsidies and donated commodities from the USDA for each meal
they serve. In return, they must serve lunches that meet federal requirements, providing no more
than 30% of a student’s calories from fat, less than 10% from saturated fat, and at least one-third
of the Recommended Dietary Allowances of protein, vitamin A, vitamin C, iron, calcium, and
calories. School districts must offer free or reduced price lunches to eligible children. In
addition, school food authorities can also be reimbursed for snacks served to children through
age 18 years in after-school educational or enrichment programs.
Eligibility for the NSLP begins at the individual level. Any child at a participating school
may purchase a meal through the NSLP. Children who are home-schooled or no longer attend
19
school are not eligible. Among children in these schools, families with incomes at or below
130% of the poverty level are eligible for free meals. Children with household income between
130% and 185% of the poverty level are eligible for reduced-price meals, which are not allowed
to cost more than 40 cents.
Effect of NSLP on Food Insecurity
Only a couple of studies examine the impact of the NSLP on food insecurity. Nord and
Kantor (2006) provide indirect evidence of the importance of NSLP in alleviating food
insecurity. A central difference between the summer and the rest of the school year is that
children do not participate in school meal programs. Prior to 2001, the month in which the
CFSM was placed in the CPS varied from year to year. Using this variation, they establish that
food insecurity rates are higher for school-aged children during the summer months.
Gundersen, Kreider, and Pepper (forthcoming) directly estimate the effect of NSLP. Like
SNAP, food insecurity rates are substantially higher among participants than among
nonparticipants – 39.9% versus 26.3%.9 Also like SNAP, it seems implausible that providing
children an extra meal each day would lead to higher probabilities of food insecurity. Assessing
the true effect of NSLP is made difficult, however, due to two fundamental identification
problems. First, children receiving free or reduced-price meals are likely to differ from eligible
nonparticipants in ways that are not observed in the data. Second, the association between
participation in the NSLP and food insecurity may be at least partly an artifact of household
misreporting of participation in the program. Meyer, Mok, and Sullivan (2009), for example,
find evidence of aggregate underreporting rates of 45% in the CPS and 27% in the PSID.

20
The authors impose the MTS, MTR, and MIV assumptions to address the selection
problem. The MTS formalizes the notion that the unobserved factors positively associated with
participation in the NSLP are also positively associated with food insecurity, while MTR posits
that receiving NSLP cannot increase the probability of food insecurity.10 An Income MIV
assumption posits that children residing in higher income households have no higher
probabilities of food insecurity than children residing in lower income households. An Ineligible
Comparison Group MIV assumption posits that (a) income-ineligible children have no higher
probabilities of food insecurity than income-eligible children, (b) children attending schools
without a school lunch program (which tend to be private, well-off schools) have no higher
probabilities of food insecurity than children attending schools with a school lunch program, and
(c) children who have dropped out of school (and, hence, cannot participate in the NSLP) have at
least as high probabilities of food insecurity. The Ineligible Comparison Group MIV approach is
conceptually similar to the regression discontinuity approaches that have been used elsewhere in
evaluations of school meal programs (e.g., Schanzenbach, 2009; Bhattacharya, Currie, and
Haider, 2006; Gleason and Suitor, 2003), albeit not for analyses of the effect of these programs
on food insecurity.
To address the problem of misreporting of NSLP participation, the authors impose
restrictions on the extent of reporting error using information on the difference between the self-
reported participation rate and estimated true participation rate. This method, which was
developed in Kreider, Pepper, Gundersen, and Jolliffe (2009), uses auxiliary administrative data
on the size of the NSLP caseload to restrict the magnitudes and patterns of NSLP reporting
errors. The true participation rate is calculated by taking the ratio of the number of children
receiving NSLP as reported in administrative data to the number of eligible children in the
21
relevant age ranges in the NHANES. The latter is calculated by taking the ratio of the number of
children receiving NSLP as reported in the NHANES to the number of eligible children in the
relevant age ranges in the NHANES. Combining the classification error restrictions with the
MTS, MTR, and MIV monotonicity assumptions, the authors find that the NSLP alleviates food
insecurity. If the data are treated as perfectly accurate, the program is estimated to decrease the
prevalence of food insecurity between 2.3 and 9.0 percentage points. In the presence of
participation classification errors, the estimated impacts range from 3.2 to 15.8 percentage point
declines. Thus, after controlling for selection and measurement error problems, Gundersen,
Kreider, and Pepper (forthcoming) find persuasive evidence that the NSLP leads to substantial
reductions in food insecurity.
Conclusion
The extensive literature on food insecurity in the United States has given policymakers
and program administrators numerous insights into the causes and consequences of food
insecurity and some approaches that seem to be effective in alleviating food insecurity. Here we
emphasize four key insights that can be drawn from this literature. First, there is a small but
growing body of evidence that the Supplemental Nutrition Assistance Program reduces the
prevalence of food insecurity. This should be kept in mind as reconstructions of SNAP are being
proposed. In particular, some have proposed changes to the structure of SNAP with respect to
what types of food should be available for purchase. While these proposals have the goal of
enhancing nutrition among SNAP participants, the effectiveness of the program on the whole
could be compromised if more restricted food options discourage participation and lead to
subsequent increases in food insecurity. Since SNAP has an explicit goal of alleviating food

22
insecurity and is considered the leading program in the fight against hunger, proposals to modify
the program should take care to consider the possibility of unintended consequences.
Second, recent evidence suggests that the National School Lunch Program may also
reduce food insecurity even though it is not explicitly designed for that purpose. While the
program focuses on specific nutritional objectives, policymakers contemplating proposals to
modify the program should keep in mind its potential to alleviate food insecurity. As above for
the case of SNAP, proposals to modify the NSLP should take care to consider the possibility that
changes in the program could have the unintended effect of increasing the prevalence of food
insecurity by discouraging participation in the program. As always, policymakers should
carefully weigh all anticipated benefits and costs.
Third, the negative health outcomes associated with food insecurity have been well-
established. Alongside the direct benefits associated with reducing food insecurity (e.g., as a
society, we may wish to avoid having children go to bed hungry due to economic constraints),
potential reductions in medical expenditures should be incorporated into relevant benefit-cost
considerations of programs like SNAP and NSLP.
Fourth, millions of food insecure households in the U.S. have sufficiently high incomes
to render them ineligible for food assistance programs. Research findings regarding the role of
assets and income shocks can provide some guidance in what types of policies might most
effectively impact food insecurity among middle-income households.
While the existing literature has provided a solid foundation for policymakers and
program administrators, there are numerous avenues for future research. We concentrate on
several questions we believe to be especially well-suited to economic analyses:

23
How is food insecurity distributed within a household? As discussed above, food
insecurity measures are generally defined at the household level rather than for each individual in
the household.11 At least based on evidence derived from studies of intra-household allocation
developing countries, there are likely to be differences in the distribution of food insecurity
within households (see, e.g., Hadley, Lindstrom, Tessema, and Belachew, 2007; Kuku,
Gundersen, and Garasky, 2011). At a minimum, these differences are apparent in the aggregate
where food insecurity rates among children in a household are observed to be substantially lower
than food insecurity rates for households with children (see Figure 2). Some recent work has
utilized measures that include questions about food insecurity specifically for children (Framm,
Frongillo, Jones, et al., 2011; Connell, Lofton, Yadrick, and Rehner, 2005). Child-specific
responses can lead to new insights into how families distribute food security status or, at the very
least, how individuals within a household perceive this distribution.
How do food prices influence food insecurity? As discussed above, analyses of the
determinants of food insecurity have generally concentrated on factors defined at the individual
or household level. With the exception of analyses studying the role of social capital (e.g.,
Martin, Rogers, Cook, and Joseph, 2004) and the effects of broader macroeconomic conditions
discussed above, there appears to be a gap in the literature regarding the environment facing low-
income consumers. In particular, there appears to be no research on the effects of food prices.
In the development economics literature, there has been extensive research on the influence of
food prices on well-being (see, e.g., Ivanic and Martin, 2008). While the proportion of total
expenditures spent on food among low-income Americans is substantially lower, on average,
than in developing countries, food prices may still make a significant difference. There is an
enormous amount of variation in food prices across the United States. (For a description of this
24
variation at the county level, see the maps at http://feedingamerica.org/hunger-in-
america/hunger-studies/map-the-meal-gap.aspx .) A report by Feeding America (2011) shows
at least some correlation between food prices and food insecurity at a county level: 44 counties in
the U.S. are in the top 10 percent of food prices and food insecurity rates. In addition, research
by, e.g., Beatty (2010) and Broda, Leibtag, and Weinstein (2009) has found that food prices have
an influence on the well-being of low-income consumers in developed countries. Based on the
Feeding America report and the work done in other areas, future work may wish to more fully
consider the effects of food prices over time and across areas on food insecurity.
How does food access influence food insecurity? The ability to purchase sufficient
amounts of food to avoid food insecurity depends on the prices faced by consumers. Monetary
prices faced by consumers, though, do not take into consideration the transactions costs
consumers may incur in obtaining food. As summarized in Bitler and Haider (2010), there is
some evidence that so-called “food deserts” (i.e., geographic areas with more limited numbers of
food outlets) may influence the food consumption patterns of low-income households. The
extent to which they matter is an open question. It is perhaps worth exploring the impact of the
availability of food on food insecurity status, net of food prices and other factors. The effects of
food deserts may be especially significant for three groups that may face mobility restrictions
and/or live in remote areas: seniors, persons with disabilities, and American Indians living on
reservations.
What types of coping mechanisms do low-income food secure families utilize, and what
are the effects of these mechanisms? As seen in Figure 3, a large proportion of poor households
are able to avoid food insecurity and even avoid marginal food insecurity. Similarly, a large
proportion of those with incomes below 50% of the poverty line are able to avoid food

25
insecurity. The construction of the poverty line in the U.S. is such that the presumption is that
income poor households will have to forego at least some necessities. In other words, to be food
secure, they may be deprived over some other dimension of well-being. Two main issues could
be explored in this context. The first is with respect to what commodities food secure families
are giving up to be food secure. For example, seniors may be foregoing prescription drugs to
feed themselves and other members of the household. In such contexts, food security in
combination with poverty should signal to policymakers and program administrators that
assistance may be needed; in other words, food security does not indicate absence of need.12 The
second is with respect to the coping strategies used by food secure families. These coping
strategies can, in essence, lower the probability of being food insecure at any given income level.
There has been some qualitative work based on small scale datasets that illuminates how low-
income families maintain food security (see, e.g., Olsonet al., 2004; Swanson, Olson, Miller,
Lawrence, 2008). Conducting similar research using a broader sample with an economic lens
could provide further insights into the effectiveness of various coping mechanisms. A related
and important question is whether these coping mechanisms have unintended effects on health
and well-being. For examples, families concerned about the possible onset of food insecurity
might cope by purchasing storable, high-calorie foods that are potentially associated with
increased weight. As another example, a family might engage in illegal activities to avoid food
insecurity.
Besides SNAP and NSLP, what are the effects of social safety net programs on food
insecurity? As discussed above, recent evidence suggests that SNAP and NSLP lead to
reductions in food insecurity. Less understood is how other food assistance programs –
especially WIC and the School Breakfast Program (SBP) – affect food insecurity. While these
26
programs are significantly smaller than SNAP, their impacts could be comparable per recipient.
There has also not been much research on the effects of other social safety net programs such as
unemployment insurance and in-kind programs such as Medicaid and housing assistance.13
How do the experiences of food insecurity in other countries differ from the U.S.? To
date, the vast majority of studies on food insecurity in developed countries have concentrated on
the U.S. The only other country with multiple studies of which we are aware is Canada. (See, in
addition to other papers cited above, e.g., Kirkpatrick and Tarasuk, 2011; McIntyre, Connor, and
Warren, 2000.) Given differences across countries in demographics, food prices, geography,
assistance programs, etc., cross-country comparison across countries may yield new insights akin
to the new insights that have been drawn from cross-country comparisons of poverty (e.g.,
Rainwater and Smeeding, 2003). The possibility of engaging in these cross-country comparisons
is enabled by the increasing usage of either the full CFSM or questions taken from the CFSM on
nationally representative surveys in other countries.
How do health limitations affect food insecurity? In the main, the literature on the
effects of food insecurity on health outcomes has implicitly assumed that food insecurity has an
influence on health outcomes rather than the other way around. In some instances, this
assumption seems valid. For example, it is not obvious how nutrient intakes would affect food
insecurity. In other cases, this assumption may be untenable. For example, one would anticipate
that ADL limitations lead to food insecurity rather than the other way around. (There is some
research that considers reverse causation including Lee and Frongillo (2001b) and Casey,
Goolsby, Berkowitz, et al., (2004).) Causality might often run in both directions. For example,
the limited food intakes associated with food insecurity could lead to diabetes, while having
diabetes and its concordant medical costs might make someone more likely to be food insecure.

27
Research on the impact of health care limitations on food insecurity would be of interest,
especially when the causal direction is mixed, both in terms of improved estimates of the impact
of food insecurity and in terms of further delineating the causes of food insecurity.
What are the effects of private food assistance programs on food insecurity? Alongside
public food assistance programs like SNAP, there is a substantial private food assistance network
in the U.S. This network is overseen by Feeding America which is comprised of 202 food banks
(approximately 80% of all the food banks in the United States) and the tens of thousands
agencies they serve. These food banks receive food directly from major food companies,
grocery stores, restaurants, commodity exchanges, individual donors, and food purchased with
donations. Food is distributed through emergency food pantries that distribute non-prepared
foods and other grocery products, emergency soup kitchens that provide prepared meals and are
served on site, and emergency shelters that provide residential shelter on a short-term basis and
serve one or more meals per day. The Feeding America system served an estimated 37 million
people in 2009 (Mabli, Cohen, Potter, & Zhao, 2010). Given the size of this program, research
on the impact of these private food assistance programs on food insecurity would be of interest,
especially to donors to these programs. Such research could further consider how these
programs interact with public food assistance programs.
Research on food insecurity will play an important role for policymakers and program
administrators in the United States for many years. Food insecurity rates are likely to remain
high for some time, and the consequences of food insecurity will concurrently remain.
Moreover, substantial public and private sector resources are aimed at reducing the incidence of
food insecurity. Thus, there is a critical need for credible research into the causes and
consequences of food insecurity and the efficacy of different approaches for alleviating food
28
insecurity. As reviewed in this paper, we believe that this relatively new but growing literature
has begun to answer many key questions, and economists have played several important roles in
developing this literature. There is also much more to learn. The research we have reviewed in
this paper and the further questions we have posed demonstrate the many ways economists will
continue to inform our understanding of the food insecurity landscape and the myriad efforts to
address the problem and its consequences.

29
1 For more on the development of the CFSM see Hamilton, Cook, Thompson, et al., 1997, especially Chapter 2.
2 In some surveys, a six-item scale is used in lieu of the 18-item scale. When this scale is used, a household is said
to be food secure if one or zero questions are affirmed, low food secure if 2 to 4 questions are affirmed, and very
low food secure if 5 or 6 questions are affirmed.
3 These can be described as follows: (food insecurity rate), ∑
(food insecurity gap), and
∑ (squared food insecurity gap) where q is the number of food insecure households, n is the total number
of households, and di is the level of food insecurity for a household i.
4 The numbers are drawn from Tables 1A and 1B in Nord et al., 2010.
5 We have not seen any research demonstrating that these characteristics are negatively associated with food
insecurity. For example, we haven’t seen research that has found African-Americans, after controlling for other
factors, have statistically significantly lower probabilities of food insecurity.
6 There are cases, though, where this assumption is not as readily acceptable. As an example, persons who become
food secure may subsequently gain weight, and this has the potential to lead to problems with obesity. For a
discussion of this issue, see Gundersen and Kreider (2009).
7 This parental report of a child’s general health is based on a five level scale – poor, fair, good, very good,
excellent. It is a widely used measure, in part due to its close correlation with other measures of health (e.g., Case,
Lubotsky, and Paxson, 2002).
8 Other work looking at selection issues in the context of SNAP include, e.g., Jensen, 2002; Kreider, Pepper,
Gundersen, and Jolliffe, 2011; Nord and Golla, 2009; Yen, Andrews, Chen, and Eastwood, 2008.
9 This study uses data from the 2001 to 2004 NHANES. Over other dimensions of well-being, there are not
statistically significant differences between recipients and eligible nonrecipients. For example, obesity rates are
statistically significantly the same in the two categories.
10 Consistent with this intuition, Long (1991) finds that each additional dollar of benefits leads to about a 50 cent
increase in total food expenditures.
30
11 The exception is for one person households and for child-specific measures when there is one child in the
household.
12 Several studies have shown that difficulties over other dimensions of well-being are correlated with food
insecurity. See, for example, Cook et al., 2008; Gundersen, Weinreb, Wehler, and Hosmer, 2003; Sullivan, Clark,
Palline, and C. Camargo, 2010. These analyses are concerned with the determinants of food insecurity. The
proposed topic of interest here is how the choices of food secure households along a similar budget constraint differ
from food insecure households.
13 DePolt, Moffitt, and Ribar (2009) is an example of a study looking at the impact of TANF, a cash assistance
program. They find that while SNAP leads to reductions in food insecurity, TANF does not have an impact.

31
Table 1: Food Insecurity Questions in the Core Food Security Module
1. “We worried whether our food would run out before we got money to buy more.” Was that often, sometimes, or never true for you in the last 12 months?
2. “The food that we bought just didn’t last and we didn’t have money to get more.” Was that often, sometimes, or never true for you in the last 12 months?
3. “We couldn’t afford to eat balanced meals.” Was that often, sometimes, or never true for you in the last 12 months?
4. “We relied on only a few kinds of low-cost food to feed our children because we were running out of money to buy food.” Was that often, sometimes, or never true for you in the last 12 months?
5. In the last 12 months, did you or other adults in the household ever cut the size of your meals or skip meals because there wasn’t enough money for food? (Yes/No)
6. “We couldn’t feed our children a balanced meal, because we couldn’t afford that.” Was that often, sometimes, or never true for you in the last 12 months?
7. In the last 12 months, did you ever eat less than you felt you should because there wasn’t enough money for food? (Yes/No)
8. (If yes to Question 5) How often did this happen—almost every month, some months but not every month, or in only 1 or 2 months?
9. “The children were not eating enough because we just couldn’t afford enough food.” Was that often, sometimes, or never true for you in the last 12 months?
10. In the last 12 months, were you ever hungry, but didn’t eat, because you couldn’t afford enough food? (Yes/No)
11. In the last 12 months, did you lose weight because you didn’t have enough money for food? (Yes/No)12. In the last 12 months, did you ever cut the size of any of the children’s meals because there wasn’t enough
money for food? (Yes/No) 13. In the last 12 months did you or other adults in your household ever not eat for a whole day because there
wasn’t enough money for food? (Yes/No)14. In the last 12 months, were the children ever hungry but you just couldn’t afford more food? (Yes/No)15. (If yes to Question 13) How often did this happen—almost every month, some months but not every
month, or in only 1 or 2 months? 16. In the last 12 months, did any of the children ever skip a meal because there wasn’t enough money for food?
(Yes/No) 17. (If yes to Question 16) How often did this happen—almost every month, some months but not every
month, or in only 1 or 2 months? 18. In the last 12 months did any of the children ever not eat for a whole day because there wasn’t enough
money for food? (Yes/No) Note: Responses in bold indicate an affirmative response. This table is taken from Gundersen and Kreider, 2008.

32
03
69
1215
18P
erce
nt
2001 2003 2005 2007 2009Year
Food Insecurity Very Low Food Security
Note: Figure is based on data from Nord et al., 2010, Table 1A
Figure 1: Food insecurity in the United States, 2001-2009

33
03
69
1215
1821
24P
erce
nt
2001 2003 2005 2007 2009Year
FI - Household FI - Children
VLFS - Children
Note: Figure is based on data from Nord et al., 2010, Table 1B
Figure 2: Food insecurity among Children in the United States, 2001-2009

34
0.2
.4.6
0 .5 1 1.5 2 2.5 3 3.5 4Income Poverty Ratio
Food Insecurity Very Low Food SecurityMarginal Food Insecurity
Note: Author's calculations based on data from the December Supplement of the 2009Current Population Survey
Figure 3: Relationship between food insecurity and income, 2009
35
References
Alaimo, Katherine, Christine Olson, and Edward Frongillo. 2002. Family Food Insufficiency,
but not Low Family Income, is Positively Associated with Dysthymia and Suicide
Symptoms in Adolescents. Journal of Nutrition 132: 719-725.
Bartfeld, Judi and Rachel Dunifon. 2006. State-Level Predictors of Food Insecurity among
Households with Children. Journal of Policy Analysis and Management 25: 921–942.
Beatty, Timothy. 2010. Do the Poor Pay More for Food? Evidence from the United Kingdom.
American Journal of Agricultural Economics 92: 608-621.
Bhattacharya, Jayanta, Janet Currie, and Steven Haider. 2004. Poverty, Food Insecurity, and
Nutritional Outcomes in Children and Adults. Journal of Health Economics 23: 839-862.
-----. 2006. Breakfast of Champions? The School Breakfast Program and the Nutrition of
Children and Families. Journal of Human Resources 41: 445-466.
Bitler, Marianne and Steven Haider. 2010. An Economic View of Food Deserts in the United
States. Journal of Policy Analysis and Management 30(1): 153-176.
Bollinger, Christopher, and Martin David. 1997. Modeling Discrete Choice with Response Error:
Food Stamp Participation. Journal of the American Statistical Association 92(439):
827-835.
-----. 2001. Estimation with Response Error and Non-response: Food Stamp Participation in the
SIPP. Journal of Business and Economic Statistics 19: 129-141.
Broda, Christian, Ephraim Leibtag, and David Weinstein. 2009. The Role of Prices in
Measuring the Poor’s Living Standards. Journal of Economic Perspectives 23(2): 77-97.
Carmichael, Suzan, Wei Yang, Amy Herring, Barbara Abrams, and Gary Shaw. 2007. Maternal
Food Insecurity is Associated with Increased Risk of Certain Birth Defects. Journal of
Nutrition 137: 2087-2092.
36
Case, Anne, Darren Lubotsky, Christine Paxson. 2002. Economic Status and Health in
Childhood: The Origins of the Gradient. American Economic Review 92(5): 1308–1334.
Casey, Patrick, Susan Goolsby, Carol Berkowitz, Deborah Frank, John Cook, Diana Cutts,
Maureen Black, Nieves Zaldivar, Suzette Lvenson, Tim Heeren, and Alan Meyers. 2004.
Maternal Depression, Changing Public Assistance, Food Security, and Child Health
Status. Pediatrics 113(2): 298-304.
Connell, Carol, Kristi Lofton, Kathy Yadrick, and Timothy Rehner. 2005. Children’s
Experiences of Food Insecurity can Assist in Understanding Its Effect on their Well-
Being. Journal of Nutrition 135: 1683–1690.
Cook, John, Deborah Frank, Patrick Casey, Ruth Rose-Jacobs, Maureen Black, Mariana Chilton,
Stephanie Ettinger de Cuba, Danielle Appugliese, Sharon Coleman, Tim Heeren, and
Carol Berkowitz. 2008. A Brief Indicator of Household Food Security: Associations
with Food Security, Child Health, and Child Development in U.S. Infants and Toddlers.
Pediatrics, 122(4): e867-e875.
Cook John, Deborah Frank, Suzette Levenson, Nicole Neault, Tim Heeren, Maureen Black,
Carol Berkowitz, Patrick Casey, Alan Meyers, Diana Cutts, and Mariana Chilton. 2006.
Child Food Insecurity Increases Risks Posed by Household Food Insecurity to Young
Children’s Health. Journal of Nutrition 136: 1073-1076.
Cook, John, Deborah Frank, Carol Berkowitz, Maureen Black, Patrick Casey, Diana Cutts, Alan
Meyers, Nieves Zaldivar, Anne Skalicky, Suzette Lenenson, Tim Heeren, and Mark
Nord. 2004. Food Insecurity is Associated with Adverse Health Outcomes among Human
Infants and Toddlers. Journal of Nutrition 134: 1348-1432.
37
Cook, John, Deborah Frank, Patrick Casey, Ruth Rose-Jacobs, Maureen Black, Mariana Chilton,
Stephanie Ettinger de Cuba, Danielle Appugliese, Sharon Coleman, Timothy Heeren,
Carol Berkowitz, and Diana Cutts. 2008. A Brief Indicator of Household Energy
Security: Associates with Food Security, Child Health, and Child Development in U.S.
Infants and Toddlers. Pediatrics 122: e867-e875.
Currie, Alison, Michael Shields, and Stephen Wheatley Price. 2007. The Child Health/Family
Income Gradient: Evidence from England. Journal of Health Economics 26: 213–232.
DePolt, Richard, Robert Moffitt, and David Ribar. 2009. Food Stamps, Temporary Assistance
for Needy Families and Food Hardships in Three American Cities. Pacific Economic
Review 14(4): 445-473.
Dutta, Indranil and Craig Gundersen. 2007. Measures of Food Insecurity at the Household
Level. In Food Security Indicators, Measurement, and the Impact of Trade Openness:
Series: WIDER Studies in Development Economics, ed. Basudeb Guha-Khasnobis, Shabd
S. Acharya, Benjamin Davis, 42-61. Oxford: Oxford University Press.
Eicher-Miller, Heather, April Mason, Connie Weaver, George McCabe, and Carol Boushey.
2009. Food Insecurity is Associated with Iron Deficiency Anemia in U.S. Adolescents.
American Journal of Clinical Nutrition 90: 1358-1371.
Feeding America. Map the Meal Gap 2011, Preliminary Findings: A Report on County Level
Food Insecurity and Food Cost in the United States in 2009. Feeding America. 2011.
Fox, John. 2000. Nonparametric Simple Regression: Smoothing Scatterplots. Sage University
Papers Series on Quantitative Applications in the Social Sciences, 07-130, Thousand
Oaks, CA: Sage.

38
Framm, Maryah, Edward Frongillo, Sonya Jones, Roger Williams, Michael Burke, Kendra
DeLoach, and Christine Blake. Children are Aware of Food Insecurity and Take
Responsibility for Managing Food Resources. Journal of Nutrition 141: 1114-1119.
Gleason, Phillip and Carol Suitor. 2003. Eating at School: How the National School Lunch
Program Affects Children’s Diets. American Journal of Agricultural Economics 85(4):
1047-1061.
Gundersen, Craig. 2008. Measuring the Extent, Depth, and Severity of Food Insecurity: An
Application to American Indians in the United States. Journal of Population Economics
21(1): 191-215.
Gundersen, Craig and Joseph Gruber. 2001. The Dynamic Determinants of Food Insufficiency.
In Second Food Security Measurement and Research Conference, Volume II: Papers, ed.
Margaret Andrews and Mark Prell, 92-110. USDA, ERS Food Assistance and Nutrition
Research Report 11-2.
Gundersen, Craig, and Brent Kreider. 2008. Food Stamps and Food Insecurity: What Can be
Learned in the Presence of Nonclassical Measurement Error? Journal of Human
Resources 43(2): 352-382.
-----. 2009. Bounding the Effects of Food Insecurity on Children's Health Outcomes. Journal of
Health Economics 28: 971–983.
Gundersen, Craig, and Victor Oliveira. 2001. The Food Stamp Program and food insufficiency.
American Journal of Agricultural Economics 84(3): 875-887.
Gundersen, Craig and David Ribar. Forthcoming. Food Insecurity and Insufficiency at Low
Levels of Food Expenditures. Review of Income and Wealth.
39
Gundersen, Craig, Dean Jolliffe, and Laura Tiehen. 2009. The Challenge of Program Evaluation:
When Increasing Program Participation Decreases the Relative Well-Being of
Participants. Food Policy 34: 367– 376.
Gundersen, Craig, Brent Kreider, and John Pepper. Forthcoming. The Impact of the National
School Lunch Program on Child Health: A Nonparametric Bounds Analysis. Journal of
Econometrics.
Gundersen, Craig, Julia Brown, Emily Engelhard, and Elaine Waxman. 2011. Map the Meal
Gap: Technical Brief. Feeding America.
Gundersen, Craig, Linda Weinreb, Cheryl Wehler, and David Hosmer. 2003. Homelessness and
Food Insecurity. Journal of Housing Economics 12(3): 250-272.
Hadley, Craig, David Lindstrom, Fasil Tessema, and Tefara Belachew. 2008. Gender Bias in
the Food Insecurity Experience of Ethiopian Adolescents. Social Science and Medicine
66: 427–438.
Hamilton, William, John Cook, William Thompson, Lawrence Burn, Edward Frongillo,
Christine Olson, et al. 1997. Household Food Security in the United States in 1995:
Technical Report of the Food Security Measurement Project. USDA, Food and
Consumer Service, Office of Analysis and Evaluation.
Heflin, Colleen, Kristine Siefert, and David Williams. 2005. Food Insufficiency and Women’s
Mental Health: Findings from a 3-Year Panel of Welfare Recipients. Social Science &
Medicine 61: 1971-1982.
Howard, Larry. 2011. Does Food Insecurity at Home Affect Non-Cognitive Performance at
School? A Longitudinal Analysis of Elementary Student Classroom Behavior. Economics
of Education Review 30: 157-176.
40
Huang, Jin, Karen Matta Oshima, and Youngmi Kim. 2010. Does Food Insecurity Affect
Parental Characteristics and Child Behavior? Testing Mediation Effects. Social Service
Review 84: 381-401.
Ivanic, Maros and Will Martin. 2008. Implications of Higher Global Food Prices for Poverty in
Low-Income Countries. Agricultural Economics 39(s1): 405–416.
Jensen, Helen. 2002. Food Insecurity and the Food Stamp Program American Journal of
Agricultural Economics 84(5).
Kirkpatrick, Sharon and Valerie Tarasuk. 2007. Food Insecurity is Associated with Nutrient
Intakes among Canadian Adults and Adolescents. Journal of Nutrition 138: 604-612.
-----. 2011. Housing Circumstances are Associated with Household Food Access among Low-
Income Urban Families. Journal of Urban Health 88(2): 284-296.
Kirkpatrick, Sharon, Lynn McIntyre, and Melissa Potestio. 2010. Child Hunger and Long-term
Adverse Consequences for Health. Archives of Pediatrics and Adolescent Medicine 164
(8): 754-762.
Kreider, Brent, John Pepper, Craig Gundersen, and Dean Jolliffe. 2011. Identifying the Effects
of Food Stamps on Child Health Outcomes When Participation is Endogenous and
Misreported. Working Paper.
Kuku, Oluyemisi, Craig Gundersen, and Steven Garasky. 2011. Differences in Food Insecurity
between Adults and Children in Zimbabwe. Food Policy 36: 311-317.
Lee Jung Sun and Edward Frongillo. 2001a. Nutritional and Health Consequences are Associated
with Food Insecurity among Elderly Persons. Journal of Nutrition 131: 1503-1509.

41
Lee Jung Sun and Edward Frongillo. 2001b. Factors Associated with Food Insecurity Among
U.S. Elderly Persons: Importance of Functional Impairments. Journal of Gerontology
56B(2): S94-S99.
Leete, Laura and Neil Bania. 2010. The Effect of Income Shocks on Food Insufficiency. Review
of the Economics of the Household 8: 505-526.
Long, Sharon. 1991. Do the School Nutrition Programs Supplement Household Food
Expenditures? Journal of Human Resources 26(4): 654-678.
Mabli, James, Rhoda Cohen, Frank Potter, and Zhanyun Zhao. 2010. Hunger in America 2010:
National Report Prepared for Feeding America. Princeton, NJ: Mathematica Policy
Research Institute.
Manski, Charles. 1997. Monotone Treatment Response. Econometrica, 65(6): 1311-1334.
Manski, Charles and John Pepper. 2000. Monotone Instrumental Variables: With an
Application to the Returns to Schooling. Econometrica, 68(4): 997-1010.
Martin, Katie, Beatrice Rogers, John Cook, and Hugh Joseph. 2004. Social Capital is Associated
with Decreased Risk of Hunger. Social Science and Medicine 58: 2645-2654.
McIntyre, Lynn, Sarah Connor, and James Warren. 2000. Child Hunger in Canada: Results of
the 1994 National Longitudinal Survey of Children and Youth. Canadian Medical
Association Journal 163: 961-965.
McIntyre, Lynn, Theresa Glanville, Kim Raine, Jutta Dayle, Bonnie Anderson, and Noreen
Battaglia. 2003. Do low-income lone mothers compromise their nutrition to feed their
children? Canadian Medical Association Journal 198: 686–691.
Meyer, Bruce, Wallace Mok, and James Sullivan. 2009. The Under-Reporting of Transfers in
Household Surveys: Its Nature and Consequences. Working Paper.
42
Moffitt, Robert. 1983. An Economic Model of Welfare Stigma. American Economic Review, 73:
1023-1035.
Muirhead, Vanessa, Carlos Quiñonez, Rafael Figueiredo, and David Locker. 2009. Oral Health
Disparities and Food Insecurity in Working Poor Canadians. Community Dentistry and
Oral Epidemiology 37: 294-304.
Nord, Mark. 2009. Food Insecurity in Households with Children: Prevalence, Severity, and
Household Characteristics. USDA, Economic Research Service, Economic Information
Bulletin No. 56.
Nord, Mark, and Anne Marie Golla. 2009. Does SNAP Decrease Food Insecurity? Untangling
the Self-Selection Effect. USDA, Economic Research Service, Economic Research Report
No. 85.
Nord, Mark, and Heather Hopwood. 2007. Recent Advances Provide Improved Tools for
Measuring Children's Food Security. Journal of Nutrition 137: 533-536.
Nord, Mark and Linda Kantor. 2006. Seasonal Variation in Food Insecurity is Associated with
Heating and Cooling Costs among Low-Income Elderly Americans. Journal of Nutrition
136: 2939-2944.
Nord, Mark and Mark Prell. 2011. Food Security Improved Following the 2009 ARRA Increase
in SNAP Benefits. USDA, Economic Research Service, Economic Research Report No.
116.
Nord, Mark, Alisha Coleman-Jensen, Margaret Andrews, and Steven Carlson, 2010. Household
Food Security in the United States, 2009. USDA, Economic Research Service, Economic
Research Report No. 108.
43
Olson, Christine, Kendra Anderson, Elizabeth Kiss, Frances Lawrence, and Sharon Seiling.
2004. Factors Contributing Against and Contributing to Food Insecurity among Rural
Families. Family Economics and Nutrition Review 16(1): 12-20.
Rainwater, Lee and Timothy Smeeding. 2003. Poor Kids in a Rich Country: America’s Children
in Comparative Perspective. New York, New York: Russell Sage Foundation.
Rank, Mark and Thomas Hirschl. 2009. Estimating the Risk of Food Stamp Use and
Impoverishment During Childhood. Archives of Pediatrics & Adolescent Medicine 163:
994-999.
Ranney, Christine, and John Kushman. 1987. Cash Equivalence, Welfare Stigma, and Food
Stamps. Southern Economic Journal 53(4): 1011–1027.
Ribar, David and Karen Hamrick. 2003. Dynamics of Poverty and Food Sufficiency. USDA,
Economic Research Service, Food Assistance and Nutrition Research Report No. 33.
Schanzenbach, Diane. 2009. Does the Federal School Lunch Program Contribute to Childhood
Obesity? Journal of Human Resources 44(3): 684-709.
Seligman, Hilary, Barbara Laraia, and Margot Kushel. 2009. Food Insecurity Is Associated with
Chronic Disease among Low-Income NHANES Participants. Journal of Nutrition 140:
304-310.
Seligman, Hilary, Andrew Bindman, Eric Vittinghoff, Alka Kanaya, and Margot Kushel. 2007.
Food Insecurity is Associated with Diabetes Mellitus: Results from the National Health
Examination and Nutritional Examination Survey 1999-2002. Journal of General
Internal Medicine 22: 1018-1023.
Skalicky, Anne, Alan Meyers, William Adams, Zhaoyan Yang, John Cook, and Deborah Frank.
2006. Child Food Insecurity and Iron Deficiency Anemia in Low-Income Infants and
Toddlers in the United States. Maternal and Child Health Journal 10(2): 177–185.
44
Stuff, Janice, Patrick Casey, Kitty Szeto, Jeffrey Gossett, James Robbins, Pippa Simpson, Carol
Connell, and Margaret Bogle. 2004. Household Food Insecurity Is Associated with Adult
Health Status. Journal of Nutrition 134: 2330-2335.
Sullivan, Ashley, Sunday Clark, Daniel Palline, and Carlos Camargo. 2010. Food Security,
Health, and Medication Expenditures of Emergency Department Patients. Public Health
in Emergency Medicine 38(4): 524-528.
Swanson, Josephine, Christine Olson, Emily Miller, and Frances Lawrence. 2008. Rural
Mothers’ Use of Formal Programs and Informal Supports to Meet Family Food Needs: A
Mixed Methods Study. Journal of Family and Economic Issues 29: 674-690.
Tarasuk, Valerie. 2001. Household Food Insecurity with Hunger Is Associated with Woman’s
Food Intakes, Health and Household Circumstances. Journal of Nutrition 131: 2670-
2676.
U.S. Department of Agriculture. 1999. Annual Historical Review: Fiscal year 1997.
US Department of Agriculture. 2009. Current Perspectives on SNAP Participation, 2009.
Van Hook, Jennifer, and Kelly Stamper Balistreri. 2006. Ineligible Parents, Eligible Children:
Food Stamps Receipt, Allotments and Food Insecurity among Children of Immigrants.
Social Science Research 35(1): 228-251.
Whitaker, Robert, Shannon Phillips, and Sean Orzol. 2006. Food Insecurity and the Risks of
Depression and Anxiety in Mothers and Behavior Problems in their Preschool-Aged
Children. Pediatrics 118(3): e859-e868.
Yen, Steven, Margaret Andrews, Zhuo Chen, and David Eastwood. 2008. Food Stamp Program
Participation and Food Insecurity: An Instrumental Variables Approach. American
Journal of Agricultural Economics 90:117-132.
Ziliak, James, Craig Gundersen, and Margaret Haist. 2008. The Causes, Consequences, and
Future of Senior Hunger in America. Special Report by the University of Kentucky

45
Center for Poverty Research for the Meals on Wheels Association of America
Foundation.