Embed Size (px)
Citation preview
1
SYNERGY OF TECTONIC GEOMORPHOLOGY, APPLIED GEOPHYSICS AND REMOTE SENSING 1
TECHNIQUES REVEALS NEW DATA FOR ACTIVE EXTENSIONAL TECTONISM IN NW PELOPONNESE 2
(GREECE) 3
4
AUTHORS 5
Fountoulis Ioannis†, Vassilakis Emmanuel1*, Mavroulis Spyridon2, Alexopoulos John3, Dilalos 6
Spyridon3, Erkeki Athanasia4 7
8
1* National and Kapodistrian University of Athens, Faculty of Geology and Geoenvironment, 9
Department of Geography & Climatology, Panepistimiopolis Zografou, 15784 (corresponding author) 10
2 National and Kapodistrian University of Athens, Faculty of Geology and Geoenvironment, 11
Department of Dynamic Tectonic Applied Geology, Panepistimiopolis Zografou, 15784 12
3 National and Kapodistrian University of Athens, Faculty of Geology and Geoenvironment, 13
Department of Geophysics‐Geothermy, Panepistimiopolis Zografou, 15784 14
4 National and Kapodistrian University of Athens, Faculty of Geology and Geoenvironment, 15
Laboratory of Natural Hazards’ Prevention & Management, Panepistimiopolis Zografou, 15784 16
17
ABSTRACT 18
In tectonically active areas like NW Peloponnese (W. Greece) the morphogenetic processes are 19
strongly influenced by the activity of faults, which in many cases cannot be easily traced. In this 20
paper a multidisciplinary analysis (morphometric indices, neotectonic mapping, geophysical surveys 21
and remote sensing techniques) is applied aiming to map the unknown (until recently) E‐W trending 22
Pineios River normal fault zone with high accuracy and understand its implications to the evolution of 23
the very significant ancient territory of Elis, during Holocene. Its activity seem to reflect on the river 24
flow path frequent changes as well as the nearby shoreline displacements, since we argue that this is 25
the main reason for the migration of Pineios river mouth for several times during the historical times. 26

2
The quantification of deformation caused by the fault activity was studied through the application of 27
proposed morphotectonic indices such as drainage network asymmetry, sinuosity, as well as 28
mountain front sinuosity yielding that this is a definitely active structure. High slip rates were 29
calculated reaching the value of 0.48 mm/yr for the last 209 ky (based on already published dating) 30
whilst this was also verified by applied geophysical methodologies. The fault surface discontinuity 31
was identified in depth by using vertical electrical resistivity measurements, since the deposited 32
layers of different resistivity behavior were found clearly interrupted. The layer displacement 33
increases towards west, reaching the value of 110 meters. The most spectacular landform alteration 34
due to this surface deformation is the migration of the river estuary from north to south and vice 35
versa, at completely different open sea areas, during Upper Quaternary and mostly in Holocene. The 36
sediment transportation path has been altered several times after these significant changes and the 37
most recent seem to have happened almost 2,000 years ago. The river estuary finally migrated to its 38
contemporary location at the southern coast ‐settled on the hanging wall‐ inducing retrograding of 39
the northern coast ‐settled on the foot wall‐ with rates reaching the order of 0.52 m/yr, as this was 40
induced by the interpretation of historical and recently acquired remote sensing data. 41
42
KEYWORDS 43
morphotectonic indices, fault slip rate, photogrammetry, digital shoreline analysis, vertical electrical 44
sounding 45
46
47
1 INTRODUCTION 48
NW Peloponnese is located at the external part of the Hellenic Orogenic Arc, just a few tens of 49
kilometers internally from the Hellenic Trench and has been repeatedly suffered damages by large 50
seismic events and earthquake related geo‐environmental phenomena until very recently (June 8th 51
2008, Mw=6.4) (Lekkas et al., 2008; Konstantinou et al., 2009; Feng et al., 2010; Koukouvelas et al., 52

3
2010; Mavroulis et al., 2010; Margaris et al., 2010; Papadopoulos et al., 2010; Mavroulis et al., 2013). 53
The recorded seismic activity at this region is continuous during the entire historical period 54
(Papazachos and Papazachou, 1997) and thus it is important to understand the slip behavior of faults 55
that have already caused or may cause earthquakes in the near future. Pineios fault zone is a tectonic 56
structure that has never been mapped till very recently, as it has never been assigned to any 57
historical earthquake (Mavroulis, 2009). It is located at NW Peloponnese and has drastically affected 58
the Lower Pineios River plain, along which Ancient Elis was developed during the Hellenistic and 59
Roman periods (Kraft et al., 2005). 60
Today, the ruins of Ancient Elis are lying downstream of the modern Pineios artificial dam and its 61
abandonment seems to have been caused by several geodynamic processes, which might be related 62
to the active tectonism of the wider region (Guidoboni et al., 1994). We argue in this paper that the 63
fault activity caused the river estuary relocation and consequently secondary landform processing 64
phenomena have been developed throughout the Pineios downstream broader area during Upper 65
Quaternary (Fountoulis et al., 2011; 2013). The combination of methodologies described in this paper 66
includes tectonic geomorphology analysis, applied geophysics measurements and remote sensing 67
techniques and aims to (a) assess the tectonic activity of Pineios fault zone, (b) provide quantitative 68
information for the degree of the fault activity, (c) clarify the stratigraphic sequence of the layered 69
geological formations underlying the study area, (d) accurately map the fault zone in depth and 70
estimate its displacement, (e) quantify the influence of the active faulting to the coastal 71
environment. 72
73
2 GEOLOGICAL SETTING 74
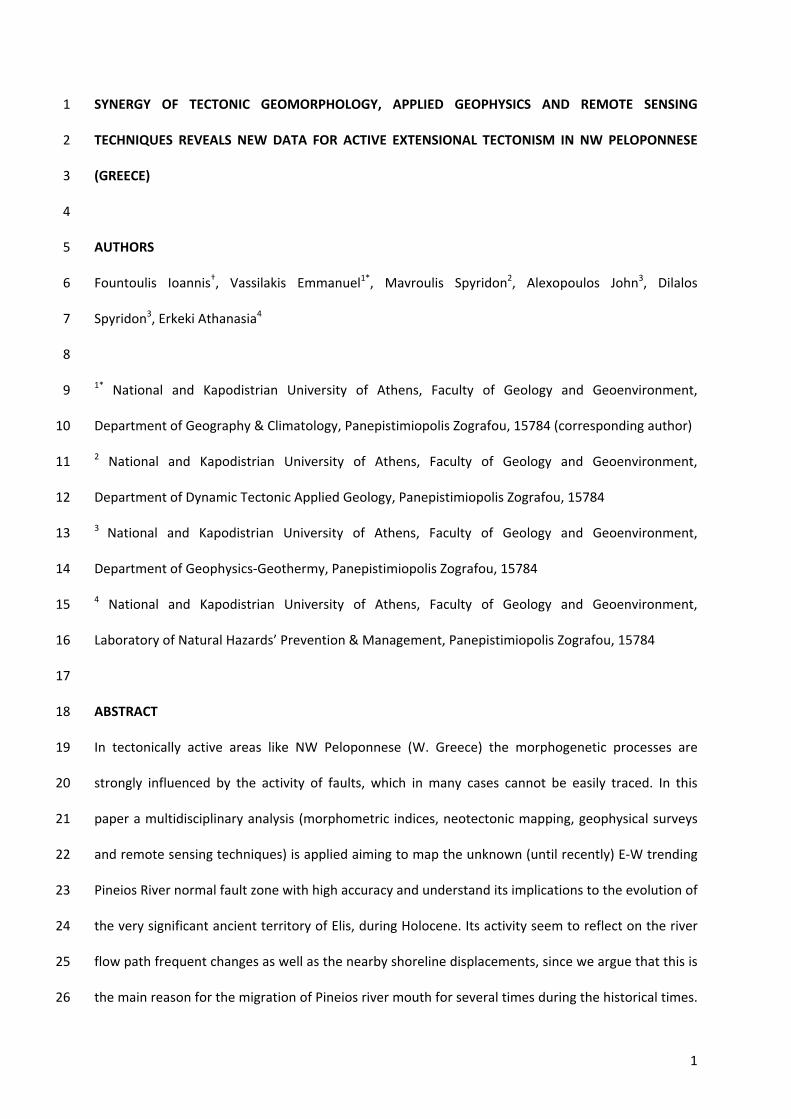
The westernmost part of Peloponnese that is described in this paper is an area with generally low 75
relief (Fig.1) and mostly covered by recently deposited sediments (Kamberis et al., 1993). The post‐76
alpine sequences that have been observed throughout the Pyrgos‐Olympia basin are of Pliocene and 77
Quaternary age and lie unconformably on the alpine basement. Their geographical distribution and 78
4
variety of facies (marine, lagoonal, lacustrine and terrestrial) clearly reflect vertical fault block 79
movements during the neotectonic period and ongoing active tectonism (Lekkas et al., 1992). 80
According to already published geological mapping data (Kamberis et al., 1993) and paleontological 81
findings and analyses (Athanassiou, 2000), as well as 230Th/238U dating of corals found in the marine 82
terraces of NW Peloponnese (Stamatopulos et al., 1988), a typical stratigraphic section for the post‐83
alpine succession may be constructed representing the paleo‐environment changes after Pliocene. 84
More specifically the sediment sequence consists of: (a) lacustrine and lagoonal marls of Upper 85
Pliocene – Pleistocene, (b) shallow marine sands, sandstones and conglomerates of Pleistocene, (c) 86
marine calcareous sandstones of Pleistocene, and (d) Holocene alluvial deposits (sands, gravels) of 87
the Lower Pineios River valley that unconformably overlain the above mentioned formations. The 88
Plio‐Pleistocene molluscan assemblages and the sedimentary facies imply a continuous alternation of 89
shallow marine waters, brackish and lacustrine environments (Paraskevaidis and Symeonidis, 1965). 90
The broader region of Pineios valley is already known for the existence of fossil Mammals, as some 91
Hippopotamus (Thenius, 1955, Symeonidis and Therodorou, 1986) and Elephas (Kamberis, 1987, 92
Athanassiou, 2000) specimens have been discovered, indicating a pre‐existing fluvial‐lacustrine 93
environment. Kamberis et al. (1993) based on deep borehole data proved that the maximum 94
thickness of this post‐alpine sequence exceeds 3,000 meters and unconformably covers the 95
basement rock pile. 96
The alpine basement comprises of three alpine geotectonic units; thin bedded pelagic sediments of 97
Pindos unit are found overthrusting neritic carbonates and flysch of Gavrovo‐Tripolis unit, which are 98
also overthrusting evaporites, limestones and flysch of the most external Ionian unit (Papanikolaou, 99
1984; 1997). 100
101
5
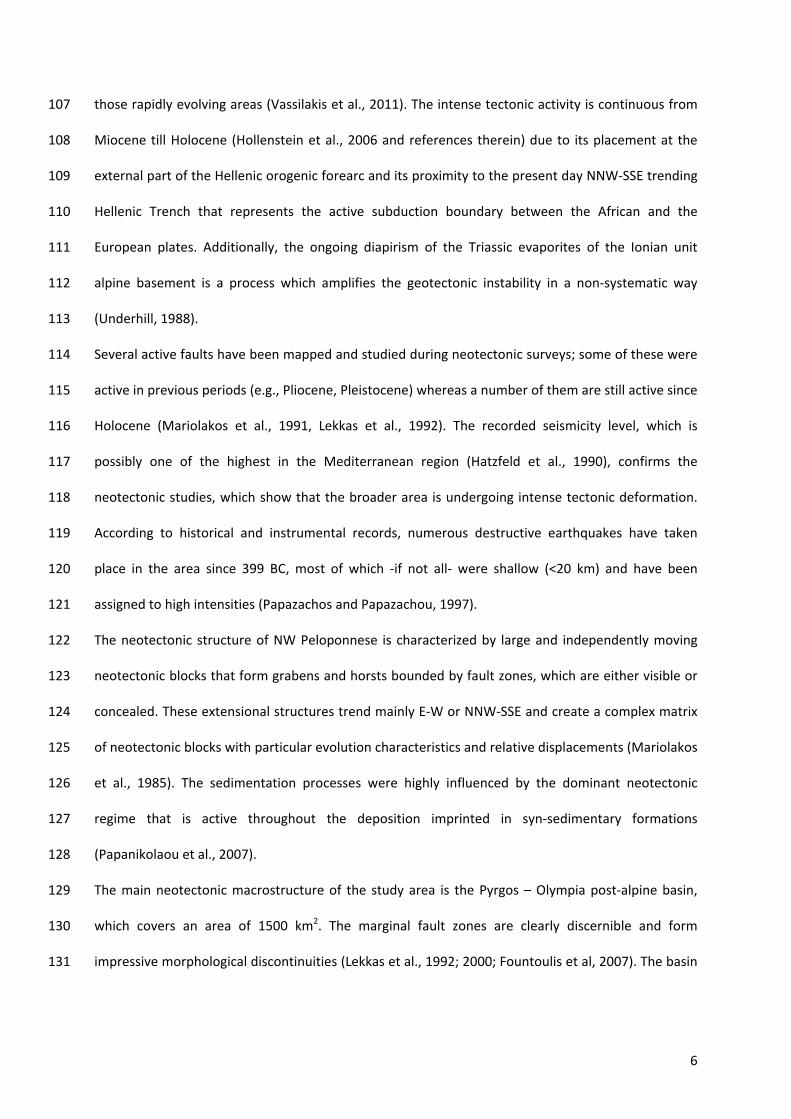
Figure 1. Index map of the study area at NW Peloponnese. The trace of the studied active fault is
illustrated just north of Pineios River. This structure is responsible for a number of landform
processes which are described in the text.
102
103
2.1 Regional active tectonics 104
The Ionian Islands and the Gulf of Corinth are included in the most seismic and tectonically active 105
regions in Greece (Hatzfeld et al., 1990). NW Peloponnese is the geotectonic junction connecting 106
6
those rapidly evolving areas (Vassilakis et al., 2011). The intense tectonic activity is continuous from 107
Miocene till Holocene (Hollenstein et al., 2006 and references therein) due to its placement at the 108
external part of the Hellenic orogenic forearc and its proximity to the present day NNW‐SSE trending 109
Hellenic Trench that represents the active subduction boundary between the African and the 110
European plates. Additionally, the ongoing diapirism of the Triassic evaporites of the Ionian unit 111
alpine basement is a process which amplifies the geotectonic instability in a non‐systematic way 112
(Underhill, 1988). 113
Several active faults have been mapped and studied during neotectonic surveys; some of these were 114
active in previous periods (e.g., Pliocene, Pleistocene) whereas a number of them are still active since 115
Holocene (Mariolakos et al., 1991, Lekkas et al., 1992). The recorded seismicity level, which is 116
possibly one of the highest in the Mediterranean region (Hatzfeld et al., 1990), confirms the 117
neotectonic studies, which show that the broader area is undergoing intense tectonic deformation. 118
According to historical and instrumental records, numerous destructive earthquakes have taken 119
place in the area since 399 BC, most of which ‐if not all‐ were shallow (<20 km) and have been 120
assigned to high intensities (Papazachos and Papazachou, 1997). 121
The neotectonic structure of NW Peloponnese is characterized by large and independently moving 122
neotectonic blocks that form grabens and horsts bounded by fault zones, which are either visible or 123
concealed. These extensional structures trend mainly E‐W or NNW‐SSE and create a complex matrix 124
of neotectonic blocks with particular evolution characteristics and relative displacements (Mariolakos 125
et al., 1985). The sedimentation processes were highly influenced by the dominant neotectonic 126
regime that is active throughout the deposition imprinted in syn‐sedimentary formations 127
(Papanikolaou et al., 2007). 128
The main neotectonic macrostructure of the study area is the Pyrgos – Olympia post‐alpine basin, 129
which covers an area of 1500 km2. The marginal fault zones are clearly discernible and form 130
impressive morphological discontinuities (Lekkas et al., 1992; 2000; Fountoulis et al, 2007). The basin 131
7
itself is infilled with post‐alpine deposits of Late Miocene – Holocene age, reaching a thickness of 132
approximately 3km (Kamberis, 1987). 133
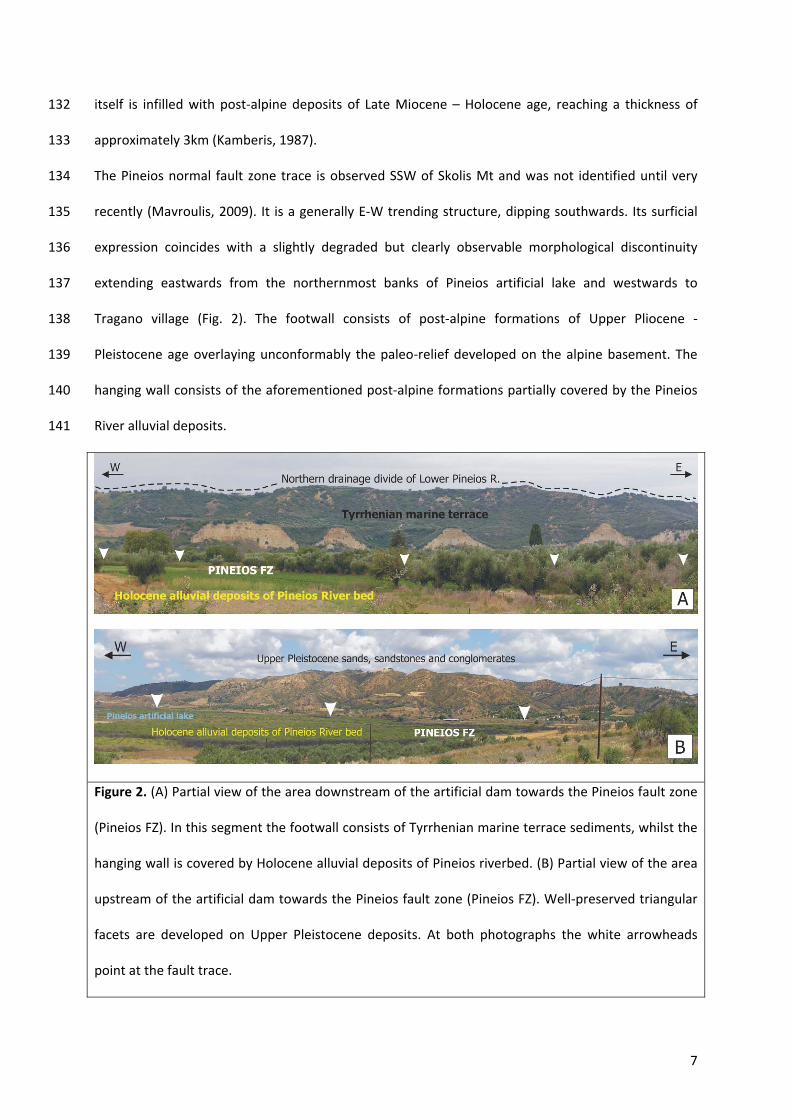
The Pineios normal fault zone trace is observed SSW of Skolis Mt and was not identified until very 134
recently (Mavroulis, 2009). It is a generally E‐W trending structure, dipping southwards. Its surficial 135
expression coincides with a slightly degraded but clearly observable morphological discontinuity 136
extending eastwards from the northernmost banks of Pineios artificial lake and westwards to 137
Tragano village (Fig. 2). The footwall consists of post‐alpine formations of Upper Pliocene ‐ 138
Pleistocene age overlaying unconformably the paleo‐relief developed on the alpine basement. The 139
hanging wall consists of the aforementioned post‐alpine formations partially covered by the Pineios 140
River alluvial deposits. 141
Figure 2. (A) Partial view of the area downstream of the artificial dam towards the Pineios fault zone
(Pineios FZ). In this segment the footwall consists of Tyrrhenian marine terrace sediments, whilst the
hanging wall is covered by Holocene alluvial deposits of Pineios riverbed. (B) Partial view of the area
upstream of the artificial dam towards the Pineios fault zone (Pineios FZ). Well‐preserved triangular
facets are developed on Upper Pleistocene deposits. At both photographs the white arrowheads
point at the fault trace.
8
142
It is worth mentioning that the post‐alpine formations of the footwall form a broad Tyrrhenian 143
marine terrace consisting of sands, sandstones and conglomerates, which outcrop both northward 144
and southward of the fault zone for hundreds of square kilometers (Stamatopulos et al., 1988). The 145
terraced surface appears as a monocline dipping northwestwards based on the orientation of strata 146
according to strike and dip measurements during general geological fieldwork (Mavroulis, 2009; 147
Mavroulis et al., 2010). More specifically, the Pleistocene marine formations of the footwall dip 148
northwestwards at between 4° and 14° whilst the Upper Pliocene‐Pleistocene marine and lagoonal 149
formations cropping out at the hanging wall dip also northwestwards at between 7° and 30°. These 150
fossiliferous marine deposits can often be found under a thin cover of reddish sandy and 151
conglomeratic alluvial deposits. 152
Field work at the Lower Pineios River broader area has revealed enough geomorphic evidence of 153
recent tectonic activity (Mavroulis, 2009; Mavroulis et al., 2010; Fountoulis et al., 2011; 2013; this 154
study). The most characteristic diagnostic tectonic landforms associated with Pineios fault zone are 155
the successive sets of slightly degraded but well‐defined and well‐preserved triangular facets along 156
the morphological discontinuity formed by the displacement along the fault zone (Fig. 2). These 157
tectonic landforms indicate active faulting and normal displacement (Wallace, 1977; Menges, 1990). 158
They reflect rapid, recent and cumulative uplift, as only such movements can maintain these kinds of 159
tectonic signatures in a landscape underlain by the lithologies cropping out at this region (porous 160
marine calcareous sandstones, marine sands, sandstones, and conglomerates, lacustrine and 161
lagoonal clays). The formation and preservation of such landforms are consistent with rapid recent 162
uplift, which generally lasts from 103 to 106 years (Cotton, 1950; Bull, 1978). Therefore, it is rather 163
clear that high extensional tectonic activity should be present along this mountain front and 164
consequently the process of forming the triangular facets is quite recent. 165
9
It is worth mentioning that there was no indication of triggering any ruptures along the Pineios fault 166
system trace after the damaging earthquake of June 2008 (Feng et al., 2010; Koukouvelas et al., 167
2010; Konstantinou et al., 2011). On the contrary, a significant number of rock falls were observed 168
along the triangular facets presented here at Figure 2A, as well as liquefactions were found after the 169
seismic event around the artificial lake (Mavroulis et al., 2013). 170
171
3 MORPHOTECTONIC ANALYSIS OF PINEIOS FAULT ZONE USING MORPHOMETRIC INDICES 172
Bull and McFadden (1977) introduced the approach of quantitative analysis of the topography for the 173
evaluation of active faulting. The use of simple ratios serves as a valuable tool for tectonic 174
geomorphology studies along faulted mountain fronts including landform metrics such as mountain–175
piedmont junction sinuosity, percentage of triangular faceting along mountain fronts, longitudinal 176
river profile analyses and variations of valley floor slopes. 177
178
3.1 Mountain – Front Sinuosity (Smf) 179
Mountain front sinuosity (Smf) is an index of the degree of irregularity or sinuosity along the base of a 180
topographic escarpment. The utility of this parameter is based on the tendency of active structures 181
to maintain straight or curvilinear profiles in map view, as contrasted to the more irregular profiles 182
produced by erosional processes along the base of associated topographic escarpments. Mountain – 183
front sinuosity (Smf) is defined as the ratio of the observed length along the margin of the topographic 184
mountain‐piedmont junction (Lmf) to the overall length of the mountain front (Ls) and is given by the 185
following equation: Smf = Lmf /Ls (Bull and McFadden, 1977; Bull, 1978). This index has already been 186
applied in various geologic environments in active regions throughout the world revealing that the 187
most tectonically active fronts are characterized by values of Smf ranging from 1.0 to 1.4 (Bull and 188
McFadden, 1977; Rockwell et al., 1984; Wells et al., 1988; Theocharis and Fountoulis, 2002; Silva et 189
al., 2003). As pointed out by Wells et al. (1988), this value of Smf=1.4 seems to limit the sensitivity of 190
this index for the discrimination of any smaller‐scale variation of differential uplift that may exist 191
10
among different mountain fronts. Increasingly larger values of Smf index (>3) are normally related to 192
fronts with decreasing amounts of tectonic uplift relative to basal erosion or pedimentation in which 193
the initial range – front fault may be more than 1 km away from the present erosional front (Bull and 194
McFadden, 1977). 195
The Smf values depend among others on topography scale. Small‐scale topographic maps produce 196
only a rough estimate of mountain front sinuosity. Therefore, mountain front sinuosity and all 197
morphometric variables for this study were measured on large‐scale topographic maps (1:5,000, with 198
4m contour intervals) published by the Hellenic Military Geographical Agency (HMGA). 199
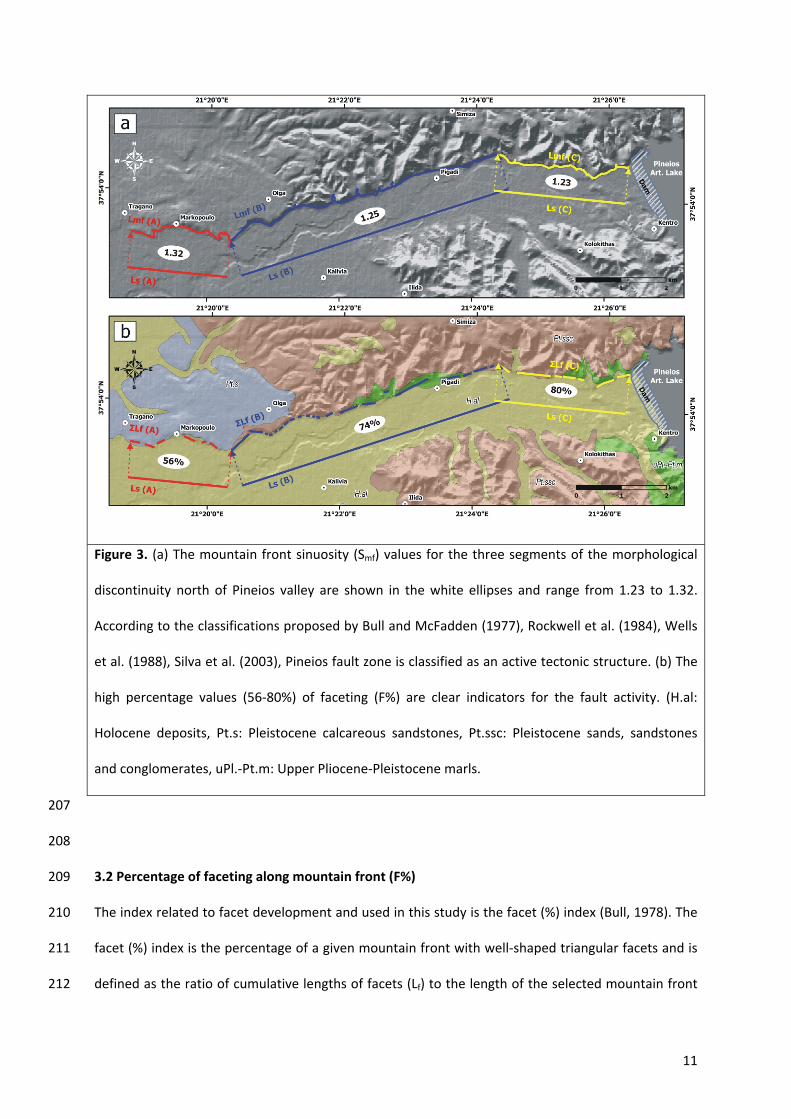
Mountain front sinuosity was measured in three segments of the morphological discontinuity just 200
north of Pineios valley, downstream of the artificial lake and their distinction was based on the hill‐201
front general direction (Fig. 3). The Lmf, Ls and Smf values for these segments are presented in table 1 202
whilst the Smf values are also depicted in figure 3A. The calculated Smf values range from 1.23 to 1.32 203
and according to classifications proposed by Bull and McFadden (1977), Rockwell et al. (1984), Wells 204
et al. (1988) and Silva et al. (2003) the hill front formed by the Pineios fault zone is classified as an 205
active one. 206
11
Figure 3. (a) The mountain front sinuosity (Smf) values for the three segments of the morphological
discontinuity north of Pineios valley are shown in the white ellipses and range from 1.23 to 1.32.
According to the classifications proposed by Bull and McFadden (1977), Rockwell et al. (1984), Wells
et al. (1988), Silva et al. (2003), Pineios fault zone is classified as an active tectonic structure. (b) The
high percentage values (56‐80%) of faceting (F%) are clear indicators for the fault activity. (H.al:
Holocene deposits, Pt.s: Pleistocene calcareous sandstones, Pt.ssc: Pleistocene sands, sandstones
and conglomerates, uPl.‐Pt.m: Upper Pliocene‐Pleistocene marls.
207
208
3.2 Percentage of faceting along mountain front (F%) 209
The index related to facet development and used in this study is the facet (%) index (Bull, 1978). The 210
facet (%) index is the percentage of a given mountain front with well‐shaped triangular facets and is 211
defined as the ratio of cumulative lengths of facets (Lf) to the length of the selected mountain front 212
12
(Ls) (Wells et al., 1988). High percentages of faceting along the mountain front indicate its activity 213
(Ramírez‐Herrera, 1998). The potential difficulties on the application of this morphometric index are 214
the systematic definition of individual facet as well as the discrimination between faceted and non‐215
faceted sections of a mountain front (DePolo and Anderson, 2000). To avoid these difficulties and 216
limitations, topographic maps of 1:5,000 published by the HMGA were also used. 217
Percentages of faceting along mountain front (F%) were measured in the above‐mentioned three 218
segments of the morphological discontinuity developed north of Pineios valley (see chapter 3.1). The 219
measured Lf, Ls and F% calculated values for each segment are presented in table 1 and the faceting 220
percentages are also depicted in figure 3B. The F% values range from 56% to 80% yielding high 221
participation rates of well‐defined triangular facets along the hill front of Pineios fault zone and 222
indicating its tectonic activity. 223
224
Table 1: Mountain ‐ front sinuosity (Smf) and percentage of faceting along the hill front (F%) for 225
Pineios fault zone. Segments A, B, C are depicted in fig. 3. 226
Pineios FZ Segments Lmf (in m) Ls (in m) Smf ΣLf (in m) Ls (in m) F F%
A 2926.97 2215.92 1.32 1230.89 2215.92 0.56 56
B 7738.86 6202.62 1.25 4598.71 6202.62 0.74 74
C 3595.13 2921.51 1.23 2340,74 2921.51 0.80 80
227
228
3.3 The alluvial river response to Pineios fault zone 229
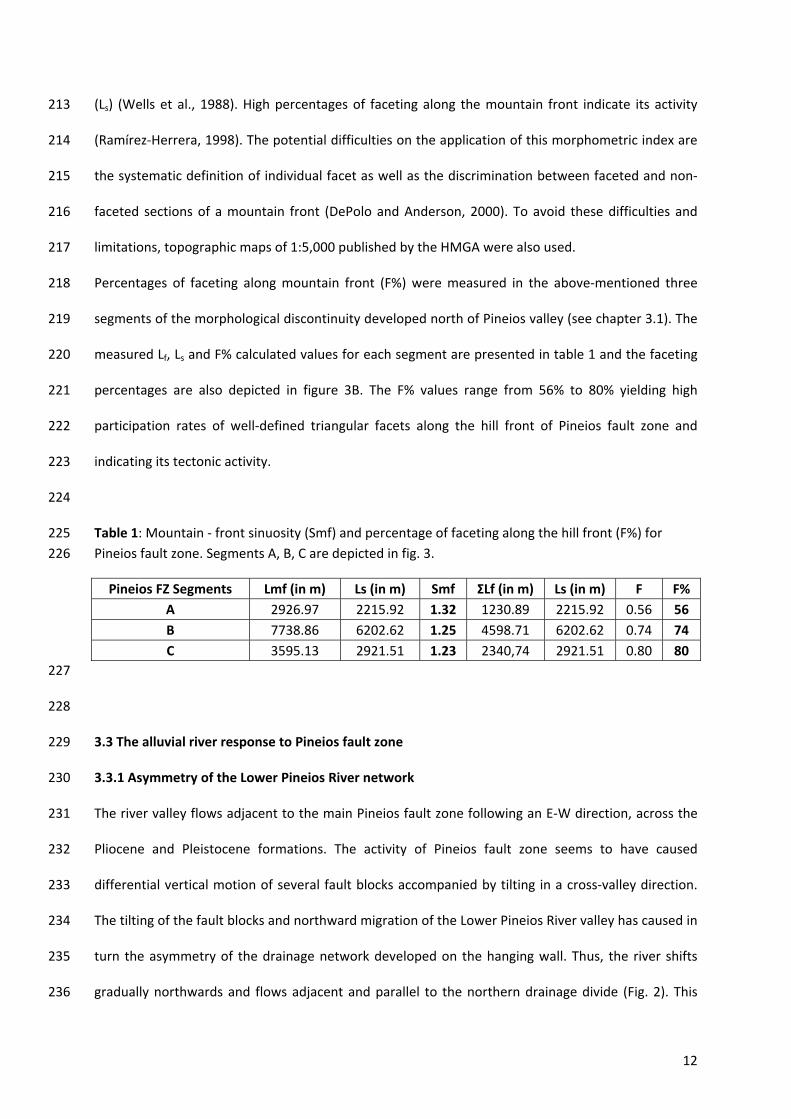
3.3.1 Asymmetry of the Lower Pineios River network 230
The river valley flows adjacent to the main Pineios fault zone following an E‐W direction, across the 231
Pliocene and Pleistocene formations. The activity of Pineios fault zone seems to have caused 232
differential vertical motion of several fault blocks accompanied by tilting in a cross‐valley direction. 233
The tilting of the fault blocks and northward migration of the Lower Pineios River valley has caused in 234
turn the asymmetry of the drainage network developed on the hanging wall. Thus, the river shifts 235
gradually northwards and flows adjacent and parallel to the northern drainage divide (Fig. 2). This 236
13
asymmetrical development is clearly reflected on the number, size and order of the tributaries and 237
sub basins on either side of the river. North of the 7th order Lower Pineios River, the 1st and 2nd order 238
drainage basins prevail, while higher order drainage basins are less common and significantly smaller 239
(Fig. 4A). In contradiction, the 3rd order drainage basins are much bigger and prevail covering an 240
extended area at the left of the main branch of the river downstream the artificial lake. This type of 241
asymmetric development of sub‐basins yields block rotational tectonism (Cox, 1994; Garrote et al., 242
2006) and is in full agreement with the observations during fieldwork (Mavroulis, 2009). 243
Figure 4. Significant changes are observed at the Valley Floor Slope (%) and Sinuosity Index (SI) values
14
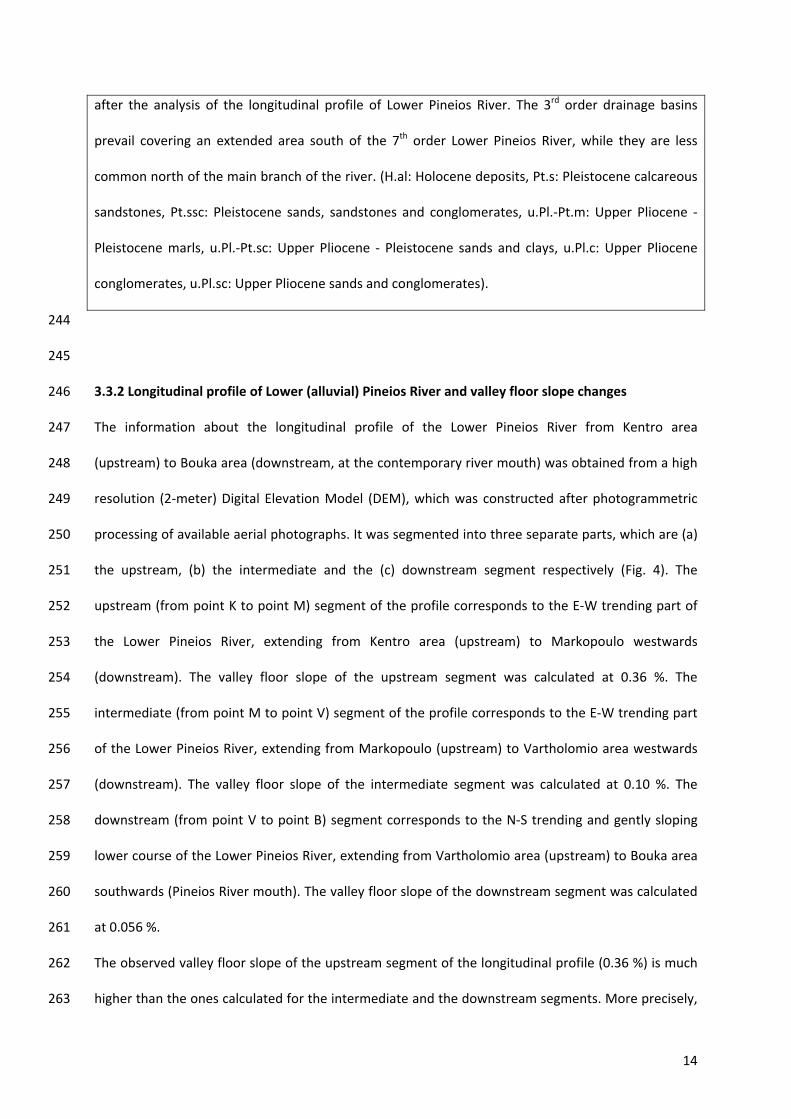
after the analysis of the longitudinal profile of Lower Pineios River. The 3rd order drainage basins
prevail covering an extended area south of the 7th order Lower Pineios River, while they are less
common north of the main branch of the river. (H.al: Holocene deposits, Pt.s: Pleistocene calcareous
sandstones, Pt.ssc: Pleistocene sands, sandstones and conglomerates, u.Pl.‐Pt.m: Upper Pliocene ‐
Pleistocene marls, u.Pl.‐Pt.sc: Upper Pliocene ‐ Pleistocene sands and clays, u.Pl.c: Upper Pliocene
conglomerates, u.Pl.sc: Upper Pliocene sands and conglomerates).
244
245
3.3.2 Longitudinal profile of Lower (alluvial) Pineios River and valley floor slope changes 246
The information about the longitudinal profile of the Lower Pineios River from Kentro area 247
(upstream) to Bouka area (downstream, at the contemporary river mouth) was obtained from a high 248
resolution (2‐meter) Digital Elevation Model (DEM), which was constructed after photogrammetric 249
processing of available aerial photographs. It was segmented into three separate parts, which are (a) 250
the upstream, (b) the intermediate and the (c) downstream segment respectively (Fig. 4). The 251
upstream (from point K to point M) segment of the profile corresponds to the E‐W trending part of 252
the Lower Pineios River, extending from Kentro area (upstream) to Markopoulo westwards 253
(downstream). The valley floor slope of the upstream segment was calculated at 0.36 %. The 254
intermediate (from point M to point V) segment of the profile corresponds to the E‐W trending part 255
of the Lower Pineios River, extending from Markopoulo (upstream) to Vartholomio area westwards 256
(downstream). The valley floor slope of the intermediate segment was calculated at 0.10 %. The 257
downstream (from point V to point B) segment corresponds to the N‐S trending and gently sloping 258
lower course of the Lower Pineios River, extending from Vartholomio area (upstream) to Bouka area 259
southwards (Pineios River mouth). The valley floor slope of the downstream segment was calculated 260
at 0.056 %. 261
The observed valley floor slope of the upstream segment of the longitudinal profile (0.36 %) is much 262
higher than the ones calculated for the intermediate and the downstream segments. More precisely, 263
15
the average valley floor slope (0.36 %) of the upstream segment is almost 4‐fold higher than the one 264
calculated for the intermediate segment (0.10 %) and almost 6‐fold higher than the one calculated 265
for the downstream one (0.056 %). Furthermore, the valley floor slope of the intermediate segment 266
(0.10 %) is 2‐fold higher than the one calculated for the downstream segment. Based on the 267
observation of the longitudinal profile (Fig. 4) it can be noted that the M point, where the first 268
significant change of the valley floor slope is situated, is located in close vicinity to the westernmost 269
edge of the morphological discontinuity. The V point, where the second significant change of the 270
valley floor slope is situated, is located very close to Vartholomio area, where the characteristic 271
southwards bending of the Lower Pineios River course is located. This bending seems to have 272
tectonic origin, since it is located at the possible westwards prolongation of the Pineios fault zone, 273
and/or due to diapiric phenomena, as the river valley seems to be diverted by the uplifted Kyllini 274
peninsula, which is on top of an evaporitic dome (Kamberis, 1987) and bounds the Gastouni graben. 275
It is rather clear that the subsurface tectonic deformation of the area has been imprinted at the 276
longitudinal profile and the points where the profile anomalies were observed are the key areas for 277
extracting conclusions about the area’s neotectonic evolution. 278
279
3.3.3 Sinuosity index (SI) 280
Under certain conditions, alluvial rivers tend to evolve as single meandering channels (Brice, 1964; 281
Rust, 1978). This behavior is generally influenced by tectonic movements, reflected in river channel 282
parameters (Zámolyi et al., 2010). It is generally accepted that if a normal fault is down throwing in 283
the downstream direction, increased meandering is resulted (Ouchi, 1985; Keller and Pinter, 1996; 284
Holbrook and Schumm, 1999; Bridge, 2005). This process is largely independent of the river size, 285
once the fluvial system enters the meandering stage. In this way, not only large rivers are suitable for 286
analysis, but smaller creeks and reaches can also be evaluated, as far as they are essentially free of 287
human influence. The increasingly use of Geographic Information Systems (GIS) and the higher 288
quality of elevation data give the opportunity to make river sinuosity calculations a sensitive tool for 289
16
recognizing neotectonic activity in low‐relief areas, as even the smallest changes in the topography 290
affect the sinuosity of low gradient rivers (Holbrook and Schumm, 1999), providing hints for points of 291
on‐going microtopographic changes. A quantitative measure of the variation of the meandering 292
pattern is the classic sinuosity index (SI). The sinuosity index of modern river channels was defined by 293
Leopold and Wolman (1957) as the ratio of the thalweg length to the valley length. Brice (1964) 294
suggested a slightly modified sinuosity index (the ratio of the channel length to the length of the 295
meander‐belt axis), which has the advantage of allowing for both straight and sinuous meander‐296
belts. In both studies, an arbitrary value of 1.5 was used to distinguish between low‐ and high‐297
sinuosity channels. Although other classification schemes have been described (Schumm 1963), this 298
value is generally accepted. 299
The SI values for the Lower Pineios River have been calculated using the high resolution DEM derived 300
from aerial photographs photogrammetric processing. The calculations were made in close vicinity of 301
the northern and western tectonic boundaries of the Gastouni graben, which are formed by the 302
active Pineios fault zone and the Kyllini hill. This is the exact same area where the Lower Pineios River 303
flows and especially along the three segments (see 3.3.2) characterized by different valley floor slope 304
values derived from the longitudinal profile processing of Lower Pineios described earlier in this 305
paper. 306
The sinuosity index values as well as the values of the channel length (S ‐ curvilinear distance 307
measurement along the center of the channel) and the valley length (L ‐ horizontal distance 308
measured in the thalweg of two cross sections in a linear depression between two adjacent uplands) 309
are presented in table 2. 310
From upstream (KM part of the profile) to downstream (VB part of the profile), the Lower Pineios 311
River valley floor slope decreases from 0.36 % to 0.056 %, whilst the sinuosity index values increase 312
from 1.19 to 1.40. It is reasonable to assume that sinuosity variations along the Lower Pineios River 313
are related to, or strongly coupled with differential tectonic deformation of the study area 314
(differential uplift/subsidence pattern) and this is in full agreement with the thickness and the 315
17
isobaths of the Neogene and Quaternary formations (Kamberis, 1987). Thus, the Lower Pineios River 316
responds to active faulting by changing its sinuosity (Fig. 4). 317
318
Table 2: Sinuosity index (SI) and valley floor slope values calculated for Lower Pineios River. Parts KM, 319
MV, VB are depicted in fig. 4. 320
Lower Pineios River part S (in m) L (in m) SI Valley floor slope (%)
KM 13154 11354 1.19 0.36
MV 11206 9175 1.22 0.10
VB 8930 6340 1.40 0.056
321
322
4 UPLIFT RATES OF FAULT BLOCKS AND PINEIOS FAULT SLIP RATE 323
As previously mentioned, the study area consists mainly of a succession of sediments with ages from 324
Pliocene to Holocene. The 23OTh/238U dating of corals (Stamatopulos et al., 1988) found in the upper 325
layers of the sequence indicate Tyrrhenian age for all the sampled layers at three complete sections 326
located on the footwall of Pineios fault zone. The deposition ages were determined as follows: 103 ky 327
for Psari section (at an elevation of 40‐45 m above sea level (a.s.l.)), 118 ky for Neapolis section (at an 328
elevation of 60‐65 m (a.s.l.)) and 209 ky for Aletreika section (at an elevation of 140‐145 m (a.s.l.)). 329
The sampling sites are located north of Pineios fault zone and placed on the same fault block, as no 330
trace of interruption of tectonic origin is found between them (Fig. 1). 331
According to several publications about the sea level fluctuations since Pleistocene the ages of the 332
dated samples belong to the oxygen isotope stages 5.3, 5.5 and 7.3 respectively (Shackleton et al., 333
1984; Imbrie et al., 1984; Waelbroeck et al., 2002 and references therein). These stages represent 334
high sea level stands for the Mediterranean Sea (Caputo, 2007) and especially for the western coast 335
of Peloponnese (Athanassas and Fountoulis, 2013). Consequently, the contemporary sea level is 336
quite similar to the one during the deposition of the Tyrrhenian strata. In particular, during 103 ka 337
the sea level was at about ‐13m (a.s.l.), during 118 ka it was at about ‐1m (a.s.l.) and finally during 338
209 ka it was at about ‐7m (a.s.l.) (Waelbroeck et al., 2002). 339
18
Taking into account the age of each sample, the sea level changes since Pleistocene and the present 340
elevation of the sampling sections, the uplift rates for the footwall of the Pineios fault zone were 341
calculated approximately at 0.26 mm/yr for Psari area, 0.50 mm/yr for Neapoli area and 0.64 mm/yr 342
for Aletreika area respectively (Fountoulis et al., 2011; 2013). It can be deduced that the maximum 343
uplift rate (0.64 mm/yr) corresponds to an area (Aletreika) located in close proximity to the fault 344
zone in contrast to the other areas which are located much further away to the north (Fig. 1). The 345
differential uplift of the same fault block, containing all three locations, implies a back tilting towards 346
north. The latter in full agreement with the general rotational block faulting mode of structural 347
evolution observed during fieldwork in the surrounding area. 348
The uplift rate for the hanging wall was also approximately estimated at 0.16 mm/yr (209 ky at the 349
present elevation of 40 m (a.s.l.), which is the lowest elevation on the hanging wall that the same 350
Tyrrhenian layers are cropping out), after considering the sea level during the deposition. It is rather 351
clear that the uplift rate of the hanging wall (0.16 mm/yr) is much lower even than the lowest value 352
of the footwall uplift rate (0.26 mm/yr). The difference between the uplift rate of Aletreika (footwall) 353
and the Pineios River plain (hanging wall) is about 0.48 mm/yr, which corresponds to the actual slip 354
rate of Pineios fault zone for the last 209 ka. This leads to the conclusion that the overall throw of the 355
fault is about 100 meters. 356
357
5. GEOELECTRICAL INVESTIGATION 358
A geophysical survey was carried out at the area of Pineios river valley, downstream of the artificial 359
dam aiming to investigate the layer boundaries between (i) the Holocene fluvial deposits with any 360
other layer covered by them, (ii) the Upper Pleistocene sandstones with the older conglomeratic 361
layer and (iii) the Pleistocene conglomerates with the Pliocene lagoonal marls, since this is the 362
general layer succession described for the broader area (Kamberis et al., 1993). A grid of Vertical 363
Electrical Soundings (VES) was planned around the area distributed on both blocks as the existence of 364
a fault zone underneath the Holocene deposits was quite possible. Vertical Electrical Soundings have 365
19
been applied successfully for the investigation of geological‐tectonic structure in other areas 366
(Alexopoulos and Dilalos, 2010; Alexopoulos et al., 2001; Papadopoulos et al, 2007; Asfahani and 367
Radwan, 2007), sometimes combined also with morphotectonic survey (Asfahani et al., 2010). The 368
geoelectrical data acquisition included two “in‐situ” resistivity measurements on surface outcrops of 369
the geological formations and thirteen vertical electrical soundings for the investigation of the 370
geological structure of the area and the possible existence of a fault line at the northern sides of the 371
Pineios riverbed (see Fig. 1 for VES site locations or the supplementary kmz file). 372
373
5.1 Geophysical‐geological calibration 374
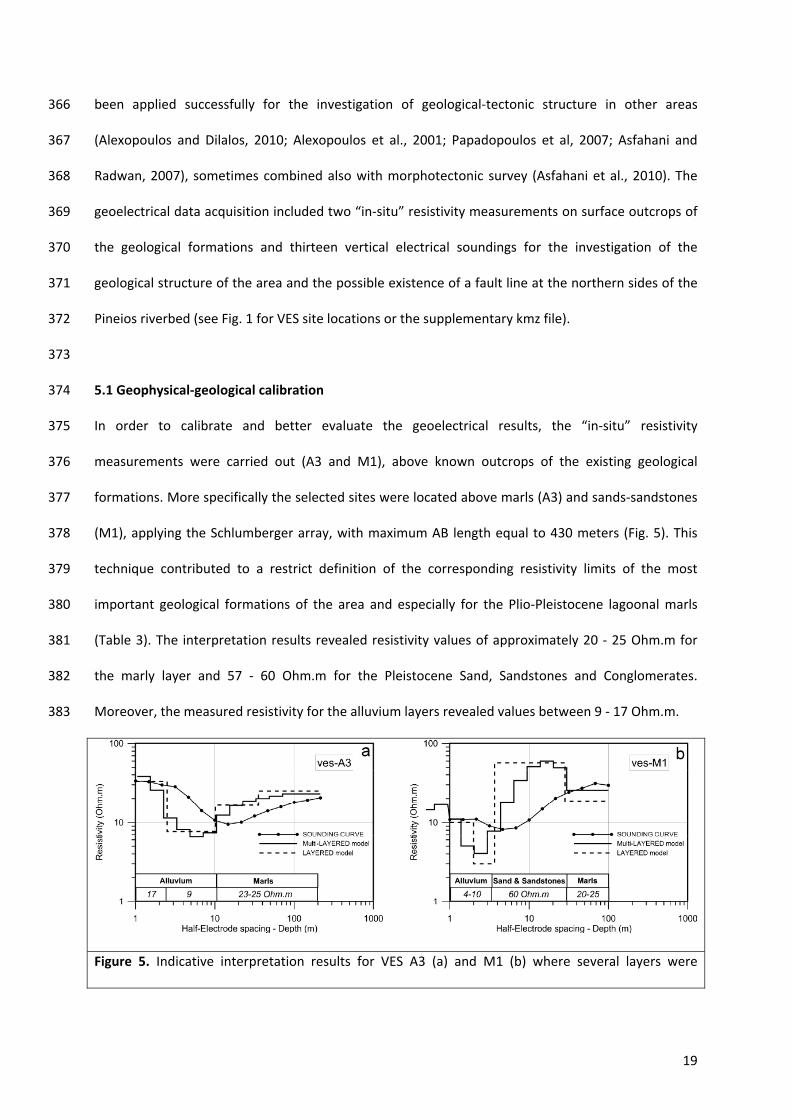
In order to calibrate and better evaluate the geoelectrical results, the “in‐situ” resistivity 375
measurements were carried out (A3 and M1), above known outcrops of the existing geological 376
formations. More specifically the selected sites were located above marls (A3) and sands‐sandstones 377
(M1), applying the Schlumberger array, with maximum AB length equal to 430 meters (Fig. 5). This 378
technique contributed to a restrict definition of the corresponding resistivity limits of the most 379
important geological formations of the area and especially for the Plio‐Pleistocene lagoonal marls 380
(Table 3). The interpretation results revealed resistivity values of approximately 20 ‐ 25 Ohm.m for 381
the marly layer and 57 ‐ 60 Ohm.m for the Pleistocene Sand, Sandstones and Conglomerates. 382
Moreover, the measured resistivity for the alluvium layers revealed values between 9 ‐ 17 Ohm.m. 383
Figure 5. Indicative interpretation results for VES A3 (a) and M1 (b) where several layers were
20
detected.
384
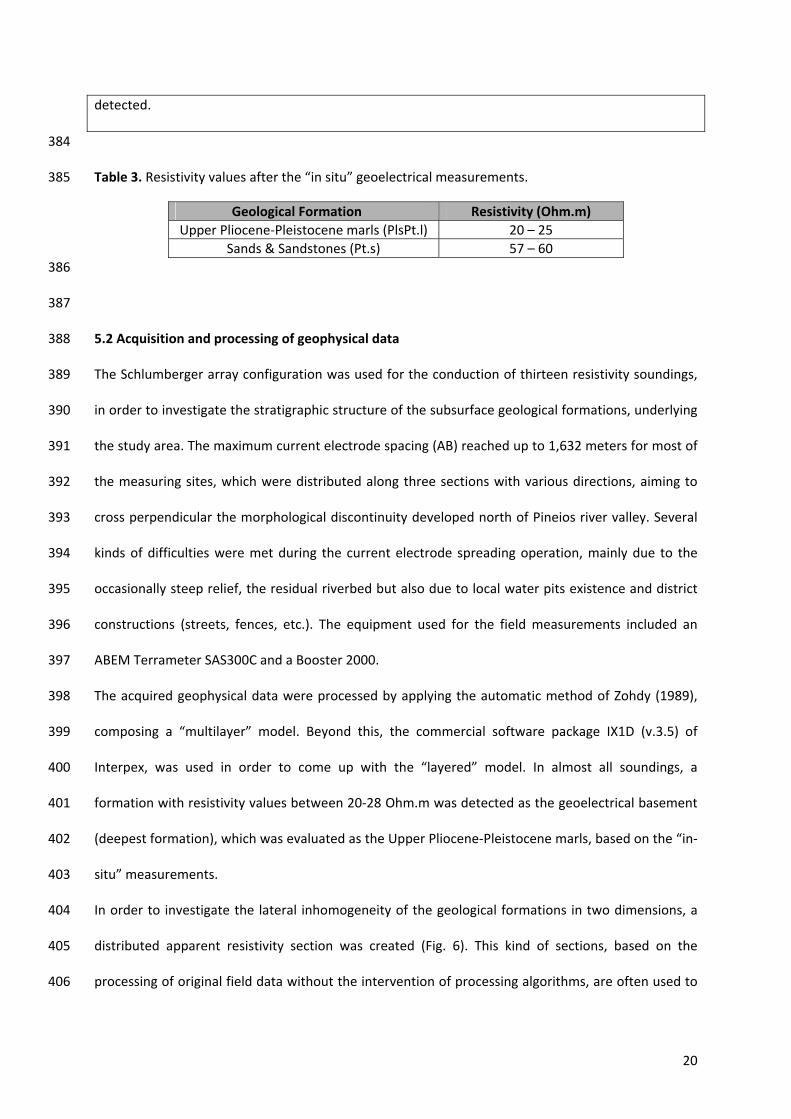
Table 3. Resistivity values after the “in situ” geoelectrical measurements. 385
Geological Formation Resistivity (Ohm.m)
Upper Pliocene‐Pleistocene marls (PlsPt.l) 20 – 25
Sands & Sandstones (Pt.s) 57 – 60
386
387
5.2 Acquisition and processing of geophysical data 388
The Schlumberger array configuration was used for the conduction of thirteen resistivity soundings, 389
in order to investigate the stratigraphic structure of the subsurface geological formations, underlying 390
the study area. The maximum current electrode spacing (AB) reached up to 1,632 meters for most of 391
the measuring sites, which were distributed along three sections with various directions, aiming to 392
cross perpendicular the morphological discontinuity developed north of Pineios river valley. Several 393
kinds of difficulties were met during the current electrode spreading operation, mainly due to the 394
occasionally steep relief, the residual riverbed but also due to local water pits existence and district 395
constructions (streets, fences, etc.). The equipment used for the field measurements included an 396
ABEM Terrameter SAS300C and a Booster 2000. 397
The acquired geophysical data were processed by applying the automatic method of Zohdy (1989), 398
composing a “multilayer” model. Beyond this, the commercial software package IX1D (v.3.5) of 399
Interpex, was used in order to come up with the “layered” model. In almost all soundings, a 400
formation with resistivity values between 20‐28 Ohm.m was detected as the geoelectrical basement 401
(deepest formation), which was evaluated as the Upper Pliocene‐Pleistocene marls, based on the “in‐402
situ” measurements. 403
In order to investigate the lateral inhomogeneity of the geological formations in two dimensions, a 404
distributed apparent resistivity section was created (Fig. 6). This kind of sections, based on the 405
processing of original field data without the intervention of processing algorithms, are often used to 406
21
provide the quantitative results, which illustrate the complexity of the stratigraphic structure. A first 407
representation is combined and the criteria for the reliability of the applied 1‐D geoelectrical 408
soundings are being set. After the qualitative representation and the adumbration of the subsurface 409
general structure, two more sections of distributed (true) resistivity were created, based on results of 410
the multi‐layered models using the method described by Zohdy (1989), including the topographic 411
relief into the processing. Furthermore, the layered sections were created according to the results of 412
the 1‐D processing and led to the calculated geoelectrical models. Afterwards, all the calculated 413
thicknesses of the geoelectrical layers had been placed at absolute elevations and the subsurface 414
structure illustrated by the geoelectrical layers was reveals for each section. The most significant 415
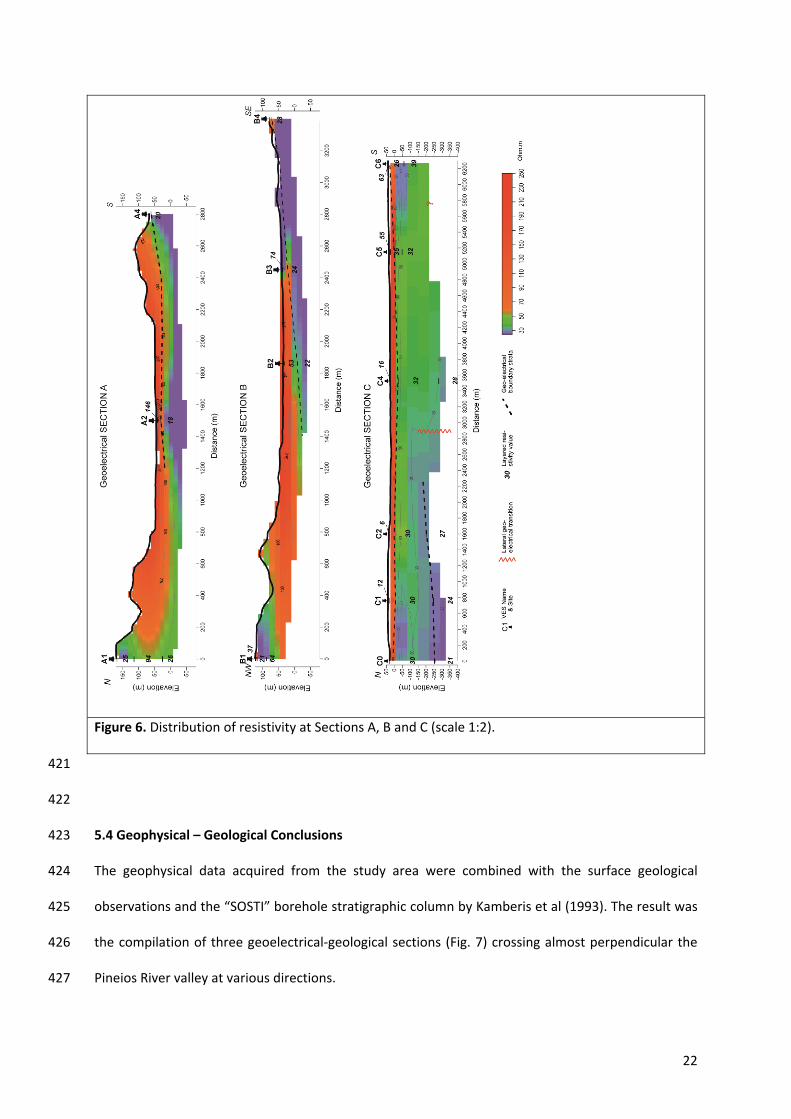
observation was a clearly defined lateral discontinuity at a distance of about 2,900 meters, at Section 416
C, whilst at Section A, another lateral geoelectrical discontinuity seems to be present at about 750 417
meters (Fig. 6). Beyond this, the other geoelectrical structure seems to be homogeneously layered 418
with the apparent resistivity values decreasing in depth. 419
420
22
Figure 6. Distribution of resistivity at Sections A, B and C (scale 1:2).
421
422
5.4 Geophysical – Geological Conclusions 423
The geophysical data acquired from the study area were combined with the surface geological 424
observations and the “SOSTI” borehole stratigraphic column by Kamberis et al (1993). The result was 425
the compilation of three geoelectrical‐geological sections (Fig. 7) crossing almost perpendicular the 426
Pineios River valley at various directions. 427
23
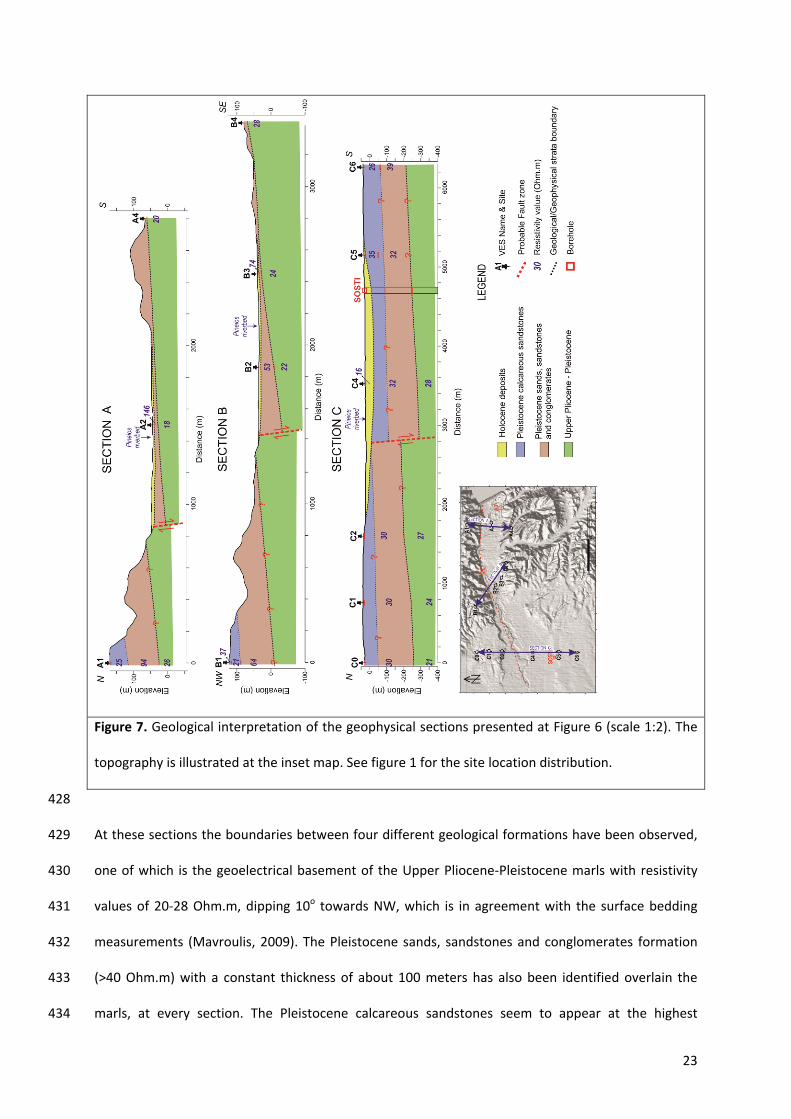
Figure 7. Geological interpretation of the geophysical sections presented at Figure 6 (scale 1:2). The
topography is illustrated at the inset map. See figure 1 for the site location distribution.
428
At these sections the boundaries between four different geological formations have been observed, 429
one of which is the geoelectrical basement of the Upper Pliocene‐Pleistocene marls with resistivity 430
values of 20‐28 Ohm.m, dipping 10ο towards NW, which is in agreement with the surface bedding 431
measurements (Mavroulis, 2009). The Pleistocene sands, sandstones and conglomerates formation 432
(>40 Ohm.m) with a constant thickness of about 100 meters has also been identified overlain the 433
marls, at every section. The Pleistocene calcareous sandstones seem to appear at the highest 434
24
elevations of the northernmost parts of the three sections as well as south of Pineios riverbed at 435
Section C. It is worth to mention that the resistivity contrast between the latter two formations was 436
quite low and there were objective difficulties for them to be distinguished, but they were overcome 437
due to the detailed and accurate field observations along the morphological discontinuity north of 438
the Pineios River depression. 439
The interpretation of the geophysical sections yielded the lateral discontinuity to a normal fault zone 440
which is clearly delineated by the interruption of the subsurface layer sequence (Fig. 6, 7) and that is 441
considered to be the major success of the geophysical survey. The fault displacement, based on the 442
top surface of the Plio‐Pleistocene marls, is growing from east (~60m at Section A) to west (~110m at 443
Section C) and that is in full agreement with all the surface geological data presented in this study. 444
The uppermost layer of Holocene deposits show an increasing thickness from east (approx. 10m) to 445
west (approx. 60m), which is also in agreement with the increasing down throwing of the fault zone 446
along the same direction. 447
448
6. REMOTE SENSING DATA AND SHORELINE DISPLACEMENT ANALYSIS 449
The main valley that hosts Pineios River runs almost parallel to the fault zone towards west and this 450
happens with no interruption for the last 100 kyr, whatsoever (Raphael, 1973). It is the southward 451
bending downstream that has been changed for the last 2000 years (Kontopoulos and Koutsios, 452
2010). We argue that its main valley used to flow into the sea by bending northwards somewhere 453
between Markopoulo and Vartholomio (Fig.1). This dramatic change should have a great impact on 454
both the shorelines where the river used to flow into the open sea (Kyllini Bay) and its current 455
estuary to the Ionian Sea. The sediment transportation to both the deltaic areas has been altered 456
during a quite small transition period and the implications on the coastline must have been very 457
significant, especially at such relatively low relief estuary areas. The response of the shoreline in 458
similar cases is always a strong indicator about the sediment transportation change. 459
25
Kraft et al., (2005) refer to the existence of the Roman period shoreline several hundreds of meters 460
offshore the Kyllini Bay and this is in agreement with the initial working hypothesis of this study. We 461
argue that the northern coast is under severe erosion and keeps retrograding since the southwards 462
diversion of Pineios River, which have happened around the 5th century (Kontopoulos and Koutsios, 463
2010). On the contrary on both sides of the new mouth of the river to the south, we expected coastal 464
progradation as the amount of the transported sediment should have increased, at least till the late 465
1960’s when the dam upstream started operating. 466
467
6.1 Data acquisition and preparation 468
We used several remote sensing datasets and topographic maps in order to determine whether or 469
not progradation or retrogradation took place in Pineios former and current deltas during the recent 470
years. We traced the shorelines at different times in a 40‐year‐period from early 1970’s to 2011 using 471
(a) photogrammetrically constructed topographic maps at 1:5,000 scale (1972), (b) two datasets of 472
aerial photos (1987, 1996), and (c) a Landsat‐ETM+ satellite image (1999). The traced coastlines were 473
compared to the present shoreline (2011), which was traced with the use of high accuracy Real‐Time 474
Kinematics differential GPS (RTK‐GPS). 475
Initially we collected the available data and created a quite satisfactory time series of images along 476
the contemporary coastline. The oldest data available were several sheets of topographic maps 477
acquired from HMGA and their construction was also based on photogrammetry techniques on 478
previously acquired aerial photographs. We used 42 overlapping air photographs, which had been 479
acquired during 1987 and generated an ortho‐photo mosaic for this year. During this 480
photogrammetric procedure a high resolution (2‐meters) Digital Elevation Model was also produced 481
and used afterwards for the ortho‐rectification of a 15‐meter resolution Landsat‐7 ETM+, 482
panchromatic image, which was acquired during 1999. All the data were co‐registered with a 1‐meter 483
spatial resolution ortho‐photo mosaic created from the photogrammetric interpretation of aerial 484
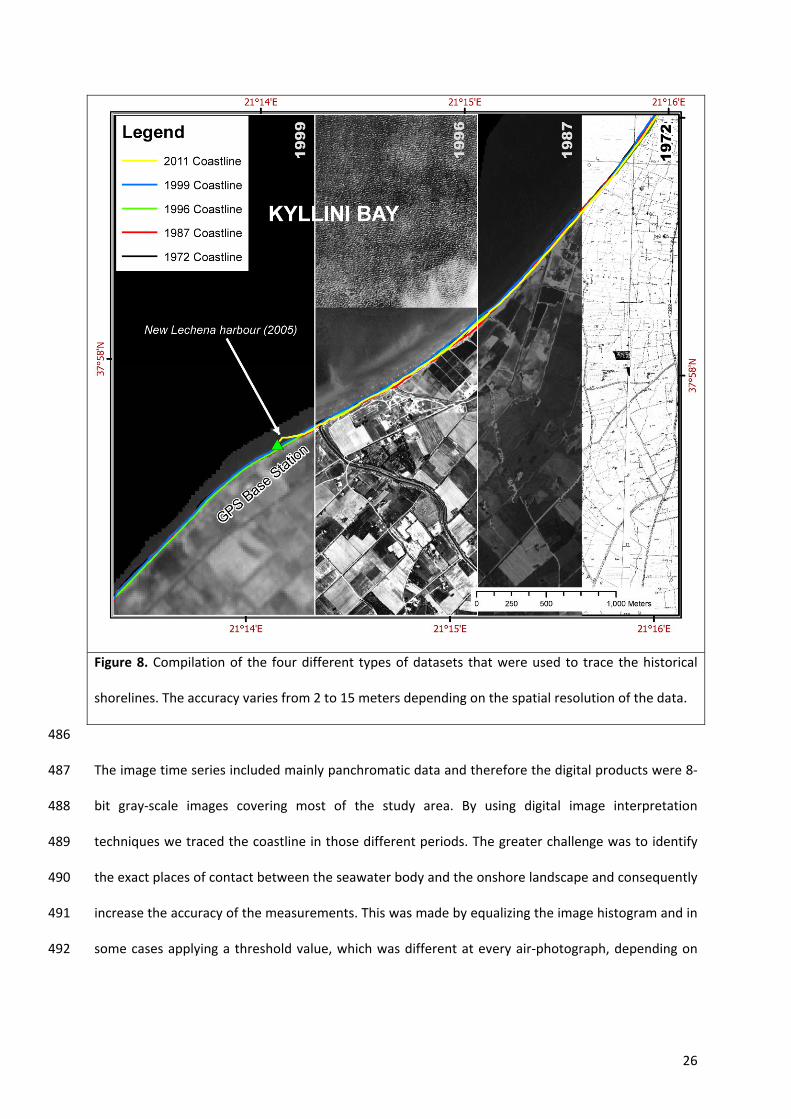
photographs acquired during 1996 (Fig. 8). 485
26
Figure 8. Compilation of the four different types of datasets that were used to trace the historical
shorelines. The accuracy varies from 2 to 15 meters depending on the spatial resolution of the data.
486
The image time series included mainly panchromatic data and therefore the digital products were 8‐487
bit gray‐scale images covering most of the study area. By using digital image interpretation 488
techniques we traced the coastline in those different periods. The greater challenge was to identify 489
the exact places of contact between the seawater body and the onshore landscape and consequently 490
increase the accuracy of the measurements. This was made by equalizing the image histogram and in 491
some cases applying a threshold value, which was different at every air‐photograph, depending on 492

27
the orientation of the sunlight. The use of the visible portion of the electromagnetic spectrum for all 493
the collected remote sensing data provides the homogeneity and objectivity of the methodology. 494
The data acquisition was completed with topographic survey by using the technology of RTK‐GPS 495
point collection, after establishing four GPS bases along the shore (Fig. 1). The first three of them 496
were established along the northern coast of the area, covering most of the coast where Pineios 497
River used to flow in the sea. The fourth station was established at the contemporary mouth of 498
Pineios at the southern coast. The rover antenna was setup for acquiring easting and northing 499
coordinates in the Hellenic Geodetic Reference System of 1987 (Greek Grid) projection system, every 500
50 cm along the shoreline. The accuracy of the present coastline trace was quite high as the 501
specifications of the equipment (TOPCON HiperPro) claim to get measurements with precision less 502
than 10mm. The rover antenna was carried either by walking or adjusted on vehicles driven next to 503
the shoreline where possible. At each case the height of the antenna was measured and imported 504
into the solution software provided by the manufacturer of the equipment (TOPCON Tools v.7). 505
506
6.2 Digital shoreline analysis results 507
The collected points were converted into polylines and projected in a Geographic Information System 508
platform along with the digitized shorelines of the previous years. The best‐case scenario would be to 509
have in our disposal five different shorelines for every place but there were smaller or bigger gaps in 510
each datasets due to lack of information or objective difficulty to discriminate the land from the 511
water body during the image interpretation. The combination of all the traced historical coastlines on 512
the remote sensing data with the RTK‐GPS recorded coastline have shown that both the former and 513
the current delta fronts of Pineios River are divided into various sub‐areas characterized by different 514
type, phase and rate of shoreline displacement. 515
We used the Digital Shoreline Analysis System (DSAS) version 4.2, which is a software extension to 516
ESRI ArcGIS v.9.3.x published by USGS (Thieler et al., 2009). This extension allows the user to create 517
several transects perpendicular to a baseline parallel to the contemporary shoreline at a given 518

28
distance and measure the relative position of any digitized coasts. These measurements can be used 519
for extracting the rates of change among other useful statistics. We defined the transect distance 520
every 100 meters along both the north and south coasts and the transect length was 300 meters. A 521
point is automatically created when each transect intersects with the digitized shorelines and its 522
distance to the given baseline is measured. A table of statistics containing all the measured distances 523
is generated after this procedure. We used the statistics focusing along the coastal segments where 524
we had more than four measurements at each transect. 525
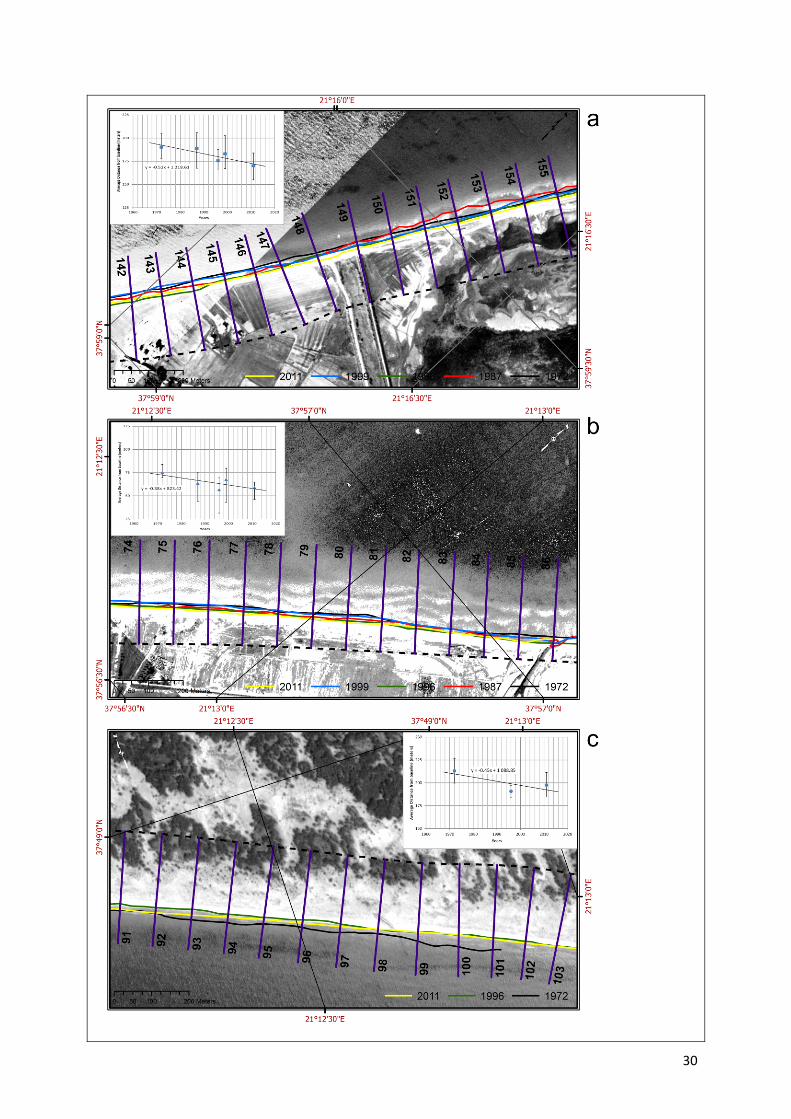
Therefore throughout the total length of 30km of the northern shoreline we used a 13 km segment, 526
which is quite representative for the northern coast. The results show that this part of the coast can 527
be divided in three individual areas. The middle part shows a certain pattern of coastal change, which 528
is strongly affected by a small but significant port (Lechena) which was constructed a few years 529
(harbor works completed during 2005) before the last RTK‐GPS measurement (2011). The other two 530
areas seem to have the same behavior, which is retrograding with similar rates. In these cases the 531
eroding rate for the NE part of Kyllini Bay coast is calculated at 0.52 m/yr (Fig. 9a) whilst the SW part 532
is calculated at 0.38 m/yr (Fig. 9b), which are rather compatible. Both of these rates are consistent 533
with the published studies (Raphael, 1973; Kraft et al., 2005) that define the historic shoreline during 534
the late Roman period (~1,550 years BP) several hundreds of meters offshore the contemporary 535
coast and during the Ottoman period (~400 years BP) somewhere in between. With our 536
interpretation the submerged Roman shoreline should have been located 700±250 meters towards 537
NW and the Ottoman shoreline should have been located 190±20 meters at the same direction, 538
more or less parallel to the present one. 539
At the southern coastal area no significant human impact has been observed for the last century. 540
Therefore the 6.5 km of RTK‐GPS measurements are quite satisfactory, although due to lack of 541
remote sensing data we were able to correlate only three shorelines (1972, 1996, 2011) and this was 542
made possible only for 1km, which is rather decent for such a homogenous geo‐environment. The 543
aforementioned calculation cannot stand by itself as this area is not very large but it can contribute 544

29
to this study as a supplementary fact. The rate of the coastal erosion is computed at 0.45 m/yr (Fig. 545
9c) and this value is also compatible with the results computed for the northern coast even if it was 546
expected to be prograding due to the increase of sediment transportation since the estuary of 547
Pineios River was relocated. A reasonable explanation is that the amount of expected sediment did 548
not reach the river’s current mouth at least after the dam construction upstream. The latter is in full 549
operation since 1968 keeping large amounts of eroded materials from reaching the contemporary 550
deltaic area and the oldest shoreline used for this calculation was traced on 1972 topographic maps. 551
Therefore, any prograding influence on the present estuary should have been dramatically reduced 552
after the dam’s operation and consequently the coastal erosion prevails. 553
30
31
Figure 9. Three of the most representative parts of the northern (a,b) and the southern (c) coast,
where transects every 100 meters were used for measuring the rates of coastal change. The insets
show the trend of the rate of erosion as a result from measuring the horizontal distance from a
baseline.
554
It has to be noted that in this approach, it is assumed that every process that contributes to long‐555
term shoreline changes such as the effect of sea‐level rise are included in the historical rate and 556
remains more or less constant over the time frame of 40 years. 557
558
7. CONCLUSIONS 559
We combined several methodologies and different kinds of data to prove that there is an unmapped 560
active normal fault zone trending E‐W, crosscutting the area where the artificial lake of Pineios dam 561
is situated. 562
The geophysical survey verified in depth this tectonic discontinuity between the deposited post‐563
alpine strata by measuring the resistivity gradation along three sections perpendicular to the south 564
dipping normal fault zone. The interpretation of the geophysical measurements revealed that the 565
fault throw is significantly larger at the westernmost segment of the zone, reaching approximately 566
the order of 110 meters. This is in full agreement with the fault slip rate which has been calculated by 567
the differential uplift rates for both of the displaced fault blocks that have been participating in this 568
local tectonic deformation and reaches the order of 0.48 mm/yr for the last 209 ka. 569
The continuous N‐S extensional activity of Pineios fault zone for more than 200ky is causing the 570
relative uplift of the northernmost area and consequently the subsidence of the southernmost block, 571
along with block rotations towards north. The major impact on the river flow is the migration of the 572
location of its estuary, which has been relocated from the northern uplifting fault block to the 573
southern subsiding one. The implications of this relocation are rather obvious on the shorelines and 574
especially along Kyllini Bay (north) where references for submerged ancient coastlines have been 575
32
noted. The retrograding rate of this shoreline, which is part of the uplifting fault block, is of the order 576
of 0.52 m/yr, since sediment material transportation through Pineios River has been suspended. 577
578
Acknowledgments 579
The author Professor Ioannis Fountoulis passed away (16/2/2013) before the publication of this 580
article. He was a great teacher and a dear friend who left too soon. He will always be an inspiration 581
to us and immeasurably missed. The authors would like to express their appreciation to Dr. V. 582
Mouslopoulou and the two anonymous reviewers whose suggestions and constructive comments 583
highly improved the structure and the maturity of the manuscript. The geophysical survey was 584
funded by Special Account for Research Grants of the UoA (contracts No. 70/4/7620 & 70/4/11078). 585
586
REFERENCES 587
Alexopoulos, J.D., Dilalos S., 2010. Geophysical research for geological structure determination in the 588
region of South Mesogheia (Attica). Bulletin of the Geological Society of Greece, XLIIII(4), 1898‐589
1906. 590
Alexopoulos, J.D., Fountoulis, I., Kampouris, P., Mariolakos, I., Papadopoulos, T., 2001. Geoelectrical 591
survey for Tatoi (Athens, Greece) blind fault. Bulletin of the Geological Society of Greece, 592
XXXIV(1), 121‐127 593
Asfahani, J., Radwan, Y., 2007. Tectonic Evolution and Hydrogeological Characteristics of the 594
Khanaser Valley, Northern Syria, Derived from the Interpretation of Vertical Electrical 595
Soundings. Pure and Applied Geophysics, 164(11), 2291‐2311. 596
Asfahani, J., Radwan, Y., Layyous, I., 2010. Integrated Geophysical and Morphotectonic Survey of the 597
Impact of Ghab Extensional Tectonics on the Qastoon Dam, Northwestern Syria. Pure and 598
Applied Geophysics, 167(3), 323‐338. 599
33
Athanassas, C., Fountoulis, I., 2013. Quaternary neotectonic configuration of the southwestern 600
Peloponnese, Greece, based on luminescence ages of marine terraces. Journal of Earth 601
Science, 24(3), 410‐427. 602
Athanassiou, A., 2000. Presence of fossil elephants in the area of Peniós valley (NW Peloponnesus, 603
Greece). Annales Géologiques des Pays Helléniques, 38 (C), 63‐76. 604
Brice, J.C., 1964. Channel patterns and terraces of the Loup Rivers in Nebraska, U.S. Geological Survey 605
Professional Paper, 422‐D, Washington. 606
Bridge, J.S., 2005. Rivers and Floodplains – Forms, Processes, and Sedimentary Record. Blackwell, 607
Oxford. 608
Bull, W.B., McFadden, L.D., 1977. Tectonic geomorphology north and south of the Garlock fault, 609
California. Geomorphology in arid regions. Proc. 8th Binghamton symposium in 610
geomorphology, 115‐138. 611
Bull, W.B., 1978. Geomorphic tectonic activity classes of the south front of the San Gabriel 612
Mountains, Caliiornia. U.S. Geological Survey Contract Report 14‐08‐001‐G‐394, 59. 613
Caputo, R., 2007. Sea‐level curves: Perplexities of an end‐user in morphotectonic applications. Global 614
and Planetary Change, 57(3–4), 417‐423. 615
Cotton, C.A., 1950. Tectonic scarps and fault valleys. Geological Society of America Bulletin, 61(7), 616
717‐758. 617
Cox, R.T., 1994. Analysis of drainage basin symmetry as a rapid technique to identify areas of possible 618
Quaternary tilt‐block tectonics: an example from the Mississippi Embayment. Geological 619
Society of America Bulletin, 106, 571‐581. 620
DePolo, C.M., Anderson, J.G., 2000. Estimating the slip rates of normal faults in the Great Basin, USA. 621
Basin Research, 12(3‐4), 227‐240. 622
Feng, L., Newman, A.V., Farmer, G.T., Psimoulis, P., Stiros, S.C., 2010. Energetic rupture, coseismic 623
and post‐seismic response of the 2008 MW 6.4 Achaia‐Elia Earthquake in northwestern 624
34
Peloponnese, Greece: an indicator of an immature transform fault zone. Geophysical Journal 625
International, 183(1), 103‐110. 626
Fountoulis, I., Mavroulis, S., Theocharis, D., 2007. Morphotectonic analysis and morphometric indices 627
application in the Lefkochori – Ochthia area (Central‐western Peloponnese, Greece), 8th 628
Panhellenic Congress of the Geographical Society of Greece, Athens, Greece, pp. 204‐214. 629
Fountoulis, I., Mavroulis, S., Vassilakis, E., Papadopoulou‐Vrynioti, K., 2013. Shoreline displacement 630
and Pineios River diversions in NW Peloponnese (Greece) as result of the geology, active 631
tectonics and human activity during the last 100 ky. Zeitschrift fur Geomorphologie, 632
Supplementary Issues, 57(3), 97‐123. 633
Fountoulis, I., Vassilakis, E., Mavroulis, S., Alexopoulos, J., Erkeki, A., 2011. Quantification of river 634
valley major diversion impact at Kyllini coastal area (W. Peloponnesus, Greece) with remote 635
sensing techniques. In: C. Grützner, T. Fernández Steeger, I. Papanikolaou, K. Reicherter, P.G. 636
Silva, R. Pérez‐López, A. Vött (Eds.), 2nd INQUA‐IGCP‐567 International Workshop on Active 637
Tectonics, Earthquake Geology, Archaeology and Engineering, Corinth, pp. 46‐49. 638
Garrote, J., Cox, R.T., Swann, C., Ellis, M., 2006. Tectonic geomorphology of the southeastern 639
Mississippi Embayment in northern Mississippi, USA. Geological Society of America Bulletin, 640
118(9‐10), 1160‐1170. 641
Guidoboni, E., Comastri, A., Traina, G., 1994. Catalogue of Ancient Earthquakes in the Mediterranean 642
Area up to the 10th Century. Ist. Naz. Geofis., Roma. 643
Hatzfeld, D., Pedotti, G., Hatzidimitriou, P., Makropoulos, K., 1990. The strain pattern in the western 644
Hellenic arc deduced from a microearthquake survey. Geophysical Journal International, 645
101(1), 181‐202. 646
Holbrook, J.M., Schumm, S.A., 1998. Geomorphic and sedimentary response of rivers to tectonic 647
deformation: a brief review and critique of a tool for recognizing subtle epeirogenic 648
deformation in modern and ancient settings. Tectonophysics(305), 287‐306. 649
35
Hollenstein, C., Geiger, A., Kahle, H.G., Veis, G., 2006. CGPS time‐series and trajectories of crustal 650
motion along the West Hellenic Arc. Geophysical Journal International, 164(1), 182‐191. 651
Imbrie, J., Hays, J.D., Martinson, D.G., A, M., Mix, A.C., Morley, J.J., Pisias, N.G., Prell, W.L., 652
Shackleton, N.J., 1984. The orbital theory of Pleistocene climate: support from a revised 653
chronology of the marine δ18 O record. In: A. Berger, J. Imbrie, J. Hays, G. Kukla, B. Saltzman 654
(Eds.), Milankovitch and Climate. Reidel, Dordrecht, pp. 269‐305 655
Kamberis, E., 1987. Geology and petroleum geology study of NW Peloponnese, Greece, PhD Thesis, 656
National Technical University of Athens, Athens, Greece. 657
Kamberis, E., Alexiades, X., Philipe, G., Tsaila‐Monopoli, S., Ioakim, X., Tsapralis, B., 1993. Geological 658
Map of Greece, scale 1: 50,000 IGME Athens, pp. Amalias sheet. 659
Keller, E.A., Pinter, N., 1996. Active Tectonics ‐ Earthquakes, Uplift and Landscape. Prentice Hall, New 660
Jersey. 661
Konstantinou, K.I., Melis, N.S., Lee, S.‐J., Evangelidis, C.P., Boukouras, K., 2009. Rupture Process and 662
Aftershocks Relocation of the 8 June 2008 Mw 6.4 Earthquake in Northwest Peloponnese, 663
Western Greece. Bulletin of the Seismological Society of America, 99(6), 3374‐3389. 664
Kontopoulos, N., Koutsios, A., 2010. A late Holocene record of environmental changes from Kotihi 665
lagoon, Elis, Northwest Peloponnesus, Greece. Quaternary International, 225(2), 191‐198. 666
Koukouvelas, I.K., Kokkalas, S., Xypolias, P., 2010. Surface deformation during the Mw 6.4 (8 June 667
2008) Movri Mountain earthquake in the Peloponnese, and its implications for the 668
seismotectonics of western Greece. International Geology Review, 52(2‐3), 249‐268. 669
Kraft, J.C., Rapp, G., Gifford, J.A., Aschenbrenner, S.E., 2005. Coastal change and archaeological 670
settings in Elis. Hesperia, 74. American School of Classical Studies at Athens, Princeton, NJ. 671
Lekkas, E., Fountoulis, I., Danamos, G., Skourtsos, E., Gouliotis, L., Mavroulis, S., Kostaki, I., 2008. 672
Seismic fractures related to the NW Peloponnesus (SW Greece) earthquake (ML=6,5R 8‐6‐673
2008), EERI, Preliminary Scientific Report 674
36
Lekkas, E., Papanikolaou, D., Fountoulis, I., 1992. Neotectonic Map of Greece, scale 1:100,000 Dpt of 675
Dynamic, Tectonic, Applied Geology. EPPO, Athens, pp. sheets Pyrgos – Tropaia. 676
Lekkas, E., Fountoulis, I., Papanikolaou, D., 2000. Intensity Distribution and Neotectonic 677
Macrostructure Pyrgos Earthquake Data (26 March 1993, Greece). Natural Hazards, 21(1), 19‐678
33. 679
Leopold, L.B., Wolman, M.G., 1957. River channel patterns: braided, meandering and straight, U.S. 680
Geological Survey Professional Paper, 282‐B, Washington. 681
Margaris, B., Athanasopoulos, G.A., Mylonakis, G., Papaioannou, C., , Klimis, N., Theodulidis, N., 682
Savvaidis, A., Efthymiadou, V., Stewart, J.P., 2010. The 8 June 2008 Mw 6.5 Achaia‐Elia, Greece 683
earthquake: Source characteristics, ground motions, and ground failure. Earthquake Spectra, 684
26(2), 399‐424. 685
Mariolakos, I., Lekkas, E., Danamos, G., Logos, E., Fountoulis, I., Adamopoulou, E., 1991. Neotectonic 686
evolution of the Kyllini Peninsula (NW Peloponnese, Greece). Bull. Geol. Soc. Greece, ΧΧV(3), 687
163‐176. 688
Mariolakos, I., Papanikolaou, D., Lagios, E., 1985. A neotectonic geodynamic model of Peloponnesus 689
based on morphotectonics, repeated gravity measurements and seismicity. Geol. Jb., B50, 3‐690
17. 691
Mavroulis, S., 2009. Fault activity assessment in NW Peloponnesus – The Andravida Earthquake 692
(08/06/2008) MSc Thesis, National and Kapodistrian University of Athens, 622 pp. 693
Mavroulis, S., Fountoulis, I., Lekkas, E., 2010. Environmental effects caused by the Andravida (08‐06‐694
2008, ML=6.5, NW Peloponnese, Greece) earthquake. In: A. Williams, G. Pinches, C. Chin, T. 695
McMorran, C. Massey (Eds.), Geologically Active: 11th IAEG Congress. Taylor & Francis Group, 696
Auckland, New Zealand, pp. 451‐459. 697
Mavroulis, S.D., Fountoulis, I.G., Skourtsos, E.N., Lekkas, E.L., Papanikolaou, I.D., 2013. Seismic 698
intensity assignments for the 2008 Andravida (NW Peloponnese, Greece) strike‐slip event 699
(June 8, Mw=6.4) based on the application of the Environmental Seismic Intensity scale (ESI 700
37
2007) and the European Macroseismic scale (EMS‐98). Geological structure, active tectonics, 701
earthquake environmental effects and damage pattern. Annals of Geophysics, 56(6), 702
10.4401/ag‐6239. 703
Menges, C.M., 1990. Late Quaternary fault scarps, mountain‐front landforms, and Pliocene‐704
Quaternary segmentation on the range‐bounding fault zone, Sangre de Cristo Mountains, New 705
Mexico. In: E. Krinitzsky, D. Slemmons (Eds.), Neotectonics in earthquake evaluation. 706
Geological Society of America Reviews in Engineering Geology, Boulder, Colorado, pp. 131‐156. 707
Ouchi, S., 1985. Response of alluvial rivers to slow active tectonic movement. Geological Society of 708
America Bulletin, 96(4), 504‐515. 709
Papadopoulos, G.A., Karastathis, V., Kontoes, C., Charalampakis, M., Fokaefs, A., Papoutsis, I., 2010. 710
Crustal deformation associated with east Mediterranean strike–slip earthquakes: The 8 June 711
2008 Movri (NW Peloponnese), Greece, earthquake (Mw6.4). Tectonophysics, 492(1–4), 201‐712
212. 713
Papadopoulos, T., Goulty, N., Voulgaris, N.S., Alexopoulos, J.D., Fountoulis, I., Kambouris, P.J., 714
Karastathis, V., Peirce, C., Chailas, S., Kassaras, J., Pirli, M., Goumas, G., Lagios, E., 2007. 715
Tectonic Structure οf Central‐Western Attica (Greece) based οn Geophysical Investigations‐716
Preliminary Results. Bulletin of the Geological Society of Greece, XXXX(3), 1207‐1218. 717
Papanikolaou, D., 1984. The three metamorphic belts of the Hellenides; a review and a kinematic 718
interpretation. In: J.E. Dixon, A.H.F. Robertson (Eds.), The geological evolution of the eastern 719
Mediterranean. Geol. Soc. Spec. Publ. Geological Society of London, Oxford, pp. 551‐561. 720
Papanikolaou, D., 1997. The tectonostratigraphic terranes of the Hellenides. Annales Geologiques des 721
Pays Helleniques , 37, 495‐514. 722
Papanikolaou, D., Fountoulis, I., Metaxas, C., 2007. Active faults, deformation rates and Quaternary 723
paleogeography at Kyparissiakos Gulf (SW Greece) deduced from onshore and offshore data. 724
Quaternary International, 171‐172, 14‐30. 725
Papazachos, B.C., Papazachou, C.B., 1997. The Earthquakes of Greece. Ziti, Thessaloniki. 726
38
Paraskevaidis, I., Symeonidis, N., 1965. Beitrag zur Kenntnis der Stratigraphie des Neogen von West 727
Peloponnes. Annales Géologiques des Pays Helléniques, XVI, 528‐544. 728
Ramírez‐Herrera, M.T., 1998. Geomorphic assessment of active tectonics in the Acambay graben, 729
Mexican Volcanic Belt. Earth Surface Processes and Landforms, 23(4), 317‐332. 730
Raphael, C.N., 1973. Late Quaternary Changes in Coastal Elis, Greece. Geographical Review, 63(1), 73‐731
89. 732
Rockwell, T.K., Keller, E.A., Johnson, D.L., 1984. Tectonic geomorphology of alluvial fans and 733
mountain fronts near Ventura, California. In: M. Morisawa, T.J. Hack (Eds.), Tectonic 734
Geomorphology. State University of New York, Binghamton, pp. 183‐207. 735
Rust, B.R., 1978. A classification of alluvial channel systems. In: A.D. Miall (Ed.), Fluvial 736
Sedimentology, pp. 187‐198. 737
Schumm, S.A., 1963. Sinuosity of Alluvial Rivers on the Great Plains. Geological Society of America 738
Bulletin, 74(9), 1089‐1100. 739
Shackleton, J.C., Andel, T.H.v., Runnels, C.N., 1984. Coastal Paleogeography of the Central and 740
Western Mediterranean during the Last 125,000 Years and Its Archaeological Implications. 741
Journal of Field Archaeology, 11(3), 307‐314. 742
Silva, P.G., Goy, J.L., Zazo, C., Bardajı,́ T., 2003. Fault‐generated mountain fronts in southeast Spain: 743
geomorphologic assessment of tectonic and seismic activity. Geomorphology, 50(1–3), 203‐744
225. 745
Stamatopulos, L., Voltaggio, M., Kontopulos, N., Cinque, A., La Rocca, S., 1988. 230Th/238U dating of 746
corals from Tyrrhenian marine deposits of Varda area (North–western Peloponnesus), Greece. 747
Geogr. Fis. Dinam. Quat. , 11, 99‐103. 748
Symeonidis, N., Therodorou, G., 1986. New locations of fossil Hippopotamus in northwest 749
Peloponnese. Annales Geologiques des Pays Helteniques, XXXIII (1), 51‐67. 750
Thenius, E., 1955. Hippopotamus aus dem Astien von Elis (Peloponnes). Annales Geologiques des 751
Pays Helleniques, VI, 206‐212. 752
39
Theocharis, D., Fountoulis, I., 2002. Morphometric indices and tectonically active structures: the case 753
of Salamis island, 6th Panhellenic Geographical Congress, Geogr. Soc. Greece, pp. 97‐106. 754
Thieler, E., Himmelstoss, E., Zichichi, J., Ergul, A., 2009. Digital Shoreline Analysis System (DSAS) 755
version 4.0‐An ArcGIS extension for calculating shoreline change, U.S. Geological Survey. 756
Underhill, J.R., 1988. Triassic evaporites and Plio‐Quaternary diapirism in western Greece. Journal of 757
the Geological Society, 145(2), 269‐282. 758
Vassilakis, E., Royden, L., Papanikolaou, D., 2011. Kinematic links between subduction along the 759
Hellenic trench and extension in the Gulf of Corinth, Greece: A multidisciplinary analysis. Earth 760
and Planetary Science Letters, 303(1‐2), 108‐120. 761
Waelbroeck, C., Labeyrie, L., Michel, E., Duplessy, J.C., McManus, J.F., Lambeck, K., Balbon, E., 762
Labracherie, M., 2002. Sea‐level and deep water temperature changes derived from benthic 763
foraminifera isotopic records. Quaternary Science Reviews, 21(1‐3), 295‐305. 764
Wallace, R., 1977. Profiles and ages of young fault scarps, north‐central Nevada. Geological Society of 765
America Bulletin, 88(9), 1267‐1281. 766
Wells, S.G., Bullard, T.F., Menges, C.M., Drake, P.G., Karas, P.A., Kelson, K.I., Ritter, J.B., Wesling, J.R., 767
1988. Regional variations in tectonic geomorphology along a segmented convergent plate 768
boundary pacific coast of Costa Rica. Geomorphology, 1(3), 239‐265. 769
Zámolyi, A., Székely, B., Draganits, E., Timár, G., 2010. Neotectonic control on river sinuosity at the 770
western margin of the Little Hungarian Plain. Geomorphology, 122(3–4), 231‐243. 771
Zohdy, A.A.R., 1989. A new method for the automatic interpretation of Schlumberger and Wenner 772
sounding curves. Geophysics, 54(2), 245‐253. 773
774