Embed Size (px)
Citation preview

1
2
1. STRATEGIC CASE ....................................................................................................... 14
1.1 Introduction - our South East Hampshire Rapid Transit bid .................................................................... 14
1.2 Three packages of investment................................................................................................................. 14
1.3 High investment package ........................................................................................................................ 14
1.4 Medium investment package ................................................................................................................... 15
1.5 Low investment package ......................................................................................................................... 15
1.6 SEHRT context ........................................................................................................................................ 17
1.7 Future situation (without SEHRT) ............................................................................................................ 28
1.8 SEHRT ..................................................................................................................................................... 31
1.9 The SEHRT Outcomes ............................................................................................................................ 42
1.10 Constraints, dependencies and stakeholder views ................................................................................. 50
1.11 SEHRT interface with FMZ and CAZ investment .................................................................................... 57
1.12 SEHRT impact on other transport networks ............................................................................................ 59
1.13 Conclusion ............................................................................................................................................... 61
2. ECONOMIC CASE ........................................................................................................ 64
2.1. Introduction .............................................................................................................................................. 64
2.2. Overview of economic appraisal approach .............................................................................................. 64
2.3. Modelling approach ................................................................................................................................. 65
2.4. Estimation of programme costs ............................................................................................................... 69
2.5. Estimation of programme benefits ........................................................................................................... 70
2.6. Economic appraisal results ...................................................................................................................... 74
2.7. Reporting of results .................................................................................................................................. 93
2.8. Sensitivity Tests ..................................................................................................................................... 105
2.9. Indicative non-monetised impacts ......................................................................................................... 111
2.10. Value for money statement .................................................................................................................... 112
3. COMMERCIAL CASE ................................................................................................. 114
3.1 Introduction ............................................................................................................................................ 114
3.2 Market engagement and procurement strategy: transport operators .................................................... 114
3.3 Market engagement and procurement strategy: infrastructure schemes .............................................. 117
3.4 Non-infrastructure schemes ................................................................................................................... 122
4. FINANCIAL CASE ....................................................................................................... 126
4.1 Introduction ............................................................................................................................................ 126
4.2 Project (Capital) Costs ........................................................................................................................... 126
4.3 Operation and Maintenance (O&M) Costs, and their Sustainability beyond the Fund period ............... 130
4.4 Other elements of whole-life cost .......................................................................................................... 131
4.5 Funding Profile ....................................................................................................................................... 131
4.6 Acceptance of financial responsibility for the project, going forward ..................................................... 133
4.7 Source of local contributions .................................................................................................................. 134
4.8 How Funding has been secured ............................................................................................................ 134

3
4.9 S151 Officer confirmation ...................................................................................................................... 135
5. MANAGEMENT CASE ................................................................................................ 137
5.1 Introduction ............................................................................................................................................ 137
5.2 Structure of the management case ....................................................................................................... 137
5.3 Governance ........................................................................................................................................... 138
5.4 Programme assurance and Local Assurance Framework .................................................................... 140
5.5 Delivery plan and dependencies ........................................................................................................... 141
5.6 Timetable ............................................................................................................................................... 143
5.7 Partners' delivery track record on previous, similar projects ................................................................. 145
5.8 Programme organisation ....................................................................................................................... 146
5.9 Communications and stakeholder management ................................................................................... 147
5.10 Risk management strategy .................................................................................................................... 151
5.11 Change management ............................................................................................................................ 154
5.12 Benefits realisation strategy, framework and outlines plan ................................................................... 158
5.13 Monitoring and Evaluation Plan (MEP) .................................................................................................. 164
5.14 Programme closure ............................................................................................................................... 168

4

5
Executive Summary
Working in partnership with our local transport operators, Portsmouth City Council, Hampshire County Council and Isle of Wight Council are united in our ambition and commitment to deliver a transformational rapid transit network across the Portsmouth city region.
As this bid demonstrates, the significant connectivity challenges in this unique area, unaddressed for many years, are significantly adversely impacting on productivity, air quality and social inclusion, a trend which is set to continue, and worsen, without significant intervention.
We are confident that, with a BCR of 2.29:1 when adopting the policy choice to accept marginal dis-benefits to general traffic for the purposes of providing bus priority, and 1.7:1 when including dis-benefits, the South East Hampshire Rapid Transit (SEHRT) High Package will deliver the comprehensive interventions, at the scale necessary, to boost the productivity and sustainability of the city region. This will open up opportunities to all of our communities to reach employment, education, leisure and health facilities enabling the city region to prosper and reach its full potential.
For a visual representation of SEHRT, please watch the information video here
About this business case
This Strategic Outline Business Case (SOBC) presents the case for investment in the transformational SEHRT proposition. As required by the DfT, three packages, representing high, medium and low levels of TCF investment, are set out in the bid. Our ambition is for the high level of investment for the strong reasons outlined below.
This SOBC follows HM Treasury and DfT advice as set out in the Green Book, the DfT's Transport Business Cases and TAG. In line with the five-case model. It provides the evidence that:
the programme is supported by a compelling case for change; it aligns with local, regional and national
objectives; and a robust option selection process has been undertaken (the Strategic Case)
the programme represents value for money (the Economic Case)
the approach to finance and procurement is robust (the Commercial Case)
the required costs and funding involved is understood and that securing delivery of benefits is financially
sustainable (the Financial Case)
what is required from all parties is achievable (the Management Case)
The Strategic Case
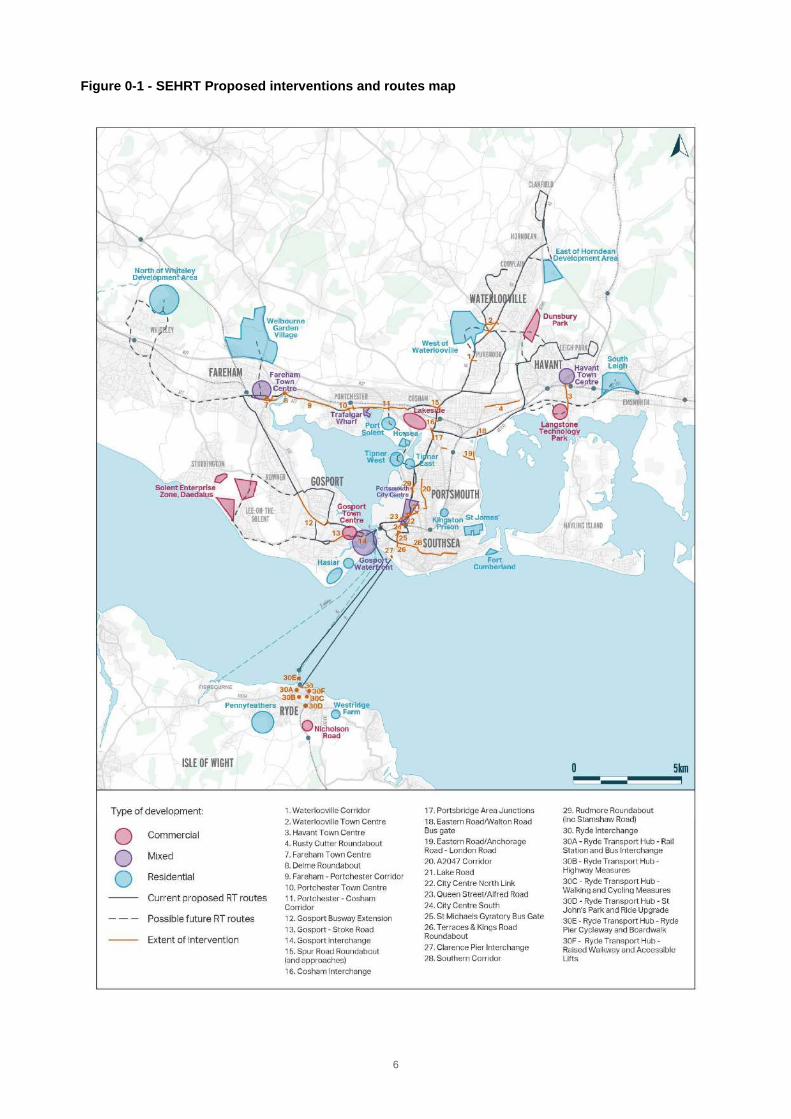
The Portsmouth city region is fundamentally shaped by its island and peninsula geography (see Figure 0-1)
The evolution of its urban form and transport networks has been constrained and determined by over 100 miles of coastline, two islands and a peninsula with limited bridge links, and the extended separation of the interdependent communities to the periphery of the city which continues to negatively impact upon connectivity and productivity.
The Portsmouth city region lags behind the UK average both in terms of GVA and competitiveness: employment is concentrated in low productivity sectors, and there is a low retention of skilled labour and university graduates. Without intervention this trend is set to continue.
The structure of the sections of the Strategic Case is built around our core rationale expressed through the logic map below. It links the context and the challenges facing the Portsmouth city region to the SEHRT proposition and the Transforming Cities Fund objectives and outcomes.
6
Figure 0-1 - SEHRT Proposed interventions and routes map

7
Figure 0- 2 - SEHRT Logic map

8
It is on the peripheries of the city where some of the highest levels of deprivation are observed. The 2019 report "Left Behind? Understanding communities on the edge" identifies Gosport, Leigh Park, Wecock Farm and Paulsgrove as being 'left behind': areas which suffer from poor connectivity, with long travel times to key services and opportunities in the centre of the city region.
Limited public transport options, with infrastructure deficits across all modes, have meant that the majority of labour mobility in the city region is achieved by driving: most travel flows in the city region, notably including many into Portsmouth city itself, have a car mode share of 70% or more, which is leading to congestion, and further reducing the attractiveness of public and active travel modes.
Without significant intervention this trend is set to continue, and indeed, increase through the delivery of ambitious growth targets for the city region, negatively impacting on productivity, air quality and social inclusion.
Identified through a robust optioneering process, South East Hampshire Rapid Transit (SEHRT) will build on the initial rapid transit network and the infrastructure and services (STAR and Eclipse) already successfully delivered in the city region in partnership with bus operators, to address the accessibility and connectivity limitations of this distinctive city region which are limiting its productivity.
SEHRT will deliver the core of an ambitious, comprehensive and genuinely transformative new mass public transport and active travel network which offers a realistic, commercially viable and environmentally sustainable alternative to car travel:
Enhanced bus rapid transit network (delivered through Quality Bus Partnerships) and a
revised local bus network, targeting key commuting corridors;
Complementary and enabling junction and corridor infrastructure improvement schemes;
Excellent “First /Last Mile” access to/from rapid transit stops;
Enhanced transport hubs and interchange improvements with other modes (particularly
waterborne) at key destinations;
Active travel networks expansion and improvement;
Enhanced customer experience; and
Complementary policy measures to help drive mode shift.
In order to maximise the outcomes from this infrastructure investment, this bid is supported by commitments from our bus operators to invest in commercial bus services, vehicles and ticketing facilitated through a Quality Bus Partnership (QBP). The QBPs will also ensure that the ongoing real time savings and improved reliability are reinvested to provide a transformational change. Our local authority partners have also committed to deliver a framework of supportive policies, measures and local investment in order to maximise the benefit from the investment sought.
Strategic level assessments demonstrate that TCF outcomes will be delivered by each of the three packages. It is, however, the high package that better embeds sustained longer term benefits, to more people, over a wider geographical area, delivering significant and sustained mode shift away from the car. The high package also delivers further second and third order benefits which are not, due to this being a Strategic Outline Business Case rather than a Full Business Case, currently included within the BCR calculations, but will serve to further enhance the wider TCF outcomes delivered.

9
Economic Case
Extensive modelling has been undertaken in accordance with the DfT guidance, and using the fully WebTAG compliant Solent Regional Transport Model (SRTM), to demonstrate the programme's value for money.
As per the WebTAG guidance, the Economic Case presents the BCR for each investment package inclusive of highway dis-benefit, resulting in the following BCRs for the high, medium and low packages respectively: 1.7 (H), 2.3 (M), 2.3 (L), all providing 'medium' or 'good' value for money.
In recognition of the fact that the reallocation of road space away from the private car is required in some cases to provide appropriate priority to buses, and the increased journey times that will necessarily result to general traffic, the BCRs have also been calculated excluding marginal impacts (within 2 minutes, positive or negative) on general traffic delivering:
BCR of 2.4 for the high scenario
BCR of 3.2 for the medium scenario
BCR of 2.3 for the low scenario
Whilst this conscious policy choice has been made in response to the unique challenges experienced within the Portsmouth city region, and the significant benefits that can be derived through the SEHRT proposition, it has been achieved with minimal additional time for the vast majority of vehicle users.
In addition, the High Package delivers the following key benefits:
Delivers GREATEST amount of 5 minutes improvement in journey times for public transport
users;
Largest benefit for public transport users of £608.1m;
Vast majority of highway travel disbenefit is limited to 2 min per trip or less;
100,000 increase in the population catchment within 45 minutes travel to Portsmouth city
centre, passenger demand increase of 29%;
Reduction in 12,000 person trips by highway per day in 2041;
Greatest benefit delivered for the target market of the 10-15km journeys;
Lowest funding requirement for bus operating costs due to enhanced efficiency of services –
provides an opportunity for further investment in the area;
Largest accident reductions, giving £9.0m of benefits; and
Greatest health benefits of £7.8m delivered from active travel modes
Commercial Case
The commercial case demonstrates the programme’s strong commercial viability and procurement strategy.
Solent Transport brings together the local highway authorities, while the South Hampshire Bus Operators Association (SHBOA) brings together the region’s operating groups and independent operators. Their history of success together includes the Star and Eclipse bus priority corridors, the recent large Local Sustainable Transport Fund programme, the Solent Go multi-operator smartcard, area-wide contactless ticketing and other similar projects.

10
Infrastructure schemes will be procured by the relevant local authorities.
Existing supplier arrangements as set out in the commercial case will be used. These arrangements have been shown to provide value for money and have a strong track record of enabling delivery of complex infrastructure projects on time and to budget.
The SEHRT programme is a partnership that combines publicly funded infrastructure and complementary measures with operator-funded investment in vehicles and service frequencies, following a principle of co-design. This provides operators with a bottom line economic driver for success.
For this reason a new, two-part voluntary quality bus partnership has been developed. The first part of the QBP has binding commitments for the short to medium term, the second part with a statement of intent and direction of travel for the medium to long-term. This is seen as the most effective way to proceed as the commercial partners take the business risk and local authorities commit to essential ongoing complementary measures.
All SEHRT routes will be operated on a commercial basis.
Financial Case
The Financial Case sets out the level of investment required to deliver the scheme outputs, it includes the financial profile and funding arrangements, and the amount of money required from the Transforming Cities Fund.
The investment costs are primarily:
Infrastructure scheme costs, which have been estimated based on initial design work for
each scheme; and
Transport operators’ incremental capital costs associated with the change in the size of their
vehicle fleet as part of the initial introduction of the rapid transit routes. These have been
estimated based on the anticipated vehicle requirement. These costs will be met by the
operators themselves, as a ‘local match’ to the TCF funding.
The investment sought through the packages will lever in significant match funding from the public and private sector: £61m in the high investment package (19% of the total), £55m in the medium package and £54m in the low package
The costs and contributions are summarised in the table below. The financial case gives further breakdowns, including year-by-year spend profiles over the TCF funding period 2019/20 to 2022/23.
Source: Table 1-5 of Financial Case The financial case also sets out how the ongoing operational, maintenance and renewal costs will be met, confirming that the services and schemes will be financially sustainable for the long term.
£m’s % £m’s % £m’s %
Total Scheme Costs £ 321.96 100% £ 217.54 100% £176.01 100%
TCF Contribution £261.90 81% £162.51 75% £122.25 69%
Total public sector contribution £17.67 5% £12.63 6% £11.35 6%
Other local/private sector contribution £42.40 13% £42.40 19% £42.40 24%
High Investment
Scenario
Medium Investment
Scenario
Low Investment
Scenario

11
Management Case
The bidding partnership has a proven track record of delivering projects of comparable scale, profile and complexity, including the Eclipse and Star bus rapid transit corridors, Portsmouth Park and Ride, and The Hard Interchange.
Programme governance has been developed to support the partnership, and to ensure robust oversight of programme delivery. The following structure has worked effectively for the delivery of this bid and TCF Tranche 1 (currently on budget and set for completion as programmed), and will continue throughout the delivery phases of the SEHRT proposition:
SEHRT Board: which includes councillors and senior officers. This is the main decision-making
body;
SEHRT Partnership Group: which includes senior representatives from partner and stakeholder
organisations such as public transport operators and borough/district councils. This provides
regular updates to stakeholders and has working groups covering specific workstreams; and
SEHRT Programme Group: which includes project managers from each local authority, supplier
team leads and finance officers. This is an operational delivery group to monitor progress and
risks.
The Senior Responsible Officer (SRO) leads the overall programme and is accountable for the delivery of the programme, supported by a fully resourced programme team as outlined in the Management Case. Appropriate programme and project management processes and documentation have been developed, ensuring rigour and consistency across all projects. Details of programme management arrangements and project-level governance is set out in the Management Case.
Risks are managed at both programme level (strategic risk register) and at project level and updated and reported to the SEHRT Board on a monthly basis. All three local authorities have established arrangements for programme and project management and delivery, and an excellent track record of successfully delivering schemes of similar complexity. A communications and engagement plan and a stakeholder management plan is in place and working effectively. A detailed benefits realisation plan and a monitoring and evaluation plan is set out in the management case.
The extensive work that has been undertaken on the deliverability of this ambitious programme is outlined in this case. an indicative programme is included, demonstrating the ability of the partners to deliver this programme within the required timescales, with work continuing ahead of confirmation of funding to ensure readiness.
Building on delivery of Tranche 1 Transforming Cities Fund (TCF)
The Portsmouth city region submitted a successful expression of interest for the DfT’s Transforming Cities Fund (TCF), focused on the SEHRT vision.
Tranche 1 focused on early infrastructure schemes that could start delivery in the 2018/19 financial year. Tranche 1 is on target to deliver by March 2020:
Real-Time Information (RTI) on corridors from Portsmouth city centre to Havant and
Waterlooville to improve customer experience on the existing bus network through ‘at stop’
improvements;

12
Three Microprocessor Optimised Vehicle Actuation (MOVA) installations at key junctions on
Portsea Island to improve bus time reliability and journey times. Low-level signals will provide an
early release to improve safety and the overall experience for cyclists; and
An enhancement to the consented Eclipse busway extension at its junction with Rowner Road to
improve access to public transport for Gosport residents. The enhancement will also support
existing high levels of walking and cycling in the area with reduced journey times and access to
high quality off-road route
13

14
1. Strategic Case
1.1 Introduction - our South East Hampshire Rapid Transit bid
This Strategic Outline Business Case (SOBC) has been developed by Portsmouth City Council, Hampshire County Council and Isle of Wight Council in a bid to the Government’s Transforming Cities Fund to deliver the next transformational phase of South East Hampshire Rapid Transit. We have worked in close partnership with our local transport operators and the borough councils for Fareham, Gosport and Havant.
1.2 Three packages of investment
Three packages of investment have been developed and are presented in this Bid, as per the Transforming Cities Fund (TCF) guidance.
1.3 High investment package
While each package will deliver improvements in connectivity and productivity, thereby achieving to varying degrees the primary and secondary objectives of the TCF (as detailed in section 1.7.2), it is the high investment package that will deliver the comprehensive interventions, at the scale necessary, to boost the productivity and sustainability of the city region, and to open up opportunities to all of our communities to reach employment, education, leisure and health facilities enabling the city region to prosper and reach its full potential.
It also delivers further second and third order benefits which are not, currently included within the economic appraisal calculations, due to the stage of development as a SOBC rather than a Full Business Case. These are summarised below:
Increasing the labour market: the high package increases the population catchment within
45 minutes travel to Portsmouth city centre by almost 100,000 and the modelling shows
passenger demand up by 29%;
Bus Operator Commitment: increased passenger demand supports the viability of the
commercial investment and the potential for higher frequencies as we have seen with
Eclipse. Operator reinvestment in Eclipse has seen the fleet replaced after five years and
weekly timetabled journeys increase from 1,600 to over 2,000 a week;
Busway Extension: Extension of the flagship Eclipse Corridor which has delivered over 65%
growth in patronage over the last seven years, a 20% mode shift from private car, and a
6.71:1 Benefit-Cost Ratio;
Havant Corridor: journey time improvements for local buses particularly around improving
access to the industrial estates at Anchorage Park, further improving the operation of local
bus services and access to employment; and
Unlocking Regeneration Opportunities: The transformative scheme at Portchester District
Centre will unlock highway land for development, better connect the railway station with
the district centre and make significant improvements to the public realm. Whilst these
benefits have not been captured as part of the monetised assessment that forms the
economic case as part of this SOBC, these benefits and outcomes related to this proposition
are highly significant in providing large-scale enhancement to the South East Hampshire
area.

15
For these reasons, it is the high investment aspiration that is commended to the DfT, enabling a truly transformational change in South East Hampshire. Table 1-1 shows the elements included in the high investment package.
1.4 Medium investment package
Economic evaluation has provided evidence that the ‘medium’ aspiration bid, though with reduced levels of infrastructure, provides a strong and compelling case for investment with excellent value for money in terms of benefits realised in the short term.
The medium aspiration package does not however include to the same extent as the ‘high’ package, measures to manage general traffic, which are likely to most encourage the bus operators to go further and faster with their commitments to network enhancements. In the same way, the scope for the local authorities to introduce with certainty, supporting measures such as car parking management will quicken or slacken, linked to the extent to which greater levels of accessibility can be provided through SEHRT in support of their local economies. The medium aspiration bid is therefore likely to fall short in leveraging from the operators and local authorities the full wider benefits package secured by the high aspiration bid.
1.5 Low investment package
Evidence supporting this bid indicates that the combined effect of journey time savings from the even further reduced infrastructure schemes in the ‘low ask’ are sufficient to enable bus operators in the short term to reinvest in service redesign based upon a core rapid transit network with a turn up and go frequency, supported by local bus services. The low ask is therefore the ‘minimum viable product’ to establish a core rapid transit network linking the towns and city. However, the proposed changes are less likely than the medium or high aspiration bids to secure the additional benefits of operator investments and local authority policy support in the medium to longer term. The medium and low asks are not corridor based because it is only the SEHRT network as a whole that can provide the wider network performance enhancements for existing and future development scenarios sought across South East Hampshire.
The monetised commitments offered by the operators and Local Authorities are broadly the same in all packages, meaning that the benefits assessed for the higher investment packages are conservative. The operators and local authorities have made initial commitments based upon sound commercial principles and support overall levels of accessibility and performance of local economies. However, our ability to go further as a partnership is embedded in our track record and in the letters of intent provided in support of this bid.
Air Quality Clean Air Zone (CAZ) as well Future Mobility Zone (FMZ) measures complement the SEHRT with parallel propositions; details can be found in sections 1.9.1 and 1.9.2 respectively.
Managing Director of First Bus UK has stated that: "First Bus believes that the South East Hampshire area has real potential to increase bus use, as evidenced by Eclipse, and furthermore, that the island and peninsular geography and limited rail network means that only bus rapid transit can make effective use of the necessarily limited highway network. Without the step change which rapid transit can offer, worsening congestion will continue to impact negatively on bus performance and passenger levels and the wider economy and community."

16
Table 1-2: Summary of SEHRT Asks
Workstream Area
Element Investment Package
High Medium Low
Rapid transit Services
Leigh Park – Portsmouth Six buses/hour across the network 10/hr Gosport - Fareham 12/hr Waterlooville -
Portsmouth 18/hr Cosham - Portsmouth 24/hr Hilsea - Portsmouth
Up to 4 ferries an hour
Wecock Farm – Waterlooville – Portsmouth
Horndean – Waterlooville – Portsmouth
Gosport – Fareham - Portsmouth
Ryde - Portsmouth high speed ferries
Consequential Changes to Local Bus Services
Local Bus 3 Southsea – Fareham Six buses per hour Southsea - Portchester Precinct of which 2
buses per hour continue to Fareham (down from six buses per
hour at present throughout the route).
Local Bus 23 Leigh Park – Portsmouth – Southsea rapid transit Stop Infrastructure
Five buses per hour (down from six buses per hour at present)
Customer Experience
and First/Last Mile Access
Rapid transit Stop Infrastructure Yes in all packages (number of stops improved varies
in line with package) Enhanced First/Last Mile Access to Stops
Multi-operator tap on tap off ticketing
Rapid transit High Quality vehicle fleet
Distinctive Branding and Marketing
Junction and Corridor
Improvement Schemes
Schemes in Hampshire 13 8 5
Schemes in Portsmouth 13 11 8
Interchange Schemes
Fareham Bus Station Yes No No
Gosport Interchange Yes Yes
Cosham Interchange No
Clarence Pier Interchange No
Ryde Transport Hub Yes
The structure of the remaining sections of this Strategic Case is built around our core rationale expressed through the logic map (Figure 1-3) below that links the context and the challenges facing the Portsmouth city region to the SEHRT proposition and the TCF objectives and outcomes.

17
Figure 1-3: SEHRT Logic Map
1.6 SEHRT context
The Portsmouth city region is characterised by its poor transport connectivity in the following two key aspects:
(i)- Interdependent urban communities separated by island and peninsula geography.
(ii)- Fragmented travel networks, dominated by private car, which are reaching and exceeding capacity.
Case Study:
The Eclipse bus rapid transit service, launched in 2012 has shown regular increases in journeys offered with a timetable of just under 1600 journeys a week, that has increased on three occasions since with over 2000 journeys a week now on offer. The Eclipse service has generated increased patronage levels with 65% growth in use and 20% of mode shift from the car. Services currently run at a 6-minute frequency rather than the initial 10-12 minutes frequency upon which the business case was built. It has also generated a profit share that has been reinvested into further infrastructure provision. KPMG reported that each £1 invested in Eclipse produced £6.71 in benefits demonstrating a proven record of delivery for the TCF bid partner.

18
1.6.1 Geographical separation
The Portsmouth city region has been fundamentally shaped by its island and peninsula geography.
The evolution of its urban form and transport networks has been constrained and determined by its coastline, three islands, limited bridge links, and the separation of the interdependent communities which continues to negatively impact upon connectivity and mobility (due to complex commuting patterns and high levels of car dependency in the city region).
This is further constrained by important environmental designations. The city is some 30% covered by statutory nature conservation designations protected from new development. There are Sites of Special Scientific Interest (SSSIs) at Portsdown Hill, Langstone and Portsmouth Harbours, of which the latter two are also Ramsar Sites and Special Protection Areas. Langstone Harbour also forms part of the wider Solent Maritime Special Area of Conservation. Portsmouth also provides feeding sites to Brent Geese and waders, and has sites categorised as local wildlife sites because they contain rare species and valuable habitats1.
Portsmouth is the UK's only majority island (Portsea Island) city, connected by just three road links and one rail link onto the mainland.
Much of the historic urban form of Portsmouth has been retained, and while providing a strong sense of identity, the narrow streets have created intense competition between vehicle traffic and parking, bus lanes, cycle routes, and pedestrian facilities, all vying for the same limited space. Evolution and development of public transport and walk and cycle networks has historically been constrained by the lack of space.
Historically there have been challenges to reallocate road space, particularly when having to be considered on a piece-meal basis. SEHRT offers an opportunity to significantly move the dial on public transport and active travel provision at a scale that has secured unprecedented public support and a political commitment to facilitating delivery. Section 5.9 presents the public and political support for rapid transit-based solutions.
The existing density of development within Portsmouth, and the clear barriers to expansion, necessitated extensive development during the post war era outside of the economic centre of Portsmouth in areas such as such as Leigh Park, Paulsgrove or Wecock Farm. The extended separation of Portsmouth's feeder communities, has negatively impacted on the connectivity within the city region, embedding the dominance of car travel, and limiting mobility and productivity as is explored in the next section.
1.6.2 Fragmented travel networks
The historical growth of housing estates and developments sites located outside the city and lack of investment in public transport infrastructure has led to fragmented travel networks, dominated by private cars and putting great stress on the capacity of the highway network.
1 https://www.portsmouth.gov.uk/ext/documents-external/pln-local-plan-biodiversity-background-paper-final-draft-feb-2019.pdf
The transport network is limited in its extent by land availability in urban areas and the island and peninsula geography, which means the transport corridors are heavily congested.
High and unreliable journey times on existing public transport means public transport is non-competitive with car and without the investment in SEHRT, inducing the required behavioural change to achieve mode shift to public transport is unlikely.

19
Combined with the island and peninsular geography, public transport journeys involve either frequent or time-consuming interchange between modes, with an associated cost penalty, or long and frequently unreliable inconsistent journey times, often following circuitous routes from island to peninsula. It also leads to journeys concentrating on a small number of congested highway corridors.
With the exception of Havant to Portsmouth, rail service frequencies are low, and headways are uneven, making these services unattractive for medium-distance journeys in the city region. The towns of Gosport and Waterlooville do not have direct rail services. Many medium-distance journeys can be made by local bus services but in reality, as a result of congested highways network and a severe lack of priority for public transport, most medium to long bus routes in the sub-region cater for an overlapping series of local flows rather than end to end medium-distance journeys. Variability in journey times as a result of congestion means that even users of buses for short journeys experience uncertain waiting times and journey time unreliability.
Bus lane provision in the city region is discontinuous and fragmented, meaning for large proportions of journeys, buses share lanes with private cars, and therefore are subject to the same congestion and delays. The unreliable journey times on local bus services from the further reaches of the city region to the city centre (for example from Leigh Park in Havant, Wecock Farm in Waterlooville and Rowner in Gosport) mean that bus travel is not an attractive proposition as an alternative to car travel.
Ferry services form an important part of the city region’s public transport network, yet these are generally not well integrated with other parts of the network. Interchange facilities between modes remain poor and services disjointed, with limited integration of timetables and ticketing.
The limited dedicated cycle facilities and general priority for cyclists in the city region has resulted in a relatively unwelcoming cycling environment. There are no fully segregated continuous cycle routes into the city centre, and evidence from a recent Audit in preparation for the LCWIP concluded that 75% of the 83 route sections surveyed in the City were identified as substandard in one or more assessment criteria using DfT's route auditing tools.
The same picture is also true for the other towns within the city region, notably Gosport. Gosport shares the same characteristics of a flat topography, dense urban network, close proximity of destinations with active travel and public transport modes having to compete with other users on congested networks.
All the above-mentioned points have led to long-term reductions in public transport and active travel modes usage, even into the relatively well-connected city centre, and dominance of car journeys in the city region as discussed in the section below.
1.6.3 Car dominance and poor transport connectivity
The natural advantages that have created Portsmouth as a great maritime city have also constrained its development. Within the more densely developed urban cores, many trips can relatively easily be undertaken by active travel with local bus services struggling to obtain market share and car travel is increasingly seen as the most viable alternative.
Even for flows where driving is considerably less direct than public transport option, driving still is the mode of choice for many commuters - for example 51% of Gosport residents drive to work in Portsmouth, despite this requiring a circuitous 10-15 miles drive on congested routes around Portsmouth Harbour (compared to a crow-fly distance of not more than five miles).

20
In the same way, the geography has required suburban development to be relatively remote from the core urban areas, separated by the Solent, Portsmouth Harbour, Langstone Harbour, and to some extent Portsdown Hill, some with high value environmental designations.
As a result, most of the labour mobility in the city region is achieved by driving: most travel flows in the city region, notably including many into Portsmouth city itself, have a car mode share of 70% or more.
The suburbs are not directly adjacent to the city but instead at some distance and rely upon the limited number of congested corridors, a railway line or ferry services linking the islands to the mainland. As well as being far apart in terms of distance, the nature of these links between the different parts of the city region means that they are even further apart in terms of time and convenience. For local bus this means very long bus journeys from the edge of the urban area fail to compete with car travel as the mode of choice. This has been embedded further through development of housing and jobs along the motorway corridors.
Buses are generally perceived to be unappealing due to slow routes, high costs, the need for multiple interchanges and inconsistent links to and between key workplace and leisure areas, as was explained in our most recent customer insights survey: "to go to the leisure centre is a 40 min bus journey, then a change with a wait of 15 mins, then on a bus again for 10 min."2
This is encouraged and supported by inexpensive long stay parking at key city centre locations and over supply of car parks offering near guaranteed availability for commuters. Ryde, on the Isle of Wight, experiences similar issues with a large capacity of relatively inexpensive parking near the Ryde Transport Hub and in the wider town centre region.
Over recent years, the rise in congestion on the main routes linking the city region together has meant that the services and facilities provided by city centre have become even more remote and this decline is set to continue with the proposed level of development, some of which will inevitably occur at the urban edge. The ability of local bus to retain even current levels of market share will be significantly challenged.
1.6.4 Challenges
The limitations of the transport network and resultant poor connectivity described above is perpetuating and exacerbating the wider challenges faced by the region, in particular:
Congested highway network;
High levels of deprivation and reduced life outcomes;
2 Clare's report

21
Significant exceedances in air pollution;
Low levels of productivity; and
Sustainable delivery of the identified need for additional housing and employment floor
space.
These are each discussed in more details below.
1.6.5 Congested highway network
Local journeys to work from the wider city region to Portsmouth city centre have limited corridor options (A3023 onto Hayling Island, A2030 Eastern Road, A3 and M275 onto Portsea Island, A32 and B2133 onto Gosport peninsula) due to the island and peninsula geography. Portsmouth itself only has three roads (M275, A3, and the A2030) and one rail link between the island where the majority of economic activity is concentrated and the mainland with onward strategic connections. On the Gosport peninsula there is only one A class road, the A32, where exceptional levels of congestion and road safety issues have been observed. This limited number of corridors leads to congestion, delay and high journey times, especially for buses. Hayling Island, with a population of 17,000 is served by only one road that frequently experiences severe congestion especially during peak work day travel periods and holiday periods.
Despite the bus priority lanes that have been introduced, they only benefit limited sections on a limited number of routes into the city. Consequently, most of the city’s bus services have limited priority and share the same traffic congestion as private vehicles during morning and evening peak periods. This often means that bus travel is slower than the equivalent journey by car, and our evidence-base shows areas in the city where buses often travel less than 10km/hour due to congestion.3
The limited choice of routes on and off the islands and peninsula creates a network that lacks resilience such that even minor delays on one corridor can quickly lead to gridlock across the wider network. The impact of such congestion has a disproportionate impact upon local bus routes.
Our journey time reliability analysis of the Real Time Information (RTI) system for October 2017 for selected high-frequency bus services in South East Hampshire shows that, on one day in the sample, passengers waited 60% longer due to congestion. The analysis also showed that passengers wait on average 20%-30% more than they might expect based upon the scheduled timetable.
Longer travel time has had the consequence of shrinking labour pools. Research for Birmingham, by the Open Data Institute in Leeds, showed that the population within a given travel to work time had reduced by 41% in the 10 years to 2018 due to growing congestion. The island and peninsula geography and convoluted travel routing means that the Portsmouth city region already has a significantly smaller labour force area within a 30-minute travel time before any congestion impacts are taken into account. Over the last 40 years, journey times have increased significantly, for example from Leigh Park to the city centre has increased from 43 minutes to 54 minutes.
3 Portsmouth City Council Local Transport Plan 3
The city region is caught in a vicious cycle of too many cars, on too few corridors, causing severe congestion, environmental degradation, isolating communities and limiting productivity. Already long journey times have worsened as congestion has grown making public transport more expensive to provide and less attractive to use. Without a significant intervention to disrupt these trends, this is set to continue.

22
1.6.6 High levels of deprivation and reduced life outcomes
The fundamental and significant impact of poor connectivity on socio-economic outcomes, and indeed the exclusion of many low-income communities is well documented. Indeed, an evaluation in 2008 by the Joseph Rowntree Foundation of the introduction of new public transport connections in four deprived areas of the UK concluded that 'public transport for services are a vital component in the social inclusion of individuals and for maintaining the vitality and vibrancy of low-income neighbourhoods.'4
Whilst Hampshire as a county has consistently ranked among the least deprived upper tier authorities in England and this remains the case in 2019, there is nonetheless evidence of place-based deprivation that is largely concentrated in Havant, notably in Leigh Park, and in Gosport. Leigh Park accounts for two thirds of place deprivation in Havant and one third of place deprivation in Hampshire. The number of Hampshire neighbourhoods in the second decile (10%-20% most multiple deprived areas) increased from 23 in 2015 to 33 in 2019. These included five more LSOAs in Leigh Park dropping down from the 30% to 20% most deprived.
In a recent study undertaken with the community at Somerstown, an area in the most deprived 10% of local authority LSOAs in the country, the head teacher of the local school explained that outside of the trip to school many children never leave their immediate street, which can have a profound impact on their quality of life, view of the world, their aspirations:
"In Somerstown the children's world is very small and if it's not offered here from the school, they will probably not access it…a number of families within Somerstown have not and will never go to the beach [a 20 minute walk] unless the school takes them…a trip to Commercial Road shops [an 8 minute walk] is a 'big deal' and seen as a long journey".
Limited access to good quality public and active travel connections is a barrier to employment, participation in post-16 education, and health services. It therefore widens socio-economic inequalities by limiting some people’s ability to access jobs and travel to health appointments.
Affordability is a huge driver of what type of transport a person uses. Those on the lowest incomes make twice as many bus trips as those in the highest income group and often face issues regarding frequency, reliability and convenience of bus services. Two out of five jobseekers say lack of transport is a barrier to getting a job and one in four jobseekers said the cost of transport is a significant issue5
Portsmouth is ranked 63rd of 326 local authorities in respect of deprivation indicators, where the first position reflects the location with the highest levels of deprivation. This demonstrates a worsening picture over time: in 2007 Portsmouth was 93rd, and 2010 76th.
Those living in the most deprived areas of Portsmouth city region have substantially lower life expectancy than those in the least deprived areas. Physical inactivity is one of four behaviours which contribute to 64% of early deaths in the city. Increasing active travel, including use of public transport, increases rates of physical activity, which in turn reduces the risk of a range of chronic diseases. The National Institute of Health and Clinical Excellence (NICE) guidelines on physical 4 https://www.jrf.org.uk/sites/default/files/jrf/migrated/files/2228-transport-regeneration-deprivation.pdf 5 (Lucas, 2003).
Gosport, Leigh Park, Wecock Farm and Paulsgrove are considered to be “left behind places”, with low job density, long travel time and poor accessibility to key services and opportunities and a key cause of multiple deprivations. The proposed SEHRT corridors will connect the deprived areas with employment and skill opportunities.

23
activity and the environment6 i, states that an 'increase [in] physical activity [is] associated with using public transport services.’ In the Portsmouth city region, there is a higher incidence of physical and mental disability in areas where there is higher deprivation, which compounds concerns regarding connectivity and mobility.
Creating a reliable public transport system which enables users, particularly our more vulnerable users, to have confidence in using public transport, opens access to opportunities for independent travel, improving quality of life. An independent review undertaken by Age UK Portsmouth and Portsmouth Disability Forum (PDF) emphasised the importance of promoting and enabling independence through the transport system, improving access to work and education, improving further prospects of finding employment later in life.7
1.6.7 Significant exceedances in air pollution
Air pollution has severe, negative impacts on health, the economy and the environment.
While air quality affects everyone, there are inequalities in exposure, and air pollution has the greatest impact on the most vulnerable, often disproportionately affecting those living in deprived areas, some of which are often located close to routes with heavy traffic and poor air quality. It also disproportionately affects the elderly, children and those with an existing health condition. Portsmouth City Council has been issued with three Ministerial Directions, which have placed a legally binding duty on the Council to undertake a number of steps to improve air quality in the city:
• Ministerial Direction 1 (March 2018): Required the Council to develop a Targeted Feasibility
Study (TFS) by 31 July 2018 for two specified road links in the city: A3 Mile End Road and A3
Alfred Road. These two roads were selected as they were projected to have nitrogen dioxide
(NO2) exceedances in Defra's national Pollution Climate Mapping model;
• Ministerial Direction 2 (October 2018): Following the results of the TFS, Portsmouth City
Council was issued with a further Ministerial Direction, this time to undertake a bus retrofit
programme. The Ministerial Direction stipulated that the programme should be undertaken
as quickly as possible with the purpose of bringing forward compliance with legal levels of
NO2 on A3 Mile End Road and A3 Alfred Road; and
• Ministerial Direction 3 (October 2018): The third Ministerial Direction required Portsmouth
City Council to produce an Air Quality Local Plan to set out the case for delivering compliance
with legal limits for NO2 in the shortest possible time.
6 Physical activity and the Environment NICE Guidelines [NG90]. 2018 7 Traffic and Transportation Decision Meeting: Demand Responsive Transport 14.03.2019
Chief Executive of Queen Alexandra Hospital said in his letter of support that: “A rapid transit network will provide enormous benefits not only to our patients, but also to our workforce, many of whom travel long distances across the South East on a regular basis”.
Portsmouth has five Air Quality Management Areas and is subject to separate Ministerial Directions – EU limit exceedances. The dominance of car travel within the Portsmouth city region, significantly contributes to around 26% of air pollution within Portsmouth itself.

24
For Fareham, the Government's 2017 National Plan identified that exceedances of the annual legal concentration limits for nitrogen dioxide (NO₂) were likely to continue in a section of the A27, between Quay Street and Delme Roundabout, a key commuting route between the Gosport peninsula and elsewhere within the city region. Fareham Borough Council has been issued with three Ministerial Directions and Hampshire County Council with one, to develop and then implement a fully funded local Air Quality Local Plan to bring the predicted exceedance into compliance within the shortest possible time.
Measures promoted through SEHRT would complement and reinforce the measures already being developed through the Air Quality Local Plan. Further discussion can be found in section 1.9.2 where the cumulative effect of CAZ and SEHRT has been modelled.
1.6.8 Low levels of productivity
Although Portsmouth’s GVA has grown faster than the UK average and the Solent average in the recent past (3.2% between 1997 and 2013), GVA in Portsmouth is still 10% below the southeast average due to a slowing of growth since the financial crisis in 2008/09. Portsmouth, Gosport and the Isle of Wight each have Assisted Areas status, requiring the need for additional investment to improve transport connectivity in order to unlock the city region’s full economic potential.
Our evidence-base for the Strategic Case shows that while Portsmouth is expected to experience employment growth between 2011 and 2031, there is no attendant increase in GVA in the longer-term, pedicting the lowest levels of GVA increases in the UK for the Portsmouth city region. Investment to improve and provide sustainable public transport infrastructure is required to improve access to opportunities within the city region if growth in employment, GVA and resident population is not to taper off.
At June 2019, 72.9% of Portsmouth’s population was in employment4, below the averages for South East England (79.0%), Great Britain (78.9%) and the south coast cities of Southampton (76.1%) and Brighton (74.9%).8 A significant share of this employment percentage is in low productivity sectors driven mainly by the coastal tourism market. Part time employment features highly within the city region, and particularly in the Isle of Wight and Gosport where 31% and 30% of employment respectively is part time as compared to the regional (27%) and national (25%) averages.
Portsmouth city region is currently forecast to experience employment growth without a commensurate growth in productivity, with little growth in high productivity sectors predicted. Despite the presence of an increasingly high-ranking university, there is low retention of skilled labour and university graduates. Just 4.8% of the city region's employment is in Science, Research, Engineering and Technology. This is lower than the national share (5.8%) and significantly lower than the regional share (7.4%).
The notable exception to this in the city region is Fareham, where 7% of employment is in Science, Research, Engineering and Technology and while significantly higher than elsewhere remains below the regional share. Fareham is also geographically well placed to take advantage of employment opportunities in both Southampton, Portsmouth and London, with good rail links from its three train stations in Fareham, Portchester and Swanwick. Better connecting skilled employees in Fareham
8 Portsmouth City Council Local Transport Plan 3
Portsmouth city region lags behind the UK average in GVA and competitiveness: employment concentrated in low productivity sectors, there is a low retention of skilled labour and university graduates. The city region currently is forecast to experience employment growth without commensurate growth in productivity.

25
with other parts of the city region will widen the skilled labour pool and improve access between businesses and skilled employees.
Portsmouth is one of the few large cities in the UK that has lost more graduates who grew up in the city than it gained in graduates who grew up elsewhere. The main attractor for graduates is the availability of skilled roles and progression prospects, and with limited growth in skilled employment opportunities the city region struggles to retain its graduates. The observed trend of graduate retention highlights Portsmouth’s severe lack of skilled employment and progression opportunities and public transport is particularly important for recent graduates who often do not own cars, further underlining the significance of the poor public transport accessibility within the city region and the need for investment. This point is highlighted by the University of Portsmouth's Vice Chancellor, Graham Galbraith, who stated:
'Such rapid transport will be hugely beneficial for our staff and students, while also helping us deliver on our strategic goals for the coming decade. The University of Portsmouth is committed to be one of the UK's leading universities helping to promote social and economic benefits across the region.
Rapid transport will be key to local economic growth and boosting productivity.
With low numbers of businesses in high productivity sectors, Portsmouth is a less attractive place for new businesses in these sectors to base themselves and thus benefit from productivity enhancing clustering. The SEHRT proposition would reduce the effective distances between existing pockets of activity in these sectors and could create greater agglomeration benefits and widen the accessible labour pools for businesses within the city region.
By better connecting innovation assets, including the universities and entrepreneurial spin-offs, to each other and to areas of deprivation, the Portsmouth city region’s SEHRT proposition supports productivity growth through agglomeration and access to high productivity employment and education and skills development opportunities.
1.6.9 Sustainable delivery of the identified need for additional housing and employment floor space
Portsmouth city region is identified for accelerated housing and jobs growth. The existing high density of the urban core and extensive undevelopable areas require new development to use edge of settlement green fields, infill sites and increasing density of existing built up areas.
Portsmouth city region has three specific targets related to housing delivery, employment, and regeneration. These are set out below:
Deliver 50,000 new dwellings in Portsmouth, South East Hampshire and the Isle of Wight by
2036 in a sustainable and socially inclusive way;
Increase GVA by providing at least 51,000 new jobs (and one million square metres of Class B
employment space), reduce unemployment through raising skills and increasing
employment opportunities; and
Regeneration of deprived areas by enhancing public transport access to employment.
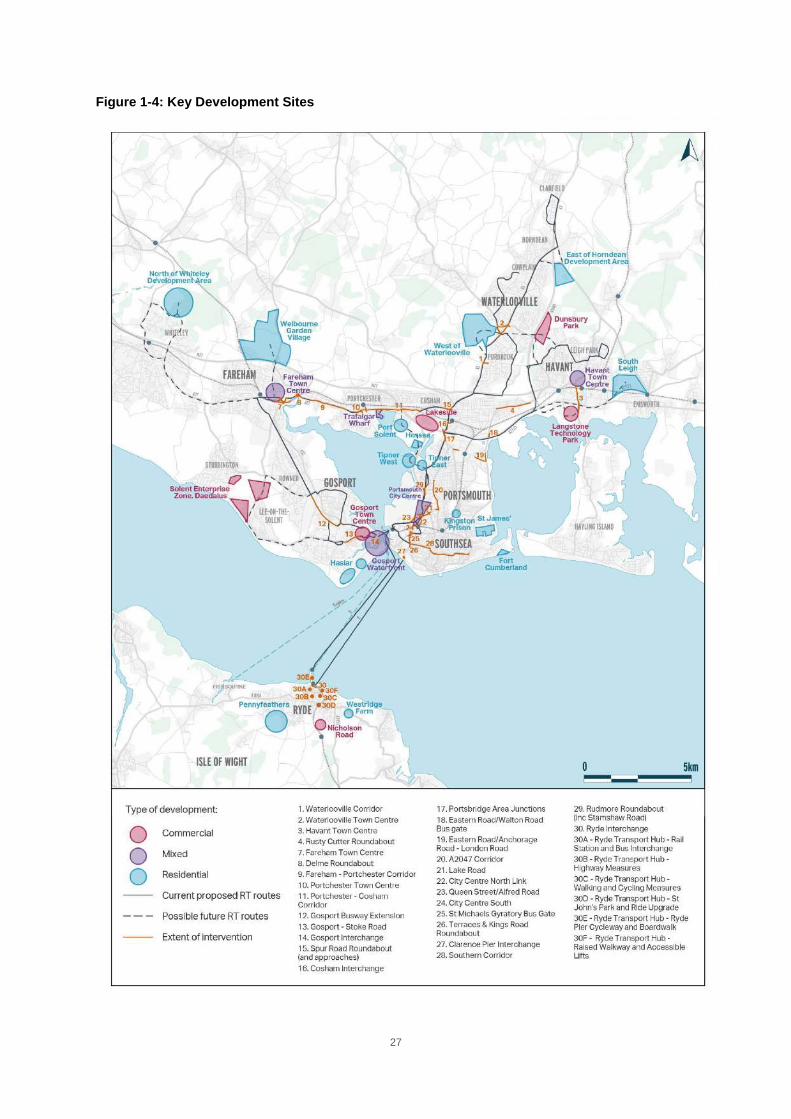
Figure 1-4 below shows the key development sites coming forward in the city region.
The city region has an ambitious growth agenda which includes the delivery of 50,000 new dwellings and 51,000 new jobs by 2036 in a sustainable and socially inclusive way.
26
This pattern of development, mostly located outside the city, based upon existing travel characteristics along with and geographical constraints of the city region, are likely to deepen existing transport challenges as discussed below:
Further physically constrain transport corridors;
Lengthen distances between localities;
Deepen reliance on car travel.; and
Increased network journey times and unreliability and hence reducing bus usage and commercial viability.
To overcome this challenge, SEHRT network would be underpinned by a co-ordinated programme of measures designed to ensure that new development sites are accessed by this transit network in order to increase the propensity for residents to use sustainable modes of transport. The focus would be on the middle-distance journeys for which we have shown that public transport is currently poorly-placed to compete with the private car.
SEHRT offers an alternative future for connectivity and mobility, by creating a new network of rapid transit corridors, starting with investment in the core network that is requested in this SOBC, with the opportunity for this to be extended to serve each major development area. This approach has already been exemplified by the Star corridor that services the West of Waterlooville Major Development Area and the proposed extension of the Eclipse service to the Solent Enterprise Zone at Daedalus.
This approach is endorsed and supported by Partnership for South Hampshire (PfSH), as outlined in their Letter of Intent (see appendix 5.12), which states that:
'the step-change in provision of bus transport and active travel networks will not only assist with providing transport capacity to accommodate development in existing adopted plans and strategies but will enable the sustainable delivery of new developments.'
PfSH was formed to deliver regeneration in the core urban areas of South Hampshire and provides a mechanism to take forward sustainable regeneration and development. PfSH helps its constituent authorities to address cross-boundary strategic planning issues and meet the Duty to Cooperate.
PfSH has also stated that co-locating new development on the SEHRT corridors will mitigate the adverse impacts arising from car-based travel and enable improved connectivity.
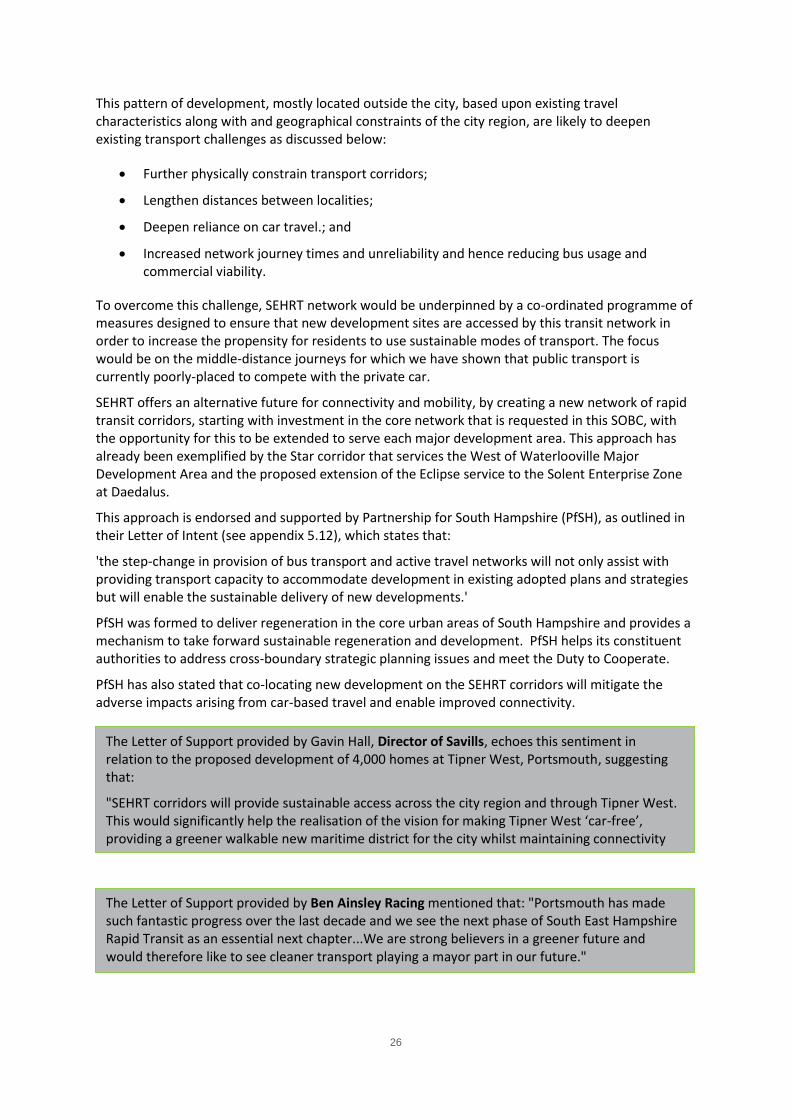
The Letter of Support provided by Gavin Hall, Director of Savills, echoes this sentiment in relation to the proposed development of 4,000 homes at Tipner West, Portsmouth, suggesting that:
"SEHRT corridors will provide sustainable access across the city region and through Tipner West. This would significantly help the realisation of the vision for making Tipner West ‘car-free’, providing a greener walkable new maritime district for the city whilst maintaining connectivity with the wider city region."
The Letter of Support provided by Ben Ainsley Racing mentioned that: "Portsmouth has made such fantastic progress over the last decade and we see the next phase of South East Hampshire Rapid Transit as an essential next chapter...We are strong believers in a greener future and would therefore like to see cleaner transport playing a mayor part in our future."
27
Figure 1-4: Key Development Sites
28
1.7 Future situation (without SEHRT)
1.7.1 Future highway network congestion
The previous sections discussed that the car dominance and poor transport connectivity, leading to congestion and delays and unreliable journeys especially for buses, are associated with the following factors:
constrained highway network (i.e., limited number of corridors to access Portsmouth);
limited capacity on current highway network; island and peninsular geography;
more distant post war housing locations; and
lack of investment in public transport infrastructure (making public transport uncompetitive
compared with car journeys, even for localised journeys).
Parts of the local road network in the city region are operating at over 100%, notably around city centre north, B3334 Rowner Road in Gosport, Holbrook Road northbound and the northbound and eastbound approaches to the Churchill Avenue / Victoria Road north junction in Portsmouth. Many of these are part of key travel-to-work routes.
Without intervention, by 2026 many key sections of the road network will be above capacity, and delays will become even more frequent. This will include Portsmouth city centre, the M27 Junction 12, Eastern Road, London Road and Western Road approaches to Portsbridge Roundabout, sections of A27 Havant Bypass and the approaches to Petersfield Road / New Road junction in Havant.
This situation is set to worsen by 2041 with yet more sections within the city region experiencing delays including: the A27 north of Portsmouth, the Havant area, the A3, Heritage Way and Mill Lane on the approaches to the A32 in Gosport, the M275 on the approach to the M27 Junction 12, and A3 London Road on the approach to the Havant Road / Southampton Road junction.
There is 26% growth expected in trip volumes between 2019 and 2041, increasing pressure on the existing constrained highway network and reducing levels of residual capacity. The transport modelling results show that the average speeds in the city region are expected to fall by between 2 kp/h and 7.5 kp/h during this period, from already below average travel speeds. Fareham and Portsmouth are expected to experience the biggest falls (7% reduction) in average speeds, with the Isle of Wight expected to experience the smallest fall (just above 2% reduction). Without the bus priority delivered through SEHRT, this additional level of highway congestion will make public transport even less attractive.
An 18% growth in travel is predicted between 2019 and 2041 in the Portsmouth city region. The highway network sees an increase of 26%, with public transport only having a 10% increase, highlighting that whilst the highway network is constrained, without intervention there is not a sufficient alternative to accommodate further growth. This is particularly true of journeys starting in the Portsmouth and Havant areas, where highway travel increases by 20% and 15% respectively, yet there is a marginal 3% to 5% reduction in travel by public transport forecast. Continuing this trend will not only further exacerbate the highway congestion issues, but also increase air pollution, social exclusion, and limit productivity.

29
1.7.2 Long and unreliable public transport journey times
The market failure within the public transport network is most marked on medium to longer distance commuter trips, between five and ten miles, where bus travel currently accounts for only a small proportion of total trips.
With the high level of highway congestion and frequent or time-consuming interchange between modes, the transport model predicts a small growth of 10% in public transport demand between 2019 and 2041.
Comparing generalised travel costs of trips into Portsmouth city centre by highway and public transport in 2026, the transport models shows that without SEHRT the journey times by public transport will be significantly higher than by the private car.
In addition, the limited availability of current bus priority means that bus journeys remain unreliable, further reducing the attractiveness of the public transport option. Our journey time reliability analysis of RTI system for October 2017 for selected high-frequency bus services in South East Hampshire shows that passengers waited on average 20%-30% more than scheduled time.
With the increased level of highway congestion, the variability in moving time causes service headways on 10 minute-headway services to vary to such an extent that buses would catch each other up and even overtake each other. In some cases, this is predictable (i.e. the same congestion occurs at the same times of the day) but in other cases it is highly variable and hence very difficult for operators to plan schedules for. Clearly such variability will negatively impact on the time passengers spend waiting for buses at bus stops.
Apart from the Eclipse Bus Rapid Transit (BRT), current bus services in the city region mainly cater for the falling, largely captive traditional bus market and for those making local trips. Bus services are not able to compete with the city region’s car journeys on key commuting routes due to poor journey times, service frequencies and significant unreliability caused by congestion and local geography.
1.7.3 Parking provision
Parking in Portsmouth city centre is relatively inexpensive for all day parking, with high levels of availability which exceeds demand. This discourages public transport usage and reinforces car dominance.
The development of Portsmouth parking strategy is underway with a pre-consultation draft planned for early 2020. This will provide detailed evidence on the relative price and availability of parking and the interventions planned to support the rapid transit services through increased charging for and reduced supply of parking.
Parking in the boroughs of Fareham, Gosport and Havant follow a similar pattern, with plentiful and relatively inexpensive parking available for both commuters and shoppers. In Gosport powers for on-street Civil Parking Enforcement are presently being sought and if successful this will enable control of on-street supply, directing parking demand into off-street car parks. The borough councils, as off-street parking authorities, will be reviewing their own approach to parking provision and pricing, with a view to supporting a balanced approach to accessing their town centre facilities, recognizing that car dependence and resultant traffic congestion is part of the problem for a healthy town centre economy and access to services and facilities for those who need them most.
1.7.4 Poor air quality
Section 1.7.4 describes the current issues related to air quality in the AQMAs and exceedance zones.

30
Under a 2022 future baseline scenario (i.e. no mitigation measures, only existing committed schemes) there are expected to be exceedances in EU limit values in two locations in the city and five exceedances in EU limit values on the Highways England Network on the A27 and the M27. There are also seven 'near exceedance' locations identified which are showing expected values of above 37 µg/m3 but under the limit value.
Without SEHRT investment, the air quality conditions are set to worsen with 26% increase in highway demand, long delays and unreliable journey times. Our social and distributional analysis shows that air pollution has the greatest impact on the most vulnerable, those living in deprivation, the elderly, children and those with an existing health condition. Deprived areas located close to heavy traffic where air quality is worse will be affected severally.
There is a need to promote modal shift to more sustainable modes, through combination of public transport enhancements and complementary measures, and reduce congestion on the key highway corridors.
Measures promoted through SEHRT will complement and reinforce the measures already being developed through the Air Quality Local Plan. Further discussion can be found in section 1.11.2 where the cumulative effect of CAZ and SEHRT has been modelled.
1.7.5 Future situation (without SEHRT) summary
The transport network in the Portsmouth city region is predicted to become yet more congested as general growth (18%) puts increased pressure on a network that already is reaching and exceeding its capacity. The areas of Fareham, Gosport and Portsmouth city centre each see a marked reduction in average travel speed between 2019 and 2041 of between 8% and 10%, demonstrating that the increase in congestion is acute in these areas.
The limited alternative travel modes to the private car, severely constrains capacity on key commuting routes, and worsens the performance and attractiveness of public transport, evidenced by the 3% to 5% reduction in travel by public transport forecasted for Portsmouth and Havant. This constraint on future public transport journey times and hence accessibility to Portsmouth city centre will disproportionality affect the residents in deprived localities who are more reliant on public transport, as in general about four-in-ten of people in the lowest quintile have access to private car.9
Inability to access work, education and services prevents people from breaking the cycle of social exclusion10 and deprivation. Without the SEHRT proposition in place access to employment and education sites in Portsmouth city centre by public transport will be significantly constrained with resultant high journey times and delays. Generalised journey costs and air pollution on key corridors, especially linking areas of deprivation, in the city region to Portsmouth city centre will be significantly higher without the high investment package in place.
Without high investment package, the Portsmouth city region is unlikely to achieve the aims of its emerging economic development and regeneration strategy.11 Continuing only with ‘business as usual’, Portsmouth city region is expected to experience modest employment growth with little attendant increase in GVA in the period 2019-2036.
Many parts of the road network in the city region will be either at or above capacity and delays will become more frequent under the future without SEHRT scenario. This will limit the ability of the city region to accommodate the additional 50,000 housing units and 51,000 new jobs which will have significant negative impact on the local and regional economy.
9 NatCen Social Research and University of the West of England for the Department for Transport: Access to Transport and Life Opportunities, August 2019. 10 UK Government Social Exclusion Unit ‘Making the Connections’ (2003). 11 Consultation draft Portsmouth economic development and regeneration strategy 2019-2036.

31
1.7.6 The SEHRT Vision
To address the abovementioned challenges, SEHRT packages will be developed in order deliver a transformational, commercially viable, public transport and active travel network made up of rapid transit and revised local bus services along key corridors, complemented by improved walking and cycling networks - achieving journey time, quality and reliability improvements and thus mode shift from car usage and delivering improved connectivity and facilitate growth in productivity.
The SEHRT vision unites Portsmouth City Council, Hampshire County Council, Isle of Wight Council, and our local public transport operators in this shared, single ambition, supported by the extensive commitments as outlined in this bid.
The SEHRT’s vision are set out below:
A branded network of fast, frequent, reliable and quality services and infrastructure, primarily
on-street, providing turn up and go, end to end connectivity, limited stop travel and
interchange at key locations within the city region;
Distinct from but interchanging with rail services, local bus services, walking, cycling and local
waterborne transport;
Distinctive, high quality rapid transit vehicles building on the success of the Eclipse and Star
corridors, Portsmouth Park and Ride and the Hard Interchange to deliver a step change in
travel;
A multimodal ticketing and billing platform providing fare capping over the full range of
transport services in the city region;
Push notification travel information to the customer for all transport modes in the city region;
High quality, attractive and accessible waiting facilities and interchanges with real time
information and convenience services;
Connecting rapid transit into the community with high quality, well-signed, routes for
pedestrians and cyclists; and
Develop infrastructure and technology to provide reliable convenient journey times along the
rapid transit network.
The optioneering process and the scope of works planned for developing SEHRT packages are explained in the section below.
1.8 SEHRT
This section details the background to and evolution of SEHRT including the consideration of strategic alternatives. The development of the network proposition, package identification, sifting process and funding package development for the TCF bid is provided below.

32
1.8.1 Alternative Option Assessment
Atkins were commissioned in 2017 to review alternative means for delivering rapid transit, review existing scheme propositions, identify new schemes and potential avenues for biddings for funding. This work assessed12 the following potential alternative modes for rapid transit:
Conventional bus;
On-street bus rapid transit;
Off-street bus rapid transit;
On-street light rapid transit (i.e. an on-street tram network);
Off-street light rapid transit; and
Heavy rail.
A points-based strategic assessment framework was used to assess each alternative against:
the six identified objectives at that stage, and,
three feasibility criteria related to the actual deliverability of the project from a practical and financial perspective.
Table 1-3 summarises the assessment results, identifying that on-street bus-based rapid transit was the preferred option.
Table 1-3: Summary of 2018 Assessment of Alternative Modes
Objective Feasibility
Re
gen
era
tio
n
and
Gro
wth
Inte
grat
ion
an
d
Stra
tegi
c C
on
ne
ctio
ns
Mo
de
Sh
ift
Tran
spo
rt
Re
liab
ility
Envi
ron
me
nt
Equ
alit
y an
d
Acc
ess
to
Jo
bs
and
Se
rvic
es
Co
nst
ruct
ion
D
isru
pti
on
De
live
rab
ility
Co
sts
Tota
l On-Street Bus Rapid Transit
2 2 2 2 2 2 2 2 2 18
Off-Street Bus Rapid Transit
2 2 2 2 2 2 1 1 1 15
On-Street Light Rail Transit
2 2 2 2 2 2 0 0 0 12
Off-Street Light Rail Transit
2 2 2 1 2 2 0 0 0 11
Heavy Rail 1 1 1 1 1 1 2 2 0 10
Conventional Bus Network
1 1 0 0 1 0 2 2 2 9
Source: 2018 SEHRT Stage 1 Report, table 5-11
On-street bus priority was identified as the most feasible rapid transit mode that performed strongly against the strategic objectives. This is predominantly because this mode requires the least capital expenditure and construction of such a mode is the least disruptive of the options to meet the
12 2018 Stage 1 report, section 5

33
required outcomes. Off-street modes are constrained by the lack of suitable alignments (except on the Gosport peninsula). Rail options based on the current rail network are constrained by the reach of that network, and whilst Light Rapid Transit (LRT) could in principle match BRT for reach across the sub-region, the costs and impacts on other modes, and deliverability challenges would be much higher making it unsuitable for this city region.
1.8.2 SEHRT package identification and sifting process
The concept of SEHRT has been promoted since 2012. During this time a number of feasibility studies have been completed in order to assess and review infrastructure schemes. Many of the schemes which have since been delivered:
Our approach for generating and sifting options for TCF is in line with WebTAG requirements, as shown in Figure 1-5 below.
Figure 1-5: Package identification and sifting process
1.8.3 TCF Long List
The 2012 and 2018 work provided the basis for developing the long list of potential schemes for the Portsmouth city region’s TCF SOBC. In addition, the following sources were used to identify additional schemes:
Comprehensive review of the city region in terms of congestion, bus passenger delay and
other transport challenges to ensure all locations that could benefit from improved bus
priority were identified;
Bus operator feedback on areas of delay provided as part of the 2018 work and ongoing
stakeholder engagement.
The Isle of Wight option development process.
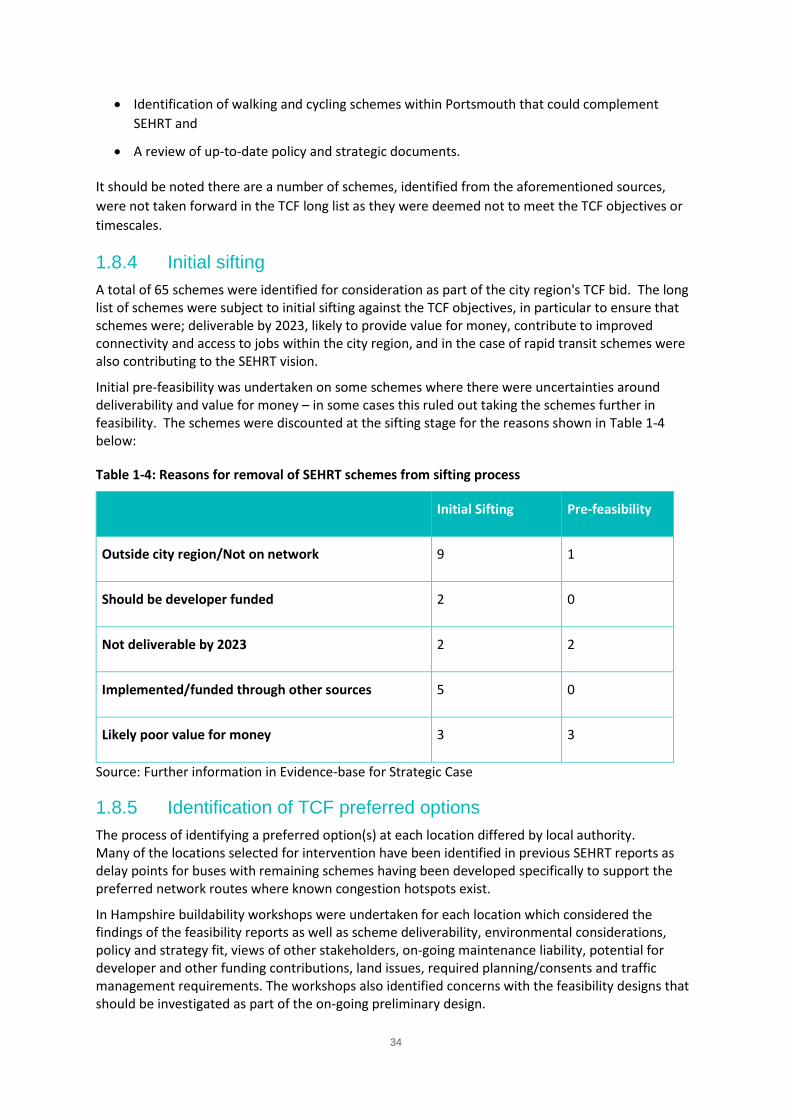
34
Identification of walking and cycling schemes within Portsmouth that could complement
SEHRT and
A review of up-to-date policy and strategic documents.
It should be noted there are a number of schemes, identified from the aforementioned sources,
were not taken forward in the TCF long list as they were deemed not to meet the TCF objectives or
timescales.
1.8.4 Initial sifting
A total of 65 schemes were identified for consideration as part of the city region's TCF bid. The long list of schemes were subject to initial sifting against the TCF objectives, in particular to ensure that schemes were; deliverable by 2023, likely to provide value for money, contribute to improved connectivity and access to jobs within the city region, and in the case of rapid transit schemes were also contributing to the SEHRT vision.
Initial pre-feasibility was undertaken on some schemes where there were uncertainties around deliverability and value for money – in some cases this ruled out taking the schemes further in feasibility. The schemes were discounted at the sifting stage for the reasons shown in Table 1-4 below:
Table 1-4: Reasons for removal of SEHRT schemes from sifting process
Initial Sifting Pre-feasibility
Outside city region/Not on network 9 1
Should be developer funded 2 0
Not deliverable by 2023 2 2
Implemented/funded through other sources 5 0
Likely poor value for money 3 3
Source: Further information in Evidence-base for Strategic Case
1.8.5 Identification of TCF preferred options
The process of identifying a preferred option(s) at each location differed by local authority. Many of the locations selected for intervention have been identified in previous SEHRT reports as delay points for buses with remaining schemes having been developed specifically to support the preferred network routes where known congestion hotspots exist.
In Hampshire buildability workshops were undertaken for each location which considered the findings of the feasibility reports as well as scheme deliverability, environmental considerations, policy and strategy fit, views of other stakeholders, on-going maintenance liability, potential for developer and other funding contributions, land issues, required planning/consents and traffic management requirements. The workshops also identified concerns with the feasibility designs that should be investigated as part of the on-going preliminary design.

35
Portsmouth is subject to three ministerial directives and therefore infrastructure interventions were devised to ensure that they enhance or at the very least, do not prejudice measures set out in Portsmouth's emerging Air Quality Action Plan. Accessibility for active modes, road safety and public realm improvements were all key considerations for the development of schemes.
Schemes have predominantly been designed within the confines of the Highway boundary in part due to lack of opportunity to expand the Highway but also to ensure deliverability. Those schemes that do require land take mostly use land that is within the control of the local authority albeit not adopted Highway.
On the Isle of Wight, the Ryde Transport Hub proposals have been developed from the agreed transport infrastructure improvements identified as being essential within in the Ryde area and improving the existing links to the Portsmouth city region. The individual project elements which make up the overall proposal, have been agreed in partnership with a subgroup of the Transport Infrastructure Board (formerly Transport Infrastructure Taskforce). The Board was formed by the local MP with a remit to develop and oversee transport infrastructure improvements on the Isle of Wight. The project’s subgroup comprises of senior management from all the relevant local public transport providers including, Wightlink, Hovertravel, Southern Vectis (Go South Coast) and South Western Railway, as well as representatives from the Isle of Wight Council and Solent Transport. The scope of the proposals was to ensure that they brought the improvements identified by the subgroup and to align within the overall aims of the wider sub regional SEHRT project.
The outcome of the initial sifting, feasibilities studies and previous design work led to a list of 39 preferred schemes across Portsmouth city region for consideration within the Transforming Cities Fund bid.
1.8.6 Scheme prioritisation for TCF
The final stage in developing the TCF proposition was to prioritise the 39 schemes and develop different funding packages based on high, medium and low investment options. Schemes were prioritised according to:
Contribution to Transforming Cities Fund objectives;
Contribution to SEHRT Vision;
Bus journey time savings;
Stakeholder priorities;
Deliverability; and
Cost and scheme value for money assumptions.
The details of the 39 schemes packaged up in the three investment packages are provided in the
next section.

36
1.8.7 The SEHRT proposition and package development
Our SEHRT proposition (table 1.2) is based on the high investment package that seeks to deliver the below elements in order to achieve SEHRT’s vision/objectives:
Enhanced bus rapid transit network (delivered through Quality Bus Partnerships) and a revised local bus network, targeting key commuting corridors;
Complementary and enabling junction and corridor infrastructure improvement schemes;
Excellent “First / Last Mile” access to/from rapid transit stops;
Enhanced transport hubs and interchange improvements with rail and ferry modes at key destinations;
Active travel networks expansion and improvement;
Enhanced customer experience; and
Complementary policy measures to help drive mode shift.
The SEHRT high investment package consists of a network of transit services underpinned by a co-ordinated programme of 39 measures designed to increase the propensity for residents to use sustainable modes of transport (including rail and active travel). The focus is on the middle-distance journeys for which we have shown that public transport is currently poorly-placed to compete with the private car.
SEHRT aims to increase public transport and active travel mode share for medium-distance journeys, and to increase opportunities to access employment, education and health services within reasonable journey time parameters13 across the Portsmouth city region.
Figure 1-4 above shows all the elements proposed under the high investment package along with the proposed SEHRT routes. A summary of all intervention is presented in table above. Full details of these interventions can be found in the Strategic Case evidence-base.
The high investment SEHRT network focuses on corridors: Gosport / Fareham to Portsmouth; Waterlooville to Portsmouth, Leigh Park to Portsmouth, and Ryde to Portsmouth.
Fareham to Portsmouth Corridor
The priority measures enable the Gosport-Fareham Eclipse journeys via Elson to continue to Portsmouth providing through buses from the Gosport peninsula to Queen Alexandra Hospital (QAH) for the first time. Access to jobs on the Gosport peninsula, in particular the Solent Enterprise Zone at Daedalus, will be improved from Paulsgrove and Cosham.
The frequency between Fareham Bus Station and QAH is unchanged, the journey time reduces from 30 minutes scheduled at present to an estimated 22 minutes. Fast journeys between Fareham and Portsmouth increase from two to six buses an hour.
Finally, a fast Gosport – Fareham service (extended to the new development at Welbourne) becomes possible with a forecast journey time of 26 minutes compared to 36 today between Gosport and Fareham.
13 Research cited in ‘Transport and Inequality: an evidence review for the Department for Transport’ (NatCen) found that 19%
of respondents in a survey of 2012 had turned down a job due to the quality of bus services at some point in time. Sixty-one percent of respondents had stated that a faster and more direct bus service would give access to a better job; 35% cited frequency.

37
Waterlooville - Portsmouth Corridor
On the Waterlooville corridor, the two existing routes to Portsmouth from Wecock Farm and Horndean are retained, with significantly shorter journey times and higher frequencies.
Leigh Park to Portsmouth Corridor
A new service will connect Leigh Park, a large deprived estate to the north of Havant with few employment opportunities, and Portsmouth city centre, utilising the strategic road network. This will radically reduce journey times between the centre of Leigh Park and the centre of Portsmouth from around 50 minutes to just over 30, greatly improving access to jobs and services in Portsmouth.
Ryde to Portsmouth
This comprises the fast ferry links between Ryde and Portsmouth by catamaran and hovercraft with up to four journeys an hour. The bid includes proposals for the Ryde Transport Hub which provides interchange between rail, bus and hovercraft and builds on the Department's recent declared investment in the Island Line to Ryde Pier which connects with the catamaran service. The mainland catamaran terminal at The Hard Interchange has seen significant recent investment in modern facilities. The mainland hovercraft terminal at Clarence Pier which provides interchange with the bus rapid transit network is included in medium and high packages. Waterborne travel forms part of the development map for tap on tap off ticketing to deliver seamless travel.
Highway (junctions and corridors) infrastructure improvements These services and the mode share and economic benefits they will deliver depend upon a series of carefully-focused priority measures delivered on the highway (junctions and corridors) network. The proposed measures also improve journey times and reliability on other local bus services. Broken down into their components, these measures:
Provide a bus priority spine between Cosham and Portsmouth city centre, along which all SEHRT services to Portsmouth are expected to travel;.
Introduce priority measures at key locations in Fareham, Portchester and Waterlooville on the SEHRT network;
Introduce priority measures to improve journey times and punctuality on medium-distance local bus services between Havant, Leigh Park, Portchester and Portsmouth;
Open up a priority route on Portsea Island between the city centre and The Hard via the major trip attractor of Portsmouth University, enabling SEHRT services to serve the university directly;
Further develop the priority route between Gosport and Fareham through a combination of highway measures and a further extension of the busway, and a new bus / ferry interchange at Gosport to provide similar levels of passenger comfort to the one recently delivered at The Hard; improve other key interchange locations, notably at Ryde Pier, Cosham, Fareham Bus Station and Clarence Pier;
Provide improved access for walking and cycling to stops served by SEHRT services and to the key interchange of Havant;
Network Rail mentioned in their letter of support that: "Network Rail welcomes this DfT investment. When combined with the substantial investment in the area, it will truly have a transformative effect on the Isle of Wight transportation network."

38
Improve stops served by SEHRT to minimise the amount of time SEHRT vehicles spend at these stops and to increase passenger comfort; and
Significantly change the character of the A27 between Fareham and Queen Alexandra Hospital to improve its amenity for walking and cycling.
Transport hubs and interchange improvements
The main interchanges across the rapid transit network will be enhanced, building on the success of the Hard Interchange. The TCF interchange schemes cover Fareham Bus Station, located at the heart of Fareham town centre, Gosport Ferry Interchange and bus station, located adjacent to the High Street shops, Cosham Interchange, adjacent to Cosham High Street, Clarence Pier Interchange with the Hovertravel mainland terminal and Ryde Transport Hub, adjacent to the town centre and at the interchange of Island Rail services Wightlink catamaran services, Hovertravel services and Southern Vectis bus services. Our evidence-based for the Strategic Case includes details of these schemes.
The medium investment package retains the core priority measures, but some are reduced in scope. The Eclipse Busway extension is not delivered in this scenario, and with it a faster Gosport – Fareham transit service. Fareham bus station improvements are lost as are the bus lanes along the A27 and Portchester bus facilities along with walking and cycling improvements. Improvements to Portsmouth – Havant local buses are lost (Rusty Cutter) or reduced (Anchorage Road/Eastern Road industrial sites) together with walking and cycling measures in Havant. The enhanced Alfred Road/Queen Street improvement for service to The Hard interchange is also lost.
The SRTM model results suggest that the medium investment package would be likely to see a reduction in the viable frequency on the Wecock Farm - Portsmouth and fast Gosport – Fareham services compared to the high package.
The SRTM model results suggest that the medium investment package would be likely to see a reduction in the viable frequency on the Wecock Farm - Portsmouth and fast Gosport – Fareham services compared to the high package.
The low investment package focuses on the bus priority spine on Portsea Island, and includes schemes elsewhere on the SEHRT and local networks where these will have a very substantial impact on Transit and local bus journey times and reliability. These are integral to all SEHRT services but the loss of the medium and high package measures limit the journey time savings and the number of people within 45 minutes travel of Portsmouth. It retains delivery of the major interchange schemes at Gosport Interchange and Ryde Pier, but no other interchanges and loses inclusion of Portsmouth University and Southsea in the SEHRT network within a consequent reduction in patronage and benefits
Whilst the low scenario enables the provision of a core Rapid Transit service proposition, SRTM results suggest that viable frequencies would be reduced compared to the medium on the Gosport – Fareham – Cosham – Portsmouth, Waterlooville – Portsmouth semi-fast and Leigh Park – Portsmouth services.
All investment packages feature matching operator investment in terms of high-specification vehicles for operation on the SEHRT network.
Measures promoted through SEHRT will complement and reinforce the measures already being developed through the Portsmouth Air Quality Local Plan and sought through the Future Mobility Zone bid.
1.8.8 Improving the customer experience
The rapid transit network offers frequent services with well signposted, attractive, stops and high -quality vehicles offering simple, good value fares connecting Solent Enterprise Zone, Gosport,

39
Fareham, Portchester, Queen Alexandra Hospital, Cosham, Havant, Waterlooville and Leigh Park with easy interchange to local buses, rail and ferries to Gosport and the Isle of Wight.
Improved journey times will result from better laid out bus stops, redesigned junctions and smarter traffic signals as well as some on the road priority measures. These will bring more employment, training and education sites and new housing within easy reach.
Distinctive, high quality vehicles will offer best in class comfort and convenience including onboard WiFi and phone/laptop charging, next stop announcements with displays showing connecting buses, trains and ferries. They will be powered by Euro 6 clean diesel with smart technology which switches the engine off when the vehicle is stationary and uses regenerative braking to power onboard systems. Other funding opportunities may allow the introduction of electric buses within the investment timescale for the bid.
'Tap on tap off' ticketing will allow passengers to simply present their bankcard, Smartphone or Smartwatch when joining or leaving any bus they use across the area. This offers a best price promise whether it is a single, day or weekly ticket without the need to plan ahead or commit to costly tickets in advance. This will be introduced on all the buses in the area with a road map to add local ferries and then local rail travel. Existing tickets and cash payment will remain as options and rapid transit routes will accept concessionary passes within the usual time limits.
These elements are identical across the three high/medium/low packages, because they are seen as necessary to improve public image of bus services and support a transition in perceptions from conventional bus services to rapid transit. Achieving this transition in public perception is critical to success irrespective of the level of infrastructure intervention.
SEHRT is the product of co-design, in particular with the local bus operators who have been strongly engaged both locally and at Group level as evidenced by the attached letters of intent. The transformational potential of the project has attracted interest at senior level with significant investment from the commercial operators on offer for a successful bid.
1.8.9 Improving the customer experience - SEHRT stop improvements
This investment will continue the enhancements started through the Tranche 1 TCF settlement that is seeing the installation of a range of real time information screens for passengers at bus stop locations throughout Portsmouth, Havant and Waterlooville.
The SEHRT stops will feature distinctive high-quality shelters with SEHRT branding, rail station type stop name boards, perch seating, led lighting, network map panel, at stop Wi-Fi and mobile phone charging points. This recognises that many passengers use mobile phones for travel planning and tickets. Super stops will have a Real Time Information (RTI) display, which will include bus service information to that stop and onward connections by bus, train, ferry, and continental ferry. Where appropriate, displays will carry news, travel news, weather and (non-commercial) local and visitor information to help journey planning, support the visitor economy and keep passengers informed on their journey.
Consideration will be given to 'living, green shelter roofs at selected locations to capture traffic emissions, and support bio-diversity and insects.
A wayfinding map totem for the local area and onward connections will be provided with cycle parking and parcel delivery lockers where demand has been identified. Stop layouts will be designed to deliver easy, obstruction free, pedestrian access and exit to aid mobility and improve passenger flow with raised access kerbs. Where possible, stop geometry will be devised to allow approaching buses to access the stop in a straight line to provide a better travel experience for passengers already on-board and aid journey times.

40
1.8.10 Improving the customer experience - active travel network enhancements
Local walking and cycling access to the rapid transit stops will act as feeder routes, connecting communities to SEHRT. This will offer an attractive end to end alternative to the private car with clear information before setting out, easy to follow wayfinding and distinctive branding. It includes:
Creating excellent ‘first and last mile’ access to rapid transit stops;
Improvements to walking and cycling facilities and the public realm, as an integral part of the junction and corridor schemes. Several schemes will provide opportunities for significant public realm improvements, including those in Portchester district centre, Gosport, Cosham and Clarence Pier Interchanges, St Michael’s Gyratory bus gate and city centre South;
Interventions to support walking and cycling for relatively short commuting trips, to be further developed; and
Roll out of the Routes4U app across Portsmouth to include rapid transit and local bus stop locations. This app provides a platform to plan easily accessible routes for the mobility impaired in Portsmouth, taking into consideration curb height, surface type, crossing points, pavement width, gradient and travel distances. It provides route planning and turn-by-turn navigation for wheelchair users and walkers, which are easily customised to each person's own abilities, improving the links to the rapid transit network.
Local Cycling and Walking Infrastructure Plans (LCWIPs) are in the final stage of preparation for Portsmouth, Fareham, Gosport, Havant and the Isle of Wight. Portsmouth City Council, Hampshire County Council and Isle of Wight Council have commissioned additional audits around proposed SEHRT bus stop locations. These are within an 800-metre crow-fly radius of the bus stop, to highlight and understand the key walking and cycling infrastructure to link the SEHRT network to where people live, work, and access education and leisure.
Each stop has been assessed and reported in accordance with DfT's Route Selection Tool (RST) for cycling, and the Walking Route Audit Tool (WRAT) for walking.
The audits undertaken as part of the SEHRT bus stops will be included within the wider LCWIPs. This will ensure a cohesive network and integration between the two work packages.
1.8.11 Complementary polices
The isolated delivery of public transport capital infrastructure cannot deliver wider benefits from improved connectivity alone, and the authorities have committed to the adoption of complementary policies to support SEHRT and help to drive mode shift.
The higher investment level SEHRT packages would offer greater scope within which complementary policies and associated measures can be used to drive mode shift – both in terms of the ability to successfully do so, and in some cases the potential deliverability of the measures themselves. The medium and low investment packages will be complemented with the relatively lower level of influence of these complementary policies on behavioural changes and hence the modal shift.
The complementary policies include:
Portsmouth and Fareham Air Quality Local Plans: As described in sections 1.4.3 and 1.7.3.
Portsmouth City Council Local Plan: The new Local Plan will replace the three documents that currently make up the City Council's planning policy framework. This plan will cover the period up to 2036, detailing the land-use strategy for meeting future development need in the city. It will allocate sites for employment, housing, retail and community uses where

41
appropriate, seeking to achieve delivery of sustainable development. As is the case in the current adopted Portsmouth Local Plan, the new Plan will be policies supporting the delivery of the SEHRT and the encouragement of development in areas with good access to public transport hubs as well as local goods and services.
The Local Plan places SEHRT at the heart of the transport strategy to underpin new development in the city region and it recommends locating new development along the core SEHRT corridors or where the SEHRT can be viably extended to serve new development at major sites.
Portsmouth City Council Parking Supplementary Planning Document (SPD): The 2014 Portsmouth Parking Standards and Transport Assessment SPD sets out the standards and design principles for car park and bicycle parking for residential and non-resident development, as well as providing guidance on transport assessment and travel plans. The SPD is currently under review and will place an increased focus on supporting low car and car-free development in areas that are well served by public transport and in easy walking and cycling distance of a range of employment, retail and leisure destinations. This approach moves away from that taken in the current SPD which seeks to encourage parking provision in new development at a level consistent with past car ownerships trends. The revised SPD will complement other Portsmouth County Council strategies by encouraging a step-change in the way parking supply is considered in the planning application process and by reducing reliance on private car use in new developments.
Portsmouth City Council Parking Strategy: The Portsmouth parking strategy is currently under development supporting the creation of modal shift in the city and addressing the air quality issues. The parking strategy will set out how changes to parking provision could be used to help drive modal shift particularly for trips to Portsmouth city centre and will address off and on street parking in all areas of the city. This ambitious strategy to support and encourage a change in travel behaviour for trips into and around Portsmouth is due to be consulted on in early 2020 alongside a new Parking SPD outlining the parking requirements for new developments in the city.
Parking strategies for local authorities in Hampshire alongside the SEHRT network: These will focus on non-residential parking, especially in town centres, to encourage modal shift and increased use of public transport and active modes.
Local Cycling and Walking Infrastructure Plans (LCWIPs): These are being developed for all five of the city region’s authorities.14
Portsmouth Local Transport Plan: To better reflect the ambition and opportunities to address transport challenges in Portsmouth a new Local Transport Plan is being developed alongside the city's local plan. The Portsmouth Local Transport Plan will set out the ambitious plans for modal shift in the city, addressing the air quality and climate change issues. A pre-consultation draft is planned for early spring 2020.
Bus Lane Enforcement: Bus lane enforcement (fixed camera) is already undertaken at 5 priority locations in Portsmouth and powers to enforce bus lanes have or are being taken by Hampshire County Council, to address priority locations within Fareham, Gosport and Havant.
Other complementary strategies, including the Solent Mobility Zone bid (to the Future Mobility Zone fund), Portsmouth City Council Parking Supplementary Planning Document,
14 Some areas which lie within the Winchester City authority area, including Denmead and Southwick & Wickham wards, have
been considered as part of the city region alongside the five key authorities. These areas are understood as having connections and overlaps with the city region, mainly with respect to future development and walking and cycling interventions.

42
Local Plans for the Local Authorities, and an extension of bus lane enforcement in Portsmouth and the introduction of bus lane enforcement in South East Hampshire region.
1.9 The SEHRT Outcomes
1.9.1 Expected SEHRT benefits and outcomes
This section describes the expected benefits that SEHRT will deliver. The quantified benefits are outlined in full, where it is possible, in the Economic Case. Figure 1-3 shows the SEHRT logic map linking the elements of the SEHRT proposition with its benefits and outcomes.
Optimise network operation within existing geographic constraints
Only by reallocating road space away from the private car to SEHRT, can the network capacity be increased in order to accommodate the future growth in trips. If projected growth in travel demand is met by the current modal split of journeys, the highway network will be significantly over capacity and essentially cease to function effectively, dramatically increasing journey times, pollution and reducing productivity and connectivity.
Improve the competitiveness of the public transport offer
SEHRT will reduce public transport journey times, and improve journey quality, creating a realistic alternative to car travel.
In turn, this allows the transport network to accommodate greater levels of travel growth. Current growth scenarios simply cannot be met by a continued car centric approach, both in the city and in the towns in the city region.
Research into the Belfast Glider rapid transit and West Midlands Sprint schemes has identified 20% journey time savings as key to winning custom from car users. For Belfast Glider, Translink said. 'that is an increase of more than 30%, which means about 1.67 million fewer car journeys, reducing congestion and enhancing city air quality.'15
'The evidence from Belfast Glider compares to our ‘bottom up’ patronage forecast of 2015 of 23%. It is anticipated that a 20% reduction in journey times at peak and 10% off-peak can be achieved. The increase in patronage for Glider is from the decrease in journey time and a number of other system elements.'
SEHRT proposes to achieve this through the high investment package in highway and junction improvements, smart priority measures and reduced stop dwell times due to changes in bus stop geometry and waiting area layout, vehicle design and modern ticketing options.
The results from our analytical analysis including the SRTM show that:
Buses get quicker: Figure 1-6 below compares 2026 high investment package public transport generalised journey times with the Do-Minimum (without SEHRT) generalised journey times (GJTs) for key corridors. This demonstrates that all corridors experience 20% or close to improvements in
15 https://www.bbc.co.uk/news/uk-northern-ireland-49555966
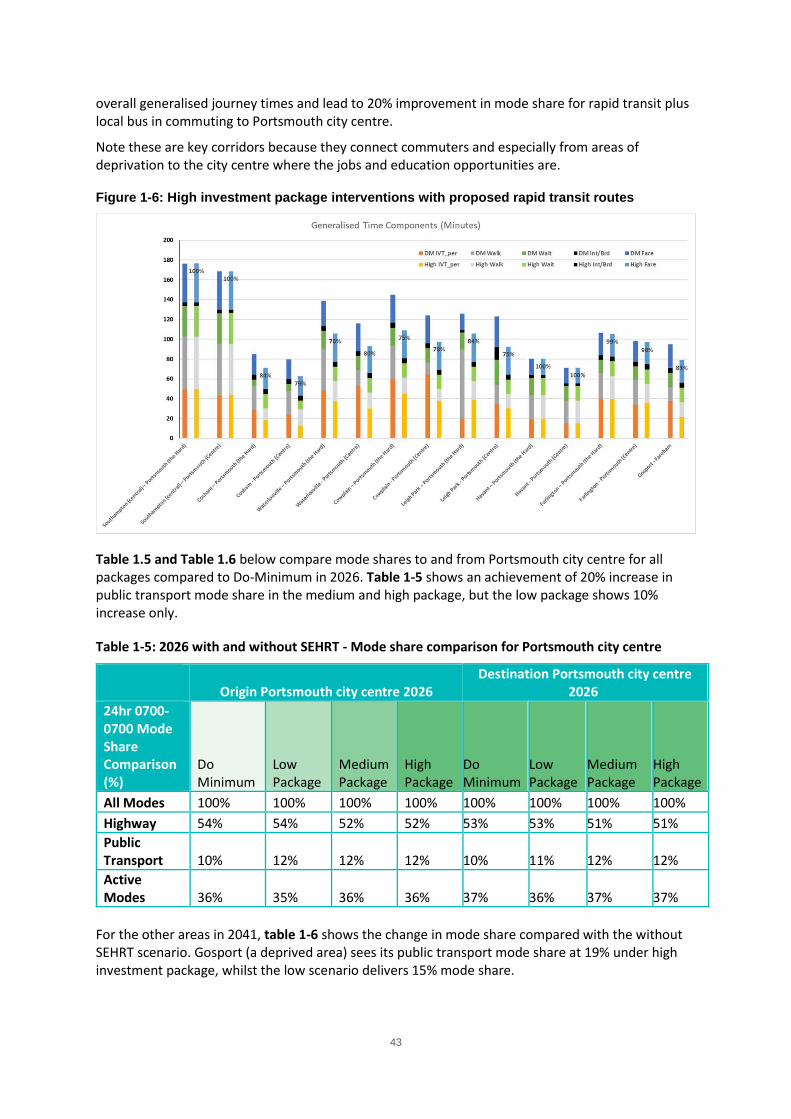
43
overall generalised journey times and lead to 20% improvement in mode share for rapid transit plus local bus in commuting to Portsmouth city centre.
Note these are key corridors because they connect commuters and especially from areas of deprivation to the city centre where the jobs and education opportunities are.
Figure 1-6: High investment package interventions with proposed rapid transit routes
Table 1.5 and Table 1.6 below compare mode shares to and from Portsmouth city centre for all packages compared to Do-Minimum in 2026. Table 1-5 shows an achievement of 20% increase in public transport mode share in the medium and high package, but the low package shows 10% increase only.
Table 1-5: 2026 with and without SEHRT - Mode share comparison for Portsmouth city centre
Origin Portsmouth city centre 2026
Destination Portsmouth city centre 2026
24hr 0700-0700 Mode Share Comparison (%)
Do Minimum
Low Package
Medium Package
High Package
Do Minimum
Low Package
Medium Package
High Package
All Modes 100% 100% 100% 100% 100% 100% 100% 100%
Highway 54% 54% 52% 52% 53% 53% 51% 51%
Public Transport 10% 12% 12% 12% 10% 11% 12% 12%
Active Modes 36% 35% 36% 36% 37% 36% 37% 37%
For the other areas in 2041, table 1-6 shows the change in mode share compared with the without SEHRT scenario. Gosport (a deprived area) sees its public transport mode share at 19% under high investment package, whilst the low scenario delivers 15% mode share.

44
Table 1-6: 2041 mode share comparison with without-SEHRT scenario
Area Low Medium High
Fareham 9.77% 10.19% 12.48%
Gosport 15.18% 15.84% 18.94%
Havant 4.60% 7.33% 7.37%
Improved Reliability
Gosport – Fareham Eclipse phase 1 and Cambridgeshire Guided Busway both provide examples of significant demand response to schemes which achieved major improvements in bus service punctuality, despite there being little or no change in end-to-end scheduled journey time.
SEHRT seeks to improve bus service reliability through a holistic approach including:
Implementation of bus priority measures to reduce the impact of the variability of journey times on the highway;
Implementation of improvements to bus stop geometry to reduce delays on the entrance and exits to bus stops through, for instance, reducing the need to manoeuvre around parked cars or poorly-located traffic calming measures;
Introduction of buses with revised configurations to allow passengers to board and alight more quickly; and
Provision of ‘tap out’ readers to capitalise on the potential journey time benefits of ‘Tap On Tap Off’, with a further conversion from cash.
The proposed measures are estimated to reduce journey time variability by between 0.45 minutes and 0.08 minutes with SEHRT implementation.
The high reductions in journey time variability are seen at a number of schemes with high level of journey time variability. Quay Street Roundabout in Fareham has a journey time variability in the westbound direction of 0.9 minutes. We estimate that the proposed bus bypass for in Fareham (for which we estimate an average journey time saving of 3 minutes) will reduce the variability by 75% to 0.23 minutes. In turn, this reduction in variability may mean that the impact on scheduled bus journey times is greater than the three minutes currently predicted.
Increasing Demand
The improvement in rapid transit and local bus GJTs also increases the passengers demand. The number of passengers across the three corridors on the rapid transit services and the local bus services they directly replace increases by 13% in the Low scenario, 28% in the Medium and 29% in the High.
Wider travel to work area: The average passenger journey length across the three SEHRT corridors increases by 9% in the Low scenario, 13% in the Medium and 14% in the High. This means that:
(i)- Competitive public transport journey times can also widen the potential reach of workers by increasing the distance people can travel within acceptable journey times.
(ii)- The reach of public transport will also be significantly increased, improving access to enterprise zones, industrial areas, such as Anchorage Park and key training and education centres. The high package increases the population catchment within 45 minutes travel to Portsmouth city centre by almost 100,000.

45
Economic benefits
Better utilisation of Land: Reducing the reliance on car as a means of accessing the city centre allows Portsmouth City Council to release land currently used for parking for more productive land uses. Enables delivery of Local Plans in all the authorities – either greater intensification of sites or makes the sites viable from a transport perspective where they weren’t before.
Improved economic viability: Improvements to the public realm associated with the proposed SEHRT interchange improvements and to stop infrastructure will improve the economic viability of local district centres.16
Improved Labour Force Access: Improved access to jobs and skills will make the area more attractive to businesses to relocate to the area as they will be able to access a more highly trained and mobile workforce. This will assist the area in improving its productivity and contribution to the UK, and help the city in retaining its graduate population, in turn upskilling the overall workforce.
Enhanced wider economic benefits: National and international evidence shows that productivity uplift of business and individuals from as a result of improved connectivity between business and labour market, and among firms and businesses is an important stream of benefits captured in urban agglomeration. The concept of agglomeration economies describes the benefits that arise from the proximity of firms and people in cities and industrial clusters.
The proposed SEHRT high investment package is forecast to bring significant cost savings and quality improvement to journeys made by public transport and active modes. These savings will result in improved public transport connectivity in the city region, strengthening the linkage between businesses, business and wider labour supply and other opportunities. All these forecast improvements are therefore expected to increase the access to economic mass in the city region, leading to uplift in productivity through agglomeration economies and increased tax revenue from better labour participation. The anticipated productivity gains and increase in tax revenue are potential benefit streams that have not been quantified in this SOBC but are legitimate economic impacts.
Air quality benefits
Modal shift away from the car, improving journey time reliability and introducing low or zero emissions rapid transit fleet will help reduce the creation of NOx, NO2 and Particulate matter for the long term.
It should be noted however in the short term that there may be some incidences of an increase in poor air quality in a small number of isolated areas where initial highway dis-benefits will be realised, however it is important to note that these do not exceed the legal limits.
Social Benefits
The provision of quick, comprehensive and reliable rapid transit network will increase opportunities for accessing jobs and other essential services for all, but particularly those from more deprived areas. Providing efficient, regular and attractive commercial services will improving public transport’s competitiveness. Reducing the reliance on the cost of owning and maintaining a car can also reduce the proportion of income people will need to spend on travel.
16 https://tfl.gov.uk/info-for/media/press-releases/2018/november/getting-more-people-walking-and-cycling-could-help-save-
our-high-streets
Hampshire Chamber of Commerce said in their letter of support that: “Investment in infrastructure will give Hampshire businesses real confidence.”

46
People who increase their use of public transport, are also likely to walk and cycle more, contributing to a reduction in levels of obesity and an improved overall population health.
1.9.2 Alignment of TCF objectives with SEHRT objectives
The TCF aims to help deliver the Government’s Industrial Strategy and drive up productivity and spread prosperity through investment in public and sustainable transport. The Fund aims to improve connectivity between urban centres and suburbs thus improving accessibility to employment and educational opportunities and to increase the number of these journeys made by low carbon, sustainable modes. This section will demonstrate that the SEHRT proposition has been developed to deliver the TCF objectives.
Table 1-7 demonstrates the alignment of the SEHRT objectives with the TCF objectives.

47
Table 1-7: Alignment of TCF Objectives with the SEHRT Vision/Objectives
Fast, frequent, reliable services
and infrastructure
Distinct from but
interchanging with other transport services
Industry-leading
rapid transit vehicles to deliver a
step change in travel
One system providing
fare capping over the full
range of transport services
Push notification
travel information for
all transport modes
Waiting facilities with real
time information
High quality routes for
pedestrians and cyclists
Reliable, convenient
journey times along RT network
Improve capacity on commuting trips
Access to employment centres, enterprise zones and development sites
Improving public transport reliability
Supporting economic growth
Reduce carbon emissions
Help to deliver wider social and economic benefits for the community
Support housing delivery
Improve air quality, particularly NO2 compliance
Align to Future of Mobility Grand Challenge

48
1.9.3 Fit with local, regional strategies
This section looks at the local and regional transport policies in South East Hampshire and considers them within the context of rapid transit. This includes key aspirations and objectives from major documents for strategy implementation and infrastructure delivery. Table 1-8 sets out how SEHRT aligns with these strategies.
Table 1-8: Review of Local and Regional Strategies related to SEHRT
Plan/Strategy How SEHRT supports the plan
Local Transport Plan 3: Strategy for South Hampshire17
SEHRT is an integral part of this policy. Through SEHRT the authorities are indeed working with bus operators to plan and deliver service improvements and new rapid transit infrastructure on several key corridors.
Transport for South Hampshire Transport Delivery Plan 2012-2026
One of the “precursors” to SEHRT is specifically identified in the plan as part of the programme of interventions to achieve sustainable economic growth.
SEHRT supports the plan’s ‘Primary Delivery Focus’ for the short and medium term of accommodating short-distance movements and achieving a reduction in car-borne local journeys. It also supports longer-term focuses for accessibility, employment and growth.
Solent LEP Strategic Economic Plan (SEP)
SEHRT aligns with Solent LEP SEP and supports unlocking 51,000 new jobs and 50,000 new housing units.
Solent LEP Strategic Transport Investment Plan
SEHRT supports all six of the objectives as given below:
Promoting dual city linkages.
Facilitating clustering of employment.
Promoting sustainable development nodes.
Integrating the transport network.
Improving strategic connections.
Providing transit orientated development.
Emerging Transport for South East (TfSE) Transport Strategy
SEHRT supports all five of the emerging plan's commitments that are currently being consulted upon:
Promoting sustainable and rapid transit orientated development.
Providing a reliable alternative to the private car.
Improving local trips and providing enhanced access to employment and skills.
Integrating the transport network.
Promoting dual city linkages and connectivity in the sub region.
Integrated and smart ticketing technology and public transport information.
Local Authorities Transport Statements
SEHRT aligns directly with the four key objectives within the Transport Statements:
Promote economic growth by maintaining a safe and efficient highway network,
reducing casualties and tackling congestion on the transport network.
Improve access to jobs, facilities and services by all types of transport.
Facilitate and enable new development to come forward.
Reduce carbon emissions and minimise the impacts of transport on the environment.
17 This is the transport strategy developed jointly by the three Local Transport Authorities of Hampshire County Council,
Portsmouth City Council and Southampton City Council, working together as Transport for South Hampshire (TfSH) (the predecessor to Solent Transport)

49
Plan/Strategy How SEHRT supports the plan
Partnership for South Hampshire (PfSH) spatial position statement (2016)
SEHRT directly supports the PfSH spatial position statement, particularly the key component of supporting modal shift through improving key public transport corridors and walking and cycling infrastructure.
The PfSH Spatial Position Statement identified SEHRT as an integral part of a wider transport strategy that would need to be implemented in order to mitigate the majority of the impacts of additional travel demand resulting from the development allocations proposed by the Spatial Strategy.
If SEHRT is not funded or delivered, the deliverability and/or sustainability of some of the housing and employment allocations and proposals within the Spatial Position Statement could be undermined.
Island Transport Plan18
SEHRT supports all these goals. In particular, within the goal of increasing accessibility, it helps meet the identified challenges of:
Enhancing social inclusion by increasing access to social networks, goods and services
by helping to improve the accessibility, availability and affordability of transport.
Maximising opportunities to increase travel choice and travel by sustainable means.
Increasing the quality, availability and take-up of car alternatives.
Island Regeneration Strategy
SEHRT supports the following key elements:
Better transport links as well as more affordable transport.
Better access to housing.
Improved protection of the natural environment due to reduced congestion and thus
better air quality.
Solent LEP Island Infrastructure Investment Plan
SEHRT supports the key infrastructure theme of ‘Transport’ in the Plan, and addresses the following constraints to growth:
Scope for strengthened connectivity across the Solent.
Road network congestion and capacity constraints.
Scope for local improvements – including Ryde Transport Hub, junctions, bus priority
signalling and smart ticketing.
Gosport Infrastructure Investment Plan
SEHRT forms key part of a comprehensive package of public transport improvements necessary to facilitate an accessible and productive Gosport global marine hub.
Havant Infrastructure Delivery Plan (IDP)
SEHRT would support all aspects of key issues identified for transport in the IDP:
Transport improvements that support sustainable economic growth and
development.
Optimising the capacity of the highway network and improving journey time
reliability for all modes.
Sustain a high-quality, resilient and well-maintained highway network for all, and to
improve road safety.
Air Quality Local Plans (Fareham and Portsmouth)
Six strategic objectives are included within the strategy, of which the rapid transit contributes directly to the following:
Focus on sustainable travel, including the promotion of modal shift in transport from
car to active travel.
18 This is the Isle of Wight’s Local Transport Plan

50
Plan/Strategy How SEHRT supports the plan
Reduce traffic and congestion related emissions, addressing road network flow and
functionality.
Stimulate sustainable citywide economic growth, including a focus on reducing
carbon emissions.
1.9.4 Fit with national strategies
This section looks at how SEHRT will align with the national strategies. The following strategies have been reviewed:
DfT Transport Investment Strategy: The Transport Investment Strategy sets out how DfT will respond realistically and pragmatically to today’s challenges, driving progress towards fulfilling Industrial Strategy aims and putting the travelling public at the heart of decision making. SEHRT aligns directly with the four key objectives of the Transport Investment Strategy:
Create a more reliable, less congested, and better-connected transport network that works for the users who rely on it. SEHRT will reduce congestion and better connect communities in the city region with an improved, efficient transport network;
Build a stronger, more balanced economy by enhancing productivity and responding to local growth priorities – SEHRT will increase the pool of labour supply for Portsmouth and communities in the city region, increasing agglomeration and productivity;
Enhance our global competitiveness by making Britain a more attractive place to trade and invest: SEHRT will help bring forward development sites and attract further investment in the city region;
Support the creation of new housing: SEHRT will help bring forward housing sites;
UK Government’s Industrial Strategy: The industrial strategy aims to create an economy that boosts productivity and earning power throughout the UK. It focuses on reinforcing the five foundations of productivity: ideas, people, infrastructure, business environment and places. For infrastructure, it sees the country’s economic geography being transformed by a surge of infrastructure investment heralding a new technological era. It specifically identifies the Transforming Cities Fund as a way of transforming productivity in city regions. It also acknowledges that efficient transport systems bring a wide range of work within people’s reach. SEHRT aligns directly with this goal of improving efficiency of labour markets.
Rebalancing the Economy: As part of the Transport Investment Strategy there was a commitment to develop a new assessment standard to better consider rebalancing impacts in transport business cases. This aims to ensure rebalancing is considered more consistently within decision-making by improving the focus, quality and transparency of rebalancing evidence presented. Evidence-base of the Strategic Case summarises how this SOBC covers all the areas set out in the DfT’s Rebalancing Toolkit.
1.10 Constraints, dependencies and stakeholder views
This section covers the key constraints and dependencies that could affect the delivery of SEHRT and also includes a list of activities carried out to engage with key stakeholders and evidence of their supports in terms of letters of support and intent.
1.10.1 Key constraints
Table 1-9 discusses the key constraints that could affect the deliverability of SEHRT programme and how and when these constraints will be mitigated.

51
Table 1-8: Key Constraints for SEHRT
Constraint Description SEHRT context Mitigation Measure
Design development
Timescales of TCF mean limited time to develop and deliver major schemes by March 2023
39 individual schemes are being developed over three different highway authority areas.
All schemes developed to feasibility design and preliminary design stages by early 2020 to enable detailed design to start post funding announcement.
Environment Scheme environmental impact and mitigation may increase costs and delay delivery
There are some environmentally sensitive areas adjacent to the programme, including designated Special Protection Areas (SPA), Sites of Special Scientific Interest (SSSI).
Heritage – Some schemes will be constructed in or near conservation areas.
Contaminated land/unexploded ordnance – The island of Portsmouth in particular suffers from incidences of unexploded ordnance and areas of contaminated land.
Ecology survey - There are a number of protected species resident in the South East Hampshire Area, including bats and migrating birds such as Brent Geese and other wader species.
It is difficult to assess the possible impact until preliminary environmental assessments have been undertaken. Any likely environmental impact identified at this early stage will be mitigated at the detailed design stage.
Ecology surveys have been carefully timetabled to both fit in with the delivery programmes of individual schemes and meet the seasonal requirements of the species that need to be surveyed.
Land Acquisition
Obtaining third party land and associated negotiations may delay scheme delivery and increase costs.
The SEHRT programme has developed in such a way that schemes requiring the minimum of land take have been prioritised, with only six schemes (within Portsmouth City Council’s SEHRT programme; for 3 scheme Portsmouth City Council is the land owner) and eight schemes (within Hampshire County Council’s SEHRT programme) requiring any land acquisition.
Where schemes required land negotiations these have been prioritised with many of these discussions underway already. The level of risk priced into the schemes provides an allowance for third party land costs.
If negotiations fail, mitigation measures will include revising the scheme design without detriment to overall SEHRT deliverables.

52
Constraint Description SEHRT context Mitigation Measure
Planning Some schemes will require planning permission potentially increasing timescales.
Six schemes require planning permission.
Schemes have been developed with, or in partnership with local planning authorities to reduce risk and reducing the risk requiring re-design.
Public consultation
Schemes will require public consultation.
Public opposition to schemes or aspects of schemes
To date very limited public consultation has been undertaken on the schemes.
Limited wider public consultation and engagement has been undertaken to date.
Residents may object to schemes being introduced and may avoid using new services.
The focus during the proposal stage has been on strengthening relationships with tier one and two stakeholders. Once funding has been announced, and schemes confirmed all statutory stakeholders will be engaged ahead of any formal consultation. This will allow for any concerns to be addressed to minimise negative responses during the consultation process. A communications and engagement plan for the construction phase will be developed and will include pre-construction consultation and further engagement activities.
A comprehensive programme of public engagement and consultation is planned once funding has been approved.
Construction Unknown ground conditions could lead to programme delays or in extreme circumstances ultimately require redesign.
As above, in certain areas unexploded ordnance may be unmapped and found during excavation work.
Prioritised schemes have undergone buildability assessment. Surveys (CCTV/GPR) booked in for April 2020 post funding announcement. Targeted geotechnical surveys to be undertaken.
1.10.2 Key dependencies
Table 1-8 below show key dependencies in the context of SEHRT and how these will be managed during the programme development and design stages.

53
Table 1- SEHRT Key dependencies
Dependency SEHRT context Mitigation
Co-ordination with Network Rail and Highways England
Network rail are responsible for delivering a consider component of the scheme and also are required to grant permission for works over their land to take place.
The Portsbridge Roundabout scheme directly interfaces with a Highways England off-slip from the M27. Schemes in Fareham could be affected by Highways England’s delivery of the M27 SMART motorways project.
Highways England: A small amount of land within the Rusty Cutter roundabout circulatory and adjacent to the A27 northbound lane.
Highways England could raise concerns about delivery. Uncoordinated delivery could also result in conflicting diversion routes of closures causing widespread travel disruption.
Early dialogue is underway with Highways England including the sharing of modelling information to ensure co-ordinated delivery of schemes.
The Isle of Wight have reached agreement in principal with Network Rail and Wightlink in order to work together to deliver the proposals within SEHRT.
Co-ordination with South Western Railway
South Western Railway are delivering a component of the Ryde Interchange Hub.
Delays to the South Western Railway scheme could cause conflict with delivery of other components on the Ryde Interchange scheme.
South Western Railway have been a key partner of the Isle of Wight Infrastructure Board and have a costed and designed scheme ready to be delivered as part of the TCF programme.
Bus Operating Companies
The proposed rapid transit bus network is to be provided and operated without subsidy, so resource efficiencies and increased passenger revenue are essential for its continued viability.
Our partnership is unique in its nature with operators, based on our previous success towards delivering schemes. The operators will be an integrated part of the programme development team to ensure that they have full visibility of the analysis and design work.
1.10.3 Stakeholder engagement and/or public consultation activities
A stakeholder management and engagement plan has been created to ensure all key stakeholders are properly informed of the scheme, and the progress of the bid, to ensure their support and to highlight any concerns at the earliest opportunity. More details can be found in section 5.9.
Stakeholder engagement
Several early engagement events with key stakeholders took place between March and November 2019, these are detailed in section 5.9.2. The purpose of these events and briefings was to inform important

54
stakeholder of the SEHRT proposal, and to gain their support of the scheme. Further engagement with statutory stakeholders is planned once funding has been confirmed.
Electronic/Social Media Engagement
Section 5.9.2 includes information about SEHRT have been created to support tier one and two stakeholder events and raise awareness of the scheme.
Customer insights
Market research was conducted by Hampshire County Council's Insights Team to investigate the public appetite for a rapid transit system, and attitudes towards behaviour change. Responses from this initial online survey will help shape the service and will inform marketing and communications plans going forward.
Respondents were also asked about their current travel habits. Top level findings from 3,277 responses include:
Overall 77% of respondents find the concept of a rapid transit system for their local area appealing.
The most common reason for supporting a rapid transit scheme was the reduction in journey times.
The three most important factors when choosing a mode of travel were: convenience, cost and journey time.
Private vehicle users are more likely to use buses if it is cheaper to travel by bus, there is an environmental benefit, journey times are reduced, or if services are more direct.
When asked how people would like to pay for bus travel, 90% of respondents' first preference was for a system other than cash payment per journey.
There were over 1,800 comments given to explain why respondents felt using public transport was difficult, and these have been shared with the Rapid Transit Development Manager for further exploration. Themes include routes, frequency, journey time and cost.
Further details about the headline results can be found in section 5.9.3.
Community Panel
The public survey provided an opportunity to recruit residents to an online community panel. 840 people signed up to join the panel, which will be used in the future to help design public transport services. Panel members will be invited to take part in surveys, focus groups and other research activities to inform SEHRT-related projects in the area. (The panel recruitment has been carried out, but the panel has not yet happened.)
Market research was conducted to support the Portsmouth RTI scheme (Tranche 1). Members of the panel who live in Portsmouth were contacted and asked to participate in the RTI survey, demonstrating how the panel will be used for future schemes.
Statutory stakeholder
The scale of the proposed SEHRT network will inevitably be of interest to a number of statutory stakeholders. Some engagement has already been undertaken with the relevant Local Planning Authorities and Highways England with regards to schemes that may directly impact their areas of interest.
As part of the preliminary design stage, C3 stats have been requested for many of the schemes however greater engagement of local utilities providers including SGN, SSE, Southern Water, Portsmouth Water, BT & Virgin Media will commence following submission of this SOBC.
Schemes within Portsmouth are almost exclusively within the Highway boundary and as such are unlikely to require little if any involvement with the Environment Agency or Natural England however some schemes in the wider bid might require some consultation with these organisations.

55
Other key consultees include Queen Alexandra Hospital, University of Portsmouth, local interest groups (Cycling, walking, disability and environmental) and developers all of whom the introduction of an SEHRT network could benefit. The vast majority of local transport operators (including bus, rail and ferry) have been integral to the development of both the SEHRT network and the Portsmouth City Region bid through participation on the SEHRT Partnership board. Transport operators have been kept informed of the bid through attendance of partnership board meetings, and the SEHRT e-update newsletter. This resource, along with other informational materials created to date, will be made available to all statutory stakeholders once engaged in the scheme.
1.10.4 Evidence of stakeholder support
Section 5.9.5 summarises the letters of support and intent from stakeholders. Notable letters include letters of intent from the Chief Operating Officer of Stagecoach UK Bus and the Managing Director of First Bus, and letters of support from members of the Partnership Group, major employers such as Portsmouth Naval Base, QAH, the University of Portsmouth, and further education providers.
Selection of statements from stakeholder letters of support and intent
A selection of statements from stakeholder letters of support and intent, as detailed in appendix 5.12, is provided below:
Stagecoach UK: "The priority that Stagecoach attach to this bid is reflected not only in the considerable amount of time devoted by local senior management, but in the involvement and support of myself and Robin Knight, UK Partnerships Director, who has attended the workshop sessions with Edward Hodgson as part of the detailed co-design process, which has been a hallmark of this bid."
University of Portsmouth: "Rapid transport will be hugely beneficial for our staff and students…We wholeheartedly support the desire to get people out of their cars in such a crowded island city."
South Western Railway: "Enhancing integration with rail either in the SEHRT or on the Isle of Wight, will support sustainable growth, encourage a more active approach to travel and deliver a more attractive option to the car. The key rail routes through the SEHRT area and on the Isle of Wight will be an important component of this as bus, cycle and waterborne transport enhance links from the stations to all areas and travel to work corridors."
Solent LEP: "Solent LEP endorses the overarching approach proposed for the Portsmouth City Region TCF, which will bring forward improved connectivity solutions that are proven and which will benefit both the movement of people, and also the movement of goods, in this strategically important part of the UK."
Portsmouth Naval Base: "The Naval Base does not operate in isolation, it is part of this marvellous Island and draws upon its people for employment and services within its walls; indeed, the relationship is symbiotic. The benefits, both direct and indirect, accruing to both parties should this funding be awarded plays to the very heart of my vision for a Naval Base, fit for the 21st Century - the ‘World’s Best Naval Base’, which is described as ‘For the Navy, with the City, to the Nation’."
Transport for South East: "This bid compliments [our] aim to support and grow the economy through a programme of integrated transport projects and programmes. We will unlock growth, boost connectivity and speed up journeys while improving access to opportunities for all and protecting and enhancing our region’s unique environment."
Solent Transport: "Fundamentally, delivery of the proposed SEHRT network would result in a genuine step-change in sustainable, car-free connectivity around the Portsmouth city region, creating a reliable, frequent and attractive transit network fit for (and benefitting a majority of the population of) this growing urban area of nearly 500,000 population."
Portsmouth Cycle Forum: "A key area of our ‘A City To Share’ campaign over the last five years has been a desire to see safer roads for the city’s cyclists. Much of that wish depends on dedicated infrastructure for them, but we need to enable residents, visitors and workers to use fast, effective, frequent and comfortable public transport so there is less need for private vehicles to be used to move around the city."

56
BAR Technologies: “Portsmouth has made such fantastic progress over the last decade and we see the next phase of SHERT as an essential next chapter. We are strong believers in a greener future and would therefore like to see cleaner transport playing a mayor part in our future”.
Portsmouth International Port: “With a growth in customers, it is essential that we bridge the port and the city through sustainable transport means”.
Sustrans: “[Rapid transit] will address congestion at key commuting times, creating more opportunities for walking and cycling as fewer single occupancy vehicles travel through the region”.
Isle of Wight College: “I wish you every success with the bid and look forward to hearing of an outcome that will undoubtedly benefit all islanders”.
Examples of questions raised and discussed with stakeholders:
The following question were raised during our engagement with stakeholders:
Raised questions on how Real Time Information works, the specifics of each scheme and the types of
buses that will be introduced.
Spoke about the experience with Oyster card and preferred carnet products for extra flexibility.
Raised the pricing structure and suggested a means-tested approach for passes and an incentive
mechanism for using RTI. The importance of working with employers to assist staff in purchasing such
passes as an incentive for travel was highlighted.
Questioned Southampton Road (Portsmouth) as a viable route - observed many buses run empty
along this route.
Will the frequency of BRT meet customer expectation?
Have impacts to the residents resulting from the infrastructure projects been assessed?
How will the funding be prioritised?
Has there been thoughts on concessionary fares for weekend/evening travel?
A Frequently Asked Questions (FAQs) page has been created on the SEHRT website. This page will respond to some of the questions raised to date, and throughout the scheme. The FAQs page can be found here: https://www.sehrt.org.uk/why-rapid-transit/faqs/
Ahead of scheme delivery, a tracker tool will be created to support the stakeholder management plan. This will record all engagement throughout the project, together with key issues arising and actions taken as a result (to inform design, for instance). It will also record external queries and any actions taken as a result. It will be regularly reviewed by the project team and maintained throughout the project lifecycle. This will ensure an overview of all engagement is maintained and issues are resolved in a timely manner.
A number of announcements were made to local media between March and November, to inform members of the public of the bid, and progress of the scheme. An example of the positive coverage can be found here: https://www.portsmouth.co.uk/our-region/portsmouth/portsmouth-and-gosport-to-get-4m-for-significant-traffic-and-public-transport-improvements-1-8853585

57
1.11 SEHRT interface with FMZ and CAZ investment
1.11.1 Interface with FMZ
The Solent Transport FMZ bid19 incorporated initiatives that would strengthen and deepen the benefits of the TCF business cases from Portsmouth and Southampton city regions.
The Solent Transport FMZ programme would implement a programme of trials and tests of innovative approaches to address local challenges such as high levels of car usage and the impacts of freight movement within Solent’s urban areas through delivering a series of complementary projects within two key “Themes” (Personal Mobility and Sustainable Urban Logistics). The projects within both themes were specifically selected and developed to strengthen and deepen the benefits provided through the SEHRT proposition. Given that there are uncertainties over funding, resulting from the FMZ Fund being a competitive process, the FMZ and TCF projects have been designed to stand alone. However, the bids are complementary and significant additional benefits would be achieved when delivered in combination, as shown in Table 1-9.
Table 1-9 - Key projects of FMZ and their alignment with SEHRT proposals
FMZ project Additional benefits to FMZ Additional benefits to SEHRT
MaaS trials A significantly improved public transport offer will widen choice available to MaaS trial users. This may help the trial succeed in encouraging modal shift away from the private car. Upgraded ticketing systems such as ‘Tap on, tap off’ will increase ease of access and data availability for MaaS trial users. This should help improve MaaS’ potential to drive changes to travel choices.
Early stages of the MaaS trials could provide insightful data to help transport operators refine their rapid transit services when they come online. Running MaaS trials when rapid transit services have been introduced provides an opportunity to introduce new potential users to the services. It will provide additional data that will be useful to the operators in understanding the operation of their new services.
Growing Solent Go TCF will improve the overall public transport offer, making multi modal journeys both more viable and popular. In turn this will increase the potential market for Solent Go products.
Growing the use of Solent Go will provide an additional platform for users to access and pay for rapid transit services, especially where multi modal journeys (i.e. bus – ferry) may be attractive.
Mobility credits TCF proposals will improve links in areas of greater deprivation (including the parts of Havant Borough where the Mobility Credits trial is proposed to operate) so could potentially widen the choice/attractiveness to those in receipt of mobility credits. This, however, may also create difficulties in determining the effectiveness of Mobility Credits by themselves.
Limited benefit – could service to publicise and build advocacy in more deprived communities that are served by rapid transit routes that will be targets for the delivery of mobility credits. May drive some additional PT usage above that expected to result from TCF improvements, but small scale of the Mobility Credits trials means the scale of this benefit will be small.
DDRT trials TCF bus/ rapid transit priority and interchange interventions would be expected to significantly benefit operation of DDRT trials by providing
One or two DDRT trial zones may operate within the SEHRT area. These trial zones would be set up with specific objectives to provide improved first mile/ last mile links to the SEHRT network, and to serve
19 http://www.solent-transport.com/images/Bids/future-mobility-zones-fund-application-form-final-proposal_30_09_19_FINAL_redacted.pdf

58
FMZ project Additional benefits to FMZ Additional benefits to SEHRT
priority over other traffic at pinch points for DRT vehicles in addition to buses.
“thin” patronage flows which SEHRT would not serve effectively. Therefore DDRT trials would be expected to provide benefits to the SEHRT proposal in some parts of the city region and may somewhat uplift PT usage compared to the TCF proposal by itself.
Cycle Share The TCF proposals include a considerable amount of ‘access to stop’ infrastructure and a number of cycle improvements linking public transport facilities. These infrastructure improvements are expected to create routes which support the strategic role envisaged for cycle share (access to SEHRT corridors).
The cycle share proposals have been specifically conceived with the objective of providing improved first/ last mile access to SEHRT corridors (thus strengthening the SEHRT offer, and potentially delivering increases in patronage above that forecast in this SOBC). Cycle share will also provide access to cycles to those that either cannot afford one or only wish to use one occasionally, supporting active travel-oriented improvements within this business case.
Local Mobility Hubs and Interchanges
The TCF proposals will provide upgraded interchange facilities at a number of places in the South East Hampshire area. It is proposed that in off peak periods, mobile/”pop up” micro logistics hubs would utilise some spare capacity at certain interchange sites (reserved via bookable bay systems) to act as a hub/focal point for sustainable last mile delivery routes.
FMZ proposals for additional services such as click and collect provide opportunities to add value to the TCF interchange proposals through increasing the range of services available to PT users on their journeys. This will help to increase footfall and could also provide revenue streams to support greater and more innovative services at these locations.
1.11.2 Interface with CAZ
The Portsmouth Air Quality Local Plan SOBC was submitted to JAQU in October 2019 proposing a Class B charging Clean Air Zone covering a small area of Portsea Island in conjunction with a number of non-charging measures to ensure compliance is achieved in the shortest possible time.
The non-charging measures included in the preferred package are:
Improvements to strategic cycle routes.
Reduction in car parking availability.
Changes to traffic signal timings on Alfred Road.
Delivery of a real time air quality monitoring and warning system.
Tightening of licensing requirements for taxis and private hire vehicles (subject to approvals).
A sensitivity test of the impact of the SEHRT medium investment package demonstrates that all areas within Portsmouth remain below the NO2 legal limits in 2024. Compared with the 2024 baseline, Table 1-11 shows that the combined impact of the CAZ B package and SEHRT medium investment package of interventions lead to a small increase in NO2 concentrations on Alfred Road and Hope Street but still within legal tolerance, and below the 40mg.

59
This small increase in these isolated areas is believed to be due to changes in road configurations and bus flows in these areas associated with the TCF interventions. A preliminary environmental assessment work will be undertaken to assess the impact and any likely impact(s) will be mitigated at the detailed design stage.
Table 1-10 - Predicted NO2 levels for 2022 and 2024 with combined CAZ and SEHRT proposals
Receptor ID
Road Name Future Baseline (2022)
Future Baseline (2024)
CAZ B + non-charging measures + TCF (Medium scenario 2024)
Exceedance locations
573 A3 Alfred Road (Unicorn Rd to Queen St, s/b) 41.7 37.4 38.6
546 A3 Commercial Road (south of Church St Roundabout, s/b)
41.1 37.6 36.7
Near exceedances (37 µg/m3)
526 Church Street (east of Church St Roundabout, n/b) 38.7 36.7 35.6
536 A3 Hope Street (south of Church St Roundabout, s/b)
38.9 35.5 35.8
824 A2030 Eastern Road Water Bridge (s/b) 38.8 34.7 34.7
648 A2047 London Road (Stubbington Ave to Kingston Crescent, s/b)
38.5 35.2 34.0
520 Mile End Road (north of Church St Roundabout, s/b)
37.6 34.3 34.7
557 A3 Marketway (Hope St Roundabout to Unicorn Rd) 37.4 33.7 33.3
Road sections on the Strategic Road Network exceeding the EU limit (40 µg/m3) in 2022
986 A27 (north of Portsea Island, w/b) 48.5 42.6 42.1
1089 A27 (east of Portsea Island, w/b) 46.1 40.3 38.8
11 M27 (west of Portsea Island, w/b) 45.3 39.6 n/a
968 A27 (north of Portsea Island, e/b) 43.7 38.5 38.1
834 A27 (east of Portsea Island, w/b) 41.1 36.6 36.2
n/a- No result given as TCF network does not cover this area.
1.12 SEHRT impact on other transport networks
This section describes the impact the SEHRT programme would have on other transport works i.e. rail networks and SRN.
1.12.1 Impact on Network Rail
The Island Line on the Isle of Wight currently transports around 211,800 passengers annually to and from Ryde Pier Head. From Ryde, Isle of Wight residents are connected to the mainland via Portsmouth by the Wightlink foot passenger ferry (from Ryde Pier Head) and hovercraft (from Ryde Esplanade). This combination of services links residents to Portsmouth and other key employment hubs in the region via onward South Western Rail routes from Portsmouth Harbour and Portsmouth and Southsea stations.
The DfT have committed £26 million investment to the Island Line which will make the following improvements leading to improved quality and reliability of the service for users:
Increased capacity during peak times;
Improved rolling stock;

60
Track enhancement work;
Station improvements.;
Increased frequency to improve connections to the mainland; and
Improved facilities for people with limited mobility.
However, for the benefits of this investment to be fully realised, further investment is greatly needed for the
transport infrastructure that supports this link between the Island Line to Portsmouth. Network Rail are
proposing £25 million of investment to address these opportunities. These includes investment to Ryde Pier
and improving access to Island Link and Ferry services for different users. Ryde Pier was built in 1880 supports
the rail line between Ryde Esplanade and Ryde Pier Head stations. The pier is in a poor condition and without
intervention, pier infrastructure would fail leaving the Wightlink high speed foot passenger cross Solent ferry
service inoperable. Improving active mode facilities along the pier, improving the Park and Ride at Ryde St
John’s and upgrading the Ryde Esplanade Interchange will enable access to Island Link stations, ferry and
hovercraft services to residents in a wider catchment area which will increase patronage of these services.
The DfT and Network Rail improvements in combination are expected to attract more passengers, increasing the number of people using the Island Line service by approximately 66,000 passengers over the period 2022 – 2024. This in turn is expected to also increase passenger numbers at Portsmouth Harbour station as travel by train from the Isle of Wight to other destinations in the UK becomes more attractive. It is expected that there will be an impact to the operation of Island Line services to/from the Pier Head Station during certain periods of the works. Senior officers from the Isle of Wight Council, Wightlink, Island Line and Network Rail will keep in regular contact throughout the project process to mitigate these disruptions.
1.12.2 Impact on Strategic Road Network
The pattern of development within the Portsmouth city region, straddles and coalesces along the SRN and has led to complex, polycentric, car-dependent travel patterns.
These travel patterns are leading levels of congestion that have implications for the resilience of the network and reduces the ability of the motorway to provide a good level of service for economically important longer distance movements such as freight traffic. Planned development in the region (particularly to the West of Fareham) is expected to generate additional demand, worsening congestion and putting further pressure on the SRN.
Much of the M27 and the M275 northbound slips at Rudmore Roundabout in Portsmouth city region are operating at capacity. While the capacity of the M27 is currently being enhanced between Fareham (Junction 11) and Southampton Airport (Junction 4) through Highways England’s Smart Motorway Project, there is no commensurate enhancement in capacity between Fareham and Portsmouth on the M27, or further east of Portsmouth on the A27 and A3(M).
Indeed, the SRTM Do-Minimum test results show that 9% reduction in average travel speed from 88kph to 80kph from 2019 to 2041 and 27% increase in flow on the SRN. These results clearly demonstrate that the SRN will experience significant increased flows giving rise to reduced travel speeds as expected, demonstrating increased highway usage where there is no real alternative to private car travel. This highlights that the congested transport network will continue to provide a constraint that effects both the local roads and also the SRN.
In response to these local and strategic road network issues, the SEHRT will:
Connect towns that were previously isolated to the public transport network such as Gosport and
Waterlooville.
Offer convenient, reliable services with shorter journey times and provide better access for pedestrians
and cyclists to and from the rapid transit network.

61
Improve the public transport proposition to encourage modal shift away from private car use, especially
focussed on key travel to work areas within the city region.
1.13 Conclusion
The city region transport network is limited in its extent by land availability in urban areas and the island and peninsula geography, which means the transport corridors are heavily congested.
Limited public transport options, with infrastructure deficits across all modes, have meant that the majority of labour mobility in the city region is achieved by driving: most travel flows in the city region, notably including many into Portsmouth city itself, have a car mode share of 70% or more, which is leading to congestion, and further reducing the attractiveness of public and active travel modes. Indeed, even for flows where driving is considerably less direct than public transport option, driving still is the mode of choice for many commuters.
Portsmouth city region lags behind the UK average in GVA and competitiveness: employment concentrated in low productivity sectors, there is a low retention of skilled labour and university graduates. The city region currently is forecast to experience employment growth without commensurate growth productivity.
It is on the periphery of the city region where some of the highest levels of derivation are experienced. The 2019 report "Left Behind? Understanding communities on the edge" identifies Gosport, Leigh Park, Wecock Farm and Paulsgrove as being 'left behind': areas which suffer from poor connectivity, with long travel times to key services and opportunities in the centre of the city region.
The city region is caught in a vicious cycle of too many cars, on too few corridors, causing severe congestion, environmental degradation, isolating communities and limiting productivity. Already long journey times have worsened as congestion has grown making public transport more expensive to provide and less attractive to use.
The city region is caught in a vicious cycle of too many cars, on too few corridors, causing severe congestion, environmental degradation (in Portsmouth and Fareham AQMAs), isolating communities (especially in Gosport, Leigh Park, and Paulsgrove) and limiting productivity (due to slow growth in GVA). Already long journey times have worsened as congestion has grown making public transport more expensive to provide and less attractive to use.
Without a significant intervention to disrupt these trends, this is set to continue, and worsen given ambitious growth agenda which seeks the delivery of 50,000 new dwellings and 51,000 new jobs by 2036 in a sustainable and socially inclusive way.
To address these challenges, Portsmouth City Council, Hampshire County Council, the Isle of Wight Council, Borough Authorities and our local bus operators are united and committed to deliver the much-needed high investment package for a rapid transit system within the Portsmouth city region.
We are confident that the SEHRT high investment package will deliver the comprehensive interventions, at the scale necessary, to boost the productivity and sustainability of the city region, and to open up opportunities to all our communities to reach new opportunities enabling the city region to prosper and reach its full potential.
The high investment package has been selected through a robust and evidence-based optioneering process and will deliver enhanced bus rapid transit network, infrastructure improvements to junctions and corridors, improved access to/from rapid transit stops and enhanced transport interchange improvements with other modes (particularly waterborne) at key destinations.
Recognising that the isolated delivery of public transport capital infrastructure cannot deliver the wider benefits from improved connectivity, this bid is supported by commitments from each of the Local Authorities (in terms of policy measures) and our bus operator partners (through a quality bus partnership), to ensure that the best possible value is gained from capital investment.
SEHRT is aligned with the local, regional and national policies, and will deliver the expected benefits and outcomes in South East Hampshire. To achieve these outcomes, key constraints and dependencies against the

62
delivery of SEHRT are examined and appropriate mitigation measures are identified which will be implemented during the package development and design processes.
The deliverability of SEHRT is supported by positive feedback from key stakeholders (including Network Rail) and members of the public - received during various engagement activities between March and November 2019. For example, our customer insights survey found that 77% of 3,277 respondents feel the concept of a rapid transit system for their local area is appealing. Engagement with land owners and statutory stakeholders is in progress and will support the planning and environmental assessment workstreams.
The SEHRT proposals strongly complement interventions identified in our FMZ and (Portsmouth City Council) CAZ funding applications. The cumulative effects of SEHRT with these interventions would allow the city region to experience the modal shift, customer satisfaction and improvement to air quality much earlier than if delivered in isolation.
This high package will embed sustained longer-term benefits, to more people, over a wider geographical area, delivering significant and sustained mode shift away from the car, supporting both public transport and active travel modes, improving connectivity and productivity.
63

64
2. Economic case
2.1. Introduction
The economic case sets out the extent to which each package provides good value for money, and the assessments underlying this. The structure is as follows:
An overview of the approach to economic appraisal (Section 2.2).
An overview of the approach to modelling (Section 2.3).
How programme costs were estimated (Section 2.4).
How programme benefits were estimated (Section 2.5).
The results of each element of the economic appraisal (Section 2.6).
Summary reporting of the results, including benefit-cost ratios (Section 2.7).
Results of sensitivity tests undertaken on the appraisal values (Section 2.8).
A summary of the indicative non-monetised impacts and reporting though the Appraisal Summary Table (Section 2.9).
A concluding statement of the likely value for money of each package (Section 2.10).
In recognition of this as a Strategic Outline Business Case, a proportionate approach to economic assessment has been followed and analysis and evidence continue to be developed as greater depth of information becomes available. The assessments within the economic case are based on the state of development of the proposition as at the 13th September 2019. The impact of subsequent changes to the proposition will be discussed through qualitative commentary on the key impacts.
2.2. Overview of economic appraisal approach
TAG and Green Book principles: The appraisal follows the principles set out in the Department for Transport’s guidance TAG, which itself is based on principles set out by the Treasury in its Green Book. It also addresses the requirements set out in the Transforming Cities Fund Tranche 2 guidance.
Scenarios: The economic appraisal involves assessing the monetised costs and benefits of each package (‘do-something’ scenarios), compared to the situation without any of the packages (‘do-minimum’ scenario). The scenarios appraised are:
High investment scenario;
Medium investment scenario
Low investment scenario.
Section 1.2 of the Strategic Case sets out the contents of each of these scenarios.
Each of the three packages (high, medium and low investment) will include complementary measures, particularly parking restraint, commensurate with the scale of investment. The physical measures are currently ahead of the complementary measures in maturity, and the complementary measures and design will continue to be developed. For the purposes of the economic analysis and modelling, the scheme designs have been frozen at the state of development as at 13th September 2019.
Price and value base: All monetised costs and benefits are expressed as present values (PV) in 2010 prices, discounted to 2010. This is in line with Department for Transport and Treasury guidance.
Costs: The costs of each programme are based on:
The investment (capital costs), as estimated by the design teams for each element (Section 2.4.1);

65
Estimated operation, maintenance and renewal costs over the 60-year appraisal period (Section 2.4.2); and
Any relevant grants, subsidies, developer contributions or equivalent, and revenues that accrue to the public sector (Section 2.4.3). For the South East Hampshire Rapid Transit packages this mainly covers transport operators’ share of the overall investment cost (which is netted-off from the total), but also includes items of match funding from private contributors and Network Rail.
Benefits: The benefits are estimated from several sources:
User benefits (including travel time savings for bus passengers) and revenue impacts on private sector providers (essentially public transport operators), assessed using TUBA based on modelling the packages in the Solent Regional Transport Model (SRTM) (Sections 2.5.1, 0 and 2.5.3);
User impacts during construction and maintenance (Section 2.5.4);
Impacts from changes to the number of accidents (Section 2.5.5), forecast using COBA-LT;
Greenhouse gas impacts assessed using TUBA (Section 2.5.6);
Local air quality and noise impacts (Section 2.5.7);
Physical activity impacts (Section 2.6.8);
Journey quality impacts (Section 2.5.9);
Journey time reliability (Section 2.5.10);
Wider economic impacts (Section 2.5.11);
Social impacts (Section 2.5.12); and
Distributional impacts (Section 2.5.13);
Results: The results from different elements of the appraisal are set out in four summary tables for each scenario:
The Transport Economic Efficiency (TEE) table (Section 2.7.1);
The Public Accounts (PA) table (Section 2.7.2);
The Analysis of Monetised Costs and Benefits (AMCB) table (Section 2.7.3);
The Appraisal Summary Table (AST) (Appendix 2.20).
For each scenario, an initial benefit cost ratio (BCR) is calculated (Section 2.7.4). In line with Department for Transport guidance, this initial BCR excludes the monetised journey time reliability impacts and certain wider economic impacts. An adjusted BCR is also calculated which includes these elements (Section 2.7.5). Certain other wider economic impacts, plus non-monetised impacts and sensitivity tests are then also taken into account (Section 2.9), leading to a final value for money assessment (Section 2.10).
2.3. Modelling approach
The central modelling tool used in this appraisal is the Solent Regional Transport Model (SRTM). This TAG-compliant multi-modal transport model can be used to test the impacts and benefits of land use and transport interventions. Further information can be found at:
http://solent-transport.com/images/reports/SRTM2015.
The model has recently been updated to reflect 2019 data, retaining 2015 as the base year.
The use of SRTM has enabled the modelling of not only physical interventions such as the junction and corridor schemes as well as changes in public transport routes and schedules, but also ‘softer’ factors such as enhancements to the overall quality of the rapid transit service and interchange facilities compared to existing options, and the impact of complementary measures.

66
Full details of how these interventions were reflected in the model are provided in the Model Forecasting Report in Appendix 2.18
2.3.1. Modelling assumptions
2.3.1.1. Journey time changes
Journey times have been estimated to account for the following elements of the proposition:
bus priority measures;
double-door buses enabling simultaneous boarding and alighting;
limited stop services;
tap out readers;
buses not waiting until passengers are seated before departing; and
improved stop geometry.
For existing routes, or those being converted to rapid transit, the change in journey time from the existing service has been applied to the model, representing the incremental benefit that is offered by these services. For totally new services, the forecast end to end journey time has been applied.
These journey time changes are applied consistently throughout the appraisal period.
The proposed new route between Horndean and Portsmouth provides an illustration of the approach. Without any intervention, journey time is estimated at 77 minutes. In the high investment scenario, bus priority is estimated to deliver a reduction of 5 minutes to give a journey time of 72 minutes. These times are direct adjustments to/estimate of the journey time for the relevant services and are maintained throughout the appraisal period. There are then further changes (to the nearest minute), derived reflecting the factors described above, which have been benchmarked against observed gains from other similar interventions across the UK:
Double-door: -5 minutes;
Limited-stop operation: -5 minutes;
TOTO exit reader: -2 minutes;
Change in policy on bus pulling away: -2 minutes; and
Improved stop geometry: -2 minutes.
This results in an overall reduced journey time of 57 minutes in the high investment scenario. The same process applies in the other scenarios, but of course with even lower journey times due to the additional priority measures.
2.3.1.2. User perception
An adjustment to the In-Vehicle Time (IVT) has been applied to each rapid transit service to reflect the relative user perception of a high-quality rapid transit service compared to a ‘standard’ local bus service. This captures a tendency for users to perceive rapid transit systems such as South East Hampshire Rapid Transit as better than standard bus services and therefore more likely to use this mode of transport compared to regular buses, even above the outright journey time benefits offered by these services.
A factor of 0.9 has been applied across all South East Hampshire Rapid Transit services. This value has been derived after drawing on experience of other modelling activities used to represent the perception of a rapid transit network, where factors as low as 0.85 have been applied in instances where full segregation for the entire route occurs. South East Hampshire Rapid Transit offers a number of the benefits associated with other comparable systems such as the Cambridge Guided Busway and Bristol Metrobus, including:

67
Improved journey time reliability (the benefits of which will be assessed separately), giving greater consistency of passenger journey times;
New, high quality vehicles;
A notable differentiation in the level of service from local buses; and
Comprehensive marketing and information provision for the entire network.
The time weighting of 0.9 reflects the increased enhancements available and the fact that the reliability of the services is superior to conventional bus services as a result of the significant investment in priority infrastructure and therefore modal shift towards such a system is greater than it would be for conventional services. The time weighting has been chosen to be between that for bus and rail. This is in line with TAG Unit M 3.2 (DfT, January 2014) which confirms that “in some instances, factors may be applied to the in-vehicle times that reflect people’s preferences for the various modes. This is most likely to be relevant where the influence of fare on the choice of routes and services is likely to be quite weak and, as a result, the fare term may be excluded from the generalised cost formulation used at the assignment stage. These in-vehicle time factors may be interpreted as mode-specific values of in-vehicle time. Thus, instead of an in-vehicle value of time of unity being used, as might be used in models for multimode transport studies, non-unity values of in-vehicle time are used to represent the inherent, relative attractiveness of the various modes”.
There is evidential support for this, for example the Stated Preference experiment in the north of England on bus rapid transit conducted by Whelan et al. (2008)20 which found that the public’s perceived time weighting for bus rapid transit was 0.92 of the time weighting for conventional bus. Light Rail was discovered to have a perceived time weighting 0.78 of the same. The value of 0.9 has been adopted here to be consistent with the representation of the Cambridge Guided Bus ridership in the Cambridge Sub Regional Model, as when compared with surveyed GB usage in 2012 the model response was found to correspond well with the observed data for this level of IVT adjustment. It was also found during CSRM2 calibration that using this weighting produces plausible ridership results in comparison to other bus services. Therefore, the same level of perception has been applied in South East Hampshire Rapid Transit to reflect the appropriate attractiveness of a bus rapid transit system and therefore the appropriate levels of patronage on the services.
There are a number of similarities between the Cambridge Guided Bus and the South East Hampshire Rapid Transit networks:
Both offer a higher quality fleet as part of the service offering;
Both are branded as ‘rapid transit’ services, with key distinguishing factors from local bus services;
Both offer a fast, frequent and reliable service; and
Both networks have a mix of segregated infrastructure and non-segregated running. It is important to note that whilst the proportion of segregation on the Cambridge Guided Bus is greater than South East Hampshire Rapid Transit, South East Hampshire Rapid Transit also offers significant bus priority infrastructure outside the segregated areas of the network, which is not present on the Cambridge Guided Bus network.
There is therefore evidence to suggest that the perception of the two services is likely to be similar and therefore the same representation of user perception as that in the Cambridge Guided Bus has been used. It should also be noted that this factor comprises a small proportion of the overall journey time that a user experiences and therefore does not have a major impact upon the user benefits. This is demonstrated through a sensitivity test in section 2.8.6.
2.3.1.3. Differential through time
Our bus operator partners have committed to a Quality Bus Partnership for the operation of South East Hampshire Rapid Transit which seeks to ensure that the South East Hampshire Rapid Transit network is of a 20 G Whelan, J Crockett, L Hunt and C Sinclair, “Willingness to pay for bus rapid transit: an examination of the influence of psychographics on choice”, in Proceedings of the European Transport Conference 2008. http://etcproceedings.org/paper/willingness-to-pay-for-bus-rapid-transit-an-examination-of-the-influence-of-ps

68
high quality throughout its existence. The operators recognise and support the fact that South East Hampshire Rapid Transit should maintain its perception advantage. Therefore, the IVT adjustment will be maintained throughout the appraisal period, with the associated incremental maintenance and renewal costs to deliver this captured accordingly.
2.3.1.4. Bus stops and interchanges
Several improvements are being proposed at South East Hampshire Rapid Transit ‘super stops’ and key interchange locations, which influences the attractiveness of the different stop locations across the network. To incorporate into the model, these improvements have been cross referenced against TAG table M 3.2.1 to provide values of generalised minutes that relate to the enhancements, the values of which have been used to make appropriate adjustments to the wait curve at each location where the respective enhancement is deployed. These benefits are captured over a 60-year period, considering the required incremental renewal costs to maintain the value of differential in user benefit throughout this period.
2.3.2. Modelling results
Several bus frequency issues have been identified through review of the SRTM results. This has meant that the service frequencies between the ‘do-minimum’ and 'do something' tests are closer together than they should be in certain locations, which results in the scheme benefits that are presented being lower than would be the case. The areas affected are the Wecock Farm, 21 and 700 ‘do-minimum’ services, where the coded frequencies are too high.
This is considered within a sensitivity test but should also be recalled when reviewing the core results presented in the following sections. We propose to re-run the SRTM tests post-submission to confirm the impact of these incorrect service frequencies.
Since receiving the SRTM runs for the November submission, there has not been an opportunity to update the specification of the medium and high investment scenarios as a result of analysing the results. It has been identified that there is genuine potential to enhance service frequencies to take advantage of operational efficiency and additional revenue that the infrastructure generates, to provide a higher frequency service offering in these investment scenarios. It is anticipated that these tests will also take place post-submission alongside further operator engagement on any proposed changes to the service specifications. The comparative presentation of medium and high investment scenarios performance relative to the low investment scenario can be considered pessimistic.
The consequent potential enhancements to a revised proposition are shown below.
Waterlooville corridor
Wecock Farm: up from six buses per hour (bph) in the low investment scenario to eight bph in the medium and high investment scenarios;
Horndean: up from six bph in all investment scenarios to eight bph in the low investment scenario and ten bph in medium and high investment scenarios. This is an opportunity to split the service into:
o Horndean – Waterlooville as per the current specification but non-stop between Waterlooville Precinct and QA Steps (six bph in all investment scenarios).
o A new service between Waterlooville precinct – Portsmouth city centre via West of Waterlooville and serving all stops between Waterlooville precinct and QA Hospital steps via A3 (two bph in low investment scenario; four bph in medium and high investment scenarios).
Havant / Leigh Park corridor
Leigh Park SEHRT down to five bph in the low investment scenario; six bph retained in the medium and high investment scenarios.
Gosport – Fareham – Portsmouth corridor
E1 Gosport – Fareham – Portsmouth up from six bph to eight bph in all scenarios.

69
E2 Gosport – Fareham down from six bph to five bph in low and medium investment scenarios and back up to six bph in the high investment scenario (E3).
2.4. Estimation of programme costs
2.4.1. Investment (capital) costs
Local authority costs: These are the capital costs of the physical interventions. They were estimated by the relevant local authority. section 4.2 (in the Financial Case) describes these costs and their basis of compilation as well as the inflation values assumed (4%). The designs are continuing to mature, and the capital costs have been based on the costs as of mid-September 2019. At this stage, the capital cost estimates for all schemes are expressed as a base cost (point estimate) plus a 44% Optimism Bias allowance.
Transport operators’ capital costs: These are the incremental vehicle and other investment costs compared to the ‘do-minimum’ scenario. They were estimated by the programme team’s public transport specialist in conjunction with the relevant bus operators. section 4.3 (in the Financial Case) describes these costs and their basis of compilation. A 2.2% inflation value21 has been assumed throughout the appraisal period which is consistent with that assumed by the operators for their own forecast planning, with the fleet renewed every 15 years. For appraisal purposes, transport operators’ capital costs are regarded as a private sector investment and are captured as negative benefits in the TEE table.
2.4.2. Operation, maintenance and renewal (OMR) costs
For appraisal purposes, OMR costs for the length of the appraisal period need to be considered. section 4.3 (in the Financial Case) describes these costs and their basis of compilation.
Highway infrastructure, including interchanges: The incremental OMR costs for these, where not negligible, have been estimated commensurate with the current level of scheme development. The following infrastructure changes have been considered to be net-additional in incremental terms:
Additional traffic signals on the networks deployed as part of the infrastructure schemes; and
Resurfacing of significant new tarmac, including the Gosport Busway extension.
Estimates of the OMR costs for these elements have been produced assuming 4% inflation throughout the appraisal period and have been captured as Local Government Operation costs in the Public Accounts table.
Transport operators’ costs: These are all treated as private sector provider impacts (TAG unit A1.3 para 4.1.6) rather than appearing in the PVC.
Other local authority costs: It is considered that there are not any incremental OMR costs of other non-infrastructure interventions that are not negligible. Therefore, these have not been estimated and included in the PVC of this appraisal.
2.4.3. Grants, subsidies, developer contributions and revenue
Grants and subsidies: No grants (other than the Transforming Cities Fund itself) or subsidies are envisaged.
Third-party funding: No developer contributions are envisaged. Transport operators’, Network Rail and other Private Sector contributions to the investment cost are covered in Section 2.4.3 above.
Revenue: There will be an incremental impact on Itchen Bridge toll revenue which accrues to Southampton City Council and therefore counts as part of the PVC calculation. This has been estimated as part of the strategic modelling and TUBA assessment of each package (Section 2.5).
21 Forecasts for the UK economy, October 2019. CPI Forecasts for 2020, Average of new forecasts, page 3. https://assets.publishing.service.gov.uk/government/uploads/system/uploads/attachment_data/file/826488/Forecomp_August_2019.pdf

70
2.4.4. Conversion to present value of costs
The following calculations were used to convert the costs to present value of costs (PVC):
Conversion to 2010 prices using the Treasury GDP deflator;
Discounting to 2010 values over the 60-year appraisal period using the annual rate as specified in the TAG Data Book, table A1.1.1; and
Conversion to market prices (using a factor for the average rate of indirect taxation in the economy of 1.19).
Table 2-1 summarises the total PVC for each core scenario. The Public Accounts tables (Section 2.7.2 onwards) break this down further.
Table 2-1: Present value of capital costs
Core high investment scenario
Core medium investment scenario
Core low investment scenario
Infrastructure Investment £224.4 £146.1 £112.0
Infrastructure OMR £9.7 £3.3 £1.8
£m, 2010 prices and values Source: Initial estimates based on available cost data to date.
2.5. Estimation of programme benefits
2.5.1. User benefits and revenue to private sector providers
This covers impacts on:
Travel time;
Vehicle operating costs; and.
User charges (any impacts on parking, tolls, fares, etc.).
These benefits have been captured in accordance with TAG unit A1.3 (March 2017) and using TUBA version 1.9.12.
The construction year is through to 2022/2023, the scheme opening year is 2023 and the 60-year appraisal period runs from 2023 to 2082.
For each scenario, outputs from the Solent Regional Transport Model (SRTM) were used as the inputs to TUBA. Full details of this process are provided in the Model Forecasting Report (Appendix E). To ensure benefits to users were not overstated a conservative approach was adopted to annualisation factors:
Benefits were only considered for 12 hours (3hrs AM, 6hrs Interpeak and 3 hrs PM), with no off peak (19:00-07:00) benefits were calculated or applied; and
An annualisation factor of 253 was used in TUBA representing the number of working days in a year – i.e. no claim is made for weekend or bank holiday periods.
It should be noted that the annualisation factors only account for weekday benefits. The Portsmouth city region has significant travel during the weekend periods linked to the regional retail and tourism activities and as such there are further benefits that would be captured should weekend travel also be considered within this appraisal.
Annual impacts were calculated for each modelled year. Benefits for non-modelled years were calculated by linear interpolation between modelled years, and flat-line extrapolation beyond the final modelled year.

71
However, the impact of discounting on estimated benefits means that the benefit ‘curve’ declines towards the end of the appraisal period. The ‘rule of a half’ was applied as appropriate.
2.5.2. Private sector provider impacts
The revenue to private sector providers essentially represents public transport operators’ income. It was captured using TUBA alongside the user benefits.
Their incremental investment and operating costs over the 60-year appraisal period also count as private sector provider impacts. These have been estimated and reported in the TEE table accordingly as negative benefits.
2.5.3. Indirect tax impacts
Indirect tax impacts represent the change in fuel tax income to the Treasury as a result of drivers using more or less fuel due to increases or decreases in congestion as well as the effect on the wider economy through changes in spend on transport versus incidental spend. It was captured using TUBA alongside the user benefits.
2.5.4. Impacts during construction and maintenance
Transport users incur additional costs when construction and/or maintenance works affect the transport network. For the Transforming Cities Fund package, the main impact in this area will be during construction of the junction and corridor schemes. QUADRO 2018 (QUeues And Delays at ROadworks, V4 Rev16.0.01) has been used to assess the impact on the user of delays associated with traffic management during construction.
Traffic management plans have not been prepared for all schemes at the current time. Assessments have been undertaken for those schemes which are at a suitably advanced level where construction and traffic management plans have initially been prepared, whilst those which are not at this level have not been assessed. These are detailed in Appendix 5.4.
2.5.5. Impacts from changes to the number of accidents
COBA-LT software has been used to quantify and monetise these impacts for inclusion in the BCR. COBA-LT estimates the number of accidents for each road link. It sums, over the 60-year appraisal period, the product of the accident rate for a particular link type, the road length and the forecast annual traffic flow, using relationships contained in the program to take account of changes in accident and casualty rates over time.
For the Transforming Cities Fund investment scenarios the impacts estimated by COBA-LT will essentially result from the forecast changes in traffic flows along with any significant impacts on link type as a result of the junction and corridor schemes.
2.5.6. Greenhouse gas impacts
Greenhouse gas impacts were estimated using TUBA as described in section 2.5.6.
2.5.7. Local air quality and noise impacts
Local air quality and noise impacts as a result of changes to traffic volumes and patterns on the road network have been assessed (see Appendix 2.22 and Appendix 2.23) for each of the three packages and included within the AMCB table as appropriate. This follows latest version of TAG guidance (TAG Unit A3 Environmental Impact Appraisal, May 2019) which includes the latest updates to the air quality valuation workbook incorporating Defra released guidance on the valuation of transport-related air quality impacts, covering a range of different impact pathways and transport modes. Air Quality (AQ) is still within legal limits for all sites, but we are committed to addressing all impacts on AQ and any areas of concern will be addressed through the next stage of design.

72
2.5.8. Physical activity impacts
Changing levels of walking and cycling represent, in addition to transport economic efficiency impacts, changing levels of physical activity. These in turn generate health impacts, expressed as impacts on risk of premature death and on absenteeism.
The Department for Transport Active Mode Appraisal Toolkit (AMAT) has been used to provide an indication of the physical activity benefits accrued by the increase in walking and cycling as a result of the proposition. This has been undertaken at a global level to capture the health benefits discussed above. The global increase in active mode trips from SRTM have been split between walking cycle users based upon National Travel Survey data.
In addition to this assessment, individual AMAT runs have been conducted for individual schemes with a significant walking and cycling component, to capture the ambience /journey quality benefits afforded by these improvements. Since active mode flows are not available from SRTM at a link level, scheme usage has been forecast using the Propensity to Cycle tool at each relevant location.
Any change in levels of walking or cycling for very short (intra-zone) journeys is not captured. However, the impacts from such short trips are likely to be minimal.
2.5.9. Journey quality impacts
The interventions that affect the physical highway environment (the junction and corridor schemes, the interchange schemes and the creation of rapid transit stops) will provide an enhanced public realm and improved ambience for pedestrians and cyclists. The inclusion of a perception factor reduction to IVT for the South East Hampshire Rapid Transit services translates through to the reported journey times that are derived from SRTM. Therefore, to avoid any potential for double representation of any journey quality impacts on the services themselves, no additional journey quality analysis has been undertaken vehicles used on South East Hampshire Rapid Transit.
Equally, the reduction to the wait curve at both South East Hampshire Rapid Transit Super Stops and Interchanges have been derived using the monetisation of quality factors from TAG table M3.2.1. Again, these changes will be reported through the journey time changes from SRTM, so no further journey quality assessments have been undertaken.
There are elements of the schemes at Ryde on the Isle of Wight which have not been captured, since these are distinct from the main Ryde Interchange where the wait curve adjustment has been applied. For these elements, specific assessments have been undertaken utilising observed data in terms of travel demand and monetisation values for the different enhancements offered from TAG table M3.2.1.
2.5.10. Journey time reliability
Journey time reliability refers to variation in journey times that individuals are unable to predict. This could come from recurring congestion at the same period each day (day-to-day variability) or from non-recurring events such as incidents. It excludes predictable variation relating to varying levels of demand by time of day, day of week or season. [Note – the above is a paraphrase of Unit A1.3 para 6.1.1] In accordance with TAG, journey time reliability impacts are reported only in the adjusted BCR and the AST.
At this stage, journey time reliability has been assessed qualitatively. Hampshire County Council has provided data from its Real Time Passenger Information (RTPI) system for October 2017 for selected high-frequency bus services in South East Hampshire. This data was separated into bus moving time between pairs of bus stops (which hence can be used as an approximation of the impact of traffic conditions on bus services), which provides evidence of journey time variability.
The RTPI data was analysed and shows significant evidence of journey time variability both by and within time of day. Clearly, this can be expected to impact significantly on the reliability of the bus service. The variability causes service headways on 10-minute services, in some cases causing two buses to arrive at once then a large gap resulting in Excess Wait Time (EWT) for passengers. We calculated the EWT for selected days in the

73
data sample and found that EWT generally increases as buses progress along their routes and is highly variable.
The impact of the SEHRT priority measures has been measured by calculating the current journey time variability between pairs of bus stops within which the South East Hampshire Rapid Transit measures lie. The standard deviation in moving bus journey time between each pair of stops between which a priority scheme lies has been calculated. The values were normalised and reflect the proposition that the same standard deviation is more disruptive to bus journey time if applied over a shorter distance.
2.5.11. Wider economic impacts
Wider economic impacts have been assessed qualitatively at this stage and considered as non-monetised impacts (Section 2.6.11). The modelling to quantify the scale of economic impacts anticipated from productivity gains and increase in tax revenue had not been completed at the time of submitting this business case.
2.5.12. Social impacts
Social impacts (SIs) cover the human experience on the transport system and its impact on social factors, where not considered as part of economic or environmental impacts. SIs include the impacts on accidents, physical activity, security, severance, journey quality, option and non-use values, accessibility and personal affordability. For SIs, the appraisal has been carried out in accordance with TAG unit A4.1 Social Impact Appraisal (May 2019). Several of the SI appraisals are also represented as economic impacts as set out in earlier sections of this Economic Case. The findings of qualitative assessments have been entered into the AST.
2.5.13. Distributional impacts
Distributional impacts (DIs) represent the variance of impacts across different social groups. DI analysis identifies those who would gain or lose from the interventions, with emphasis on equality through identifying the impacts on those who are disadvantaged compared to the majority of people. This means dis-aggregating the impacts on different socio-economic groups affected by the scheme, including children, older people, people with a disability, Black and Minority Ethnic (BME) communities, people without access to a car and people on low incomes.
In accordance with requirements set out in TAG unit A4-2 Distributional Impact Appraisal (December 2015), a three-step approach has been applied, starting with (Step 1) Screening to identify the potential for impacts on each of eight indicators. For each of the eight indicators where screening identified that full appraisal is required, (Step 2) Assessment and (Step 3) Appraisal of impacts have been carried out and the results entered into the AST.

74
2.6. Economic appraisal results
2.6.1. User benefits
2.6.1.1. Overall
Table 2-2 summarises the forecast user benefits for each scenario. The user benefits consist of journey time savings, plus changes in vehicle operating costs due to changes in levels of congestion and hence fuel consumption and user charges related to changes in paying tolls and fares.
Table 2-2: Summary of user benefits
Core high investment scenario
Core medium investment scenario
Core low investment scenario
Journey time savings £204.5 £200.9 £218.8
Vehicle operating costs -£14.0 -£11.5 -£4.0
User charges -£0.4 -£3.1 £5.7
During construction and maintenance
-£2.4 -£2.1 -£1.3
Total user benefits £190.1 £186.2 £220.5
£m, 2010 prices and values Source: TUBA runs ERD_v_ERC, ERE_v_ERC, ERF_v_ERC.
According to Table 2-2 the aggregate total user benefits for the core high investment scenario are expected to be lower than for the core low investment scenario. However, when disaggregated by mode of travel as discussed in Section 2.6.1.4, it can be seen that the public transport benefits are 50% greater in the high investment scenario than the low. The lower total in the high investment case is due to the highways journey time and vehicle operating cost disbenefits accrued from the greater levels of bus prioritisation. Over time, however, it is expected that increased congestion will cause greater levels of modal shift away from private car to public transport and active modes.
Several detailed analyses were undertaken on the TUBA user benefit outputs, to ensure that the results are logical and in line with expectations. These analyses are reported below.
2.6.1.2. Spatial distribution of user benefits
To understand the spatial distribution of benefits, sector analysis was carried out. As well as showing which movements benefit most/least, it shows the extent to which model ‘noise’ is potentially having an impact on the results produced by TUBA (usually identified by counter-intuitive impacts for movements that are not expected to be affected by the interventions).
The SRTM model zones were aggregated into 31 sectors relating to the local authority areas covered by the model. Appendix 2.18 also shows the sector-to-sector matrices for each forecast year, and over the 60-year appraisal period, for each scenario.
As expected, these results show that the largest net benefit from the proposition are seen in the corridors targeting by South East Hampshire Rapid Transit: Fareham – Portsmouth, Waterlooville – Portsmouth, Havant – Portsmouth and Gosport – Portsmouth corridors, as well as for trips internal within the Gosport and Isle of Wight areas, considering the balance between improvements to public transport and the impact of bus priority on the highway network. When viewing the public transport benefits in isolation, then all sectors are receiving a benefit as a result of the proposition, with primary benefits within Gosport and travelling between Portsmouth, Gosport, Havant and Fareham.
When considering the private car users only, the highways dis-benefits are mainly focused on journeys through Portsea Island due to bus prioritisation at Spur Road roundabout and St Michael’s gyratory. Highways dis-benefits are also expected to impact car journeys between Cosham and Fareham due to the Portchester

75
precinct scheme. Bus journeys are not affected by this scheme due to the bus prioritisation on Southampton Road.
The distribution of user benefits is very similar in the medium and high investment scenarios, with the high generally displaying slightly greater benefits but also slightly greater highway dis-benefits. In addition to the schemes included in the medium investment scenario, the high investment scenario contains further bus prioritisation in Gosport and Portchester, resulting in increased highways dis-benefits in Portchester and public transport benefits in Gosport.
The low investment scenario contains fewer interventions but includes the bus prioritisation interventions which have the lowest effect on other road users and therefore has a lesser overall journey time impact on both car and public transport users. Compared to the low investment scenario, the medium investment scenario is expected to cause greater delays particularly for car users in Portsmouth city centre and harbour and the Cosham and Waterlooville areas. On the other hand, except from the closure of Isambard Brunel Road to buses, public transport users in Portsmouth city, on the Southsea corridor and in Waterlooville are expected to experience significant journey time improvements. These impacts are likely to be due to road reallocation on Spur Road Roundabout and St Michaels’s Gyratory as well as interchange improvements at Clarence Pier and Cosham that are included in the medium and high investment scenarios only.
2.6.1.3. User benefits profile over the 60-year appraisal period
Figure 2-1 shows the profile of the user benefits across the 60-year appraisal period for the low, medium and high investment scenarios. For all three scenarios, user benefits initially fall through the forecast years as the highway congestion is forecast to increase. Therefore, the impacts of public transport priority measures have a significant impact with the expected benefits reaching a low point at the second modelled year of 2026. The benefits then increase until the final modelled year of 2041 as congestion plateaus and the user benefits dominate. Following 2041, the user benefits decline until the end of the appraisal period. This is because after the last modelled year, the benefits are unchanged but the effect of discounting over time is stronger with each year. However, in reality, it is likely that the benefits will continue to accrue after 2041 such that the gap between the low and high investment scenarios would eventually close.
Since the low investment scenario includes fewer interventions than the medium and high investment scenarios, the negative impacts on highway traffic are less significant, leading to higher overall user benefits.
Comparing the medium and high investment scenarios, it can be seen that congestion is more severe in the high investment scenario but also that the 2041 peak in benefits is higher, implying that there is greater easing in congestion and the benefits due public transport improvements are greater.

76
Figure 2-1: Profile of user benefits over appraisal period
£m, 2010 prices and values Source: TUBA runs ERD_v_ERC, ERE_v_ERC, ERF_v_ERC.
2.6.1.4. User benefits by mode of travel
Table 2-3 shows the user benefits disaggregated by mode of travel, for each scenario, over the appraisal period. It clearly indicates not only the benefits to rapid transit and bus users but also the dis-benefits to the remaining highway users. For the latter, the decongesting effect of mode shift to public transport and active modes outweighs the congesting effect of reduced highway capacity, meaning net overall decreases in journey times and hence net benefits to users.
Although the net benefits are the highest for the low investment scenario due to the lesser extent of proposed bus prioritisation interventions, it can be seen that the benefits to public transport users are approximately 50% higher as a result of the high investment scenario than the low investment scenario. The focus of this scheme is to improve the bus network in South East Hampshire, so the public transport user benefits are prioritised. In section 2.8.2 this is considered in greater detail via a sensitivity test excluding any highways impacts of magnitude less than two minutes.
Table 2-3: User benefits by mode of travel
Core high investment scenario
Core medium investment scenario
Core low investment scenario
Road -£203.3 -£174.4 -£55.1
Public transport £390.5 £358.1 £273.9
Active modes £0.5 £0.5 £0.5
Total user benefits £187.7 £184.1 £219.3
£m, 2010 prices and values Source: TUBA runs ERD_v_ERC, ERE_v_ERC, ERF_v_ERC.

77
2.6.1.5. User benefits by journey purpose
Table 2-4 summarises the user benefits disaggregated by journey purpose, for each scenario, over the appraisal period. This indicates that there is not an even split of the benefits between business and non-business users: for the core high, medium and low investment scenarios, the business user benefits only contribute 3%, 4% and 13% respectively to the overall user benefits.
The greater level of business benefit in the low investment scenario is related to the lower levels of highway congestion in this scenario, which has less of a negative impact upon the business users travelling on the highway network.
Table 2-4: User benefits by journey purpose
Core high investment scenario
Core medium investment scenario
Core low investment scenario
Non-business commuting £71.9 £71.2 £78.7
Non-business other £113.1 £107.6 £112.6
Business £5.1 £7.5 £29.2
Total user benefits £187.7 £184.1 £219.3
£m, 2010 prices and values Source: TUBA runs ERD_v_ERC, ERE_v_ERC, ERF_v_ERC.
2.6.1.6. User benefits by time period
Table 2-5,
Table 2-6 and
Table 2-7 summarise the user benefits disaggregated by time period, over the appraisal period.
For each scenario, the smallest benefit in terms of user time impact occurs in the PM peak. This could be linked to the tidal nature of some of the infrastructure, which gives rise to less journey time advantage afforded by the rapid transit proposition compared to the highway traffic.
The slightly higher benefits seen in the inter peak period is likely to be due to the longer time period covered (six hours as opposed to three each for the AM and PM peaks).
Across the three scenarios, the AM peak consistently displays greater user charge and vehicle operating cost dis-benefits when compared to the PM peak. A contributing factor to this is the highway congestion that is present in these periods as a result of the inclusion on the rapid transit priority infrastructure and the congestion that this creates. This is less evident in the PM peak, where the congestion level is slightly reduced.
Table 2-5: User benefits by time period – core high investment scenario
User Time User Charges Vehicle Operating Costs
AM peak £55.9 -£4.6 -£4.5
Inter peak £93.8 £6.1 -£6.4
PM peak £49.6 -£2.3 -£3.3
£m, 2010 prices and values Source: TUBA run ERF_v_ERC. Note that these numbers may not add precisely to those above due to a combination of rounding and the full TUBA being run for longer than 60 years. These numbers are only reported at an aggregate level for the entire TUBA run length and have been scaled to represent a 60-year appraisal period; they are reported not on a year by year basis.

78
Table 2-6: User benefits by time period – core medium investment scenario
User Time User Charges Vehicle Operating Costs
AM peak £57.0 -£5.8 -£3.9
Inter peak £88.8 £5.2 -£5.0
PM peak £49.5 -£2.7 -£3.0
£m, 2010 prices and values Source: TUBA run ERE_v_ERC. Note that these numbers may not add precisely to those above due to a combination of rounding and the full TUBA being run for longer than 60 years. These numbers are only reported at an aggregate level for the entire TUBA run length and have been scaled to represent a 60-year appraisal period; they are reported not on a year by year basis.
Table 2-7: User benefits by time period – core low investment scenario
User Time User Charges Vehicle Operating Costs
AM peak £63.6 -£1.8 -£1.4
Inter peak £93.7 £6.6 -£1.9
PM peak £55.7 £0.5 -£0.6
£m, 2010 prices and values Source: TUBA run ERD_v_ERC. Note that these numbers may not add precisely to those above due to a combination of rounding and the full TUBA being run for longer than 60 years. These numbers are only reported at an aggregate level for the entire TUBA run length and have been scaled to represent a 60-year appraisal period; they are reported not on a year by year basis.
2.6.1.7. User benefits by size of time savings
Table 2-8, Table 2-9 and Table 2-10 summarise the user benefits disaggregated by size of time saving. These figures are only the time savings and do not include vehicle operating costs and user charges, so the totals here differ from totals in other tables which include both elements.

79
Table 2-8: User benefits by size of time saving – core high investment scenario
Mode Purpose < -5 mins -5 to -2 mins
-2 to 0 mins
0 to 2 mins
2 to 5 mins
> 5 mins
Car Non-business commuting
-£0.1 -£16.1 -£79.0 £37.9 £1.1 £-
Non-business other
-£0.6 -£15.2 -£104.3 £43.7 £1.2 £0.3
Business -£0.1 -£3.8 -£30.4 £12.9 £0.3 £0.2
LGV Freight Business -£0.3 -£5.5 -£31.3 £12.1 £0.2 £0.1
OGV Business -£0.1 -£0.9 -£5.8 £2.5 £0.2 £0.1
Public Transport
Non-business commuting
-£6.3 -£2.8 -£2.8 £4.0 £6.9 £135.8
Non-business other
-£12.3 -£3.8 -£3.3 £5.0 £8.4 £186.2
Business -£4.8 -£1.1 -£1.1 £1.7 £2.8 £66.9
Active Modes
Non-business commuting
£- £- £- £0.4 £- £-
Non-business other
£- £- £- £0.1 £- £-
Business £- £- £- £- £- £-
£m, 2010 prices and values Source: TUBA run ERF_v_ERC. Note that these numbers may not add precisely to those above due to a combination of rounding and the full TUBA being run for longer than 60 years. These numbers are only reported at an aggregate level for the entire TUBA run length and have been scaled to represent a 60-year appraisal period; they are reported not on a year by year basis.

80
Table 2-9: User benefits by size of time saving – core medium investment scenario
Mode Purpose < -5 mins -5 to -2 mins
-2 to 0 mins
0 to 2 mins
2 to 5 mins
> 5 mins
Car Non-business commuting
-£0.1 -£12.7 -£69.6 £33.3 £1.1 £-
Non-business other
-£0.6 -£13.0 -£93.2 £40.2 £1.3 £0.1
Business -£0.1 -£3.3 -£26.3 £11.4 £0.3 £0.1
LGV Freight Business -£0.3 -£4.7 -£27.0 £11.1 £0.2 £0.1
OGV Business -£0.1 -£0.7 -£5.1 £2.2 £0.2 £-
Public Transport
Non-business commuting
-£5.6 -£2.6 -£2.8 £4.1 £8.3 £123.8
Non-business other
-£9.4 -£3.6 -£3.4 £5.4 £9.2 £167.6
Business -£2.8 -£0.9 -£1.2 £1.7 £3.5 £58.5
Active Modes
Non-business commuting
£- £- £- £0.4 £- £-
Non-business other
£- £- £- £0.1 £- £-
Business £- £- £- £- £- £-
£m, 2010 prices and values Source: TUBA run ERE_v_ERC. Note that these numbers may not add precisely to those above due to a combination of rounding and the full TUBA being run for longer than 60 years. These numbers are only reported at an aggregate level for the entire TUBA run length and have been scaled to represent a 60-year appraisal period; they are reported not on a year by year basis.

81
Table 2-10: User benefits by size of time saving – core low investment scenario
Mode Purpose < -5 mins -5 to -2 mins
-2 to 0 mins
0 to 2 mins
2 to 5 mins
> 5 mins
Car Non-business commuting
£- -£5.6 -£42.3 £34.1 £1.1 £-
Non-business other
£- -£6.0 -£57.9 £40.2 £0.9 £-
Business £- -£1.6 -£17.2 £12.8 £0.3 £0.1
LGV Freight Business £- -£1.7 -£16.4 £11.7 £0.2 £-
OGV Business £- -£0.3 -£3.1 £2.4 £0.1 £-
Public Transport
Non-business commuting
-£7.0 -£2.4 -£2.9 £4.5 £8.4 £92.5
Non-business other
-£12.1 -£3.7 -£3.4 £5.5 £9.6 £126.3
Business -£3.2 -£0.9 -£1.2 £1.8 £3.4 £45.7
Active Modes
Non-business commuting
£- £- £- £0.4 £- £-
Non-business other
£- £- £- £0.1 £- £-
Business £- £- £- £- £- £-
£m, 2010 prices and values Source: TUBA run ERD_v_ERC. Note that these numbers may not add precisely to those above due to a combination of rounding and the full TUBA being run for longer than 60 years. These numbers are only reported at an aggregate level for the entire TUBA run length and have been scaled to represent a 60-year appraisal period; they are reported not on a year by year basis.
Figure 2-2 summarises the user benefits by time saving for highways and public transport users.
Figure 2-2: Highway and public transport benefits by time saving

82
It can be seen that, for each of the three scenarios, the vast majority of benefits for public transport accrue from journey time benefits of in excess of 5 minutes of journey time. This demonstrates that there is a large scale of journey time saving on offer by the proposition for the target public transport user group.
In contrast, the highway dis-benefits are largely centred on the 0 to 2 minute range, showing that whilst there is an impact to a large number of users, these users at an individual level do not experience a highly significant change in journey time. A sensitivity test removing the highway benefits with journey time changes between +2 minutes and -2 minutes will be presented in section.
2.6.1.8. User benefits by distance travelled
Table 2-11, Table 2-12 and Table 2-13 summarise the user benefits disaggregated by distance travelled for each of the three investment scenarios. As above, these figures are only the time savings and do not include vehicle operating costs and user charges. The distances are grouped into bands as defined by TUBA.

83
Table 2-11: User benefits by distance travelled – core high investment scenario
Mode Purpose < 1 kms 1 to 5 kms
5 to 10 kms
10 to 25 kms
25 to 50 kms
50 to 100 kms
100 to 200 kms
>200 kms
Car Non-business
commuting
£- -£8.5 -£11.7 -£19.0 -£9.4 -£5.0 -£2.3 -£0.2
Non-business
other
-£0.4 -£22.5 -£20.2 -£20.0 -£5.3 -£3.6 -£2.5 -£0.5
Business -£0.1 -£2.8 -£3.6 -£4.6 -£3.1 -£2.8 -£3.7 -£0.2
LGV Freight Business -£0.5 -£5.2 -£7.3 -£8.2 -£2.3 -£0.5 -£0.5 -£0.1
OGV Business -£0.1 -£0.7 -£1.0 -£1.1 -£0.5 -£0.1 -£0.4 -£0.1
Public Transport
Non-business
commuting
£1.4 £15.3 £34.4 £72.6 £9.2 £1.1 £0.8 £-
Non-business
other
£7.0 £23.7 £42.2 £98.4 £7.8 £1.1 £- £-
Business £0.6 £6.7 £12.7 £33.5 £8.5 £0.7 £1.9 £-
Active Modes
Non-business
commuting
£- £0.1 £0.2 £0.1 £- £- £- £-
Non-business
other
£- £- £- £- £- £- £- £-
Business £- £- £- £- £- £- £- £-
£m, 2010 prices and values Source: TUBA run ERF_v_ERC. Note that these numbers may not add precisely to those above due to a combination of rounding and the full TUBA being run for longer than 60 years. These numbers are only reported at an aggregate level for the entire TUBA run length and have been scaled to represent a 60-year appraisal period; they are reported not on a year by year basis.

84
Table 2-12: User benefits by distance travelled – core medium investment scenario
Mode Purpose < 1 kms 1 to 5 kms
5 to 10 kms
10 to 25 kms
25 to 50 kms
50 to 100 kms
100 to 200 kms
>200 kms
Car Non-business
commuting
£- -£7.5 -£9.6 -£15.6 -£8.3 -£4.5 -£2.2 -£0.3
Non-business
other
-£0.4 -£20.6 -£16.5 -£16.0 -£4.8 -£3.8 -£2.5 -£0.7
Business -£0.1 -£2.5 -£2.8 -£3.6 -£2.7 -£2.6 -£3.2 -£0.4
LGV Freight Business -£0.6 -£4.9 -£5.7 -£6.4 -£2.0 -£0.5 -£0.4 -£0.1
OGV Business -£0.1 -£0.6 -£0.8 -£1.0 -£0.5 -£0.1 -£0.3 £-
Public Transport
Non-business
commuting
£1.4 £15.1 £31.3 £67.7 £7.9 £1.2 £0.8 £-
Non-business
other
£7.0 £21.8 £38.1 £89.8 £6.6 £1.8 £0.9 £-
Business £0.8 £6.1 £11.5 £30.2 £7.0 £1.3 £1.9 £-
Active Modes
Non-business
commuting
£- £0.1 £0.2 £0.1 £- £- £- £-
Non-business
other
£- £- £- £- £- £- £- £-
Business £- £- £- £- £- £- £- £-
£m, 2010 prices and values Source: TUBA run ERE_v_ERC. Note that these numbers may not add precisely to those above due to a combination of rounding and the full TUBA being run for longer than 60 years. These numbers are only reported at an aggregate level for the entire TUBA run length and have been scaled to represent a 60-year appraisal period; they are reported not on a year by year basis.

85
Table 2-13: User benefits by distance travelled – core low investment scenario
Mode Purpose < 1 kms 1 to 5 kms
5 to 10 kms
10 to 25 kms
25 to 50 kms
50 to 100 kms
100 to 200 kms
>200 kms
Car Non-business
commuting
£- -£3.1 -£2.4 -£3.1 -£2.2 -£1.2 -£0.7 £-
Non-business
other
£- -£6.8 -£6.2 -£5.5 -£1.5 -£1.2 -£1.3 -£0.2
Business £- -£0.7 -£0.9 -£0.8 -£0.5 -£0.8 -£1.8 £-
LGV Freight Business £- -£0.7 -£2.1 -£2.2 -£0.6 -£0.2 -£0.3 £-
OGV Business £- -£0.1 -£0.2 -£0.3 £- £- -£0.2 £-
Public Transport
Non-business
commuting
£1.1 £11.0 £23.0 £50.7 £6.1 £0.8 £0.4 £-
Non-business
other
£6.3 £14.9 £29.2 £65.0 £4.9 £1.3 £0.6 £-
Business £0.5 £4.5 £8.5 £24.5 £4.9 £1.1 £1.6 £-
Active Modes
Non-business
commuting
£- £0.1 £0.2 £0.1 £- £- £- £-
Non-business
other
£- £- £0.1 £- £- £- £- £-
Business £- £- £- £- £- £- £- £-
£m, 2010 prices and values Source: TUBA run ERD_v_ERC. Note that these numbers may not add precisely to those above due to a combination of rounding and the full TUBA being run for longer than 60 years. These numbers are only reported at an aggregate level for the entire TUBA run length and have been scaled to represent a 60-year appraisal period; they are reported not on a year by year basis.
Figure 2-3 summarises the proportions of benefits accrued by each user group.
There does not appear to be any significant pattern as a result of the interventions that are reflected in these figures. The distribution of impacts to the highway network are relatively evenly spread across the distance bands, implying that there is little bias in the impact to highway traffic. However, the scale of change for public transport benefits occurs mostly in the 10 to 25km distance band for the core low, medium and high investment scenarios. This demonstrates that the improvements match the strategic alignment of the SERHT proposition, by facilitating greater ease and speed of access to Portsmouth from the neighbouring commuting districts.

86
Figure 2-3: Highway and public transport benefits by distance travelled
2.6.2. Private sector provider impacts
Table 2-14 summarises the forecast revenue to private sector providers for each scenario. This essentially represents changes in public transport fare revenue. The increased bus use gives rise to a significant revenue increase for the bus operators, which is reflected in the increases shown in the table below. This revenue increase makes a considerable contribution to the overall proposition benefits stream, being approximately of a similar scale as the user time benefits afforded by the rapid transit proposition.
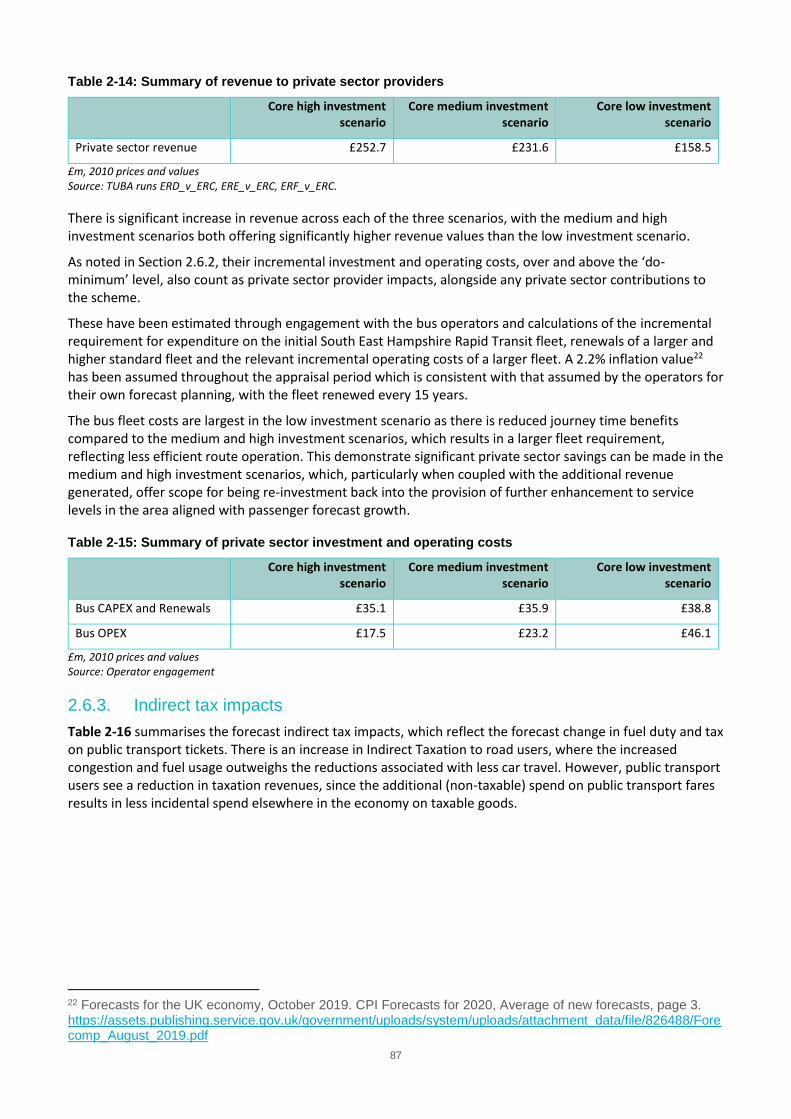
87
Table 2-14: Summary of revenue to private sector providers
Core high investment scenario
Core medium investment scenario
Core low investment scenario
Private sector revenue £252.7 £231.6 £158.5
£m, 2010 prices and values Source: TUBA runs ERD_v_ERC, ERE_v_ERC, ERF_v_ERC.
There is significant increase in revenue across each of the three scenarios, with the medium and high investment scenarios both offering significantly higher revenue values than the low investment scenario.
As noted in Section 2.6.2, their incremental investment and operating costs, over and above the ‘do-minimum’ level, also count as private sector provider impacts, alongside any private sector contributions to the scheme.
These have been estimated through engagement with the bus operators and calculations of the incremental requirement for expenditure on the initial South East Hampshire Rapid Transit fleet, renewals of a larger and higher standard fleet and the relevant incremental operating costs of a larger fleet. A 2.2% inflation value22 has been assumed throughout the appraisal period which is consistent with that assumed by the operators for their own forecast planning, with the fleet renewed every 15 years.
The bus fleet costs are largest in the low investment scenario as there is reduced journey time benefits compared to the medium and high investment scenarios, which results in a larger fleet requirement, reflecting less efficient route operation. This demonstrate significant private sector savings can be made in the medium and high investment scenarios, which, particularly when coupled with the additional revenue generated, offer scope for being re-investment back into the provision of further enhancement to service levels in the area aligned with passenger forecast growth.
Table 2-15: Summary of private sector investment and operating costs
Core high investment scenario
Core medium investment scenario
Core low investment scenario
Bus CAPEX and Renewals £35.1 £35.9 £38.8
Bus OPEX £17.5 £23.2 £46.1
£m, 2010 prices and values Source: Operator engagement
2.6.3. Indirect tax impacts
Table 2-16 summarises the forecast indirect tax impacts, which reflect the forecast change in fuel duty and tax on public transport tickets. There is an increase in Indirect Taxation to road users, where the increased congestion and fuel usage outweighs the reductions associated with less car travel. However, public transport users see a reduction in taxation revenues, since the additional (non-taxable) spend on public transport fares results in less incidental spend elsewhere in the economy on taxable goods.
22 Forecasts for the UK economy, October 2019. CPI Forecasts for 2020, Average of new forecasts, page 3. https://assets.publishing.service.gov.uk/government/uploads/system/uploads/attachment_data/file/826488/Forecomp_August_2019.pdf

88
Table 2-16: Summary of indirect tax impacts
Core high investment scenario
Core medium investment scenario
Core low investment scenario
Road £2.5 £1.5 -£0.7
Public transport -£35.3 -£32.3 -£22.1
Total -£32.8 -£30.8 -£22.9
£m, 2010 prices and values Source: TUBA runs ERD_v_ERC, ERE_v_ERC, ERF_v_ERC.
2.6.4. Impacts during construction and maintenance
Table 2-17 summarises the estimated impacts during construction and maintenance, which are a result of construction and maintenance affecting the transport network, as described in Section 2.1. Since the high investment scenario proposes the greatest number of interventions, the costs incurred due to lane and road closures during construction will have the greatest impact, followed by the medium investment scenario and then the low.
Since the extensive construction works in the high and medium investment scenarios delay the need for maintenance, less will be spent – in terms of both the monetary cost of maintenance and journey time delays – over the appraisal period on maintenance. In these two scenarios, this benefit outweighs the costs incurred due to traffic management during construction and maintenance.
Overall, each of the three scenarios would result in a small dis-benefit due to construction and maintenance works. As the construction information received was at a scheme level, assumptions of the required traffic management have also been made at a scheme level, as opposed to being broken down for each individual job or construction phases for the scheme. Furthermore, the impacts during construction and maintenance have only been assessed for weekdays, due to the lack of available weekend flow data, though this is consistent with the current calculation and presentation of benefits.
Table 2-17: Summary of the impacts during construction and maintenance
Core high investment scenario
Core medium investment scenario
Core low investment scenario
Impacts during construction
-£2.4 -£2.1 -£1.2
Impacts during maintenance
£0.4 £0.2 -£0.2
Total -£2.0 -£1.9 -£1.3
£m, 2010 prices and values Source: QUADRO runs for each scenario
2.6.5. Impacts from changes to the number of accidents
Table 2-18 provides a summary of the monetised value of the forecast decrease in collision numbers, calculated using COBA-LT. The modal shift from highway to public transport allied to safety improvements incorporated within the scheme designs have a cumulative effect of reducing the number of accidents on the network. The benefits accrued by these changes get steadily largest from the low to high investment scenarios, as greater highway trip reductions occur, and more infrastructure schemes are adding which provide safety benefits in themselves.

89
Table 2-18: Summary of the impacts from changes in accident rates
Core high investment scenario
Core medium investment scenario
Core low investment scenario
Accident Changes £9.0 £6.4 £2.6
£m, 2010 prices and values Source: CABA-LT runs for each scenario
2.6.6. Greenhouse gas impacts
Table 2-19 summarises the estimated greenhouse gas impacts for each scenario. In line with other results above for the high and medium investment scenarios, the increased congestion on the highway network results in a small increase in greenhouse gas emissions in a very small number of locations, which translates into a small overall dis-benefit in the appraisal.
Table 2-19: Summary of greenhouse gas impacts
Core high investment scenario
Core medium investment scenario
Core low investment scenario
Greenhouse gases -£1.1 -£0.6 £0.4
£m, 2010 prices and values Source: TUBA runs ERD_v_ERC, ERE_v_ERC, ERF_v_ERC.
2.6.7. Local air quality and noise impacts
Table 2-20 summarises the forecast local (monetised) impacts on air quality and noise. There are marginal changes to overall air quality, although it is not anticipated that these changes would push any area over the required exceedance threshold. Indeed, the sensitivity tests undertaken on the impact of the South East Hampshire Rapid Transit medium investment scenario demonstrates that all areas within Portsmouth remain below the NO2 legal limits in 2024. The changes in noise as a result of the scheme are expected to be driven by the increased traffic congestion at point locations where bus priority infrastructure restricts the flow of highway traffic, which overwhelms the wider reductions in noise through reduce highway travel.
Table 2-20: Summary of local air quality and noise impacts
Core high investment scenario
Core medium investment scenario
Core low investment scenario
Local air quality -£0.6 -£0.7 -£1.2
Noise -£14.5 -£21.8 -£27.1
£m, 2010 prices and values Source: Noise and Air Quality modelling for each scenario
2.6.8. Physical activity impacts
Table 2-21 summarises the forecast physical activity benefits. A benefit is accrued as a result of increased numbers of users travelling by active modes, with the associated health benefits (reduced mortality and absenteeism) captured below. Model outputs in terms of the numbers of additional journeys are at an aggregate active model level. These have been disaggregated to walking and cycling based upon Department for Transport Walking and Cycling Statistics for the Portsmouth area. All other values have remained at the AMAT defaults, since no local data was available to provide alternative local assumptions.
The high investment scenario brings about the greatest uplift in active travel and therefore the greatest health benefits. The dis-benefit seen in the low investment scenario is due to fewer forecast pedestrians and cyclists. This is likely to be due to a tipping point where the public transport offering is significantly improved in the low investment scenario, therefore abstracting people from walking and cycling, yet the congestion on the road network has not risen to such a level where it encourages shorter distance journeys to now be made by active modes, which is the case in both the medium and high investment scenarios.

90
Table 2-21: Summary of physical activity benefits (AMAT)
Core high investment scenario
Core medium investment scenario
Core low investment scenario
Additional active modes users
967 610 -527
Extra distance travelled (km)
308,000 194,000 -168,000
Days reduced absenteeism 600 400 -300
Number of deaths avoided 0.2 0.1 -0.1
Health benefits (£m, 2010 prices and values)
£7.8 £4.9 -£4.3
£m, 2010 prices and values Source: Results of model runs ERC, ERD, ERE, ERF and DfT Active Mode Appraisal Toolkit.
2.6.9. Journey quality impacts
As described in Section 2.1, journey quality impacts have largely been captured through adjustments to the In Vehicle Time (IVT) for the South East Hampshire Rapid Transit services and wait curve adjustments for the improvements at South East Hampshire Rapid Transit Super Stops and Interchanges. However, there are additional quality benefits for interventions with a significant walking and cycling element which have been assessed through individual AMAT assessments. Allied to this, specific elements of the Isle of Wight schemes that are distinct from those captured within the Ryde Interchange upgrade have also undergone a specific assessment.
A 60-year appraisal period has been adopted in line with the expected asset lifespan, linked to the asset lifespan of the corresponding highway scheme which these infrastructure items sit alongside. The incremental changes in maintenance have been considered for the equivalent period.
Table 2-22 summarises the combined benefits of the above for each core scenario.
Table 2-22: Summary of journey quality impacts
Cost type Core high investment scenario
Core medium investment scenario
Core low investment scenario
Journey quality impacts £11.1 £9.2 £5.9
£m, 2010 prices and values Source: Propensity to cycle tool and AMAT
2.6.10. Journey time reliability impacts
South East Hampshire Rapid Transit improves bus service reliability through various holistic approaches. Improving reliability is key to enabling longer routes to operate in response to the South East Hampshire Rapid Transit objective to increase public transport mode share and accessibility to services in the Portsmouth city region, particularly for medium-distance journeys.
The interventions seek to reduce standard deviations at key bus stops, where the results show that normalised standard deviations for pairs of bus stops between which SEHRT priority measured are proposed to fall around 50% to between 0.45 minutes and 0.08 minutes with SEHRT implementation. The low scenario addresses significant reliability hotspots, where the medium scenario shows additional incremental benefits. As the high scenario contains the largest number of schemes this addresses further key issues around bus reliability.
These impacts will reduce the journey time variability and passenger waiting time at bus stops, likely to lead to an increase in public transport mode share. As this analysis was completed by scheme, the high investment scenario will see the largest benefit as it contains the highest number of schemes.

91
2.6.11. Wider economic impacts
Productivity uplift of business and individuals from as a result of improved connectivity between business and labour market, and among firms and businesses is an important stream of benefits captured in urban agglomeration. The concept of agglomeration economies describes the benefits that arise from the proximity of firms and people in cities and industrial clusters. TAG suggests that this benefit may be estimated by measuring the changes in the concentration of economic activity over an area, i.e. access to economic mass (ATEM) or effective density (ED) as a result of transport investment.
The proposed Portsmouth Transforming Cities Fund package is forecast to bring significant cost savings and quality improvement to journeys made by public transport and active modes, which far outweighs the impacts on the highway users. This is reflected in the significant net user savings of £190.1m across all modes in the high investment scenario. The forecast savings are anticipated to result in improved transport connectivity in the city region, strengthening the linkage between different businesses, business and wider labour supply and other opportunities. All these forecast improvements are therefore expected to increase the access to economic mass in the city region, leading to uplift in productivity through agglomeration economies and increased tax revenue from better labour participation. The anticipated productivity gains and increase in tax revenue are potential benefit streams that have not been quantified in this SOBC but are legitimate economic impacts that may be explored and claimed in subsequent stage of business case development.
2.6.12. Social Impacts (SIs)
The social impacts in each scenario, where not already covered as monetised impacts reported above, have been reported in the ASTs in Appendix 2.20.
2.6.13. Distributional Impacts (DIs)
The screening exercise identified that each of the eight indicators require further assessment for all investment levels. Hence, it was a requirement to proceed to steps 2 and 3 for all indicators. Detailed findings from the screening process and the approach for the full appraisal are discussed in Appendix 2.11.
The delivery of a high-quality multi-modal travel system is expected to have net positive impacts on:
Accessibility, particularly for those who are less likely to drive, such as elderly and disabled residents;
Pedestrians’ perceptions of severance;
Users’ perceptions of security, with the provision of USB charging and Wi-Fi at Super Stops;
Reduced number of accidents involving vulnerable groups; and
Significant decreased travel time for public transport users.

92
Table 2-23 summarises the assessment.
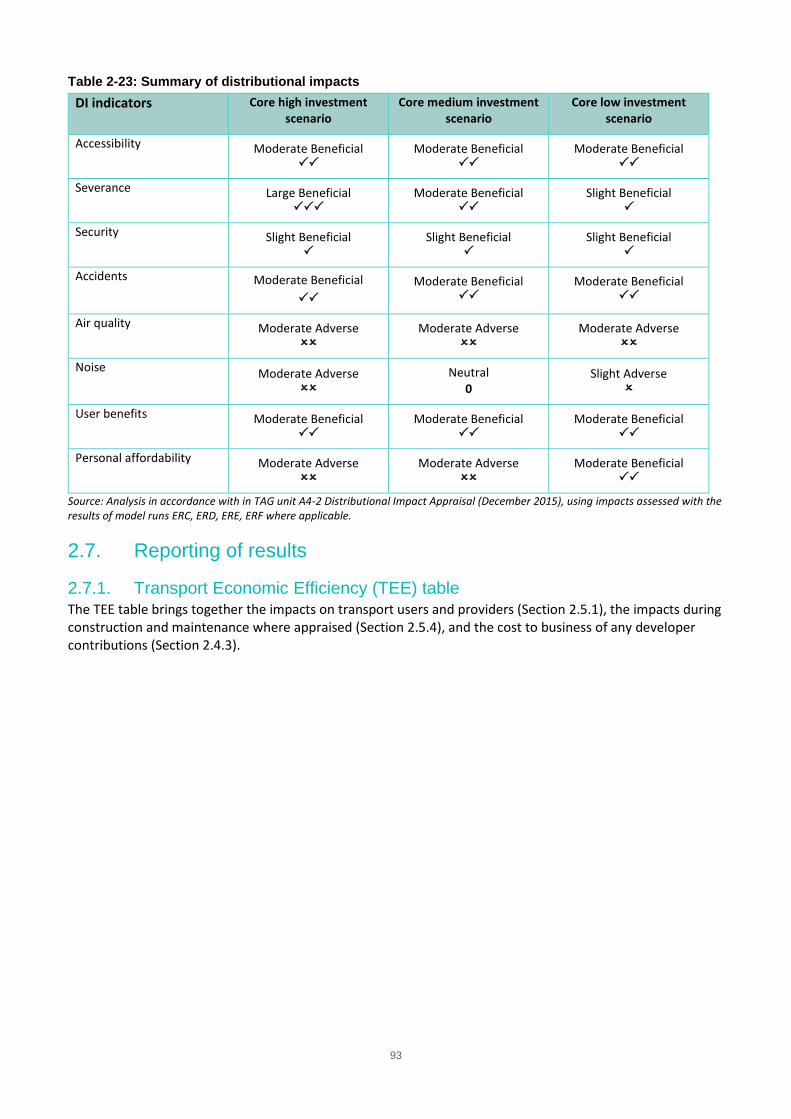
93
Table 2-23: Summary of distributional impacts
DI indicators Core high investment scenario
Core medium investment scenario
Core low investment scenario
Accessibility Moderate Beneficial
Moderate Beneficial
Moderate Beneficial
Severance Large Beneficial
Moderate Beneficial
Slight Beneficial
Security Slight Beneficial
Slight Beneficial
Slight Beneficial
Accidents Moderate Beneficial
Moderate Beneficial
Moderate Beneficial
Air quality Moderate Adverse
Moderate Adverse
Moderate Adverse
Noise Moderate Adverse
Neutral 0
Slight Adverse
User benefits Moderate Beneficial
Moderate Beneficial
Moderate Beneficial
Personal affordability Moderate Adverse
Moderate Adverse
Moderate Beneficial
Source: Analysis in accordance with in TAG unit A4-2 Distributional Impact Appraisal (December 2015), using impacts assessed with the results of model runs ERC, ERD, ERE, ERF where applicable.
2.7. Reporting of results
2.7.1. Transport Economic Efficiency (TEE) table The TEE table brings together the impacts on transport users and providers (Section 2.5.1), the impacts during construction and maintenance where appraised (Section 2.5.4), and the cost to business of any developer contributions (Section 2.4.3).

Page 94 of 169
Table 2-24: TEE table (core high investment scenario)
Source: Results of model run ERC_v_ERF

Page 95 of 169
Table 2-25: TEE table (core medium investment scenario)
Source: Results of model run ERD_v_ERE
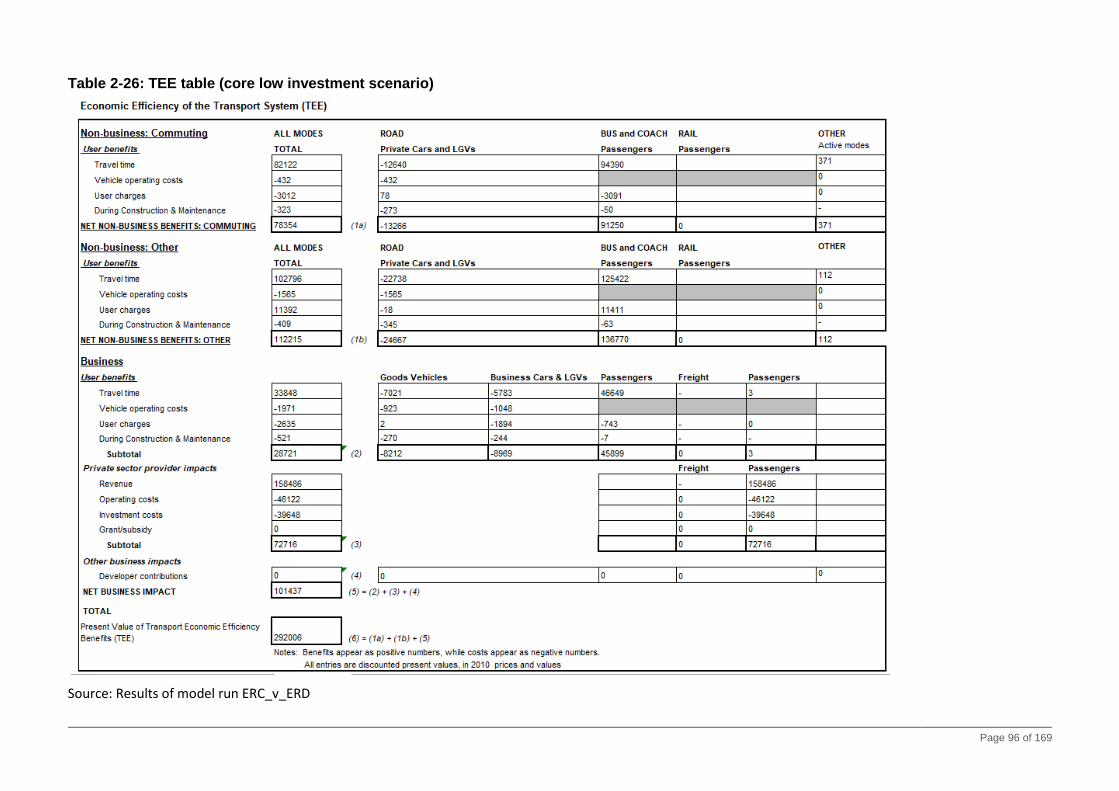
Page 96 of 169
Table 2-26: TEE table (core low investment scenario)
Source: Results of model run ERC_v_ERD

Page 97 of 169
2.7.2. Public Accounts (PA) table
The PA table brings together the costs of the programme and the revenue and tax changes which would result for the public sector. The costs, less any offsetting developer contributions or equivalent, are as set out in Section 2.4. The revenue and tax impacts which follow from changes in traffic routes and speeds are derived from the TUBA output.

Page 98 of 169
Table 2-27: PA table (core high investment scenario)
Source: Results of model run ERC_v_ERF

Page 99 of 169
Table 2-28: PA table (core medium investment scenario)
Source: Results of model run ERC_v_ERE

Page 100 of 169
Table 2-29 - PA table (core low investment scenario)
Source: Results of model run ERC_v_ERD

101
2.7.3. Analysis of Monetised Costs and Benefits (AMCB) table
The AMCB table brings together monetised scheme costs and benefits, to help determine value for money. The table is based on those elements of the economic appraisal which are considered to produce robust monetised estimates of the impacts and therefore contribute to the Initial BCR. It includes, where available:
Cost to business of any developer contributions or equivalent (Section 2.4.3)
User benefits, including changes in user charges (Section 2.5.1)
Revenue to private sector providers (Section 2.6.2)
Impacts during construction and maintenance (Section 2.5.4)
Indirect taxation impacts (Section 2.5.3)
Accident impacts (Section 2.5.5)
Monetised environmental impacts (Sections 2.5.6 and 2.5.7)
Journey quality impacts (Section 2.5.9)
Physical activity impacts (Section 2.6.8)
Construction and operation costs (Sections 2.4.1 and 2.4.2)
The AMCB table presents four key overall measures:
Present value of benefits (PVB): The sum of the discounted benefits over the appraisal period, reduced by the discounted value of any developer contributions or equivalent (in this case, the operators’ share of the investment costs);
Present value of costs (PVC): The sum of the discounted costs over the appraisal period, reduced by the discounted value of any developer contributions or equivalent (in this case, the operators’ share of the investment costs). In effect this represents the cost to government;
Net present value (NPV): The PVB minus the PVC. This indicates whether the net benefits are positive or negative, and their scale; and
Benefit-cost ratio (BCR): The ratio of the PVB and the PVC. A BCR above 1.0 indicates that the benefits exceed the costs (ie, the net benefits are positive).

102
Table 2-30: AMCB table (core high investment scenario)
Source: Results of model run ERC_v_ERF

103
Table 2-31: AMCB table (core medium investment scenario)
Source: Results of model run ERC_v_ERE

104
Table 2-32: AMCB table (core low investment scenario)
Source: Results of model run ERC_v_ERD

105
2.7.4. Initial BCR
Table 2-33 summarises the PVB, PVC, NPV and Initial BCR for each scenario.
Table 2-33: Summary of benefits, costs and BCRs
Core high investment scenario
Core medium investment scenario
Core low investment scenario
PVB £365.7 £322.4 £245.4
PVC £226.5 £143.0 £107.9
NPV (initial) £139.2 £179.4 £137.5
BCR (initial) 1.615 2.254 2.274
£m, 2010 prices and values
2.7.5. Evolving monetised impacts and the adjusted BCR
The second stage of BCR calculation is to include other benefits whose estimation is considered to be less robust (‘evolving monetised impacts’), as explained in the Department for Transport’s Value for Money Framework (2015) and TAG. This involves:
Journey time reliability (Section 2.5.10)
Wider economic benefits at level 2 (Section 2.5.11)
Currently, neither of these aspects have been monetised for this stage of scheme development, therefore an adjusted BCR has not been calculated in this instance. Therefore, the Value for Money category has been based upon the core BCR. The Department for Transport defines the Value for Money categories as follows:
BCR of 0 or negative: Very Poor
BCR between 0 and 1: Poor
BCR between 1 and 1.5: Low
BCR between 1.5 and 2: Medium
BCR between 2 and 4: High
BCR of 4 and above: Very High
Based on the analyses to date, the BCRs indicates that the value for money category for the core high investment scenario is Medium and for the core medium and low investment scenarios the value for money category is High.
2.8. Sensitivity Tests A number of sensitivity tests have been conducted to explore the sensitivity of the economic results to various input assumptions. The results of these are presented below.
2.8.1. Adjustment for incorrectly modelled DM bus frequencies
As noted, analysis of the model results has identified incorrect service frequencies coded within the SRTM runs that have formed the basis of the economic analysis. A sensitivity test has therefore been conducted to estimate the impact of the anticipated change in benefits as a result of correcting these frequencies, in advance of a further SRTM run to confirm.

106
The increased patronage levels on the affected routes have been compared to other similar routes, with the relevant percentage uplift used to forecast new estimates of patronage on the under-represented routes. Due to confidentiality requirements relating to the bus operators, route-specific patronage volumes cannot be presented, however the table below demonstrates the percentage change expected at an aggregate level over a 12 hour day in 2041.
Table 2-34: Estimate of 12 hour patronage change through adjusted service frequencies
Core high investment scenario
Core medium investment scenario
Core low investment scenario
Additional estimated boardings
2,857 2,706 2,747
Current boardings Increase 13,167 11,711 8,237
Percentage change 22% 23% 33%
These percentage changes were then applied to the transport user benefits forecast from the current model forecasts to estimate the potential increase that could be expected should corrective model runs be undertaken.
Table 2-35: Sensitivity test for uplifted public transport user benefits to adjust for service frequency values
Core high investment scenario
Core medium investment scenario
Core low investment scenario
Core scenarios
PVC £226.5 £143.0 £107.9
Public transport user benefits
£608.1 £557.6 £410.4
PVB £365.7 £322.4 £245.4
NPV £139.2 £179.4 £137.5
BCR 1.615 2.254 2.274
Sensitivity test including uplifted public transport user benefits
Public transport user benefits
£740.0 £686.4 £547.3
PVB £497.6 £451.2 £382.3
NPV £271.1 £308.2 £274.4
BCR 2.197 3.155 3.542
£m, 2010 prices and values
It can be seen from the table above that there is the potential for a shift in the BCR position, particularly shifting the high investment scenario from the Medium to High Value for Money category.
2.8.2. Sensitivity test excluding general traffic user benefits
The packages all include considerable reallocation of roadspace from general traffic to public transport, in order to secure both the South East Hampshire Rapid Transit objectives and the

107
Transforming Cities Fund objectives involving a transformative change that delivers mode shift, better sustainability and enhanced access to jobs. Because of the city region’s geographic and other physical constraints, this does require roadspace reallocation – there is no supply of greenfield or brownfield sites on which to deliver the public transport infrastructure without affecting other road users.
In conventional economics terms, this reallocation of roadspace has led to forecast dis-benefits for general traffic. Considerable mode shift to public transport and active modes is forecast (and this itself provides a second-order decongestion effect) but the remaining general traffic trips see increased delay due to the re-prioritisation of capacity towards more sustainable modes.
As set out in monetised terms, the extensive benefits to existing and new users of sustainable modes, plus the consequential non-user benefits, are therefore partly counterbalanced by the dis-benefits to general traffic. This counterbalance flows through into the summary tables and ultimately the BCRs presented above.
However, this position must be seen in the light of the Transforming Cities Fund objectives and wider government policy direction. As noted above, these are looking for transformational change that delivers mode shift, better sustainability and enhanced access to jobs for those who need it most – in order ultimately to deliver sustainable growth. The packages deliver very considerable benefits in these respects, as set out in both the strategic and economic cases including the ASTs.
In that light, it is appropriate to consider, as a sensitivity test, the impacts on NPV and BCR if the monetised (dis)benefits to highway traffic, where the time change is between -2 minutes and +2 minutes were excluded. In effect, this answers the question “if the low value time change dis-benefits to general traffic are regarded as tolerable in the light of the Transforming Cities Fund objectives and wider policy position, what do the remaining benefits look like?”
Table 2-36 shows the results of this sensitivity test. This shows that removing the net dis-benefit to highway users associated with exclusion of marginal time impacts (both positive and negative) doubles the PVB value for the proposition, with a consequential significant movement of the BCR.
Table 2-36: Core scenarios plus sensitivity test excluding marginal journey time impacts to general traffic
Core high investment scenario
Core medium investment scenario
Core low investment scenario
Core scenarios
PVC £226.5 £143.0 £107.9
PVB £365.7 £322.4 £245.4
NPV £139.2 £179.4 £137.5
BCR 1.615 2.254 2.274
Sensitivity test excluding disbenefits to general traffic
PVB £507.2 £445.4 £281.1
NPV £280.7 £302.4 £173.2
BCR 2.240 3.114 2.604
£m, 2010 prices and values

108
2.8.3. High and low growth sensitivity tests
Additional SRTM runs were conducted with varying growth levels above and below the core level of growth assumed. The High and Low Growth Sensitivity Tests followed the process set out in TAG Unit M4 Forecasting and Uncertainty – Section 4.4 Defining High and Low Growth scenarios. These runs were conducted for the high investment scenario and the change in Transport User Benefits for each highlighted below, assuming that all other factors remain constant (for example, no change in accident benefits or noise and air quality impacts). Full specifications and details of the runs can be found within Appendix 2.18
Table 2-37: Core high investment scenario plus high and low growth sensitivity tests
Core high investment scenario
High growth sensitivity Low growth sensitivity
Travel time £204.5 £218.5 £153.3
Vehicle operating costs -£14.0 -£14.4 -£13.2
User charges -£0.4 -£9.4 -£5.0
Private sector revenue £252.7 £290.0 £239.1
Indirect tax -£32.8 -£38.2 -£30.5
PVB £365.7 £407.4 £304.6
PVC £226.5 £226.5 £226.5
BCR 1.615 1.799 1.345
£m, 2010 prices and values
Whilst the high growth sensitivity delivers additional benefits, the impact that higher travel volumes has on the highway network means that there is a greater dis-benefit to highway users as a result of the public transport infrastructure measures. This is due to the higher background traffic volume and whilst this does encourage a further switch to the new public transport system, those that are unable to switch still suffer a large dis-benefit. Therefore, the reduction in PVB between the central and low growth scenarios is greater than the increase between central and high growth, since the low growth scenario reduces some of this inherent congestion on the highway network that has an impact on the overall PVB of the scheme.
2.8.4. Public transport operating costs
Two sensitivity tests have been conducted against the assumptions that have been made in the derivation of the public transport operating costs.
The first of these is against the rate of inflation assumed, which in the core test is linked to the forecast rate of CPI as advised by the bus operators to be consistent with their forecasts. A test has been conducted assuming a 4% rate of inflation as used in the infrastructure cost forecasts, throughout the appraisal period.
A second test has been made assuming that the operators South East Hampshire Rapid Transit fleet is 25% greater than currently forecast, reflecting a scenario where a South East Hampshire Rapid Transit fleet is larger than currently anticipated either to meet additional demand or for other operational requirements.
The resultant impact on the PVB (since private sector costs are recorded as negative benefits in the TEE table) and the effect on the overall BCR are presented below.

109
Table 2-38: Core high investment scenario plus operating cost sensitivity tests
Core high investment scenario
4% inflation sensitivity 25% increase in fleet sensitivity
Business user and provider impacts
£202.40 £183.60 £187.80
PVB £365.68 £346.88 £351.08
PVC £226.48 £226.48 £226.48
BCR 1.615 1.532 1.550
£m, 2010 prices and values
The table above indicates that there is a change of approximately 0.1 on the BCR between the sensitivity tests and the core high investment scenario, should the assumptions around the bus fleet operation be changed by the values indicated.
2.8.5. Tipping point sensitivity tests
2.8.5.1. High investment scenario
Sensitivity tests have been carried out to determine the level of modal shift or decrease in scheme costs that would increase the BCR of the high investment scenario to a value of 2.0, which would represent a Medium/High value for money rating as recognised by the Department for Transport.
Analysis shows that a modal shift of an extra 2,400 passengers per day by 2041 would increase the PVB to £453m, and therefore the BCR to 2.0. This would be approximately 23% more passengers choosing to use public transport than is modelled by the high investment scenario. This has been calculated based on the journey time benefits only; the positive effects due to modal shift, such as reductions congestion and greenhouse gas emissions, have not been considered. Therefore, it is likely that the number of extra bus passengers required to increase the BCR to 2.0 would be lower than 2,400 per day.
Alternatively, a BCR of 2.0 could be achieved in the high investment scenario by a £44.1m reduction in present value costs, which equates to a 19% decrease.
2.8.5.2. Medium and low investment scenarios
The medium and low investment scenarios are expected to deliver BCRs of over 2.0. Sensitivity tests have been carried out to determine how robust these BCRs would be under either increased costs or lower than expected levels of modal shift. This has been calculated by assessing the cost increase or modal shift decrease (when compared to forecast levels) required to bring the BCR down to 1.999, which would be considered in the ‘medium’ value for money category by the Department for Transport.
As shown in Table 2-39, the BCRs for the medium and low investment scenarios would be reduced to below 2.0 by present value cost increases of £18.3m23 (13%) and £14.8m24 (14%) respectively. Alternatively, 1,000 and 700 fewer bus passengers each day throughout the appraisal period than forecast (10% reductions) in the medium and low investment scenarios respectively would have the same effect on the BCR, causing the schemes to be classed by the Department for Transport as Medium value for money.
23 £m, 2010 prices and values
24 £m, 2010 prices and values

110
Table 2-39: Medium and low investment scenario tipping point sensitivity tests
Medium investment scenario
Low investment scenario
Present value cost increase required to reduce the BCR to 1.999 (£m, 2010 prices and values)
£18.3 (+13%) £14.8 (+14%)
Modal shift required to reduce the BCR to 1.999 (number of passengers per day)
-1,000 (-10%) -700 (-10%)
2.8.6. Sensitivity test around in-vehicle time assumptions
A sensitivity test has been carried out to test the assumption that passengers’ perception of improved journey quality can be represented by a 10% reduction in in-vehicle generalised time. The following figure compares the total generalised journey time for the core high investment scenario against the in-vehicle time sensitivity scenario, in which the 10% in-vehicle time reduction has been removed. This is shown for each proposed rapid transit route, broken down by in-vehicle time, walking time, waiting time, interchange and boarding time and the cost of the bus fare.
Figure 2-4: In-vehicle time sensitivity test
On average, removing the 10% reduction increases the overall journey time by 4%. In order to assess the monetary impact of this, the travel time benefits have been scaled accordingly and a BCR has been calculated for the in-vehicle time sensitivity test. As shown in removing 10% reduction in generalised time leads to an approximately 16% lower overall PVB, taking the BCR down by 0.254 to 1.361 for the high investment scenario.

111
Table 2-40 removing 10% reduction in generalised time leads to an approximately 16% lower overall PVB, taking the BCR down by 0.254 to 1.361 for the high investment scenario.
Table 2-40: In-vehicle time sensitivity test
Core high investment scenario In-vehicle time sensitivity
Travel time £388.8 £331.3
PVB £364.8 £307.4
PVC £226.5 £226.5
BCR 1.611 1.357
£m, 2010 prices and values
2.9. Indicative non-monetised impacts The final stage of the value for money assessment considers indicative monetised impacts, non-monetised impacts and the results of any sensitivity tests. It involves determining whether these impacts, either individually or collectively, are likely to materially alter the overall value for money of the proposals from what was indicated by the adjusted BCR.
The approach, based on ‘switching values’, is set out in the Department for Transport’s guidance Value for Money: supplementary guidance on categories (2016). Switching values represent the extent to which PVB or PVC would need to change in order to change the value for money category. Analysis is then used to form a judgment as to how likely this change is, and whether the final value for money category should be changed based on this likelihood.
2.9.1. Non-monetised impacts
The following non-monetised impacts have been assessed and are summarised in the AST:
Security
Severance
Accessibility
Townscape
Historic environment
Landscape
Biodiversity
Water environment
Affordability
Access to services
Option and non-use values
2.9.2. Appraisal Summary Table (AST)
The AST summarises all the aspects of the appraisal, whether qualitative, quantified or monetised. The ASTs for the high, medium and low investment scenario can be found in Appendix 2.20

112
2.10. Value for money statement The current initial BCRs range between 1.61 and 2.26 based on the second iteration of the rapid transit and core infrastructure schemes, putting the core low and medium investment scenarios in the High value for money category and the high investment scenario in the Medium value for money category. Sensitivity analysis, most notably around the exclusion of marginal journey time impacts on general traffic, suggests the medium investment scenario is the strongest, and also suggests that the value for money position for the high investment scenario may be understated. Whilst significant revision and development has taken place between June and November, there is still scope for further enhancement to infrastructure designs and the specification of the public transport service offering. This, alongside a corrective re-run of SRTM to address known downside errors, would lead to a revised and more accurate portrayal of benefits from the scheme, which is likely to most significantly impact and improve the relative and absolute value for money position of the medium and high investment scenarios.

113

114
3. Commercial Case
3.1 Introduction The commercial case provides evidence on an investment’s commercial viability and the procurement strategy that will be used to engage the market. It also provides evidence on risk allocation and transfer, the timescales for contracts and implementation, and details of the capability and skills of the teams delivering the investment.
The structure of this commercial case reflects the markets that we are engaging with: transport providers over service development, vehicle specification and investment, and contractors for infrastructure. These are set out as follows:
Transport operators (section 3.2);
Infrastructure schemes (section 4.3); and
Non-infrastructure schemes (section 4.4).
3.2 Market engagement and procurement strategy: transport operators
Existing partnerships and ongoing engagement on SEHRT
The local authorities and transport providers have a strong previous track record of delivering partnership projects of comparable scale, profile and complexity.
Solent Transport brings together the local transport authorities: Hampshire County Council, Isle of Wight Council, Portsmouth City Council and Southampton City Council. The first three of these authorities are working in partnership on this bid and will be the contracting bodies if the bid is successful. Solent Transport has submitted a complementary Solent Mobility Zone bid to the FMZ fund, theme 1 of which addresses personal mobility through a versatile app-based platform or 'marketplace'. The app would enable a pilot of Mobility as a Service for Portsmouth University staff, students and visitors. Solent Go the multi-operator, multimode ticket would be expanded, introducing hopper, carnet, jobseeker and bus+rail tickets. The app would also be used to trial mobility credits for low income households in Havant and a secure bikeshare scheme for Portsmouth and Gosport. These support the TCF goal of increasing economic activity and personal mobility whilst reducing dependence on the car.
The establishment and operation of the Solent Transport partnership is governed by a legal agreement. The agreement was considered and agreed by the Joint Committee on 16 October 2007 and was approved and sealed by the three constituent authorities (at the time) of Hampshire County Council and Portsmouth City Council and Southampton City Council (the Isle of Wight Council joined in 2012). It is available at www.solent-transport.com/images/gov/tfsh-legal-agreement.pdf (some of the working groups detailed in the legal agreement have subsequently changed).
Solent Transport works with a range of key partners in the Portsmouth city region:
Department for Transport
First Hampshire
Gosport Ferry Ltd

115
Hampshire Chamber of Commerce
Highways England
Hover travel
Isle of Wight Transport Infrastructure Board
Network Rail
Partnership for Urban South Hampshire (PfSH)
Solent Local Enterprise Partnership
South Hampshire Bus Operators' Association
South Western Railway
Southern Vectis
Stagecoach South
Wightlink Ltd
Further information on Solent Transport is available at www.solent-transport.com.
South Hampshire Bus Operators Association (SHBOA) brings together First, Go Ahead, Stagecoach and the independent bus operators across the area. SHBOA and Solent Transport jointly developed the ground-breaking multi-operator Solent Travelcard which developed into the current Solent Go ticket range, adding ferries, smartcard and m-ticket options. SHBOA is an unincorporated association with a defined constitution and is open to any operator of a registered local bus service in the area. The constitution sets out its objectives, which include promoting the use of public transport and acting as a body for the regulation of any matters or settlement of any issues between members, and that no business of the Association shall relate to any commercial arrangements of its members.
Examples of successful local partnership working
Examples of successful partnership working, through SHBOA or directly between local authorities and operators, as in the current bid, include:
The Zip, now Star, bus priority corridor between Horndean and Portsmouth in 2008, delivered by Hampshire County Council, Portsmouth City Council, and First, was the first element delivered (to date) of the proposed SEHRT network;
“Better Connected South Hampshire” project 2012-2015 Large Local Sustainable Transport Fund (LSTF) project, managed by Solent Transport, which delivered £31m of investment (£17.8m from the DfT) into a range of sustainable transport interventions between 2012 and 2015, including creation of the Solent Go smartcard, which added local ferry services;
South Hampshire Better Bus Area Fund (2014): delivery of £4.5m project to enhance quality of bus travel across South Hampshire. 137 buses were refurbished, and 565 buses fitted with on-bus Wi-Fi;
The Eclipse Bus Rapid Transit between Gosport and Fareham, delivered by Hampshire County Council and First in 2012, has since seen over 65% passenger growth and a 20% modal shift from car to bus and is now being extended under Tranche 1 of TCF funding;

116
The roll-out of contactless payment on almost 1,000 buses across the area in 2017 using joint funding from bus operators and local Bus Service Operators' Grant (BSOG) contributions; and
Solent Transport manages the Solent Go multi-operator smartcard jointly with SHBOA, as well as managing other initiatives jointly with the Local Highway Authorities including the well-regarded My Journey travel behaviour change programme.
The immediate success of Eclipse in 2012 following the earlier Zip corridor in 2008 led to the development of the South East Hampshire Rapid Transit project and early work, especially in 2014-15, in devising the network and interventions now being proposed. TCF funding could give a major acceleration to SEHRT implementation, with many projects at an advanced stage for early delivery in the timescale required. SEHRT is a direction of travel and network development, e.g. BRT links to major developments such as Welborne north of Fareham, will continue to be implemented beyond the TCF delivery horizon. More details can be found in Appendix 5.18
Approach to securing operator contributions
SEHRT is a partnership which combines publicly-funded infrastructure, and local authority complementary measures with largely transport provider funded investment in vehicles and frequencies. This provides the operators with a bottom line driver for success. For this reason, a voluntary partnership with an overarching agreement and a detailed management and delivery plan has been identified as the most effective way to drive the project forward. All SEHRT routes will be operated on a commercial basis.
Through the local development planning process, the Local Transport Authorities promoting SEHRT are working with Local Planning Authorities to ensure that SEHRT links are extended into major development sites, seeking developer contributions to support this. Good examples are Welborne, Tipner West and Solent Enterprise Zone Daedalus.
Services need to be commercially self-sustaining, so regular meetings between the partners led to a comprehensive re-evaluation and refresh of the SEHRT proposals starting in 2018. Bus operators have agreed to the commercial risk of investment in new, higher specification vehicles and service improvements while demand builds. Their engagement at national level and letters of intent recognise the potential for growth in the bus market in Portsmouth if investment to provide extensive bus priority is secured, and the vital importance of joint action if their existing local businesses are to remain sustainable in the face of worsening traffic congestion. With detailed modelling, risks and uncertainty are minimised so that these commitments made can be delivered.
The principle of SEHRT, and our previous successful partnerships, is co-design: it is an iterative process which involves other modes and detailed stakeholder engagement so that the results work for all the partners and the wider community.
The client team has a range of experienced personnel with a track record of relationship building, partnership working and successful project delivery.
The different partnership options offered under the Bus Services Act 2017 have been carefully considered by the partners but it was felt that a legal approach might limit ambition and flexibility at a time of rapid development in the customer offer. Bus operators will sign up to a new, two-part voluntary Quality Bus Partnership (QBP), the first part with binding commitments for the short to medium term, the second part with a statement of intent and direction of travel for the medium to long-term.

117
The successful management of Eclipse locally provides a model of a decision-making body comprising local authority and operator members, meeting regularly. The QBP will detail the contributions of each partner essential for the project to succeed and the ongoing regular management arrangements needed for effective monitoring, ensuring value for money, by sharing information on delivery and appropriate risk allocation, and performance, building on the current regular partner meetings.
The coastal geography of Portsmouth, South East Hampshire and the Isle of Wight results in longer journey times and constrained corridors leading to congestion and air quality issues, reduced mobility, poorer health and restricted employment opportunities. A public transport system which makes best use of finite highway capacity is essential for the area to deliver economic growth and health and housing targets. The biggest risks to the local authorities, and transport providers, would come from not acting in the ways proposed.
SEHRT will be a bus rapid transit network linking Gosport, Fareham, Cosham, Waterlooville, Leigh Park and Portsmouth offering easy interchange with local bus, ferry and rail services. Infrastructure improvements at junctions, stops at interchanges and on route will deliver faster, more consistent, journey times. Wayfinding, WiFi at stops and high quality vehicles on a 10 minute or better frequency will offer an improved customer experience. Tap on tap off ticketing and improved journey information will make rapid transport an attractive, easy to use, option both for existing users, current non-travellers, and for the current and future car drivers it needs to attract to retain a viable highway network and to be commercially sustainable.
The project builds on past successes and long-term proven partnership working which gives the best opportunity for ensuring a project which will be deliverable within the timescale and will achieve the desired results for all parties.
Appendix 5.12 provides letters of intent from First and Stagecoach, and from members the SEHRT Partnership Group. Section 5.8.5 in the Management Case also refers to these.
3.3 Market engagement and procurement strategy: infrastructure schemes
In case of any shared activities between Portsmouth City Council, Hampshire County Council and Isle of Wight Council infrastructure schemes will generally be procured by the relevant local authority, using their existing, proven, supplier arrangements as described below. Authorities will work together to make best use of supply market capacity and where there is synergy in programming and geographical proximity of adjoining transport corridors, collaborative procurement arrangements may be undertaken. Tried and tested procurement arrangements will be used, recognising the demanding delivery timescale needed for successful TCF delivery.
Hampshire County Council schemes
It is anticipated that each element (scheme intervention) will be delivered via its own procurement package. At present this would mean 12 individual procurement packages but this will vary depending on whether high, medium or low packages are approved.
The construction of schemes will be procured via the new GEN4 frameworks which will commence in April 2020 and continue until the end of March 2024. The approach to the selection of suppliers based on likely balance of risk, control and funding for the schemes is set out in Appendix 4.1. The frameworks will build on the success of the GEN3 frameworks which have been in operation since April 2016. As with the GEN3 frameworks, the new GEN4 frameworks will cover specialist civil

118
engineering structural works, complex highway infrastructure works and public authority civil engineering works.
GEN4 frameworks are an evolution of the current GEN3 framework with a similar approach to supplier recruitment to ensure continuity of supply and standards.
The current GEN3 frameworks are:
GEN3 framework 1: Individual projects up to £450k. Eight suppliers.
GEN3 framework 2: Specialist works and complex highway works: £50k to £10m. Two lots of ten suppliers.
GEN3 framework 3: Significant highway infrastructure and civil engineering works: Individual project values £8m to £25m. Three national suppliers.
Since 2016 the GEN3 frameworks have been used to procure £130m of infrastructure contracts, with four contracts procured through GEN3.3 (£8m - £25m) alone, totalling £47m in value.
The GEN4 frameworks will be similar; however, with new individual project values and different number of suppliers on each as follows:
GEN4 framework 1: Individual projects up to £250k. Eight suppliers.
GEN4 framework 2: Specialist works and complex highway works: £50k to £10m. Two lots of eight suppliers.
GEN4 framework 3: Significant highway infrastructure and civil engineering works: Individual project values £8m to £150m. Four suppliers.
The call-off contract used to appoint a contractor for individual schemes will be procured under the terms and conditions of the NEC 4 Engineering and Construction Contract using the most appropriate payment option and will be let under the Framework Contract. This contract is applicable to both the value and the timescales required for the scheme and is expected to be used for contracts up to £150m.
The procurement framework used by Hampshire has been shown to provide value for money while also enabling delivery of complex infrastructure projects on time and to budget (see Management Case).
Further details are provided in Appendix 4.1.
Isle of Wight Council schemes Scheme elements: Ryde Transport Hub is a single project with multiple components to be delivered by Isle of Wight Council within this package.
The SEHRT proposals for the Ryde Transport Hub have been developed in partnership with a subgroup of the Isle of Wight Transport Infrastructure Board. The Transport Infrastructure Board (formerly Transport Infrastructure Taskforce) was formed by the local MP with a remit to develop and oversee transport infrastructure improvements on the Isle of Wight and is independently chaired by an appointee of the local MP.
The SEHRT project subgroup comprises senior management from all the relevant local public transport providers including, Wightlink, Hovertravel, Southern Vectis (Go South Coast) and South Western Railway. As well as representatives from the Isle of Wight Council and Solent Transport.

119
It consists of a number of elements, as described in Appendix 5.5. The elements will be delivered as follows:
Realignment of the pier access road and bus interchange:
o Designed and delivered by Island Roads through the council’s existing PFI contract awarded to Island Roads following a three year OJEU competitive tendering process (see below). Under this contract, the assets remain with the council but responsibility for maintenance to highway standard over the life of the contract is with Island Roads which incentivises good workmanship. Contract rates were initially assessed for competitiveness at the commencement of the contract and have recently been reviewed for a similar major highways improvement scheme. This was through an independent verification process undertaken by Hampshire County Council to ensure that they are in line with works of a similar scale in the Hampshire region. Performance is measured against, and payment made according to, agreed KPIs.
o There will be an allocated project manager within the Isle of Wight Council and further project management support will be provided through a capital works delivery contract supplier WYG Group. This contract was awarded in March 2019 and includes the delivery of all capital projects, using Isle of Wight Council procedures for project management.
o Any required real-time information equipment can be procured via the existing Hampshire County Council framework upon which the Isle of Wight Council is a named contracting authority.
Station and transport hub - operation and customer experience enhancements:
o As the current franchisee responsible for the existing buildings at the Ryde Transport Hub, these works will be managed and delivered by South Western Railway’s Property Team in conjunction with Network Rail. They will use their existing supply lines and contracts/supplier frameworks.
o In addition, there will be an allocated project manager within the Isle of Wight Council to oversee the works to ensure that they meet the programme deadlines.
Cycling and walking links:
o Designed and delivered by Island Roads through the council’s existing PFI contract.
o In addition, there will be an allocated project manager within the Isle of Wight Council and further project management support will be provided through a capital works delivery contract supplier WYG Group, using Isle of Wight Council procedures for project management.
Ryde St John's Road Station: Park and Ride
o Designed and delivered by Island Roads through the council’s existing PFI contract.
o In addition, there will be an allocated project manager within the Isle of Wight Council and further project management support will be provided through a capital works delivery contract supplier WYG Group, using Isle of Wight Council procedures for project management.
Ryde Pier: Combined cycle way and boardwalk:

120
o As the owner of the relevant section of the pier structure, Wightlink will oversee, design and deliver these works using use their existing supply lines and contracts/supplier frameworks.
o In 2010 Wightlink completed works to a similar scale when resurfacing the promenade pier utilising the original cast iron piles. The specification allowed for cars and light vans to use the pier. Due to that work, the risks and the work required to complete the planned improvements along the pier are known and manageable.
o As per all of the elements of the project, there will be an allocated project manager within the Isle of Wight Council to oversee the works to ensure that they keep to the agreed programme of works.
Accessible lifts and raised walkway connecting with Hovertravel terminal:
o Designed and delivered by South Western Railways using existing contractor/supplier frameworks.
o In addition, there will be an allocated project manager within the Isle of Wight Council and further project management support will be provided through a capital works delivery contract supplier WYG Group, using Isle of Wight Council procedures for project management.
Key supplier: The key supplier for the main highways infrastructure improvements is Island Roads who are the council’s PFI Provider. The 25-year contract began in 2013 and was awarded to Island Roads following a three year OJEU competitive tendering process. This contract allows for variations to undertake additional works as required, such as the proposed improvements for the Ryde Transport Hub. All of the costs for the proposed improvements are as agreed within the contract rates, which were initially assessed for competitiveness at the commencement of the contract. The contract prices have recently been reviewed for a similar major highways improvement scheme. This was through an independent verification process undertaken by Hampshire County Council, to ensure that they are in line with works of a similar scale within the Hampshire region.
Island Roads have significant experience in designing and delivering large scale highways capital schemes including the ASDA Roundabout, Newport (£4m) and Newport Junction Improvement Programme (£9.5m), which is in progress at time of writing.
The contracted services delivered by Island Roads include capital investment works, maintenance activities, environmental services, emergencies and winter service, network management, geotechnical schemes, and management and maintenance of the Yar Bridge.
Through local market supply chains, Island Roads has the capacity to undertake all the necessary infrastructure works to meet the aims of this proposal and within the defined timescales, limiting the need for any back up arrangements. The close working partnership between the Isle of Wight Council and Island Roads facilitates increased efficiency and innovative delivery. Incentives are built into the Island Roads contract to encourage performance against agreed deliverables.
Main risks: The main risks are:
Co-ordination with landowners and transport stakeholders. Mitigation: There are three key landowners: Isle of Wight Council, Network Rail and Wightlink. All parties have been involved in discussions and are keen to support this project.
Planning Consent Mitigation: A previous scheme for regeneration of Ryde Interchange successfully achieved planning permission and has therefore set a precedent for this project

121
and all associated improvements. Some elements of the proposal within this business case, e.g. revised bus station forecourt and highway access, are largely unchanged from the previously permitted scheme. The local community has been and will continue to be engaged through the Ryde Regeneration Group.
Project cost increase and programme slippage. Mitigation: Costs are being monitored through design development involving project delivery partners. Project is monitored monthly via the Transport Infrastructure Board at project delivery partner level.
Project Management The council will utilise the current contract with WYG Group for major schemes to manage the delivery of this contract. They will work in partnership with all stakeholders including the Council to manage risks and ensure that the programme of works are adhered. Project risks are identified in the Risk Register and risks will be allocated to the relevant partners that will take on each risk. Where possible, risks will be reduced throughout the design period and those remaining risks identified as part of the contract documents.
Portsmouth City Council schemes
Procurement methodology: In respect of schemes that are not predominantly within the city centre Portsmouth City Council is proposing to predominantly use Hampshire County Council’s GEN4 framework contract. This will mean using an approved framework of suppliers as per Section 4.3.1 above.
Works that are predominantly located within the city centre area will be procured via a Portsmouth City Council strategic framework agreement which was established in early 2019 for the development of highways and related infrastructure within this area. The single supplier framework agreement runs on the basis of two stage open book design and build contracting with services and works drawn down as required on a flexible basis. The framework contractor is Alun Griffiths who have appointed Peter Brett Associates as their design lead.
In addition to these two primary framework sourcing routes, the council has also established a multiple contractor framework which could be used to deliver any standalone lower value, lower complexity works. This framework runs on the basis of single stage, fully designed contracting.
Finally the council also has the facility to call off works to any value via its 25-year highways PFI agreement with Ensign (Colas). This route may be advantageous for schemes where there are significant risks in traffic management or later adoption into the PFI.
Where signals are procured separately to civils works Portsmouth City Council would access the Crown Commercial Service Framework Agreement which allows for compliant direct award access to Siemens. A direct award is key because 80% of Portsmouth City Council's current network infrastructure is made up of Siemens technology.
As the sourcing routes referred to above have all been established by OJEU compliant processes the only financial implications of these routes is in relation to standard rebate payments that the council will incur for accessing sourcing routes established by Hampshire County Council and Crown Commercial Services. Where the council uses the GEN4 contract, there are small fees associated with its use (1-2% of the total fee). This is proven to be more efficient than ad hoc, in house, procurement and enables faster delivery.
Further details in respect of the council's choice of procurement strategy are included in Appendix 3.2.

122
As detailed within Appendix 3.2, all Portsmouth City Council established sourcing routes have been established in full compliance with Public Contracts Regulations 2015 to the satisfaction of the council's procurement and legal functions. All sourcing routes established by third parties, have been checked in respect of compliance and ability for Portsmouth City Council access via the council's procurement and legal functions.
Demonstration that the arrangements are in place: In respect of resource required to deliver the programme of works and schemes, all of Portsmouth City Council's projects are managed by experienced project managers and engineers, all of whom have significant experience of all aspects of contract management, particularly of the NEC suite of contracts which will govern the performance of high value civils infrastructure works. Portsmouth City Council has experienced specialists in finance, procurement, legal with specific market knowledge in house. In addition to this the council is also able to call on the expertise of its strategic partner Atkins via a Portsmouth City Council established OJEU compliant framework arrangement should additional support be required; this includes the use of quantity surveyors and commercial managers to ensure the best possible price for the work undertaken.
Each project is delivered by the application of appropriate contract terms the council's preference and experience is for the use of NEC3 and NEC4 where possible.
Regular monitoring of expenditure, not just to verify expenditure against budgets and agreed costs, but also to identify changing patterns or situations that need corrective action during the course of a project is undertaken by the council and its consultants.
Standard performance variables covered are: Budget for area of activity, planned expenditure, actual expenditure to date, balance of budget remaining, analysis and explanation of any positive or negative variances when comparing expenditure and forecast.
Summary of how this supports value for money and early delivery: Some of the schemes in the programme are advanced to a stage where delivery can start soon after confirmation of funding award by using the procurement arrangements outlined above. Existing frameworks and strong working relationships with these contractors means that Portsmouth City Council will be able to mobilise and deliver quickly.
All of the sourcing routes outlined above have been subject to competitive processes and are continually benchmarked to ensure value for money when compared against other options. The majority of the sourcing routes allow for streamlined direct award call-off mechanisms which will be very beneficial for early delivery. The only route that dictates a level of further competition is the Hampshire Generation three and four framework agreement however, sourcing via this route can still be achieved on streamlined timescales when compared to bespoke advertised OJEU procurement procedures.
3.4 Non-infrastructure schemes
These will include arrangements to provide and maintain bus stop infrastructure (shelters, poles and flags), transport interchanges, wayfinding and active travel routes, real-time systems, including on bus systems, WiFi and USB charging at key stops, passenger information and publicity, and new ticketing systems.
Tap On Tap Off ticketing, initially by operator, with a road map to multi-operator and then multi-mode is seen as a key element of the bid offering ease of use for new and existing users with a best price guarantee. Operators may have different equipment manufacturers and will need to be able to specify the system that will be used on their own services but we have been engaging at national level to ensure that compatible standards are used and that the system is future proof. The bid seeks

123
funding to cover the cost of second readers on each vehicle and ferry operator ticket system adaptation costs. The ticketing scheme will need to comply with the Block Exemption criteria and the revenue apportionment system may be one run by a bus industry body or build on existing Solent Transport arrangements. Bus operators will take responsibility for installation and maintenance of vehicle-based systems and local authorities will set out arrangements to manage and maintain on route facilities to ensure an attractive end to end journey experience throughout and beyond the life of the project.
Hampshire County Council schemes
Hampshire County Council has established frameworks for the provision of professional and technical services. The Hampshire Highways Services Partnership with Skanska provides for professional services through a long term services contract. The County Council also has a long term Strategic Partnership with Atkins through which a full range of professional and technical services can be readily and simply accessed. The County Council also has access through Hampshire Services, including Engineering Consultancy that can provide direct services on a cost recovery model basis. In additional the county council has a wide range of in-house services to draw upon. These include the strategic transport team which has a proven record of delivering large capital schemes while Engineering Consultancy has an established trading services capability with the ability to draw on additional resources as required. These provide the ideal resource for a project such as SEHRT. The Travel Planning team works in partnership with Living Streets, Sustrans and Energise Me to provide travel planning services to schools businesses and communities and provides an ideal means to promote the active travel elements of the SEHRT project.
Portsmouth City Council schemes
Existing framework contracts would be utilised wherever possible. Where the value is below £100,000 then three quotes would be obtained. If the value is above £100k and no existing framework could be drawn upon then a bespoke procurement process would be undertaken in full compliance with the Public Contracts Regulations 2015 and the council's Contract Procedure Rules. Any procurements with a lifetime value in excess of £100,000 are subject to the council's gateway checkpoint process with professional support from the council's in-house legal and procurement teams to ensure adherence to regulation and best practice. Please see the Appendix 4.2.
The following procurement routes could be drawn upon:
Fully delivered in-house by local authority;
Fully delivered by external consultant; and
Some elements delivered by each.
In the first instance, the capability and capacity of our in-house teams will be considered to deliver elements, subject to having the necessary funding. However, given the time pressures, where appropriate Portsmouth City Council will also look to utilise existing procurement routes, including existing frameworks to minimise risk to delivery timescales.
PCC has an OJEU-compliant long-term Professional Services Framework with Atkins which can be used to provide a range of technical services such as engineering design, modelling, surveys, project delivery, policy development and network management advice. This can also be used to access a range of other service providers who partner with Atkins.
Furthermore, the procurement exercises undertaken to deliver the non-highway components of the SEHRT Tranche 1 programme, for example the purchase and installation of real time information systems, will provide the contractual basis for any further procurement required for real time

124
information equipment. Portsmouth City Council has two available sourcing routes for future purchases of real time information supplies:
Direct award to VIX Technology Ltd via Hampshire County Council's single supplier framework. The council has previously used for the supply of in-shelter real time passenger information screens to display services at a particular bus stop.
Additional purchases from the council's flexible contract with 21st Century Technology Ltd procured via an advertised OJEU compliant Open Procedure for the supply of large LED screens displaying a bespoke package of consolidated real time information at bus interchanges.
PCC has a track record of delivering travel planning programmes in recent years, most recently through the Air Quality Grant Programme. This means a range of relevant partners is already in place and will be quickly able to mobilise. Partners include specialist transport planning consultants, Sustrans, the Community Cycle Hub social enterprise organisation (Motiv8), our Bikeability provider (Pedal Power), and the Blue Lamp Trust (for smarter driver training and in-car technology). These provide an established conduit to promote the active travel elements of the SEHRT project.
PCC has a range of contracts in place with providers covering services such as driver training, cycle training, and journey planning, that can be used on competed rates for these commissions.

125

126
4. Financial Case
4.1 Introduction
The financial case assesses the potential financial impacts to the South East Hampshire Rapid Transit (SEHRT) partners' bid for funding under the Department for Transport's (DFT) Transforming Cities fund (TCF).
The financial case covers the affordability of an investment, its financial profile and its funding arrangements.
The structure of this financial case is as follows:
A description of the project costs (i.e. capital costs) (section 4.2)
A description of the operation and maintenance costs (section 4.3)
A description of the other whole-life costs (section 4.4)
The funding profile (section 4.5)
Acceptance of financial responsibility (Section 4.6)
Sources of local contributions (section 0)
How funding has been secured from these sources (section4.8)
Section 151 officer confirmation (Section 4.9)
4.2 Project (Capital) Costs
Local Authority Costs
4.2.1.1 Basis of Estimation
Portsmouth City Council and Hampshire County Council
The evaluation of the various infrastructure workstreams have been carried out by Hampshire County Council's Engineering Consultancy service. The estimations have been carried out using draft outline designs and applying an average schedule of rates to those designs. As the designs become more mature a further estimation exercise will be carried out.
A full tender has not been carried out and instead the costs quoted are based on initial soft market testing including contractor buildability assessments, information gained from previous similar schemes and other projects. Hampshire's Engineering Consultancy service has carried out initial cost estimates on behalf of both authorities using typical local rates and estimated measurements, but until the authorities move to detailed design these are only estimates and therefore 44% optimism bias has been applied to these costs.
In order to manage actual cost risk, the authorities will commission the works as set out in the commercial case, including holding risk workshops with the preferred supplier. At the time of submitting the Strategic Outline Business Case these have yet to be carried out.
Table 4-1 - Estimates carried out by Hampshire County Council's Engineering Consultancy service using this rationale can be seen in Table 4-1 below.

127
Table 4-1 - Estimates carried out by Hampshire County Council's Engineering Consultancy
Scheme Name Authority Contractor
Cost Internal Fees Risk Total Cost
Waterlooville Corridor HCC £3,174,800 £1,193,725 £1,922,151 £6,290,675
Waterlooville Town Centre
HCC
£3,550,371 £1,334,940 £2,149,537 £7,034,848
Rusty Cutter
HCC £5,572,446 £2,095,240 £3,373,782 £11,041,467
Fareham Bus Station and Town Centre
HCC £3,009,495 £1,131,570 £1,822,068 £5,963,133
Delme Roundabout
HCC £4,981,048 £1,872,874 £3,015,725 £9,869,647
Fareham – Portchester
HCC £1,832,131 £688,881 £1,109,246 £3,630,258
Portchester District Centre
HCC
£7,407,574 £2,785,248 £4,484,841 £14,677,663
Portchester – Cosham
HCC £4,664,079 £1,753,694 £2,823,820 £9,241,592
Gosport Busway Completion
HCC £22,153,614 £5,206,099 £12,038,274 £39,397,987
Gosport Highway
HCC £1,009,367 £379,522 £611,111 £2,000,000
Havant Town Centre –
Highway
HCC £6,922,279 £2,602,777 £4,191,025 £13,716,081
Havant Town Centre - Walking and cycling
HCC £3,687,313 £1,386,430 £2,232,447 £7,306,190
Gosport Interchange
HCC £4,332,807 £1,629,135 £2,623,255 £8,585,197
A3020 Holbrook Road/Lake Road
HCC £2,710,421 £1,007,461 £1,622,228 £5,340,110
Alfred Road Junction
PCC £470,710 £163,827 £263,796 £898,333
Anchorage Road High
PCC £3,764,901 £1,403,947 £2,260,653 £7,429,501
City Centre North
PCC £2,516,517 £933,802 £1,503,620 £4,953,939
City Centre South PCC £1,536,386 £569,222 £916,568 £3,022,176
Clarence Pier
PCC £1,397,380 £514,134 £827,866 £2,739,380
Portsbridge Roundabout
PCC £2,173,123 £776,862 £1,250,913 £4,200,898
St Michaels Gyratory
PCC £6,145,458 £1,488,181 £3,339,441 £10,973,080
Terraces and King Road
PCC £1,872,101 £691,127 £1,112,860 £3,676,088
Rudmore Roundabout
PCC
£1,062,544 £382,221 £615,457 £2,060,222
Southsea Corridor
PCC £2,574,761 £964,783 £1,553,505 £5,093,049
Spur Road High PCC £6,621,319 £1,556,010 £3,598,025 £11,775,354
London Road
PCC £2,031,757 £755,481 £1,216,485 £4,003,723
Eastern Road Bus Gate
PCC £333,606 £109,456 £176,247 £619,309
Cosham Interchange Scheme
PCC £1,029,031 £377,327 £607,578 £2,013,936
£108,537,338 £35,753,975 £63,262,523 £207,553,836

128
Isle of Wight Council
The Isle of Wight scheme is based on a development which was taken to detailed design a number of years ago. Initial estimates were based on that estimate and inflated to today’s value. Through the TCF bid development process, the Isle of Wight Council confirmed these estimates through:
Feasibility Design and Cost Estimate for the Cycling and Walking (LCWIP), Highway and Bus
Infrastructure elements;
Feasibility Design and Cost Estimate for the Pier cycling and walking facility provided by
Wightlink;
Grip 2 estimates of the station improvements provided by South Western Railways.
A full tender process has yet to be carried out for all elements of the Isle of Wight Council scheme. A high-level risk register has been developed. However, without tendered contractors, a statistically significant quantitative risk assessment (QRA) cannot be performed at this time. Risk allowances have been developed for each element of the scheme based on the level of design developed, known risks and standard risk uplifts for rail station improvement projects at a Grip 2 phase.
Table 4-2 below shows the scheme that has been calculated using the method described above.
Table 4-2 - Estimates carried out by Isle of Wight Council
Scheme Name Authority Contractor
Cost Internal
Fees Risk Total Cost
Ryde Transport Hub Isle of Wight Council £11,190,000 £0 £4,010,850 £15,200,850
£11,190,000 £0 £4,010,850 £15,200,850
Estimated Costs
Individual scheme estimates are included in Appendix 4 – Financial case. At the moment no individual scheme risks have been identified and instead and optimism bias risk value has been included.
Each individual scheme has been priced by a quantity surveyor using local rates. Because of the current stage of the project detailed design is yet to be undertaken and a preferred contractor has not been appointed yet.
The consequence of this is that a detailed risk exercise with suitable risk mitigation has not been undertaken. However, this will be carried out at the time of awarding a contract as detailed in the commercial case. As no detailed quantified risk has been calculated the Regional Authorities are instead relying an optimism bias and risk rate of 44%.
4.2.1.2 Inflation
The costs have been inflated by 4% per annum over the period of the project. Civil Engineering Indices tends to track around 2% greater than CPI. The government's target value for CPI is 2% and its fiscal policy is geared around trying to achieve this target so 4% seems a sensible estimate of average inflation over the project period.
At the time of submitting this bid the United Kingdom has an uncertain economic future and the full economic impact of leaving the European Union is as yet unknown. This bid is also being submitted two weeks before a General Election which again adds a degree of economic uncertainty.
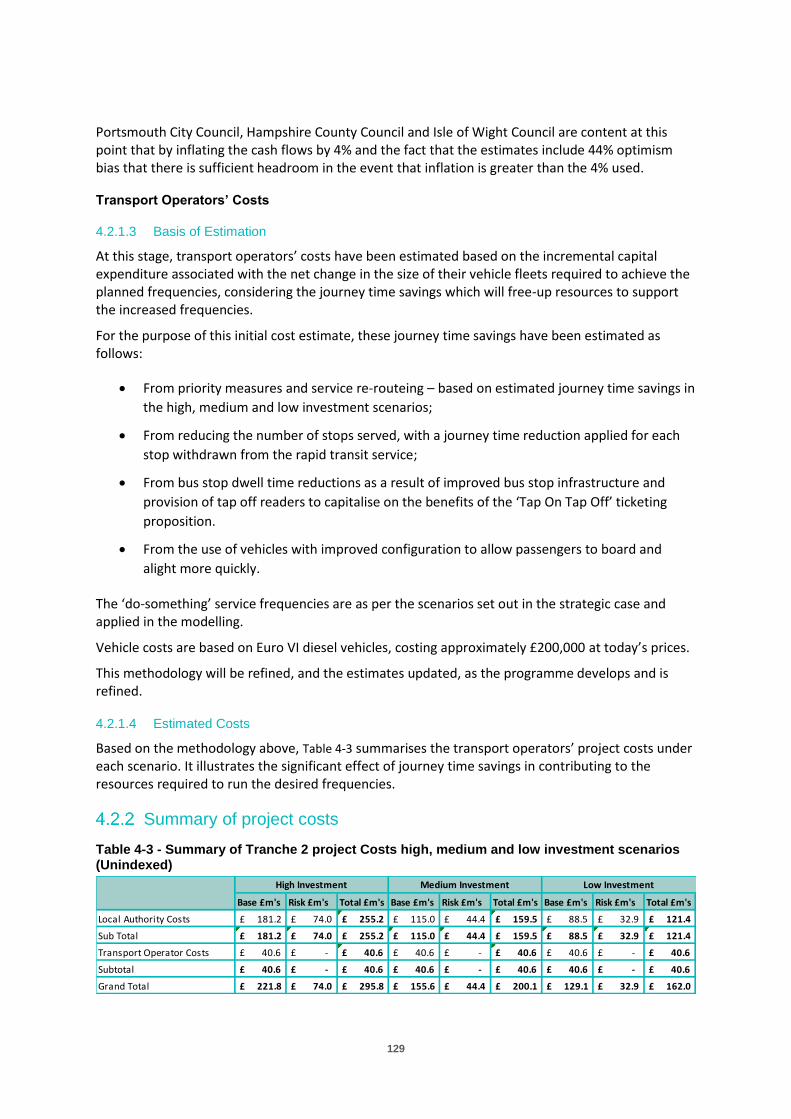
129
Portsmouth City Council, Hampshire County Council and Isle of Wight Council are content at this point that by inflating the cash flows by 4% and the fact that the estimates include 44% optimism bias that there is sufficient headroom in the event that inflation is greater than the 4% used.
Transport Operators’ Costs
4.2.1.3 Basis of Estimation
At this stage, transport operators’ costs have been estimated based on the incremental capital expenditure associated with the net change in the size of their vehicle fleets required to achieve the planned frequencies, considering the journey time savings which will free-up resources to support the increased frequencies.
For the purpose of this initial cost estimate, these journey time savings have been estimated as follows:
From priority measures and service re-routeing – based on estimated journey time savings in
the high, medium and low investment scenarios;
From reducing the number of stops served, with a journey time reduction applied for each
stop withdrawn from the rapid transit service;
From bus stop dwell time reductions as a result of improved bus stop infrastructure and
provision of tap off readers to capitalise on the benefits of the ‘Tap On Tap Off’ ticketing
proposition.
From the use of vehicles with improved configuration to allow passengers to board and
alight more quickly.
The ‘do-something’ service frequencies are as per the scenarios set out in the strategic case and applied in the modelling.
Vehicle costs are based on Euro VI diesel vehicles, costing approximately £200,000 at today’s prices.
This methodology will be refined, and the estimates updated, as the programme develops and is refined.
4.2.1.4 Estimated Costs
Based on the methodology above, Table 4-3 summarises the transport operators’ project costs under each scenario. It illustrates the significant effect of journey time savings in contributing to the resources required to run the desired frequencies.
Summary of project costs
Table 4-3 - Summary of Tranche 2 project Costs high, medium and low investment scenarios (Unindexed)
Base £m's Risk £m's Total £m's Base £m's Risk £m's Total £m's Base £m's Risk £m's Total £m's
Local Authority Costs £ 181.2 £ 74.0 £ 255.2 £ 115.0 £ 44.4 £ 159.5 £ 88.5 £ 32.9 £ 121.4
Sub Total £ 181.2 £ 74.0 £ 255.2 £ 115.0 £ 44.4 £ 159.5 £ 88.5 £ 32.9 £ 121.4
Transport Operator Costs £ 40.6 £ - £ 40.6 £ 40.6 £ - £ 40.6 £ 40.6 £ - £ 40.6
Subtotal £ 40.6 £ - £ 40.6 £ 40.6 £ - £ 40.6 £ 40.6 £ - £ 40.6
Grand Total £ 221.8 £ 74.0 £ 295.8 £ 155.6 £ 44.4 £ 200.1 £ 129.1 £ 32.9 £ 162.0
Low InvestmentHigh Investment Medium Investment
130
The table above shows the unindexed costs associated with each individual level of investment, including the amount of risk applied to each package of investment.
Project Cost Risks
The programme’s risk management strategy, covering both financial and other risks, is set out in the management case.
The nature of the programme, particularly the number of individual infrastructure schemes, means that cost risks can be spread across the programme and managed on a programme-wide basis.
Each of the infrastructure schemes holds its own operational risk register, based upon early identification of risks during the concept development stage. These risk registers will be managed over the lifetime of the project. The risk profiles from these are consolidated into a workstream-wide risk register, enabling a programme-wide assessment of risk to be undertaken.
At this stage of scheme development, each scheme has been given a costed risk/optimism bias value of 44% to enable a generalised value of risk to be generated. It is expected this value could fall as the programme progresses towards a more detailed level of design and greater level of certainty on each scheme.
The partner authorities have already started discussions about how costs underspends will be recycled and overspend will be dealt with between the authorities in a partnership manner. A Memorandum of Understanding is currently being drafted at the time of submission. It is accepted by all authorities that any underspends will first be used to meet any overspends on other schemes within the programme in consultation with the DfT and in line with the Grant Conditions.
4.3 Operation and Maintenance (O&M) Costs, and their Sustainability beyond the Fund period
O&M costs of highway infrastructure (including interchanges)
The incremental O&M costs of the highway infrastructure schemes to the regional authorities have been estimated as part of the scheme development. The exact additional net costs of O&M as a result of these schemes are not fully known at the time of submitting this bid due to the stage of design.
Estimates of how much the whole life costs may be considering operational maintenance and life cycle replacement over a 20-year period have been compiled.
Interchanges: The amount of additional O&M and lifecycle replacement for the interchanges is not deemed to be significant as there are already budgets available for the maintenance of the existing facilities and the schemes are updating these existing facilities as opposed to developing new ones.
Carriageway expansion: Most of the Infrastructure measures sit within the current highway network with the major exception of the Eclipse bus way that will add an additional 2km of carriageway. The O&M costs have been calculated using local rates at 2019 prices and then indexed over a period of 20 years, taking account of life cycle replacement (LCR) over this period.
Traffic Signals: The additional signals apparatus does generate an additional cost to the partner authorities. These costs have been calculated using local rates and then applying a suitable LCR factor for this type of apparatus.
Table 4-4 below sets out the whole life costs of the interventions.

131
Table 4-4 - Whole life costs of interventions
Funding for O&M
The table above shows that annual maintenance costs for these projects are likely to be in the region of £97,000 to £413,000 per annum across the three authorities, which doesn't represent a huge increase in relation to their respective maintenance budgets.
Portsmouth and the Isle of Wight Councils will need to enter into negotiations with their respective Highways PFI Contractors to undertake these additional maintenance costs. The measures detailed in this bid are unlikely to increase the overall extent of the project network and there it is not anticipated that the ongoing costs will be material.
Hampshire County Council still maintains its own network through commissioning works with its own framework of suppliers, and again the overall effect of these measures is unlikely to lead to a significant net increase ongoing maintenance of the network and therefore any additional cost will be met from its existing resources.
Rapid transit and Bus Operators’ O&M Costs
Bus operator costs have been considered in the economic case. However, in the financial case it is assumed that there are no additional costs on the basis that the operators have all stated that the services that require investment will all run on commercial terms and will not require any local authority subsidy. Analysis of forecast operating efficiencies plus revenues against additional operating costs for the level of service enhancement proposed has confirmed this should be the case. Therefore, for the financial case this has no financial impact on the Department for Transport or the partner authorities.
Other O&M costs
The O&M costs of non-infrastructure interventions, where not negligible, will be estimated as part of further scheme development and a funding source will be identified at the time.
4.4 Other elements of whole-life cost
In addition to the O&M costs already described, some interventions may require capital refurbishment or renewal within the appraisal period covered by the economic case. This section therefore sets out their anticipated refurbishment and renewal cycles.
4.5 Funding Profile
Table 4-5 summarises, for each investment scenario, the scheme costs, broken down by TCF contribution, total public sector contribution and other local/private contribution.
Low
Low + Medium
Low + Medium + Hign
Average Annual
£ 1,935.00
£ 3,602.00
£ 8,269.00
£000’s £'000s
£ 97.00
£ 180.00
£ 413.00
Whole Life

132
Table 4-5 – Summary Tranche 2 funding Split - high medium and low investment scenarios
More detailed year-by-year cost breakdowns, showing each programme element, are provided in Table 4-6 (high investment scenario), Table 4-7 (medium investment scenario) and Table 4-8 (low investment scenario).
Table 4-6 – Cost breakdown and Profile: High Investment scenario
£m’s % £m’s % £m’s %
Total Scheme Costs £ 321.96 100% £ 217.54 100% £176.01 100%
TCF Contribution £262.22 81% £162.83 75% £122.57 70%
Total public sector contribution £17.67 5% £12.63 6% £11.35 6%
Other local/private sector contribution £42.08 13% £42.08 19% £42.08 24%
High Investment
Scenario
Medium Investment
Scenario
Low Investment
Scenario
2019/20 2020/21 2021/22 2022/23 Total
£’m £’m £’m £’m £’m
DfT Capital 4.3 49.9 101.1 107.0 262.2
Local Contribution 0.1 5.6 9.4 2.6 17.7
Private Contribution 0.0 5.2 21.1 15.8 42.1
Total Tranche 2 4.4 60.7 131.5 125.4 322.0
Tranche 1 component (Already Funded)
DfT Capital 4.0 0.0 0.0 0.0 4.0
Local Contribution 0.4 0.0 0.0 0.0 0.4
Private Contribution 0.0 0.0 0.0 0.0 0.0
Total Tranche 1 4.4 0.0 0.0 0.0 4.4
Total Capital 8.8 60.7 131.5 125.4 326.4
Total DfT Funding requested 8.3 49.9 101.1 107.0 266.2
Total; private/local contribution 0.5 10.8 30.5 18.4 60.1
Total 8.8 60.7 131.5 125.4 326.4
TOTALS

133
Table 4-7 – Cost breakdown and Profile: Medium Investment scenario
Table 4-8 – Cost breakdown and Profile: Low Investment scenario
4.6 Acceptance of financial responsibility for the project, going forward
Portsmouth City Council, as lead authority, accepts financial responsibility for the project going forward. Portsmouth City Council will enter into an agreement with Hampshire County Council and the Isle of Wight Council that delegates the responsibility for estimating and controlling project costs under their control. It is accepted that the DfT will not consider any requests for increased funding.
2019/20 2020/21 2021/22 2022/23 Total
£’m £’m £’m £’m £’m
DfT Capital 3.5 30.4 67.9 61.1 162.8
Local Contribution 0.1 3.8 7.3 1.5 12.6
Private Contribution 0.0 5.2 21.1 15.8 42.1
Total Tranche 2 3.6 39.4 96.2 78.4 217.5
Tranche 1 component (Already Funded)
DfT Capital 4.0 0.0 0.0 0.0 4.0
Local Contribution 0.4 0.0 0.0 0.0 0.4
Private Contribution 0.0 0.0 0.0 0.0 0.0
Total Tranche 1 4.4 0.0 0.0 0.0 4.4
Total Capital 8.0 39.4 96.2 78.4 221.9
Total DfT Funding requested 7.5 30.4 67.9 61.1 166.8
Total; private/local contribution 0.5 9.0 28.4 17.3 55.1
Total 8.0 39.4 96.2 78.4 221.9
TOTALS
2019/20 2020/21 2021/22 2022/23 Total
£’m £’m £’m £’m £’m
DfT Capital 2.5 27.4 47.3 45.4 122.6
Local Contribution 0.1 3.1 6.6 1.6 11.4
Private Contribution 0.0 5.2 21.1 15.8 42.1
Total Tranche 2 2.6 35.6 75.0 62.8 176.0
Tranche 1 component (Already Funded)
DfT Capital 4.0 0.0 0.0 0.0 4.0
Local Contribution 0.4 0.0 0.0 0.0 0.4
Private Contribution 0.0 0.0 0.0 0.0 0.0
Total Tranche 1 4.4 0.0 0.0 0.0 4.4
Total Capital 7.0 35.6 75.0 62.8 180.4
Total DfT Funding requested 6.5 27.4 47.3 45.4 126.6
Total; private/local contribution 0.5 8.3 27.7 17.3 53.8
Total 7.0 35.6 75.0 62.8 180.4
TOTALS

134
Financial protocols will be in place between Portsmouth City Council and the other partner authorities (Hampshire County Council and Isle of Wight Council) to implement this lead role and flow-down the financial requirements subject to confirmation from the DfT of the Grant Conditions that will be applied to Portsmouth City Council as Accountable Body.
4.7 Source of local contributions Table 4-9 – Sources of Local Contributions
4.8 How Funding has been secured
Table 4-9 sets out the level of local contributions that the three authorities have been able to identify at the SOBC Stage. Only those local contributions where the authorities have a good degree of certainty or approval have been included within the funding package. Written confirmation form private sector partners has been received and is included in Appendix 4 – Financial case.
The authorities have also only included contributions whereby it can be proved that there is an additionality link in the funding sought from the Department for Transport.
The focus of the bid has been on a coherent transport strategy that aims to improve the entire journey experience of the user; as a consequence the focus has been on the high investment package.
The tables above show that as the level of DfT funding decreases the amount that the partner authorities can leverage from the private sector falls and therefore the authorities recommendation is that priority is given to the high investment package when the DfT is considering the appropriate level of investment.
All local authority contributions are already included within the respective authorities' approved Capital Programmes, details of which are included in Appendix 4 – Financial case
High Investment
(£m’s)
Medium Investment
(£m’s)
Low Investment
(£m’s)
Capital Contribution PCC 8.5 8.5 8.5
Capital Contribution HCC 9.3 4.2 3.0
Capital Contribution IOW 0.1 0.1 0.1
TOTAL LOCAL PUBLIC SECTOR CONTRIBUTIONS 17.9 12.8 11.6
South West Trains 0.3 0.3 0.3
Hovertravel 0.6 0.6 0.6
Network Rail 25.0 25.0 25.0
Wightlink 0.3 0.3 0.3
Southern Vectis 3.9 3.9 3.9
First Bus 8.5 8.5 8.5
Stagecoach 3.5 3.5 3.5
TOTAL OTHER LOCAL / PRIVATE SECTOR
CONTRIBUTIONS42.1 42.1 42.1
Total Local Contributions 59.9 54.9 53.6
LOCAL PUBLIC SECTOR CONTRIBUTIONS
OTHER LOCAL / PRIVATE SECTOR CONTRIBUTIONS

135
4.9 S151 Officer confirmation
Portsmouth City Council will act as accountable body from any award of funds through the Transforming Cities Fund bid. The Section 151 Officer for Portsmouth City Council is Chris Ward who is also the Section 151 Officer for the Isle of Wight Council. The S151 officer for Hampshire County Council has been appraised for the bid. Sign off from Hampshire County Council is not required for the submission of this bid but a letter of support can be provided if required.
S151 Officer Approval confirmation is detailed in Appendix 4 – Financial case and the cover sheet.

136
In addition, we have in-house professional procurement support and in-house commercial legal support.
The procurement process will take account of any additional grant award conditions required by the DfT as well as any lead in times for local governance processes.

137
5. Management Case
5.1 Introduction
The management case puts in place the arrangements, mechanisms and processes for the successful delivery of the South East Hampshire Rapid Transit (SEHRT) programme.
Paragraph 5.1.1 confirms the programme management processes and structure for this case.
Throughout this case the Association for Project Management (APM), PRojects IN Controlled Environments (PRINCE) 2 and Managing Successful Programmes (MSP) methodologies will be utilised where appropriate to ensure the successful management and delivery of the programme.
The programme manager and the programme management office (PMO) will oversee and deliver these programme principles and methodologies. Section 5.8 provides more information on the programme organisation, roles and functions.
A critical point to highlight is that although the local authorities and transport operators will
individually deliver their respective projects, all will work collaboratively in terms of structure,
governance and reporting. Collaboration and partnership are key elements of this bid and the
management case illustrates how the responsible organisations will work together to successfully
deliver their respective schemes.
5.2 Structure of the management case
The structure of this management case is as follows:
Governance and assurance:
Governance (section 5.2)
Programme assurance and Local Assurance Framework (section 5.3)
Delivery and timetable:
Delivery plan and dependencies (section 5.4)
Timetable (section 5.5)
Partners’ delivery track-record on previous similar projects (section 5.6)
Programme organisation:
Programme organisation (section 5.7)
Programme methodologies and processes:
Communications and stakeholder management (section 5.8)
Risk management strategy (section 5.9)
Change management (section 5.10)
Local authorities’ lessons-learnt approach (section 5.11)
Benefits realisation strategy, framework and outline plans (section 5.12)
Monitoring and Evaluation Plan (MEP) (section 5.13)
Programme closure (section 5.14)

138
5.3 Governance
The SEHRT network is being developed and delivered through a partnership between the local highway authorities and transport operators. The Transforming Cities Fund (TCF) presents a funding opportunity for the delivery of the next phases of the SEHRT vision.
Why deliver in partnership?
When planning how to travel from A to B, travel transcends local administrative boundaries. The SEHRT vision is to deliver a high-quality multimodal travel system connecting communities, spread prosperity and drive up the productivity of local businesses across the Portsmouth city region. This necessitates working across administrative boundaries to create a seamless experience. To ensure the successful delivery and operation of the SEHRT system, the partnership of local authorities and transport operators are responsible for the following elements and functions:
SEHRT vision and overall strategy
future network planning and development
communications and stakeholder engagement
branding and marketing
bidding and funding
monitoring and evaluation
How is SEHRT being delivered?
The partnership combines experts in the range of areas needed to deliver this ambitious programme. All partners have a strong track record of delivery in their respective areas of expertise. Therefore, infrastructure will be delivered by the local highway authorities or other delivery partners, within their own areas. The operators will deliver rapid transit services to operate on the improved infrastructure and the local authorities will deliver supporting complementary measures.
While work is continually undertaken to help develop the SEHRT programme further, its dynamic nature of means that a larger development team can be assembled quickly should a funding opportunity, such as the TCF, become available. This aligns with the suggested recommendations for the delivery of major infrastructure projects as outlined in the ‘Lessons from Transport’ document25.
Governance structure
The governance structure of the SEHRT programme is clearly set out below and in Appendix 5.1, with different responsibilities held at both the SEHRT and local authority/transport operator levels. The programme acknowledges and respects that individual organisations will have their own reporting arrangements. However, the programme manager will ensure that there is rigour and robustness in assurance to ensure successful delivery.
25 Insert reference to Gov document
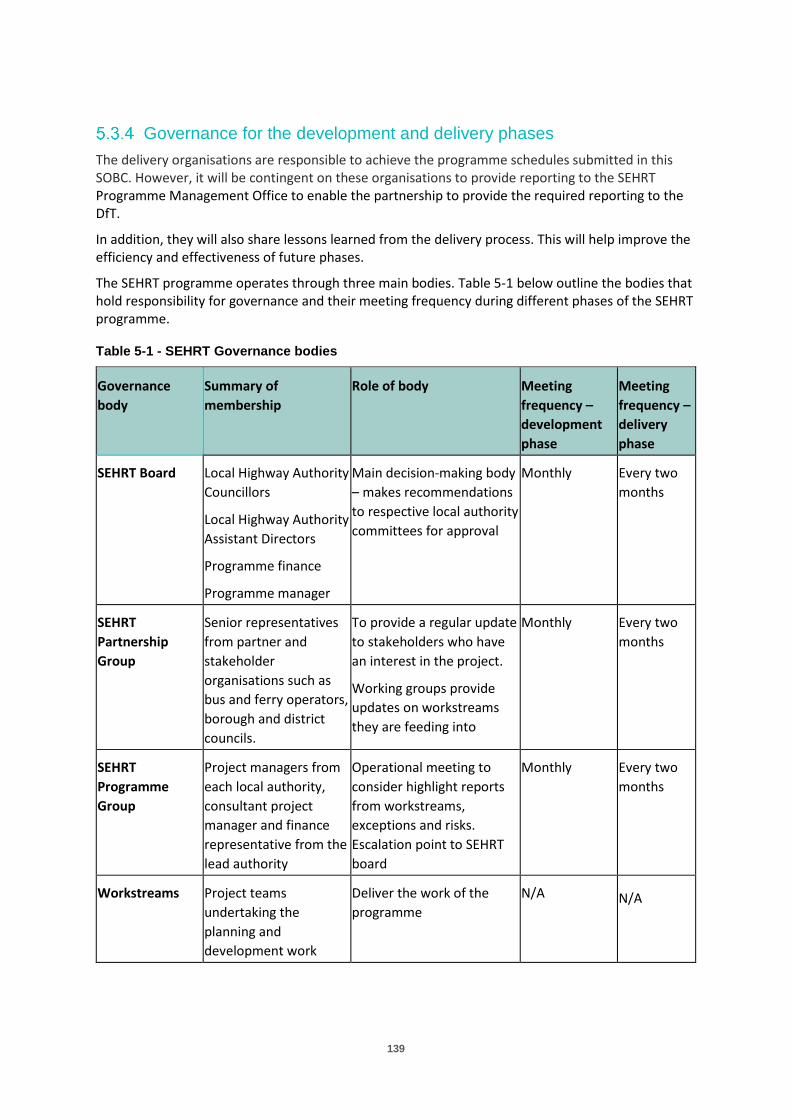
139
Governance for the development and delivery phases
The delivery organisations are responsible to achieve the programme schedules submitted in this SOBC. However, it will be contingent on these organisations to provide reporting to the SEHRT Programme Management Office to enable the partnership to provide the required reporting to the DfT.
In addition, they will also share lessons learned from the delivery process. This will help improve the efficiency and effectiveness of future phases.
The SEHRT programme operates through three main bodies. Table 5-1 below outline the bodies that hold responsibility for governance and their meeting frequency during different phases of the SEHRT programme.
Table 5-1 - SEHRT Governance bodies
Governance
body
Summary of
membership
Role of body Meeting
frequency –
development
phase
Meeting
frequency –
delivery
phase
SEHRT Board Local Highway Authority
Councillors
Local Highway Authority
Assistant Directors
Programme finance
Programme manager
Main decision-making body
– makes recommendations
to respective local authority
committees for approval
Monthly Every two
months
SEHRT
Partnership
Group
Senior representatives
from partner and
stakeholder
organisations such as
bus and ferry operators,
borough and district
councils.
To provide a regular update
to stakeholders who have
an interest in the project.
Working groups provide
updates on workstreams
they are feeding into
Monthly Every two
months
SEHRT
Programme
Group
Project managers from
each local authority,
consultant project
manager and finance
representative from the
lead authority
Operational meeting to
consider highlight reports
from workstreams,
exceptions and risks.
Escalation point to SEHRT
board
Monthly Every two
months
Workstreams Project teams
undertaking the
planning and
development work
Deliver the work of the
programme
N/A N/A

140
The governance hierarchy for the SEHRT programme is outlined in Appendix 5.1 demonstrating how each of these components interact with each other. Section 5.2.6 below outlines the governance structures for each authority and where they interface with the SEHRT hierarchy.
Local authority delivery governance
Each local highway authority has responsibility for delivering new infrastructure for its local area. The sections outline below what governance arrangements each authority will use to deliver its SEHRT programme.
Appendix 5.2 has details of the three councils' governance arrangements.
5.4 Programme assurance and Local Assurance Framework
Assurance is critical to the successful delivery of any programme. This programme will sign up to P3 assurance which is the process of providing confidence to stakeholders that projects, programmes and portfolios will achieve their scope, time, cost and quality objectives, and realise their benefits.
It will follow the APM assurance model. This will be the responsibility of the programme manager and the Programme Management Office (PMO).
The three lines of defence APM model will be adopted across the programme to provide robust integrated assurance. The three lines of defence:
First line of defence: consists of the internal business owners within a programme whose
role is to ensure assurance is undertaken effectively across the programme and intervene
where required. This function is overseen by the programme manager.
Second line of defence: comprises assurance by groups outside of the programme but
within the organisation. For example, compliance functions, legal and enterprise risk
management) which are responsible for establishing policies and procedures and serving as
the management oversight over the first line.
Third line of defence: comprises independent, external assurance providers. These groups
report independently to the programme Board and include functions such as internal audit,
external auditors, or an external organisation that come in to independently assess the way
the programme is being organised and run. The Scrutiny and Evaluation Panel will provide
independent advice on the programme schemes. More detail is provided in the Local
Assurance Framework see Appendix 5.3.
The Local Assurance Framework used for this programme will provide:
Local assurance by the SEHRT project team through the sifting and prioritisation process in
developing the SOBC.
Independent scrutiny and due diligence by each local highway authority in entering a legal
agreement to ensure that funding is allocated in accordance with the priorities set out in the
SOBC, as endorsed or modified by the Department for Transport.
External scrutiny of the process of prioritisation and development of the SEHRT proposals.
Local assurance will be undertaken at programme level based upon geographical location (corridors
or nodes) or type (bus priority measures, ‘at stop’ or ‘to stop’ infrastructure).

141
The following joint working protocol has been developed by the local highway authorities as the
basis for collaborative working and formal legal arrangements:
SEHRT is a public mass transport network proposition that has been developed jointly by
Portsmouth City Council, Hampshire County Council and Isle of Wight Council, in partnership with
bus and other local public transport operators
The network serves the main built -up areas comprising all the City of Portsmouth and Boroughs
of Fareham, Gosport and Havant, together with parts of the Isle of Wight
Portsmouth City Council, Hampshire County Council and Isle of Wight Council are the local
highway authorities for their respective parts of the area and have jointly agreed to collaborate
to develop the SEHRT proposition and to bid for funding from the Department of Transport,
Transforming Cities Fund opportunity
The aims of the proposals are to improve the productivity of the area by improving accessibility
and connectivity through infrastructure measures to increase use of public transport and
promote walking and cycling
Joint informal governance arrangements have been agreed between Portsmouth City Council,
Hampshire County Council and Isle of Wight Council to enable proposals to be developed across
the area and to prepare a joint bid to the DfT, cumulating in a Strategic Outline Business Case
submission
The DfT has designated Portsmouth City Council as the Accountable Body to receive funding
allocated from the Transforming Cities Fund and has requested that proposals for a Local
Assurance Framework be included in the SOBC
A Local Assurance Framework will set out how funding received from the DfT by the Accountable
Body will be allocated to proposals contained within the bid that represent Value for Money as
assessed and jointly agreed by the bidding authorities in the SOBC and approved by the DfT in
deciding the funding allocation
All three local authorities agree to maintain their commitment to the joint informal governance
arrangements to provide coordination and oversight during the period when they implement the
proposals in each of their respective areas. They will jointly monitor and evaluate the impacts of
the proposals implemented; and further collaborate to identify and pursue future funding
opportunities that may arise from time to time
A legal agreement has been prepared by the local highway authorities. This formalises the arrangements above. The local assurance framework uses the criteria provided by the Department for Transport in Transforming Cities Fund Supplementary Guidance for Shortlisted City Regions: Tranche 2, Moving Britain Ahead (January 2019) and is provided in Appendix 5.3.
5.5 Delivery plan and dependencies
As described in the governance section above, the respective highway authorities will be responsible for delivering infrastructure within their jurisdictions and the operators will be responsible for the commitments outlined in their letters of commitment/support - see Appendix 5.12. Each organisation has undertaken comprehensive delivery planning to ensure that it is in the best possible position to deliver effectively and within the required timescales of the TCF.

142
Delivery arrangements are that each intervention will be delivered by the local authority in whose area it sits.
In the event that cross boundary working is required then this will be covered through the SEHRT governance arrangements and formalised under legal agreements as required under the relevant highway legislation.
Appendix 5.4 provides an outline representation of a proposed delivery schedule. The current programme aims to deliver the highest priority schemes earlier in the programme to ensure that benefits begin to be realised as early as possible during the funding period. A significant amount of detailed design has been undertaken to ensure that schemes are ready to be implemented once funds have been received. Work packages have been developed and refined to produce a more detailed delivery plan.
Portsmouth City Council (PCC)
Portsmouth City Council will be delivering a number of schemes that sit within the proposed Charging Clean Air Zone with the Air Quality Local Plan submitted to JAQU in October 2019. Two of these schemes ‘City Centre North Link’ – Ref 22 and ‘Alfred Road/ Queen Street’ – Ref 23, sit adjacent to Interceptor ID 546 and 573 respectively. In order to minimise the potential negative impact of the construction of these TCF schemes on the air quality at these locations, PCC will optimise the delivery of these two schemes. Action taking to do this will include:
5. Fast-tracking the programme to ensure all construction likely to cause delay on the highway to be completed before September 2021. These schemes are part of the quick win package
Undertake night time works wherever possible to reduce the amount of working undertaken at
peak times.
Contractors will be required to use sustainable building methods, and where operating within
the CAZ will liable to pay the charge for any non-compliant vehicles they use.
Hampshire County Council (HCC)
Hampshire County Council has divided their schemes into a series of packages to ensure timely and effective delivery. A more detailed breakdown of each geographic package, its constraints, benefits and delivery phase can be viewed in Appendix 5.5 the SEHRT schemes workbook. The geographic packages are also broken down into the Low, Medium and High scenarios within the workbook. Further detail on the timetable can be seen in section 5.5 below. The overall programme of the Hampshire County Council schemes can be seen at Appendix 5.4.
Isle of Wight Council (IOW)
Isle of Wight Council’s schemes will be delivered in a single package – the Ryde Transport Hub. The overall scheme is a partnership of a number of different organisations delivering their own components of the project.
The Isle of Wight Transport and Infrastructure Board will be responsible for assisting the delivery partners in phasing their work to minimise disruption and ensure that the projects are delivered in the most efficient and effective manner. The board will monitor progress and manage all change, to its delegated authority level. The board will also be responsible for reporting progress and spend to the SEHRT programme group and board.

143
The process for managing projects and programmes is outlined in the Isle of Wight Council Programme and Project Management Policy. The policy describes the approach that all council projects will adopt. It includes the collation of lessons learnt for incorporation into future schemes.
First Group Ltd
First Group's decision making and governance arrangements are included in Appendix 5.2
Stagecoach Ltd
Stagecoach South is one of 17 operating companies of Stagecoach Group Plc. Whilst there is much autonomy delegated to the local OpCos, investment proposals requiring significant CapEx and OpEx investment require Group Board approval. As part of the TCF bid, Stagecoach are considering the introduction of a new, direct route from Leigh Park to Portsea Island.
The Stagecoach decision making process is as follows:
1. Assess the potential market of new direct 'rapid transit' routes connecting Leigh Park and
Portsmouth City Centre.
2. Identify current delay hot-spots and potential junction/roadway interventions necessary to
improve journey speeds and consistency.
3. Co-develop detail of the required roadway/junction interventions in collaboration with PCC
and HCC and in principle ensure that the planned capital works will deliver the required time
savings and journey time consistency.
4. Quantify and cost other features such as vehicle specification and ticketing system to develop
a comprehensive service package.
5. Draw up plans of new routes that could serve the potential market and compile detailed cost
breakdown to identify both CapEx and OpEx costs. Quantify the potential savings from
remodelling existing bus routes both in frequency and journey time savings accruing from
proposed capital works.
6. Test and validate assumptions on journey time, route, vehicle and ticketing systems through
close dialogue with PCC/HCC officers/consultants together with internal colleagues
specialising in similar projects and developments. Results from the modelling undertaken by
PCC/HCC is a key part of such validation.
7. Prepare Internal Business Case paper and engage with UK Bus Commercial Finance Director to
validate assumptions and financial calculations.
8. Submit Business Case and narrative to Group Board to seek authority for the CapEx and OpEx.
9. Assuming authority is given, communicate with PCC/HCC and confirm the outline
commitments Stagecoach will give as part of the TCF bid.
Procurement is covered in the commercial case (section 3.4).
5.6 Timetable The timetable in Appendix 5.4 below provides a high level programme of delivery for each of the packages being delivered under the TCF programme. The key output milestones are highlighted on

144
this timetable, including milestones for completion of infrastructure packages, and introduction of new/revised services.
Potential for early delivery
Three schemes could potentially be delivered early (by quarter 2 2020/21):
5. City centre north link
6. Lake Road corridor
7. Queens Street/Alfred Road
For ease of reference:
Figure 5-5 - City centre north link
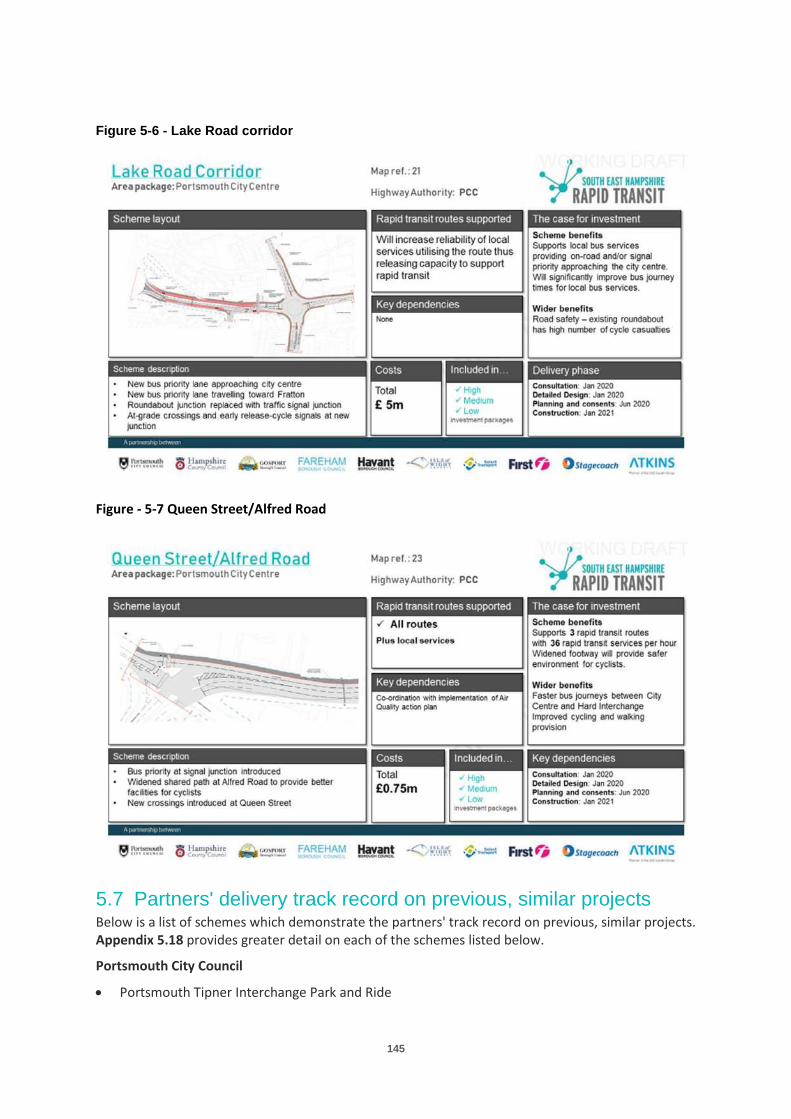
145
Figure 5-6 - Lake Road corridor
Figure - 5-7 Queen Street/Alfred Road
5.7 Partners' delivery track record on previous, similar projects Below is a list of schemes which demonstrate the partners' track record on previous, similar projects. Appendix 5.18 provides greater detail on each of the schemes listed below.
Portsmouth City Council
Portsmouth Tipner Interchange Park and Ride

146
The Hard Interchange
Dunsbury Hill Park link road
Local sustainable transport fund
Northern Road bridge
Hampshire County Council
Eclipse Busway Phase 1a
A27 Improvements and A27 Gudge Heath Lane
Whitehill and Bordon Relief Road
Newgate Lane Corridor enhancements
Isle of Wight Council
ASDA roundabout
5.8 Programme organisation
Introduction
To support the effective delivery of the programme, key roles will be appointed and a programme support function maintained throughout the SEHRT programme. The programme support function will be funded by the SEHRT partners without recourse to TCF funds.
Senior Responsible Owner (SRO)
The Senior Responsible Officer (SRO) for the Programme is Pam Turton, Assistant Director, Transport, Portsmouth City Council. The SRO was formally appointed by the SEHRT Board on 7 June 2019. The responsibilities are set out in a letter of appointment, which are consistent with the Infrastructure and Projects Authority guidance (see Appendix 5.7).
Programme manager
A programme manager will be appointed and responsible for leading and managing the setting up of the programme through to the delivery of new capabilities, realisation of benefits and programme closure.
They will have overall responsibility for reporting programme progress to the SEHRT board, assisting delivery organisations to ensure they are meeting their respective deadlines. They will also be responsible for providing the regular reporting required to the DfT as required.
The programme manager has primary responsibility for successful delivery and establishing robust governance. The responsibilities of this person largely follows those in section 4.8 of MSP.
Communications and stakeholder engagement officer
To undertake marketing and communications activities to build awareness of the SEHRT programme and help drive increases in patronage as new services are introduced.

147
Monitoring and evaluation officer
To ensure that the monitoring and evaluation plan and associated metrics are being collected and reported to both ensure that SEHRT can meet its commitments to the DfT and that appropriate information compiled to help inform future phases of development of SEHRT.
Programme management office (PMO)
The PMO, based at the PCC, will be managed by the programme manager and provide full support to the SRO and to the overall programme. The PMO is the nerve centre and information hub of the programme. All information, communication, monitoring and control functions for the programme will be coordinated through the PMO. The resources in the PMO will be: one monitoring and evaluation officer also covering benefits; one stakeholder and engagement officer; two project support officers who will cover risks and issues and change control. The Programme manager will oversee assurance.
Project manager
There will be a number of project managers appointed responsible for the successful delivery of the programme schemes.
Figure 5-7 Programme organisation
5.9 Communications and stakeholder management
Stakeholder management
A stakeholder management plan (see Appendix 5.8) has been created to ensure all key stakeholders are properly informed of the scheme, and the progress of the bid, to ensure their support and to highlight any concerns at the earliest opportunity. The plan sets out how stakeholders will be engaged and managed, what outputs are required or expected from the engagement that takes place, and the channels and methods through which engagement will be conducted.

148
Using a stakeholder mapping tool (see Appendix 5.9), stakeholders have been categorised into four tiers, depending on their level of interest and influence.
The focus so far has been on strengthening relationships with tier one and two stakeholders. As the scheme progresses, we expect that some larger businesses with higher levels of interest and influence, such as the QA Hospital and Gunwharf Quays, will move up to become tier two stakeholders. A Business Interface Group will be created as part of the consultation process and to ensure consideration is made towards such businesses, and their customers, and an open and transparent dialogued is achieved.
Once funding has been announced, and schemes confirmed all statutory stakeholders will be engaged ahead of any formal consultation. This will allow for any concerns to be addressed to minimise negative responses during the consultation process. A communications and engagement plan for the construction phase will be developed and will include pre-construction consultation and further engagement activities.
Ahead of scheme delivery, a tracker tool will be created to support the stakeholder management plan. This will record all engagement throughout the project, together with key issues arising and actions taken as a result (to inform design, for instance). It will also record external queries and any actions taken as a result. It will be regularly reviewed by the project team and maintained throughout the project lifecycle. This will ensure an overview of all engagement is maintained and issues are resolved in a timely manner.
Stakeholder engagement
Several early engagement events have taken place. To date these are:
Portsmouth City Council B2B Networking Event (20 June 2019)
Gosport Eclipse public information event (2 July)
Ryde Regeneration Group (12 August)
Tipner West Regeneration Industry Day (for contractors, investors and suppliers) (18
September)
Friends of Old Portsmouth Association (20 November)
City region councillor briefing (25 March 2019)
MP briefing (7 June 2019)
Portsmouth City Council councillor briefing (15 October 2019)
Isle of Wight Council councillor briefing (15 October 2019)
Hampshire County Council and Borough Council councillor briefing (1 November 2019)
Information resources about South East Hampshire Rapid Transit have been created to support tier one and two stakeholder events and raise awareness of the scheme. These include:
Brochure (Appendix 5.10)
Website (visit www.sehrt.org.uk)
Twitter profile (visit www.twitter.com/rapid_southeast)
Information film (visit https://vimeo.com/374108460/d1fa964025)

149
Customer insights
Market research was conducted by Hampshire County Council's Insights Team to investigate the public appetite for a rapid transit system, and attitudes towards behaviour change. Market research is planned throughout the delivery of the programme. Responses from this initial online survey will help shape the service and will inform marketing and communications plans going forward.
The online survey was held in September and October to understand:
If respondents felt that a rapid transit system was suitable for their area
Factors that influence whether they do, or would, travel by bus
How easy or difficult it is, or would be, to use public transport
The ways that bus users pay, and would want to pay, for bus travel
Respondents were also asked about their current travel habits. There were 3,277 responses to the survey (exceeding the target of 1000), including 7,885 free text comments. Top level findings include:
Overall 77% of respondents find the concept of a rapid transit system for their local area
appealing
The most common reason for supporting a rapid transit scheme was the reduction in
journey times
The three most important factors when choosing a mode of travel were: convenience, cost
and journey time
Private vehicle users are more likely to use buses if it is cheaper to travel by bus, there is an
environmental benefit, journey times are reduced, or if services are more direct
When asked how people would like to pay for bus travel, 90% of respondents' first
preference was for a system other than cash payment per journey
There were over 1,800 comments given to explain why respondents felt using public transport was difficult, and these have been shared with the Rapid Transit Development Manager for further exploration. Themes include routes, frequency, journey time and cost.
The headline report can be found in Appendix 5.11
The survey was promoted by Portsmouth City Council, Hampshire County Council (and boroughs) and Isle of Wight Council using a variety of digital channels including social media and email marketing to council distribution lists.
A creative visual was developed by Hampshire County Council using SEHRT branding, which was extremely effective in encouraging participation. To view the creative click here: https://vimeo.com/360519293
Members of the partnership group and My Journey also supported the survey by promotion via their own channels. This exercise successfully demonstrates effective partnership working between the local authorities and operators.
Community panel
The public survey provided an opportunity to recruit residents to an online community panel. 840 people signed up to join the panel, which will be used in the future to help design public transport

150
services. Panel members will be invited to take part in surveys, focus groups and other research activities to inform SEHRT-related projects in the area.
Market research was conducted to support the Portsmouth RTI scheme (Tranche 1). Members of the panel who live in Portsmouth were contacted and asked to participate in the RTI survey, demonstrating how the panel will be used for future schemes.
Statements of support
Appendix 5.12 contains letters of support from a variety of stakeholders. Notable letters include those from both the Chief Operating Officer of Stagecoach UK Bus and the Managing Director of First Bus UK as the two major bus operators, major employers such as the University of Portsmouth and QA Hospital, further education providers such as Havant and Southdowns College, Isle of Wight College and Portsmouth College, and members of the SEHRT partnership group.
Due to purdah restrictions, we were unable to approach local MPs and therefore have included their letters of support provided at EOI stage. Likewise, we have replaced letters of support from council leaders with support from Local Authority Chief Executive Officers.
Communications
A communications and engagement plan has been developed with Portsmouth City Council, Hampshire County Council and Isle of Wight Council. The plan aims to keep communities, people and key stakeholders at the heart of our plans as the project progresses. The overarching objective of the plan is to raise the profile of the rapid transit programme and increase understanding of how rapid transit will work in, and benefit, the region. Based on the programme vision, a number of key messages have been agreed. The level of communications and engagement will vary throughout scheme delivery, and the plan will evolve as the scheme progresses and develops. Initially the focus will be on transport stakeholders and those organisations directly involved with the development of the scheme.
The communications plan is a fluid document, and will respond to landmark achievements as the scheme develops. The plan will be supplemented by separate activity plans for different phases of work. Activity plans include:
stakeholder management plan (roles and responsibilities between SEHRT and key stakeholders Appendix 5.8)
brand identity (Appendix 5.14)
communications plans for Tranche 1 schemes (see Appendix 5.15 for the RTI communications plan as an example)
communications and engagement plan for construction period (includes pre-construction consultation and engagement events)
consultation programmes (Tranche 2 schemes)
marketing plan (for the launch and promotion, once funding has been confirmed)
consultation for Tranche 2 schemes

151
5.10 Risk management strategy
Introduction
The process of identifying, assessing, responding to, monitoring, controlling and reporting risks is summarised in this section.
Risk identification is the responsibility of everyone working on the programme. The project managers will be responsible for identifying impact and interdependencies of risks to their individual projects and for reporting risks to the Programme Board.
All risks will be logged onto a project register. Key risks will be allocated an owner. The risk owner will be responsible for assessing, in more detail, the range of possible outcomes, defining the level of risk, contingency planning, monitoring, controlling and updating the status of the risk throughout the local plan development.
Key risks will be reported up to the programme manager and the SRO. New or updated risks across the range of projects being delivered will be discussed and challenged by the PMO before reporting issues and exceptions to the Programme Board.
The programme risk register (see Appendix 5.16) and delivery risk registers are at Appendix 5.6. The registers covers both programme-type risks and deliverability risks for infrastructure schemes.
Risk management process
Risk management is a key process underpinning good scheme governance and achievement of scheme objectives in a cost-effective manner. Accordingly, an appropriate framework (comprising managing, reporting, process and responsibilities) has been implemented as part of scheme management arrangements as set out below.
In the context of the schemes, risk has been defined as the potential for future events which have a negative impact on the achievement of scheme objectives. Events which provide a potential opportunity to impact positively on objectives have not been addressed. It should be noted also that risks relating to the operational management of the scheme have been excluded although technical performance risks shall be addressed through compliance with appropriate design standards and codes of practice.
The risk management approach adopts the following four primary processes as shown in the diagram below.
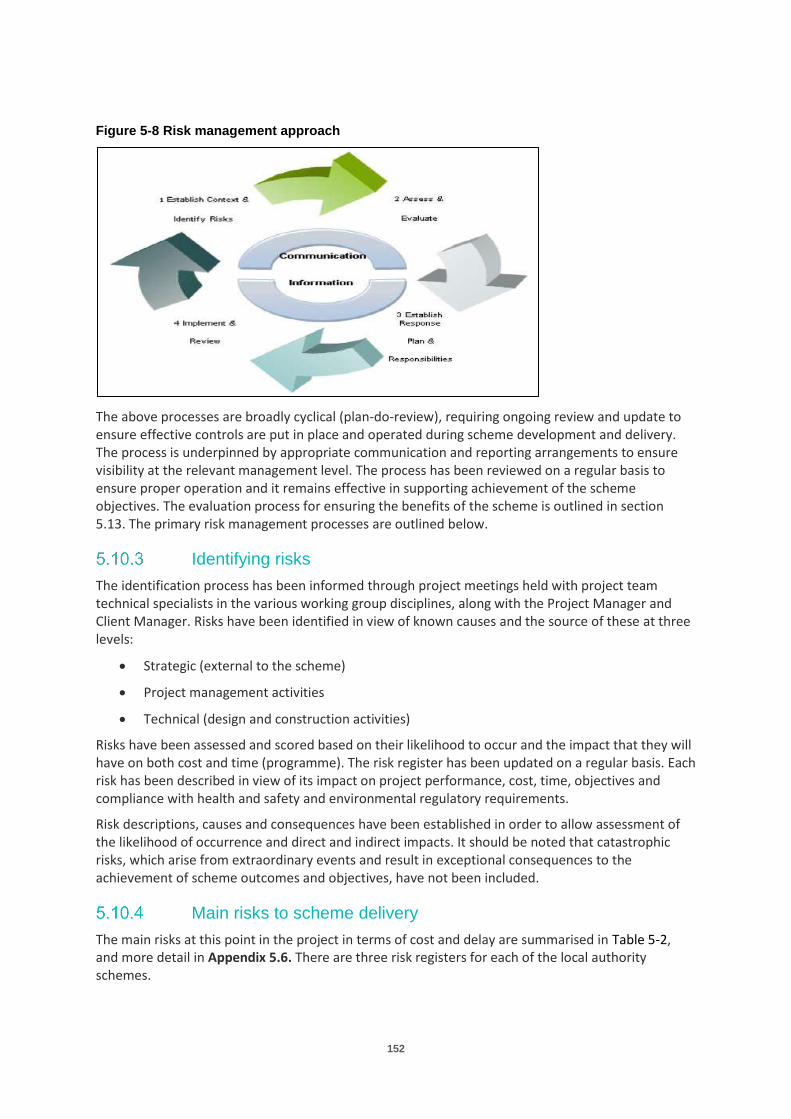
152
Figure 5-8 Risk management approach
The above processes are broadly cyclical (plan-do-review), requiring ongoing review and update to ensure effective controls are put in place and operated during scheme development and delivery. The process is underpinned by appropriate communication and reporting arrangements to ensure visibility at the relevant management level. The process has been reviewed on a regular basis to ensure proper operation and it remains effective in supporting achievement of the scheme objectives. The evaluation process for ensuring the benefits of the scheme is outlined in section 5.13. The primary risk management processes are outlined below.
Identifying risks
The identification process has been informed through project meetings held with project team technical specialists in the various working group disciplines, along with the Project Manager and Client Manager. Risks have been identified in view of known causes and the source of these at three levels:
Strategic (external to the scheme)
Project management activities
Technical (design and construction activities)
Risks have been assessed and scored based on their likelihood to occur and the impact that they will have on both cost and time (programme). The risk register has been updated on a regular basis. Each risk has been described in view of its impact on project performance, cost, time, objectives and compliance with health and safety and environmental regulatory requirements.
Risk descriptions, causes and consequences have been established in order to allow assessment of the likelihood of occurrence and direct and indirect impacts. It should be noted that catastrophic risks, which arise from extraordinary events and result in exceptional consequences to the achievement of scheme outcomes and objectives, have not been included.
Main risks to scheme delivery
The main risks at this point in the project in terms of cost and delay are summarised in Table 5-2, and more detail in Appendix 5.6. There are three risk registers for each of the local authority schemes.

153
Table 5-2 Main risks to scheme delivery
Risk management
Following assessment and evaluation of risks a systematic approach has been adopted to respond to risks and allocate responsibility to the most appropriate party as the risk owner, in line with the governance arrangements set out previously. One of four strategies will be adopted in developing a suitable response plan:
accept or tolerate the consequences in the event that the risk occurs
manage the risk through improvements in controls for management or technical processes
transfer or escalate the risk
terminate the activity giving rise to the risk
The development of response plans to manage risk has been undertaken only where the likelihood of occurrence and impact can be reduced in a cost-effective manner. A combined strategy has been used where a mix of the above options would be the most appropriate option.
Risks should be transferred to a third party, for example, insurer or escalated for consideration only where they can be more cost effectively controlled. If this is not possible then either the activity giving rise to the risk should be terminated or the potential consequences accepted by the Project Director and scheme sponsor.
Risk reporting
Risk reporting is key to providing visibility of threats to the scheme at the appropriate level and to ensure controls are being properly operated to provide governance and protect achievement of scheme objectives.
A project risk register has been established to record all risk information relevant to the risk management processes outlined above. This provides the data required for analysis and management reporting/review. The reports will set out the current risk profile and how this has changed during the reporting period. It will also set out the status of response plans and highlight plans for near term risks where response plans have not been properly implemented or residual risk exposure remains high.
154
The scheme project manager will be responsible for maintaining the risk register and ensuring the information is up-to-date, accurate and complete. Line of reporting shall be in line with the governance arrangements set out earlier. This process will enable senior managers to consider budget requirements in a timely manner to deal with any cost overruns.
5.11 Change management This programme will have a fully integrated change control process put in place by the change manager in the PMO. This includes: identifying and capturing potential change; assessing the impact of potential change and identifying mitigations; managing the potential change through the approval process; and assuring that the change is properly implemented across the project.
When a change is proposed, the following questions should be captured:
who RAISED the change?
what is the REASON for the change?
what is the RETURN required from the change?
what are the RISKS involved in the change?
what RESOURCES are required to deliver the change?
who is RESPONSIBLE for the build, test and implementation of the change?
what is the RELATIONSHIP between this change and other changes?
The PMO will implement a robust change control procedure realising the following benefits:
any movements to the agreed baseline are properly understood, controlled, recorded and
reported
the review and approval of changes are carried out by the correct people
the process allows a single, consistent and auditable mechanism for managing project baselines
Once this SOBC has been approved the programme will have the decision of the scope of the programme. Detailed plans on scope, milestones and budget will enable a baseline to be signed-off from which change can be measured. This baseline will also detail risks and considerations for the elements of scope uncertainty which remain. Delegated levels of authority will also be agreed across the programme.
Local authorities' lessons-learnt approach
As described earlier, each local authority will be delivering the interventions within its own area. Learning lessons is part of each authority’s own project management and governance arrangements.
The programme has also referred to the DfT/IPA report Lessons from transport for sponsorship of major projects, April 2019. This has proved invaluable in ensuring the programme uses the 24 practical, best-practice lessons to help deliver a successful programme and will be used throughout the programme to ensure successful delivery.
The tables below summarise each of the three authority’s lessons-learnt approach and provide evidence of this working in practice.

155
Table 5-3 Portsmouth City Council lessons learnt
Summary of Lessons-Learnt Approach
Portsmouth City Council has an excellent track record of delivering innovative and transformational schemes both within the City and further afield.
Evidence of this approach in practice
Project Lesson learnt How the learning has been spread and applied
Portsmouth Tipner Interchange Park and Ride Scheme
Large-scale public meetings often get dominated by one or two individuals which can discourage participation from other people, drop-in sessions proved much more successful at engaging people and having meaningful conversations
Communications team have been using lesson learned around large public meetings versus drop in session in similar consultation and public engagements
This same communications team is engaged with the SEHRT programme and will bring best practice forward
The Hard Interchange, Portsmouth
Due to the nature of the site operation, the interchange had to remain operational throughout the construction phase
Demonstrated the need to have excellent lines of communication with all transport providers, so that they can keep customers updated. This will be undertaken during delivery in all the projects completed as part of this bid
Project team remained consistent throughout the life of the project. This allowed for effective delivery during the construction phase
Northern Road Bridge Use of consultants for writing the contract who were inexperienced in the NEC 3 option C model led to ambiguities and inconsistencies which became problematic.
Considerable personnel changes on both client and contractor side caused issues with consistency
Problems were rapidly raised up the issue ladder resulting in consultants directors attending board meetings with senior staff and councillors
Shared working with other consultants resolved many of the problems through targeting use of appropriate skill sets
The learning around skill allocation and work force planning has been translated into good practice guides and disseminated to staff though the team's quality assurance system "Launch Pad"

156
Table 5-4 Hampshire County Council lessons learnt
Summary of lessons-learnt approach
Hampshire County Council has an established track-record of delivering major transport infrastructure and is currently managing a £174m capital programme for transport interventions. The key lessons learnt are the need for early investigations to minimise downstream risk, particularly during the construction phase. This includes through scheme preparation and a contract audit process prior to tend to minimise risk at contract and manage the opportunities for claims from contractors due to contract error.
Evidence of this approach in practice
Project Lesson learnt How the learning has been spread and applied
Whitehill and Board Relief Road
The main contractor entering receivership during the construction period
To ensure that there are agile and robust mechanisms to define the termination point in the works and to quickly procure a new contractor to minimise downstream programme and budgetary risk
Asda Roundabout, Havant
The need for early identification of ecological constraints.
Ensure that thorough desk top and then site investigations are undertaken so that ecological impacts, particularly for protected species (Dormice) are identified at an early stage in the project and there is sufficient time to identify the impact, design appropriate mitigation and obtain the necessary licences.
Newgate Lane, Fareham
The need for early identification of public utilities.
To carry out early investigation work as a desk top exercise and then to follow up where high risks are identified with GPR and trial hole investigations.
Queens Roundabout, Farnborough
Ensure that public consultation is thorough.
To undertake a full consultation exercise at all stages of the project to keep local residents, representatives and other stakeholders are fully informed. This includes new residents who move to the area during the design and construction phase
Table 5-5 Isle of Wight Council lessons learnt
Summary of Lessons-Learnt Approach
The Isle of Wight Council has a long history of delivering successful projects and programme. A selection of these is highlighted below. The process for managing projects and programmes is outlined in the Isle of Wight Council Programme and Project Management Policy which was last updated in May 2017. The policy describes the approach that all council projects will adopt. It includes the collation of lessons learnt for incorporation into future schemes.
The council is a learning organisation and continually reviews its policies and procedures. The existing policy is currently being reviewed, with a draft version in consultation. The council understand the importance of learning lessons and will continue to update its policies and procedures to accommodate them.
Evidence of this Approach in Practice
Project Lesson Learnt How the Learning has been Spread and Applied

157
ASDA Roundabout
(£4 million)
Major roundabout scheme, which was very high profile for the local area, completed in 2017
Delivered via the Island Roads PFI Contract with an internal client manager and external project management support (same as the delivery methodology proposed for the SEHRT scheme)
Lessons Learnt: Governance process and working relationship with Island Roads to deliver a major call off scheme outside of the PFI Contract.
Lessons Learnt: Some design issues required small retrofits of the scheme after completion. All future schemes now undergo a detailed external design review.
The success of this scheme has set the standard for all future major highways capital delivery schemes for the duration of the PFI Contract (expires in 2037).
Newport Junction Improvement Programme
(£9.5 million)
Series of junction improvements around the town of Newport
Delivered via the Island Roads PFI Contract with an internal client project manager and external project management support (same delivery methodology proposed for the SEHRT scheme).
Construction on this scheme commences in October 2019. The detailed design phase has already been completed by Island Roads.
Lessons Learnt (design phase): Local cycling organisations has significant objections to the design through the consultation phase. This delayed the scheme delivery to address concerns. Local cycling organisations included as key stakeholders in all future schemes.
Local Sustainable Transport Fund (LSTF)
(£2 million)
Island-wide sustainable transport initiatives completed in 2017
Independent external review of this successful programme revealed a number of lessons learnt, which have been incorporated into the current draft version of the Project and Programme Management Policy
Key areas highlight the importance of consistency of dedicated Project Management support. This was identified early in project delivery, which allowed the programme to end successfully.

158
5.12 Benefits realisation strategy, framework and outlines plan
Introduction
The benefits realisation strategy provides a framework to ensure the delivery of the anticipated benefits from the SEHRT programme. It sets out a logical sequence of inputs, outputs, outcomes and impacts to be delivered, which are aligned with the programme objectives. This section describes the strategy, and the processes that will be used by the PMO to deliver the benefits and contribute toward the achievement of the objectives. The monitoring and evaluation officer will be responsible for managing the benefits management process. The ownership and responsibilities among the partners for each benefit are identified. The sequence of programme context, inputs, outputs, outcomes and benefits are presented in the map shown in Figure 5-9 below.
Context
The context for the SEHRT programme comprises the geographical constraints and the fragmented transport network in the Portsmouth city region. These issues have caused a dominance of travel by car and poor transport connectivity. This context is presented in the SEHRT Logic Map, shown in the Strategic Case.
Challenges
These five challenges facing the Portsmouth city region are being exacerbated and perpetuated by the dominance of car travel and poor transport connectivity. Each of these challenges are described in detail in the section 1.0
Outputs
These comprise the SEHRT proposition as described in section 1.9 of the Strategic Case, which is the
expected result of our programme interventions. The outputs are presented in the logic map, (figure
1.3)
Outcomes
The expected outcomes of the programme are the fulfilment of the TCF objectives, which are
detailed in section 1.8. These are listed in the fourth row of the Logic Map, shown in figure 1.3
First order outcomes These will result quickly from the delivery of the outputs. Introduction of the SEHRT services will increase capacity at peak times for commuter trips. The junction and corridor schemes (outputs) will result in faster public transport journey times and the avoidance of large variable traffic delays. Reduced journey times will improve access to employment centres, enterprise zones and development sites. Removal of traffic delays will increase the reliability of travel times.
Second order outcomes These will take longer to realise as they result from user behavioural changes made in response to the outputs and the first order outcomes. Faster travel times, greater reliability, higher capacity and an improved customer experience will all raise passenger satisfaction with public transport. This in turn will encourage a modal shift from car use, which will reduce carbon and NOx emissions and improve air quality. Better accessibility will support economic growth in the Portsmouth City Region and support housing delivery.

159
High level benefits
These benefits, numbered 1 to 6 in Figure 5-9 below, are realised due to the programme outcomes and some of the outputs.

160
Figure 5-9 South East Hampshire Rapid Transit Programme map of objectives, inputs, outputs, outcomes and benefits

161
Programme benefits
The benefits register for the programme is shown in Table 5-3. The overall programme benefits, shown in the second column (from left) comprise the high-level benefits that are listed in the sixth column of Figure 5-9.
The TCF objectives that are supported by these high-level benefits are shown in the Logic Map provided in the Strategic Case.
Some of these are outputs and outcomes required to realise the high-level benefits, such as reduced bus journey times, which can also be considered to be benefits in themselves.
The timescales for the realisation of each benefit are shown columns four to six and are described below.
The activities or outputs required to realise the benefits are described in the sixth column. These comprise delivery of the bus priority, interchange, bus stop and pedestrian/cycle infrastructure by the relevant local authority, and provision of the SEHRT and local bus services by the operators.
The persons or organisations within the partnership which are publicly accountable for the realisation of the benefits are listed in the seventh column. The Senior Responsible Officer (SRO) for the SEHRT programme, is based at Portsmouth City Council. There is also the programme manager, who co-ordinates the scheme deliveries and reports to the SRO. The Transport Planning Departments at Hampshire County Council (HCC), Isle of Wight (IOW) Council and Portsmouth City Council (PCC) will manage the schemes within their areas through the project managers, co-ordinated by the programme manager.
The owners of these activities, who will be responsible for implementing them, are listed in the eighth column. In the cases of the bus priority, bus stop and pedestrian/cycle schemes, these partners are the highways departments of the authorities in which the schemes are situated.
Interchange schemes will be owned and implemented by the local authority projects departments. However, parts of the Ryde Interchange are owned by Network Rail and leased to the franchisee, South Western Railway. This scheme will be led by the Isle of Wight Council, working in partnership with the rail industry bodies.
Timescale
It is intended to complete the local authority owned Inputs, delivering the outputs, as listed in Table 5-3 below, within three years of the commencement of the TCF funded SEHRT Programme. Development of the schemes will commence immediately after funding is awarded and be completed by March 2023.
Some schemes can be implemented quickly, and these will be progressed as soon as possible in order to secure their benefits early. However, other schemes have delivery constraints such as a need for planning permissions, and will take longer to implement. Initiation work on these schemes will commence as soon as possible to enable their completion before the end of 2023. Some of the schemes must be implemented sequentially, to avoid issues such as undue traffic disruption, while others may be completed in parallel. Implementation of the Portsmouth Clean Air Zone (CAZ) will also affect the delivery schedule of some schemes. This is to avoid any works that could cause traffic queuing and pollution impacts around the CAZ from affecting its introduction.
Some schemes may be completed within the first year, while others will be finished towards the 2023. Section 5.4 and Appendix 5.4 provide the delivery timetable.
Operation of the SEHRT routes will commence on completion of the implementation of the bus priority schemes, which might be within a shorter timescale. The levels of journey time saving,

162
reliability, accessibility and capacity benefits realised, will grow to reach their maximum or target values during the three year delivery period.
The outcomes or travel behavioural changes in response to the completion of the outputs, and the consequent realisation of the high-level benefits are expected to occur within a further two years after the delivery period. These changes will start to happen when the first schemes are in place, and then increase throughout and after the delivery period. Research suggests that demand for local bus services can take up to 10 years to fully adjust to changes in fares and services26.
A majority of the growth in bus travel demand will happen during the first two years after the SEHRT programme is complete. Following this, any further changes will be small compared with changes in demand that occur in response to other factors, such as new developments and future phases of SEHRT programme delivery. Subject to the programme being successfully completed, most of the benefits can therefore be expected to be realised within five years of its commencement.
In Table 5-3 - SEHRT Programme Benefits Register below shows the programme benefits register.
This provides the benefits, timescales, supporting activities and leadership and accountability of the
partners.
26 The Demand for Public Transport: A Practical Guide. Transport Research Laboratory Report 593, TRL, 2004. Section 5.4.4, p45.

163
Table 5-3 - SEHRT Programme Benefits Register
Benefit
number
High level
benefitTCF objective Description Activities required Accountability Owner
Congestion Reduced traffic congestion
Journey Time
Reduced bus/SEHRT journey times from
Leigh Park - Portsmouth Hard
Horndean - Clarence Pier
Wecock Farm - University
Fareham - Portsmouth Hard
Fareham - Gosport
Reduced bus service cancellations
Increased % of buses departing & arriving
on time
Reduced variation in bus journey times
Satisfaction Passenger satisfaction with bus travel
Higher bus mode share of commuting
trips
Higher bus patronage
Higher public transport patronage
Accessibility
Increased numbers of residents within a
30 minute travel time from employment
centres, University, Enterprise Zone and
development sites
CapacityIncreased capacity for travel into
Portsmouth city centre
Economic
growthIncreased economic activity
3Reduced climate
change impactsCarbon Reduced CO2 emissions from traffic
4Improved public
healthAir Quality Reduced NOx emissions from traffic
5Fewer road
traffic accidentsAccidents Reduced road traffic accidents
6
Transport
technology use
benefits
MobilityAlignment with Future of Mobility Grand
Challenge programme
Improved skills
base, business
productivity and
local economy
Deliver SEHRT bus priority schemes in Portsmouth &
Hampshire (PCC, HCC)
Deliver SEHRT Interchange schemes at Gosport, Fareham and
Ryde (HCC, IWC, South Western Railway, Network Rail)
Deliver SEHRT cycle, pedestrian and bus stop schemes in
Portsmouth & Hampshire (PCC, HCC)
Introduce SEHRT services (operators First Hampshire &
Dorset, Stagecoach South)
Maintain local bus services (operators First Hampshire &
Dorset, Stagecoach South, Go South Coast/Southern Vectis)
Smart fare payment methods introduced
1
Reduced traffic
congestion:
improved travel
times &
reliability
Deliver SEHRT bus priority schemes in Portsmouth &
Hampshire (PCC, HCC)
Deliver SEHRT Interchange schemes at Gosport, Fareham and
Ryde (HCC, IWC, South Western Railway, Network Rail)
Deliver SEHRT cycle, pedestrian and bus stop schemes in
Portsmouth & Hampshire (PCC, HCC)
Introduce SEHRT services (operators First Hampshire &
Dorset, Stagecoach South)
Maintain local bus services (operators First Hampshire &
Dorset, Stagecoach South, Go South Coast/Southern Vectis)
Senior Responsible
Officer at PCC
Programme Manager
PCC Transport Planning
HCC Transport Planning
IWC Transport Planning
PCC Highways Department
HCC Highways Department
HCC Projects Department
IWC Highways Department
IWC Projects Department
South Western Railway
Network Rail
Bus operators: First Hampshire &
Dorset, Stagecoach South, Go
South Coast/Southern Vectis)
Reliability
Mode share
2

164
5.13 Monitoring and Evaluation Plan (MEP)
Introduction
As discussed in the strategic case there are five key challenges facing the Portsmouth City Region, these are:
congested transport networks (highway and public transport);
high levels of deprivation and reduced life outcomes;
significant exceedances in air pollution;
low levels of productivity; and
sustainable delivery of additional housing and employment development to meet identified need.
The characteristics of transport within the Portsmouth city region are a significant factor to the above issues. TCF funds will be allocated to address these issues as evidenced in the strategic case figure 1.3
Monitoring and evaluation plans (MEPs) are essential in improving programmes and policies, organisational and national learning alongside providing accountability. Monitoring and evaluation plans are tasked to:
to ensure future decision making is evidence based
to enhance organisational understanding and development of learning
to help the DfT understand whether the outcomes and impacts of a scheme have been achieved,
exceeded or not reached to inform the local, regional and national understanding27
to evidence whether positive change has been delivered for our communities
Figure 5-10 - Reasons for monitoring and evaluating schemes28
Evaluation objectives and research questions
Research questions were created with a strong relationship to the DfT monitoring measures (A.1.1.) and the TCF objectives SEHRT logic map (figure 1.3). It was important to build off the TCF objectives as they form the high-level benefits discussed in the benefits realisation strategy.
27https://assets.publishing.service.gov.uk/government/uploads/system/uploads/attachment_data/file/786857/transforming-cities-tranche-2-applications.pdf 28 https://www.iied.org/supporting-national-monitoring-evaluation-systems-enable-adaptation-assessment-reporting

165
There are specific requirements from the DfT when developing a monitoring and evaluation plan for local authority major schemes as evidenced in Table 1 (A.1.1). The monitoring and evaluation of a programme needs to focus on the following:
1. process of implementing the programme
2. the costs associated with the programme
3. the impact of the programme
The monitoring and evaluation for the implementation of the programme is identified in section 5.4, 'Delivery plan and implementation strategy' and the costs associated with the programme are outlined in the 'Financial case'. Consequently DfT monitoring measures 1,2,3,4 and 10 evidenced in Table 1 (A.1.1) will be discussed there. An outcome based and standard knowledge-based theory of change approach will be utilised for the monitoring and evaluation of the TCF specific objectives of the SEHRT programme. An outcome-based approach will allow for the evidence gathered of why the intervention was or was not successful to be utilised. The standard knowledge-based theory of change approach allows for the evaluation of a combination of interventions and the ability to derive causal based effects.
The research questions to evaluate the impact of the scheme were created to collate qualitative and quantitative data. Quantitative data will allow for us to apply statistical tests to make statements about the data. For instance, carrying out trend analysis to provide a picture of whether a change is occurring. Qualitative data allows for us to understand human behaviour, emotion and personality characteristics. Being able to interpret this analysis allows for us to understand the rationale for change or a lack of change. The combination of both data sources will allow for us to develop a strong understanding of causal effect.
Three stage approach for monitoring and evaluation
It is important to understand how different SEHRT programme objectives will be realised over different timescales. Some objectives, such as a reduction in congestion within key corridors, will be realised within a short timeframe once the scheme opens; short to medium term scheme effects are referred to as outcomes. We will be using the indicators (A.4.1.) created to monitor some of these effects as actionable intelligence to implement change if the data highlights concerns. In order to inform the SEHRT programme manager this data will be collated quarterly to keep them up to date on any actionable intelligence to improve the delivery of the scheme in its entirety. There are other objectives such as supporting economic growth which are less direct effects of the scheme, thus take effect over a longer period of time; these longer term effects are called impacts. We will be monitoring impacts, however appreciate to attribute these solely to the scheme will be difficult.
It is for these reasons the monitoring and evaluation plan will be undertaken in three distinct stages:
Stage 1: Pre-construction study, commencing May 2020 - June 2020
Stage 2: One year post opening evaluation study, commencing May 2024 - June 2024
Stage 3: Five year post opening evaluation study, commencing May 2028 - June 2028
Figure 5-17 - Data for monitoring and
evaluating schemes

166
Figure 5-10 - Timescale of monitoring and evaluation approach
Stage 1 will require baseline data to be collated (A.2.1.) and presented to reflect the existing conditions prior to the delivery of the schemes. Once we have obtained the baseline data some of the indicators will have targets assigned to them in line with the pre-existing targets, the modelling calculations and Senior Responsible Owner (SRO). Once targets are agreed by the DfT this will allow for performance to be driven by a clear marker.
Stage 2 will be undertaken a year after the programme has been officially opened with a focus on the short term and medium term outcomes. The rationale for focusing on the short/medium term outcomes is we are not expecting the benefits to be realised in a short timeframe. The impacts will be reflected upon in this piece of work to evaluate any changes that are happening in a short to medium term period rather than a longer period of time. The reason we will still look at the impacts is to learn if there has been a considerable change we were not expecting and to reflect this to the DfT.
Stage 3 will be undertaken five years after the scheme is delivered. This report will look at the effect the scheme has had on the impacts and whether the outcomes are still being delivered upon. The outcomes will be interrogated to evaluate whether success has been continued or if additional implementations are required to improve performance (A.2.2.). This piece of work will support better decision making at a national level, support learning and the exchange of ideas and provide accountability to citizens and key stakeholders.
We are aware the Air Quality Local Plan is being implemented in Portsmouth around the same time period, therefore there will be some outcomes that are shared benefits of both programmes. These outcomes are related to carbon emissions and air quality (NOx levels). Furthermore, the Solent Mobility Zone programme could be running on a similar timescale. Consequently the monitoring and evaluation information between the three programmes will be co-ordinated to ensure duplication of work does not occur.
Data collection rationale for outcomes and impacts
The monitoring and evaluation plan demonstrates how the high level benefits discussed previously are being assessed via the creation of indicators (A.4.1.). The indicators are created to provide answers to the research questions which in turn assess if the TCF objective has been realised.
In order to assess the TCF objectives and authority specific monitoring objectives, indicators were created. These indicators are a breakdown measurement of the objectives allowing for a more in depth analysis into the affects the programme is having. The indicators were created with a clear link between the DfT's Monitoring and Evaluation Framework for Local Authority Major Schemes.[3] There is a strong relationship between the challenges facing the Portsmouth city region, the objectives we are trying to achieve the indicators created to measure the objectives and the DfT Monitoring and Evaluation Framework for Local

167
Authority Major Schemes (see figure 1.3)29. This is evidenced in the appendices with the link between A.1.1., A.1.2., A.3.2 and A.4.1.
Data requirements for outcomes and impact
Whilst construction for the scheme begins a performance dashboard will be created with baseline data, targets and annual or quarterly data based on the indicators in Table 4 (A.4.1.). This will inform key stakeholders on how the programme is progressing once it has opened. The information will be contained within the stage 2 and stage 3 reports. For certain indicators such as those related to congestion levels the analysis will be conducted monthly in order to ascertain any issues that require investigating by the programme manager. The performance dashboard will act as the central point for all of the information at a high level. This dashboard will be RAG rated allowing for areas of concern to be highlighted and allow for potential measures to be taken by the programme manager and Senior Responsible Owner. This will inform the lessons we learn as time goes on and future regional and national projects.
Monitoring and evaluation plan costs
It is imperative sufficient resources are made available for the collection, analysis and reporting of data. In order to deliver our monitoring and evaluation plan we will contribute £520,975, this cost is broken down in Table 5 (A.5.1. and A.5.2.)
Monitoring and evaluation officer This post is crucial in delivery of the monitoring and evaluation plan. This post will be tasked with the following:
collating several metrics going across the three authorities and the methodology assessed to ensure
consistency
reports will require running that feed into the dashboard which splits some of the information across
the three authorities
regular updates sent out to key stakeholders relating to performance, thus allowing for issues to be
rectified or resources delegated to an area of concern
updates provided to the programme manager and strategic leads
working closely with the Local Air Quality project team to ensure duplication of effort is not occurring
Troubleshoot issues that relate to data collation and analysis
New and existing data sources
The majority of the data referenced in Table 4 (A.4.1.) is from official sources in the public domain or internal
sources. We have done this to reduce the costs for carrying out the monitoring and evaluation. Nevertheless,
there is a significant need to collate data specific to the programme to showcase a stronger causal link
between the delivered schemes and the effect this has had. There is already a network of automatic traffic
counters in the Portsmouth city region and on the Highways England network, nonetheless there are not any
specifically placed to monitor traffic in the corridors where the SEHRT programme is delivering considerable
change. Consequently, we recommend traffic counters being placed at key locations in the corridors to assess
the impact on traffic flow and Bluetooth detectors to collate data on journey time. Furthermore, we are
focusing on areas of high deprivation within the Portsmouth city region, hence to collate information in
relation to this a survey will be required.
29https://assets.publishing.service.gov.uk/government/uploads/system/uploads/attachment_data/file/9154/la-major-schemes-monitoring-evaluation.pdf

168
Responsibility for monitoring and evaluation plan
The SRO will be accountable for the programme in its entirety, however the programme manager will have the responsibility to ensure the monitoring and evaluation is stringent and compliant. The monitoring and evaluation officer will be part of the programme team in charge of delivering the monitoring and evaluation for this programme. They will liaise with relevant departments, authorities and organisations to act as a central function to collate the information required to inform the monitoring of the project. The financial element will be reported on by the finance team, however will require incorporating into a report by the monitoring and evaluation officer. The programme delivery will be reported on by the programme manager, however will be built into the monitoring and evaluation reporting by the monitoring and evaluation officer.
Figure 5-11 - Responsibility
5.14 Programme closure
The SEHRT Programme Management Office (PMO) will ensure the programme is closed effectively.
Managing Successful Programmes (MSP) processes and methodology will be used during the programme
closure activity. Closure comprises the final assessment of the programme and the decommissioning of the
resources and infrastructure.
At the end of this programme, March 2023, it is important to review the performance and close the projects
before the team are reassigned. A key element of this will be the post-programme review which will look back
across the programme to consider any lesson learned, including areas that could be improved upon and any
best practice that can be shared with other parts of the organisation.
The closure and hand-over process will refer to the progress reported through the monitoring and evaluation
and benefits realisation processes, as set out in sections 5.12 and 5.13 respectively.
The closure process will produce a Programme Closure Report and Programme Evaluation Report which will
be signed off by the SEHRT Board providing stakeholder acceptance of what the programme has successfully
delivered.

169
i Physical activity and the environment NICE guideline [NG90] Published date: March 2018 https://www.nice.org.uk/guidance/ng90/chapter/Recommendations#strategies-policies-and-plans-to-increase-physical-activity-in-the-local-environment