Embed Size (px)
Citation preview

1
Solar 2015
Ivor Frischknecht
Chief Executive Officer14 May 2015

2Source: http://www.lyberty.com/encyc/articles/siliconvalley/Source: http://www.lyberty.com/encyc/articles/siliconvalley/

3Source: http://reneweconomy.com.au/2014/china-now-worlds-largest-solar-pv-market-91139

4
Mount Bischoff Mine (1883)Tasmania’s first hydro electric generating plant
Source: http://www.bonzle.com/c/a?a=featuredpics&yr=1912&pg=0&or=3&sz=4
5
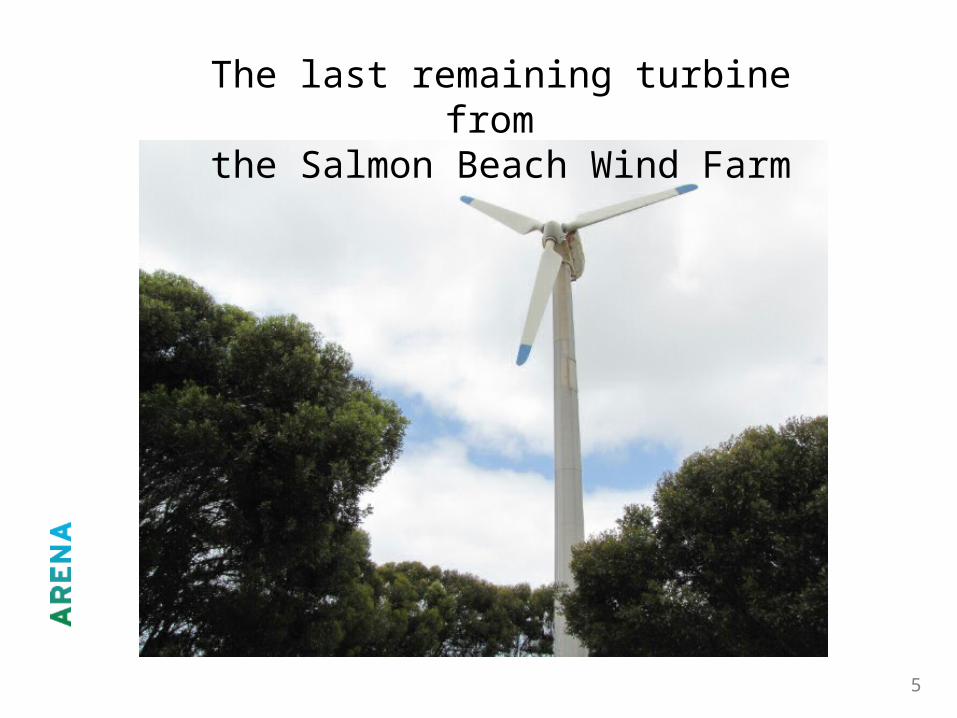
The last remaining turbine from the Salmon Beach Wind Farm

6
Greenough River Solar Farm , WA
Source: http://www.abc.net.au/news/2014-04-09/solar-farm-panels-sarahjpg/5376774
Australia’s first large scale 10 MW solar farm

7
FUNDING
$2.5 billion to 2022 (nearly $1.5 billion still available):• Projects• R & D• Knowledge
Capture & Sharing
2. Increase supply of renewable energy
ARENA’s objectives
OBJECTIVES
1. Improve competitiveness of renewable energy technologies
Knowledge Mandated obligation to collect, store & disseminate knowledge & learning from renewable energy projects & initiatives that ARENA funds
HOW
1. Improve the technical and commercial readiness of technologies in Australia
2. Address current energy issues through renewable energy

8
Large solar costs more than wind

9
Augusta, WA
Australia is leading the residential rooftop solar revolution

10
60% of residential PV costs are local and in your control
Module
Inverter
Balance of Systems
Other *
Customer Acquisition
PII ^
Installation Labour
$0.0
$0.5
$1.0
$1.5
$2.0
$2.5$AUD/W
$2.40/W
25%
21%
14%
40% non-controllable, coming down globally
^ Permitting, Inspection and Interconnection * Other includes sales tax, fees, margins, other administrative and indirect costs.
Source: Rocky Mountain Institute, July 2014, based on 2013 data

11
Balance of Systems
Other *
Customer Acquisition
PII ^
Installation Labour
$0.0
$0.2
$0.4
$0.6
$0.8
$1.0
$1.2
$1.4
$1.6
Germany Australia
$AUD/W Australia vs Germany - Local Costs Only
Germany has lower installation labour and hardware costs
30c/W
^ Permitting, Inspection and Interconnection * Other includes sales tax, fees, margins, other administrative and indirect costs.
Source: Rocky Mountain Institute, July 2014, based on 2013 data

12
Non-Production*
Electrical: Off Roof
Electrical: On Roof
Module Prep & Install
Racking Prep & Install
Pre-installation
$0.00
$0.05
$0.10
$0.15
$0.20
$0.25
$0.30
$0.35
$0.40
Germany Australia
$AUD/W Australia vs Germany: Installation Labour Costs
Potential for efficiency gains in installation processes
• Off-roof electrical costs driven by connecting inverters to electrical panels
• Potential for more automation, less labour intensive installation, and using modern rail-less racking systems could drive down costs even further
* Non-Production includes clean-up time, breaks, and other tasks
Source: Rocky Mountain Institute, July 2014, based on 2013 data
13
90
100
110
120
130
1.5 kW System 5 kW System
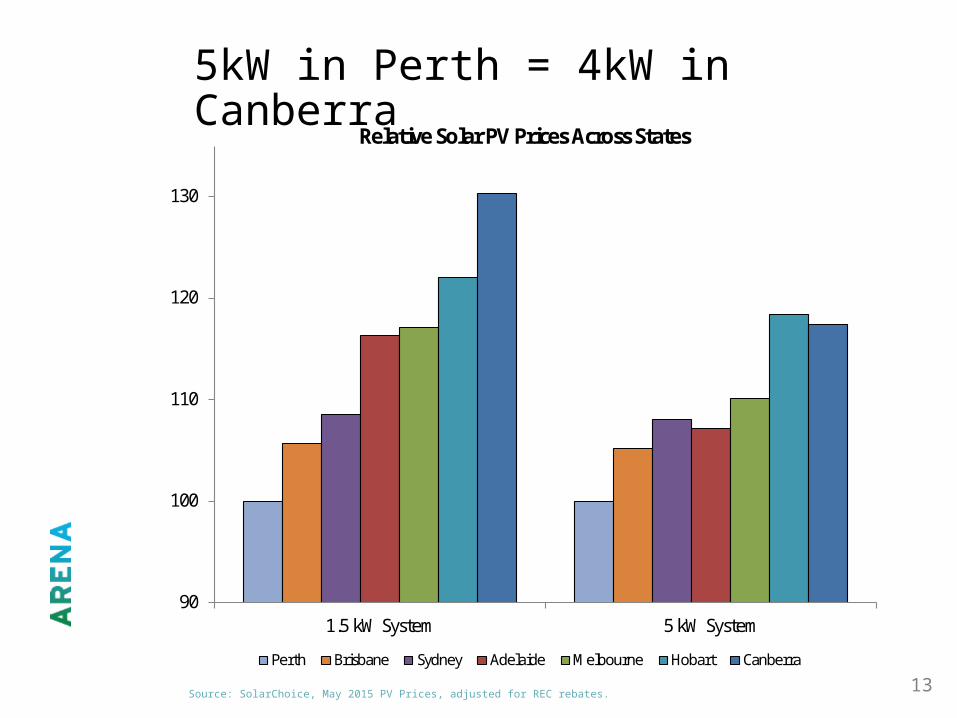
Relative Solar PV Prices Across States
Perth Brisbane Sydney Adelaide Melbourne Hobart Canberra
5kW in Perth = 4kW in Canberra
Source: SolarChoice, May 2015 PV Prices, adjusted for REC rebates.

14
At the Powerwall launch and beyond, Tesla has managed to generate serious interest in something that really isn’t all that sexy – a backup household battery system.

15
Want to know more?
Arena.gov.au ARENA at LinkedIn
@ARENA_aus on Twitter
Subscribe to updates: arena.gov.au/subscribe


![ARENA Annual Report 201415 - Phillip Riley US€¦ · Ivor Frischknecht Chief Executive Officer [Back to top] Highlights [Back to top] About ARENA ARENA was created in 2012 to support](https://img.dokumen.tips/doc/110x75/5fe6e5f24983ba22270cb1f7/arena-annual-report-201415-phillip-riley-us-ivor-frischknecht-chief-executive.jpg)