Embed Size (px)
Citation preview
1
Session 1B. CONCEPTS

CONCEPTS
Consumption: Direct and final use of goods- destruction of utility.
Savings are that part of the income which is not used for current consumption- i.e., Postponement of current consumption
S = Y-C
2

Investment: Savings when mobilised and converted into real physical assets
Production: Creation or addition of utility
Productive activity: Any activity undertaken with the objective of earning an economic reward
3

CONCEPTS Factors of production
Land• All natural resources lying on, above or below
the earth’s surface• Heterogeneous• Geographically immobile but occupationally
mobile• Passive factor of production
4

CONCEPTS Factors of production
Labour
• Physical or mental exertion by a human being in the process of production
• Heterogeneous
• Inseparable from the labourer
• Active factor of production
5
CONCEPTS Factors of production
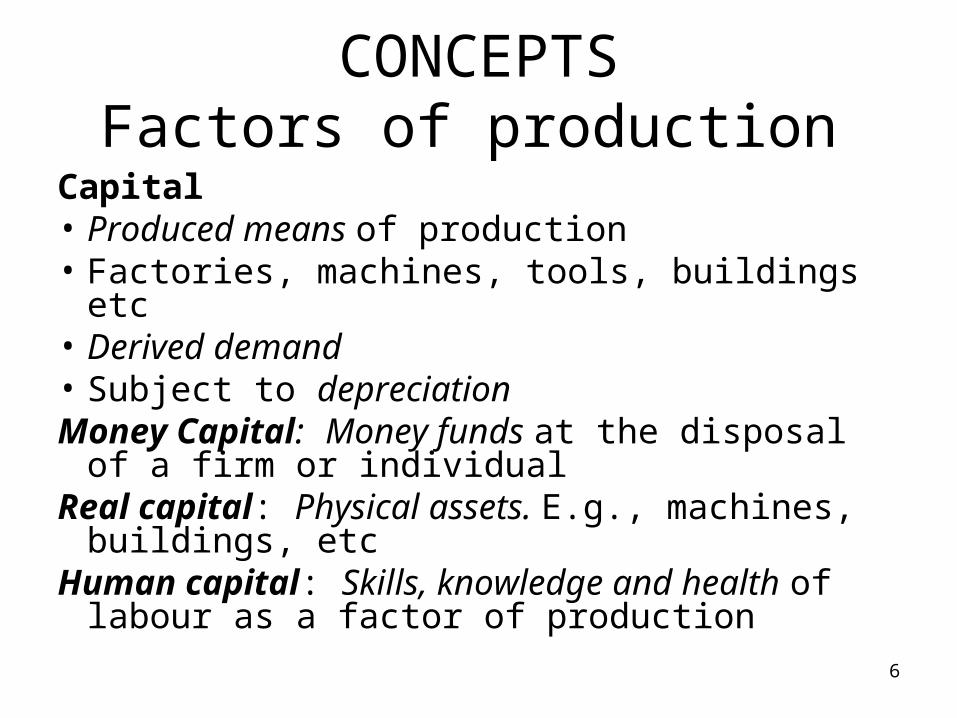
Capital• Produced means of production• Factories, machines, tools, buildings etc• Derived demand• Subject to depreciationMoney Capital: Money funds at the disposal of
a firm or individualReal capital: Physical assets. E.g., machines,
buildings, etcHuman capital: Skills, knowledge and health of
labour as a factor of production6

CONCEPTS Factors of production
• Enterprise & Organization: Newer concepts
• Identifying potential sources of production, collecting them in required quantities, assigning them specific tasks as per skills is the role of Organisation.
• Using these factors for economic activities, without any certainty of returns is the function of the entrepreneur.
7

CONCEPTS
Concept of scarcity- Scarcity of resources and multiplicity of wants- Choice
Opportunity Cost: Benefits foregone from the alternatives that are not selected- arises from scarcity and versatility of resources
8

PPC/PPF or Transformation Curve
Production Possibility Curve/ Frontier
• A graph that shows the different combinations of the quantities of two goods that can be produced (or consumed) in an economy, subject to availability of resources
9

PPC/PPF or Transformation Curve
• PPC represents opportunity cost concept and measures it (through the slope)
• Highlights significance of scarcity of resources
• Shows trade-off
“Substitution is the law of life in a full employment economy. The PPC depicts the society’s menu of choices”- Samuelson
10

11

PPC/PPF or Transformation Curve
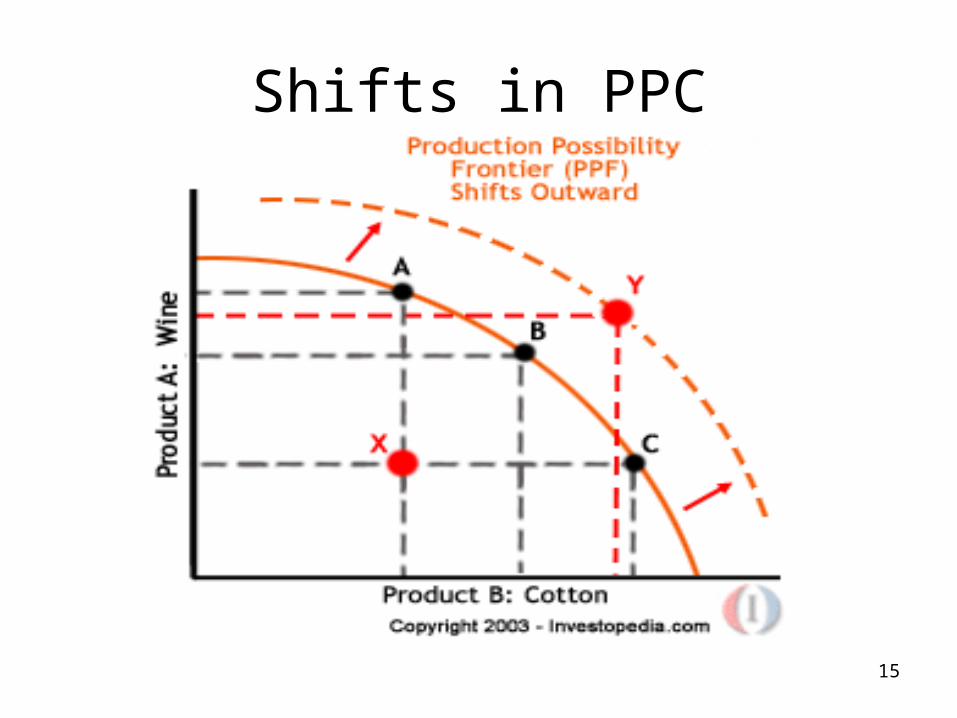
Imagine an economy that can produce only wine and cotton. According to the PPF, points A, B and C - all appearing on the curve - represent the most efficient use of resources by the economy. Point X represents an inefficient use of resources, while point Y represents the goals that the economy cannot attain with its present levels of resources.
12

PPC/PPF or Transformation Curve
Assumptions:• Economy is operating at full employment• Factors of production fixed in supply; but can be
reallocated between uses• Technology unchanged• For simplification, considers only 2 commodities
Based on these assumptions, society is faced with a fundamental problem of choice
13

PPC/PPF or Transformation Curve
• PPC measures the best combination of outputs that can be achieved from a given number of inputs.
• Downward sloping . Why?
• Concave to the origin (bowed outside)- As we produce more units of a commodity, we have to give up more and more units of the other commodity
14
Shifts in PPC
15

PPF
• When the PPF shifts to the right (outwards) , it shows there is growth in an economy..
Reasons:
• Technology
• Factor Endowments (shale Gas)
16

PPC
• When the PPF shifts inwards, it indicates that the economy is shrinking.
• A shrinking economy could be a result of huge ecological disaster , social unrest or deficiency in technology
17

PPC
• An economy can be producing on the PPF curve only in theory. In reality, economies constantly struggle to reach an optimal production capacity.
18

Firm
• An entity or organization that combines and organizes resources for the purpose of producing goods and /or services for sale.
• Identify- collect -and assign resources
• Types: proprietorships, partnerships, and corporations
19

Sole Proprietorship Firm
Sole Proprietorship Firm/ Proprietary
Single owner
-Invests own/borrowed capital
uses his own skills in management, solely responsible for results of operations
-Profits / losses not shared by anybody
20

Advantages:
• Simple form
• Easy to start and exit
• Undivided profits
• Secrets of Trade
• Prompt decision making
• Personal touch to business
21

• Disadvantages:
• No separate entity of the firm
• Unlimited liability
• Limited availability of funds
• Uncertain life of business after the owner
22

2. PARTNERSHIP
• Association of two or more persons• Agreement/ contract to start the firm and to share
profits (& losses)• Individually partners , collectively firm• Heir does not automatically become partner• All partners are bound by a decision or act by any
one of them.• A partnership firm can not become a member of
another firm, though partners can join another firm
23

PARTNERSHIP
• Partnership Deed- as partnership is created by agreement
- Easy to form
- Strong credit position
- Shared Risk
- Shared resources
24

PARTNERSHIP
• Uncertain life -Can be broken any time and reconstituted
• Unlimited liability- if a partner can not repay loan, creditors can claim it from the his personal assets.
• No legal framework for defining partners’ roles- Distrust can destroy
• Fund availability related to partners’ creditworthiness
25

JS/ LTD COMPANY
Most common type of business organisation
Legal entity
Perpetual Existence- independent of its members
MOA and Articles of Association to registrar
26

Private and Public Ltd Co
Private LTD Co:
-Max 50 share holders
-Shares transferable only among members
- Cant issue a prospectus
Public Ltd Co:
Minimum 7 members, no max
27

28
Business Cycles
• Widespread contraction and expansion in most sectors of the economy.
Time
Peak
Exp
ansi
on
Trough
Recession

29
Phases of Business Cycles
Phases of Business Cycles
• Expansion
• Peak of boom or prosperity
• Recession or downturn
• Trough, the bottom of the depression
• Recovery and expansion

• Business cycles are marked by widespread expansion and contraction in most sectors of the economy
• Major phases of a business cycle are recession and expansion (or prosperity).
• Peak and trough are the turning points of the phases.
• If recession is severe in terms of scale and longer in duration, it is termed depression
30

Causes of Cycles
• Inflationary/ deflationary pressures on price-cost relationships
• Agricultural and meteorological factors
• Aggregate demand and under consumption
• Monetary factors
• Savings-investment gap or over investment
31

Causes of Cycles
• Technological innovation
• General over production
• Psychological factors
• Risk and uncertainty factors
32

33
Characteristics of Recession
• Fall in consumers purchase• Fall in demand for labour and other inputs.• Fall in output and increase in inventories.• Fall in investments and demand for credit• Fall in profits • General pessimism Increase in the above factors describes the
phase of expansion

Characteristics of Recession
• The Great Recession:• Fall in Durable consumer goods demand• Freeze on new recruitments• Job cuts and pay cuts• Unsold houses (Foreclosures)• Bankruptcies• Stock market slide and falling investor
confidence• General mood of pessimism
34
Global Recovery??
• US sub prime lending
• Each phase carries the seeds of its own destruction
• Jobless recovery??
• Double Dip??
• European crisis: Sovereign Debt Crisis
35

Signs of Economic Recovery
1. Unemployment figures
• Non-farm payrolls
• ASA Staffing Index: Measures the temporary staffing activity. After a recession, employers add temporary workers first so as to avoid the commitments and expenses of adding full-time workers until they are sure that business has improved. A rising ASA Staffing Index can signal that a recovery is underway.
36

Signs of Economic Recovery
2. Consumer spending
37

Signs of Economic Recovery
3. Consumer SentimentSurveys ask people how they feel about the economy in near-term and their own individual or family prospects.
• Consumer sentiment indicators like the Consumer Confidence Index (CCI) and the Michigan Consumer Sentiment Index do seem to correlate with reality more often than not.
38

Signs of Economic Recovery
4. Bank Lending
39

5.Purchasing Managers Index (PMI)
• The Institute for Supply Management (ISM) calculates the Purchasing Managers Index (PMI)
• Composite index of five "sub-indicators", based on surveys of more than 400 purchasing managers from around the USA
• whether businesses are seeing new orders, higher production levels, timely deliveries from suppliers and increasing inventories and employment
•
40

Signs of Economic Recovery
• Production level
• New orders (from customers)
• Supplier deliveries - (are they coming faster or slower?)
• Inventories
• Employment level
41

Signs of Economic Recovery
• Questions have only three options; "better", "same", or "worse“ (As the manager sees it)
• PMI figure ranges from 0 to 100
• PMI reading of 50 would indicate an equal number of respondents reporting "better conditions" and "worse conditions".
42

Signs of Economic Recovery
6. Cass Freight Index and the American Trucking Association's Truck Tonnage Index. (because these show that goods are being delivered to satisfy consumer orders)
• In India also truck sales are taken as an important indicator
43

44
Contra Cyclical Policy
Contra-cyclical or Counter-cyclical Measures (Measures to control business cycles)
A) Monetary Policy for Tackling Recession–Designed by the central bank of the country. (RBI in India) Monetary measures control liquidity and availability of credit .
Need to increase liquidity through:• Repo and reverse Repo rates• CRR decrease• SLR decrease• OMO: Selling securities Moral suasion and other
qualitative credit controls

B) Fiscal Policy for Tackling Recession
Measures by the government- Emphasised by J. M. Keynes during Great Depression
• Reduce tax rates• Increase subsidies• Increase public expenditure• Debt polices.
45

Fiscal measures directly affect
• Prices
• Consumers’ disposable income
• Money supply
• Supply of goods and commodities
- which in turn affect the movements of business cycles
46

47
3.Other measures –
Buffer stock operations
Declaration of minimum procurement price etc are used to stabilize prices in agriculture

Inflation
• Demand pull/ Cost- push
• WPI: 435 commodities tracked- time lag of only e weeks- revision later
• CPI is a better index as it captures cost of living, but it comes with a time lag
• 4 types of CPI- Industrial workers, urban Non manual workers, AL, rural labor
48

Monetary Policy
• Repo rate : Rate of interest charged by central bank when banks borrow money from it
• Tool through which RBI infuses funds into the system by lending to banks against pledging of securities
49

Monetary Policy
• Reverse repo: Rate which RBI offers to banks when they deposit funds with it.
• RBI drains out liquidity from the financial system through reverse repo by releasing bonds to the banks. This is a daily operation by the Bank to manage liquidity. Over a longer period, RBI can also manage liquidity through OMO.
50

Monetary Policy
• When liquidity is tight and banks need short term funds from RBI to manage mismatches, then repo rate emerges as the effective policy rate.
• But if liquidity returns to the system reverse repo rate would become the operative rate as RBI would be draining out funds from the system,
51

Monetary Policy
• . In US there is a single Fed Fund Rate. This is the key interest rate and short term funds are available to eligible borrowers at this rate.
52

53
Policy Rates
• SLR-• Every bank in India has to maintain a minimum
proportion of their net demand and time liabilities as liquid assets in the form of cash, gold and un-encumbered approved securities.
• Statutory Liquidity Ratio (SLR). Simply put, SLR is the percentage of total deposits banks have to invest in government bonds and other approved securities
•
•

54
• The maximum limit of SLR is 40% and minimum limit of SLR is 25%. It’s 25% now. This restriction is imposed by RBI on banks to make funds available to customers on demand as soon as possible. (Gold and G Secs (or Gilts) are included along with cash because they are highly liquid and safe assets.)

55
CRR, or cash reserve ratio, is the portion of deposits that the banks have to maintain with the RBI.
Higher the ratio, the lower is the amount that banks will be able to use for lending and investment

56
Difference between SLR and CRR:• To meet SLR, banks can use cash, gold or
approved securities - CRR has to be only cash.
• CRR is maintained in cash form with RBI, where as SLR is maintained in liquid form with banks themselves.

57
Reverse logic in recession
• A cut in SLR means that the home, car and commercial loan rates will go down.
•

58
Find out Policy Rates as in Sep. 2010
• Repo Rate:
• Reverse Repo:
• CRR:
• SLR:

FISCAL MEASURES
Recession:
• Increase government spending (stimulus packages)
• Reduce taxes
59

ROLE PLAY
• Company XYZ earns 70% of its revenue from exports to USA.
• Of late export orders have fallen , leading to fall in revenues.
• A meeting is called to find out solutions to the crisis.
60

Role Play
• The HR manager wants to cut jobs
• Finance department does not want to cut jobs as he does not want to lose trained manpower who will be handy in the case of a recovery.
61

• Product manager wants to create new products by investing in R& D
• The Marketing Department is not sure new products can be sold in a recession. they have 2 suggestions: A) more advertisements for the old products
• B) Concentrating on domestic demand
62

• The IT Department wants to keep more people ready for future demand
• How will a decision be arrived at?
63

END of SESSION
64

65
Indian Economy,2010 - Performance & Prospects
• All round prosperity
- Wealth effect of rising prices of most assets-real estate, gold, stocks
-Up to 30% hike in MSP of food grains
Farm loan waivers
Increasing private sector salaries
-Higher than ever hike in PSU salaries in the past 5 years (14% in 2006-07, 26% in 2007-08, 31.2% in 2008-09)
Family incomes have risen faster than individual incomes because of spread of service sector

• Rise in the number of double income families
66

According to NCAER
• How India Earns, Spends & saves by Rajesh Shukla:
• Rising middle class numbers• Rural jobs growing (Expenditure on NREGA :• 07-08: Rs.15,857• 09-10: Rs. 37, 938• 10-11: Rs. 40,100• NREGA wage rates have gone up from Rs.80 to
Rs. 100
67

• Rural economy is no more synonymous with agriculture
• Every new car creates 5 new jobs- cleaner, driver, parking attendant, mechanic & auto insurance surveyor
68

• According to Morgan Stanley report, the Indian economy will start growing faster than China in 2013.
• Reason : demographic dividend- India will see a declining trend in the share of non-working population and add 136 mn to working population over the next 10 years; China, only 23 mn.
69

• India’s savings rate will go up, while share of consumption in China’s GDP will go up
• Assumptions:
• Sustained increase in India’s infra spending,
• Educational levels
• Fiscal consolidation.
70
Read Raghuram Part II
71

Raghuram Rajan: Fault Lines: How Hidden Fractures Still Threaten the World Economy
• We must create real jobs,- not make-work jobs- to increase productivity of rural worker to the levels of manufacturing/ service workers
His prescription for population dividend:• Infrastructure• Education• Health• Financial Inclusion- credit only one aspect
72

ET’s warning:
• Need inclusive growth and internal security.
• To tackle the second, you need inclusive growth
73

On china (From Economist 19/08/10)
2010 (2nd quarter) output:
US: $ 3.522 trillion
China: $1.337 trillion
Japan: $ 1,288 trillion
China is now world’s 2nd largest economy, having surpassed Japan in the 2nd quarter of 2010
74

75

76

China- Some Facts
• World’s largest population
• World’s largest exporter
• World’s largest car market
• World’s largest consumer of energy
• World’s largest carbon emitter
77

• China’s problems:
• Inequality
• All areas not fully developed
• Rural neglect
• Absence of democracy
• Trade wars with Us
• Strikes in plants
• Housing bubble?78

79

80
Role Play
Company XYZ is an exporter whose major profits come from the US market. Of late, it has been facing falling demand and dropping profits. A meeting is called to discuss the problem:
The HR head wants to reduce manpower to revive profits.
The operations head wants to have a stable workforce which is well-trained and highly skilled so that resources do not migrate to competitors and morale is not lowered.

The Product Development head wants increased R&D spending so that new product lines can help beat the falling demand.
The Finance Head wants to avoid any new investments because the company has limited capital and will be hit hard if new products do not do well.
81

The Marketing Head has two alternatives : Either explore new foreign markets or to launch an exciting campaign to rejuvenate domestic demand.
What should the Managerial Economist Do?
What lessons did you learn?
82

![Unit 1B - HPT · design entwerfen, konstruieren; Entwurf, Muster 1B device Vorrichtung 1B dimension [ˌdaɪˈmen(t)ʃən] Abmessung 1B district Bezirk 1B drawing Zeichnung 1B drill](https://img.dokumen.tips/doc/110x75/6004851a49508c087b3c11bf/unit-1b-hpt-design-entwerfen-konstruieren-entwurf-muster-1b-device-vorrichtung.jpg)