Embed Size (px)
DESCRIPTION
Hybrid Transitions Combining
Citation preview

lable at ScienceDirect
Renewable Energy 91 (2016) 374e385
Contents lists avai
Renewable Energy
journal homepage: www.elsevier .com/locate/renene
Techno-economic energy analysis of wind/solar hybrid system: Casestudy for western coastal area of Saudi Arabia
Makbul A.M. Ramli a, c, *, Ayong Hiendro b, Yusuf A. Al-Turki a, c
a Department of Electrical and Computer Engineering, King Abdulaziz University, Jeddah 21589, Saudi Arabiab Department of Electrical Engineering, Universitas Tanjungpura, Pontianak 78124, Indonesiac Renewable Energy Research Group, King Abdulaziz University, Jeddah 21589, Saudi Arabia
a r t i c l e i n f o
Article history:Received 20 April 2015Received in revised form27 December 2015Accepted 24 January 2016Available online 2 February 2016
Keywords:Techno-economic analysisHybrid wind/solar systemExcess electricityEnergy cost
* Corresponding author. Department of ElectricalKing Abdulaziz University, Jeddah 21589, Saudi Arabi
E-mail address: [email protected] (M.A.M. Raml
http://dx.doi.org/10.1016/j.renene.2016.01.0710960-1481/© 2016 Elsevier Ltd. All rights reserved.
a b s t r a c t
The potential of hybrid wind/solar energy system in the west coast area of Saudi Arabia is analyzed inthis paper. The investigation puts emphasis on the energy production and cost of energy from both windturbine and photovoltaic (PV) in the hybrid system. Unmet electric load and excess electricity are takeninto consideration. The annual average solar irradiation and wind speed considered in this study are5.95 kWh/m2/day and 3.53 m/s, respectively. MATLAB and HOMER software are used to perform thetechnical and economic analyses of the hybrid system. As indicated from the simulation results, the PVarray shares more electricity production than the wind turbine generator if both wind turbine and PVarray are utilized in the wind/solar hybrid system with the same sizes. The wind levelized cost of energyis $0.149/kWh, which is more expensive than the solar energy of $0.0637/kWh. The energy cost of thehybrid system is dominated by battery and wind turbine expenses.
© 2016 Elsevier Ltd. All rights reserved.
1. Introduction
The world is still injecting a considerable amount of investmentin renewable energy resources. This trend has been driven by thecontinuous changes in the climate resulting in global warming. Inrecent years, many efforts have been made to increase the imple-mentation of renewable sources of energy through researches andapplication, not only in the developed countries but also in thedeveloping countries [1]. The increased exploitation is aimed atreducing carbon emission from energy generation and improvingthe reliability/security of energy supply [2].
Increase in fossil fuel consumption for electric power generationhas forced the kingdom of Saudi Arabia to pay more attention onrenewable energy generation. The kingdom now recognizes thatreducing dependency on fossil fuel for domestic consumption willgive positive impact on national economic growth and environ-mental issues. Generating some electricity from renewable re-sources instead of using fossil fuel will increase the revenue for thekingdom from petroleum. Moreover, it is predicted that CO2emission from fossil power generation system will increase for
and Computer Engineering,a.i).
about 20% of the current global energy-related CO2 emissions in2030 [3]. This level of predicted CO2 emission will be reduced ifrenewable energy resources are implemented for the power gen-eration. However, the renewable energy cost is more expensivethan the electricity cost from conventional energy in Saudi Arabiaas reported in Ref. [4]. The gradual decrease in energy cost sinceseveral years ago and the need for environmental sustainabilityhave led to the economic viability of renewable energy resourceslike solar and wind. The cost of renewable energy is proved to beless than that of conventional energy generation in Saudi Arabia ifthe indirect costs of fossil fuel are included, such as environmentaland health costs [5]. Therefore, Saudi Arabia is also looking towardsthe development of renewable energy in the coming time [6].Optimal management of renewable energy resources is a key ne-cessity to ensure that maximum amount of energy is extractedfrom these resources. Several efforts have been done to optimizesize of grid-connected photovoltaic (PV) energy system [7,8].
Saudi Arabia has some potential locations for renewable powergenerations. Solar and wind energy are the most importantrenewable energy source in Saudi Arabia [9]. Solar energy appearsto be a promising candidate for electricity generation, while windenergy takes second place of renewable energy source in SaudiArabia [4]. This is due to the viable wind speed potential of about5.7m/s [10,11] and the high solar radiation of around 2200 kWh/m2

M.A.M. Ramli et al. / Renewable Energy 91 (2016) 374e385 375
[12,13]. Saudi Arabia, especially on coastal areas, has relatively largewind and solar energy which can be harvested.
Wind and solar energy are intermittent resources and aredependent on geographical and weather conditions. Standalonewind or solar energy systems will not generate accessible energyfor noticeable time portion of the year [14] and they seem to beuneconomically. Hybridization of wind/solar energy systems forelectricity are usually more reliable and less expensive compared tostandalone wind or solar energy systems, as reported in Refs.[15e18].
In order to simplify the analysis of wind and solar hybrid sys-tems, geographic and weather conditions can be omitted, as re-ported in Refs. [19]. However, for obtaining accurate results, theenvironmental site conditions have to be taken into consideration.The environmental factors are very specific and dependent on lo-cations. Renewable energy such as wind and solar also vary withtime of the day, season and type of terrain, all of which have impacton electric energy production and cost of energy [20,21].
Numerous researches have been conducted by researchers onthe technical and economic analysis of renewable energy systems.Garcia et al. carried out an analysis of hybrid energy system withvariable renewable generation and under flexible operation. Thedynamical properties and limitations were identified and solutionsfor managing and mitigating high variability of renewable energyhave been recommended [22]. In addition, an analysis of technicaland economic feasibility of stand-alone hybrid system was con-ducted at a location in United Arab Emirates where a 500 kWoptimal hybrid renewable energy system for the remote area wasmodeled and analyzed with 37% reduction in CO2 emission ascompared to the conventional diesel generator [23]. The authors inRef. [24] evaluated a PVmodule performance by back surface watercooling under hot climate. Their model predicts various electricaland thermal parameters affecting the performance of the PV sys-tem. Murphy et al. analyzed the cost of reliable electricity byanalyzing hybrid distributed generation systems, diesel and grid-connected solar in view of an unreliable electric grid in Uganda[25]. It was noted that the improved reliability increases cost, butthe increase can be justified for users needing more reliability.
In this work, the techno-economic feasibility study of wind/solar hybrid system is analyzed for Yanbu, Saudi Arabia (Latitude:24�0502000 N, Longitude: 38�0304900 E). Yanbu is located on the RedSea coast area and has great wind potential [26,27] and good levelof solar irradiation. Technical and economic analyses are performedfor a wind/solar systemwith battery storages. MATLAB and HOMER[28] are used as tools that facilitate optimum design of the wind/solar hybrid systems. The analyses of the hybrid power system areperformed by simulating system operation for the project lifetime.This simulation requires data on capital expenses, operation andmaintenance, as well as replacement costs. For the simulation ofthe wind/solar hybrid system, the key variables to be examined arewind turbine, PV array, and battery sizes in order to determinewhich hybrid energy system configuration is optimal based onenergy production, cost, unmet electric load, and excess electricity.The unmet electric load is defined as the electrical load that goesunserved because the electrical demand exceeds the supply anddeficiency occurs. The excess electricity is the surplus electricalenergy produced andmust be dumped because it cannot be used toserve electrical load or to charge batteries (batteries are unable toabsorb it all).
Moreover, the investigation places emphasis on energy pro-duction, served/unserved electricity demand, cost of energy (COE),and cost of wind/solar systems with battery storages. The best sizeof the combination of PV array and wind turbine for the wind/solarhybrid system is also investigated. The influence of battery storagesize on the hybrid system is taken into consideration.
Geographical location of Yanbu is shown in Fig. 1. Weather dataused in this work are real data for the location under study. Foraccurate results, environmental site conditions such as wind shear,site altitude, hub height, ambient temperature, and ground reflec-tance are included in the computation.
2. Wind and solar resources
2.1. Wind speed, direction, and power
A wind rose diagram provides details of typical wind speeddistribution and direction at a specific location. It is commonlyillustrated in a circular format and shows thewind blows frequencyfrom particular directions. The spread of wind directions isimportant to give information on how to choose a wind turbine.The wind turbine with horizontal axis needs to face towards thewind to get the highest efficiency power generation.
Fig. 2 presents awind rose diagram for Yanbu, based on one yearof hourly wind speed data. The spoke length around the circleshows the frequency of time of wind blow for a particular direction.Every concentric circle indicates wind blow in a different frequency,which is zero at the center and larger frequency at the outer circle.This diagram shows that the wind at Yanbu is most often out fromthe west. There are 3 spokes around the west direction comprising47.5% of all hourly wind directions. It shows a rare event for thewind to blow from the north or the southeast. The longest spoke orthe winds from the west shows that in Yanbu the wind blows fromthe west at speeds above 5 m/s for about 10% of the time in a year.
The hourly wind speed data at Yanbu is shown in Fig. 3. The datais obtained by measuring wind speed at 10 m anemometer height.The wind speed varies between 0 and 12 m/s and rarely exceeding12 m/s (0.79%). The annual average wind speed in Yanbu is about3.53 m/s. The wind speeds of less than or equals 3.0 m/s are about27.2% of the year. This means that the energy can be exploited for72.8% of the year with 3.0 m/s cut-in-speed.
The vertical extrapolation of wind speeds at the wind turbinehub height can be done using two wind profile laws: the loga-rithmic law is defined as
u2 ¼ u1
ln�Z2=Z0
�
ln�Z1=Z0
� (1)
where the wind speed at hub height u2 (m/s), the wind speed atanemometer height u1 (m/s), the hub height z2 (m), the anemom-eter height z1(m) and the surface roughness z0 (m), and the powerlaw is defined as
u2 ¼ u1
�Z2Z1
�a
(2)
where a is the wind shear exponent. The IEC standards [29,30]recommend a wind shear exponent value of 0.20 for onshore(normal) wind conditions and 0.11 for onshore (extreme) windconditions.
Once the hub height wind speed has been specified, the windturbine power output can be taken from the power curve, which isdeveloped at wind speed under temperature and pressure standardconditions of (STP) as used in Ref. [31]. The expected power outputis multiplied by the air density ratio to adjust to the actual poweroutput of wind turbine, as follows:

Fig. 1. Geographical location of Yanbu.
Fig. 2. Wind rose of Yanbu.
M.A.M. Ramli et al. / Renewable Energy 91 (2016) 374e385376
PW ¼�r
r0
�PW;STP (3)
where PW is the actual wind turbine power output (kW), PW,STP isthe wind turbine power output at STP (kW), r is the actual airdensity (kg/m3), and r0 is the air density at STP (1.225 kg/m3).
2.2. Solar irradiation, temperature and power
The power output of the PV array is expressed as
PPV ¼ PPV ;STCfPV ftemp
�IT
IT ;STC
�(4)
where PPV,STC is the rated capacity of the PV array under standardtest conditions (STC), fPV is the PV derating factor (%), ftemp is tem-perature derating factor (dimensionless), IT,STC is the incident ra-diation at standard test conditions (1 kW/m2), and IT is the solarradiation incident on a tilted surfaced of PV array (kW/m2), which isdefined as:
IT ¼�1þ Id
Io
�IbRb þ Id
�1� Ib
Io
��1þ cos b
2
� 1þ
ffiffiffiffiIbI
rsin3b
2
!
þ rg
�1� cos b
2
�I
(5)
where I is the global horizontal radiation (kW/m2), Io is the extra-terrestrial horizontal radiation (kW/m2), Ib is the direct beam ra-diation on a horizontal surface (kW/m2), Id is the diffuse radiationon a horizontal surface (kW/m2), rg is the ground reflectance oralbedo (%), b is the tilt angle of the surface (degree), and Rb is theratio of beam radiation on the tilted surface to beam radiation onthe horizontal surface (dimensionless) as follows:
Rb ¼ cos qcos qz
(6)
where q defines the incidence angle which is expressed as

Jan Feb Mar Apr May Jun Jul Aug Sep Oct Nov Dec0
4
8
12
16
Win
d S
peed
(m
/s)
Fig. 3. Hourly wind speed in Yanbu.
M.A.M. Ramli et al. / Renewable Energy 91 (2016) 374e385 377
cos q ¼ sin d sin 4 cos b� sin d cos 4 sin b cos g
þ cos d cos 4 cos bþ cos d sin 4 sin b cos g (7)
and qz is the zenith angle at solar noon, defined as
cos qz ¼ cos 4 cos dþ sin 4 sin d (8)
where 4 is the latitude, d is the solar declination angle, and g isazimuth of the surface. The declination angle is the angular dis-tance of the sun north (positive) or south (negative) of the equator.The declination angle varies through the year from 23.45� north to23.45� south and reaches the minimum/maximum at the southern/northern summer solstices. The declination angle is calculated us-ing the following equation [32]:
d ¼ 23:45�sin�360�
284þ n365
�(9)
where n is the day of year (1e365).The derating factor is the reduction of the PV array output due to
dust on the surface of the array, wiring, shading, aging, snowcovering, temperature losses, or anything else that would cause theoutput of the PV array to deviate from that expected under idealcondition.
The efficiency of PV decreases as temperature increases. Thetemperature derating factor is defined as [33]:
ftemp ¼1þ ap
�Ta þ IT
�Tc;NOCT�Ta;NOCT
IT;NOCT
�� Tc;STC
�
1þ ap IT
�Tc;NOCT�Ta;NOCT
IT ;NOCT
�hmp;STC
0:9
(10)
where Ta is the ambient temperature (�C), Tc,NOCT is the nominaloperating cell temperature (�C), Ta,NOCT is the ambient temperatureat which the nominal operating cell temperature (NOCT) is defined(20 �C), IT,NOCT is the solar radiation at which the NOCT is defined(0.8 kW/m2) hmp,STC is the efficiency of the PV array at its maximumpower point under STC (%), and ap is the power temperature co-efficient (%/�C). The values of Tc,NOCT, ap, hmp,STC are typicallyincluded as part of PV manufacturers' product data.
The hourly solar irradiation (global horizontal radiation) inYanbu is illustrated in Fig. 4. The solar irradiation varies from 0.0 to1.1 kW/m2. The annual average solar radiation in Yanbu is about0.26 kW/m2 or 5.95 kWh/(m2 day).
The hourly temperature in Yanbu is shown in Fig. 5. The tem-perature varies from 15 �C to 40 �C. The annual average tempera-ture in Yanbu is about 29.1 �C.
2.3. Economic model
The economic model for HOMER simulation is developed usingnet present cost (NPC) which is the total cost of installing andoperating the system over its lifetime. It models each individualsystem by performing an hourly time-step simulation for one year.The total NPC of a system is calculated by
CNPC;tot ¼Cann;tot
CRF�i;Rproj
� (11)
where Cann,tot is the total annualized cost ($/yr), i is the annual realinterest rate (%), Rproj is the project lifetime (yr), and CRF() is afunction returning the capital recovery factor.
The capital recovery factor (CRF) is a ratio given by
CRFði;NÞ ¼ ið1þ iÞNð1þ iÞN � 1
(12)
where i is the annual real interest rate and N is the years.It is assumed that all prices escalate at the same rate. HOMER
uses an annual real interest rate rather than a nominal interest ratein the computations. However, the annual real interest rate can beobtained from the nominal interest rate by using
i ¼ i0 � f1þ f
(13)
where i is the annual real interest rate, i' is the annual nominalinterest rate, and f is the annual inflation rate.
The levelized cost of energy (COE) is the average cost per kWh ofuseful electrical energy produced by the system. The COE iscalculated by dividing the annualized cost of producing electricity

Jan Feb Mar Apr May Jun Jul Aug Sep Oct Nov Dec0.0
0.2
0.4
0.6
0.8
1.0
1.2
So
lar R
ad
iatio
n (kW
/m
²)
Fig. 4. Hourly solar irradiation in Yanbu.
Jan Feb Mar Apr May Jun Jul Aug Sep Oct Nov Dec15
20
25
30
35
40
45
Tem
peratu
re (°C
)
Fig. 5. Hourly temperature in Yanbu.
Table 1Azimuth angles.
Facing Azimuth angle (�)
S 0 or 360SW 45W 90NW 135N 180NE 225 or �135E 270 or �90SE 315 or �45
M.A.M. Ramli et al. / Renewable Energy 91 (2016) 374e385378
by the total electric load served, as follows:
COE ¼ Cann;totEserved
(14)
where Eserved is the total electrical load served (kWh/yr).
3. System components and specification
The PV array used in the simulation is a 1-kW monocrystallinewith Tc,NOCT, ap, and hmp,STC of 47 �C, �0.43%/�C, and 15.67%,respectively. Derating factor due to manufacturers' output toler-ance is assumed to be fPV ¼ 95% with the ground reflectance at thelocation of rg ¼ 15% (sandy soil). The value of azimuth angle ispresented in Table 1 and the latitude of Yanbu is 4 ¼ 24.09� North.
With the wind speed, the incident of solar irradiation on the
surface of PV array, and temperature as shown in Figs. 3e5, theelectricity production by the wind turbine and PV array are pre-sented in Table 2. The power output of PV array is computed by

Table 2Electricity production.
Quantity PV array Wind turbine
Rated capacity 1 kW 1 kWMean output 0.23 kW 0.16 kWCapacity factor 22.60% 16.10%Total production 1982 kWh/yr 1412 kWh/yr
Table 3PV Data.
PV array
Lifetime 30 yrCost of investment $ 2000/kWCost of replacement $ 1200/kWCost of O&M $ 30/kW/yr
M.A.M. Ramli et al. / Renewable Energy 91 (2016) 374e385 379
using MATLAB according to (4)e(10). The power output of PV arrayon the tilt angle varied from 0.00� to 90.00� with the azimuth an-gles from 0� to 315� are shown in Fig. 6. The best tilt angle is ob-tained at 22.92� for azimuth g ¼ 0� (facing South) which offers thehighest yearly average output power of 0.23 kW. The 1-kW windturbine provides 0.16 kWyearly average output powerwith the hubheight of 20 m.
The wind turbine capacity factor is 16.10%. It means that theactual wind turbine output is 16.10% of the wind turbine capacity. Itrequires wind speed of 12 m/s to produce the wind turbine fullcapacity of 1 kW. The PV array has a capacity factor of 22.60% whichis higher than that of the wind turbine. As a consequence, the PVarray has a capability to generate the total electrical energy per yearof 1.4 times higher than the wind turbine for the same sizes at thesame location. Therefore, combining a 1-kW PV array and a 1-kWwind turbine will produce the total electricity of 3394 kWh/yr.From this information, the PV array and wind turbine sizes can beextrapolated to produce more electricity for the current or futureelectricity demand load.
3.1. Cost of energy (COE)
The cost components are critical inputs for the development ofenergy and COE analyses of a hybrid energy system. They also playan important role in determining the capacity additions that willserve the electricity demand. The cost components consist of cap-ital, replacement, and operation and maintenance (O&M) costs. Ahybrid renewable energy system has high capital costs but very lowO&Mcosts due to no fuel expense. Awind/solar hybrid system costsare the cost components of the PV array, wind turbine, inverter, andbattery.
The PV array data used in the simulation is provided in Table 3.The PV array is typically covered by 25 years warranty with lifetimeexpected at 30 years. The average price of the PV array, including
Fig. 6. Yearly average PV power output at some azimuth angles.
the installation cost, is set at $2000/kW. The O&M cost is estimatedto be $30/kW/yr. The O&M cost for PV facility includes periodicarray water washing and tilt angle adjustment. The replacementcost of the PV array is assumed to have a 60% fall after 30 years.
Table 4 shows the data of wind turbine. The capital cost of thewind turbine generator used is $3000/kW, including the installa-tion cost. The wind turbine works for 120,000 h throughout itsestimated lifetime of 20 years. The estimated O&M cost for thewind turbine is about $40/kW/yr according to the report from USEnergy Information Administration (EIA) for onshore wind [34],while the replacement cost is estimated to decline by 50% over thepast 20 years. Most of wind turbine O&M cost is a fixed amounteach year for periodic mechanical and electrical repairs. In this case,when a wind turbine comes to the end of its technical design life,some of the internal mechanical and electrical parts are needed toreplace, while the steel tower itself would be in good condition andsafe.
Inverters for renewable system applications have not beendesigned to produce the reactive power. According to the newregulations adopted by the EU countries, an inverter needs to beable to supply the reactive power. In such a case, the inverter shouldbe oversized in order to guarantee the availability of reactive powerfor the whole year and maximize the energy harvested from therenewable system without reducing the active power production.Brecl and Topi�c [35] recommended to oversize the inverter to 30%related to PV array sizing if all economic aspects are taken intoaccount, and this inverter sizing consideration is employed in thisstudy. A brief summary of the data for the inverter is presented inTable 5. The inverter lifetime is set at 30 years, as recommended byIEA [36] for the utility scale used inverter. The inverter lifetime of 30years is with replacement.
Batteries are used as storage devices in order to alleviate themismatch between the load demand and electricity generation. Thebattery used for the simulation is a 4-V deep cycle type batteryrated at 1900 Ah. The lifetime of the battery is 12 years for oper-ating within the SOC between 40% and 100%. The nominal energycapacity of the battery is 7.6 kWh and the lifetime throughput is10,569 kWh. The battery price is $1200/unit and the replacementcost is assumed to be equal to the capital cost. The O&M costs areestimated at $ 60/unit/yr for watering the battery periodically. Thedata for the battery is provided in Table 6.
4. Results and discussions
4.1. Electric production ability
In Weibull function, the variations in wind speed are
Table 4Wind turbine data.
Wind turbine
Lifetime 20 yrCost of investment $ 3000/kWCost of replacement $ 1500/kWCost of O&M $ 40/kW/yr

Table 5Inverter data.
Inverter
Lifetime 30 yrCost of investment $ 400/kWCost of replacement $ 375/kWCost of O&M $ 20/kW/yr
Table 6Battery data.
Battery
Lifetime 12 yrCost of investment $ 1200/unitCost of replacement $ 1200/unitCost of O&M $ 60/unit/yr
0 4 8 12 160.0
0.2
0.4
0.6
0.8
1.0
1.2
1.4
Pow
er (k
W)
Wind Speed (m/s)
Fig. 8. Wind turbine power curve.
Table 7Levelized cost.
Levelized cost
PV Wind$0.0637/kWh $0.149/kWh
M.A.M. Ramli et al. / Renewable Energy 91 (2016) 374e385380
characterized by the Weibull shape factor k ¼ 1.28 and the Weibullscale factor c¼ 3.91 m/s as given in Fig. 7. The graph shows that thelocation has gusty winds and the winds tend to vary over a widerange of speeds.
Fig. 8 shows the 1-kW wind turbine power curve which has thestart-up and cut-in wind speeds of 2.5 m/s and 3.0 m/s, respec-tively. The output power of 1 kW will be obtained at wind speed of12 m/s. The anemometer height used for wind speed measurementis 10 m, while the hub of wind turbine at which the rotor sits is20 m above the ground. The altitude of site is 10 m.
The simulation is conducted based on 25-years project duration,2% annual real interest rate, and considering the total batterystorage sizes of 22.8 kWh for 36 h/autonomy (equivalent to 36 h ofaverage load). From the simulation results shown in Table 7, thewind levelized cost of energy is more expensive than the solarenergy. It is due to the electricity production by the wind turbinebeing less than that of the PV array. As presented in Fig. 9, the PVarray shares 58% of the total electricity production, while the windturbine gives 42% if both PV array and wind turbine are used in thewind/solar hybrid system with the same sizes. The total energyproduction is 3394 kWh/yr with the COE of $0.329/kWh. The en-ergy production from the PV is 1981 kWh/yr (58%), while the windturbine produces 1412 kWh/yr (42%).
0 2 4 60
5
10
15
20
Fre
qu
en
cy (%
)
Wind Spe
Wind speed data Best-fit W
Fig. 7. Weibull distr
4.2. Wind/solar hybrid system performance
For further analysis of the wind/solar hybrid system, a smallcommunity load demand in Yanbu Industrial City (YIC) is taken intoconsideration for the simulation case study. Fig. 10 illustrates thehybrid configuration that is used for the simulation. The PVgenerator produces direct current (DC) electricity. Thewind turbinegenerator does not produce DC electricity, so a built-in rectifier isused to convert the wind turbine output to DC. The DC electricityfrom both PV generator and wind turbine generator is converted toalternating current (AC) via inverter before supplying the AC load. Ifthe DC electricity generated by the PV generator or wind turbinegenerator is larger than demand, the electricity is diverted tocharge the batteries when the batteries are not fully charged,otherwise it is accounted as the unusable excess electricity andmust be dumped.
The load profile, as shown in Fig. 11, has the average value of77.2 kW or 1852 kWh/day and the peak value of 125 kW.
The average load of 1852 kWh/day is equivalent to the total load
8 10 12 14ed (m/s)
eibull (k=1.28, c=3.91 m/s)
ibution, Yanbu.

Jan Feb Mar Apr May Jun Jul Aug Sep Oct Nov Dec0.0
0.1
0.2
0.3
0.4
0.5
0.6
Po
wer (kW
)
PVWind
Fig. 9. Wind/solar hybrid electric production.
Fig. 10. Energy flow diagram for wind/solar hybrid system.
Jan Feb Mar Apr May Jun Jul Aug Sep Oct Nov Dec Ann0
50
100
150
Lo
ad
(kW
)
maxdaily highmeandaily lowmin
Fig. 11. Load profile.
M.A.M. Ramli et al. / Renewable Energy 91 (2016) 374e385 381
to be served of 675,982 kWh/yr. As indicated before, the PV arrayshares 58% of the total electricity production, while the wind tur-bine gives 42% if both PV array and wind turbine are used in thewind/solar hybrid system with the same sizes. Therefore, PV andwind turbine required to fulfill this total load should have sizeabout 200 kW. If the total battery storage is 36 h/autonomy, thehybrid system needs 4560 kWh nominal capacity of the battery. As
Jan Feb Mar Apr May Jun0
30
60
90
120
Pow
er (k
W)
Fig. 12. Wind/solar hybrid electric p
a result, the PV and wind turbine respectively generate392,070 kWh/yr and 283,912 kWh/yr as shown in Fig. 12.
Thewind/solar hybrid configuration gives the NPC of $3,545,220with the COE of $0.329/kWh. The NPC of the wind/solar hybridsystem is dominated by the batteries (57.43%) and wind turbine(23.16%) costs as given in Fig. 13.
However, some amount of the energy production cannot beused to supply the load. This mismatch is due to the intermittentnature of wind and solar energy that cannot follow the load con-sumptions perfectly. As the result, there is unmet electric load of20.6% and unused energy production or excess electricity of 5.6% forthis hybrid system configuration. The total load served is about
536,412 kWh/yr or 79.4% of the total demand of 675,982 kWh/yr.To identify how the unmet electric load and excess electricity
occurred, this is done by referring to the day's conditions within theentire year. For example, one day period of load profile atSeptember 22 is as shown in Fig. 14. The electricity demand issupplied by both renewable power output and battery at00.00e03.00 h. The renewable power output comes from wind
Jul Aug Sep Oct Nov Dec
PVWind
roduction of 675,982 kWh/year.
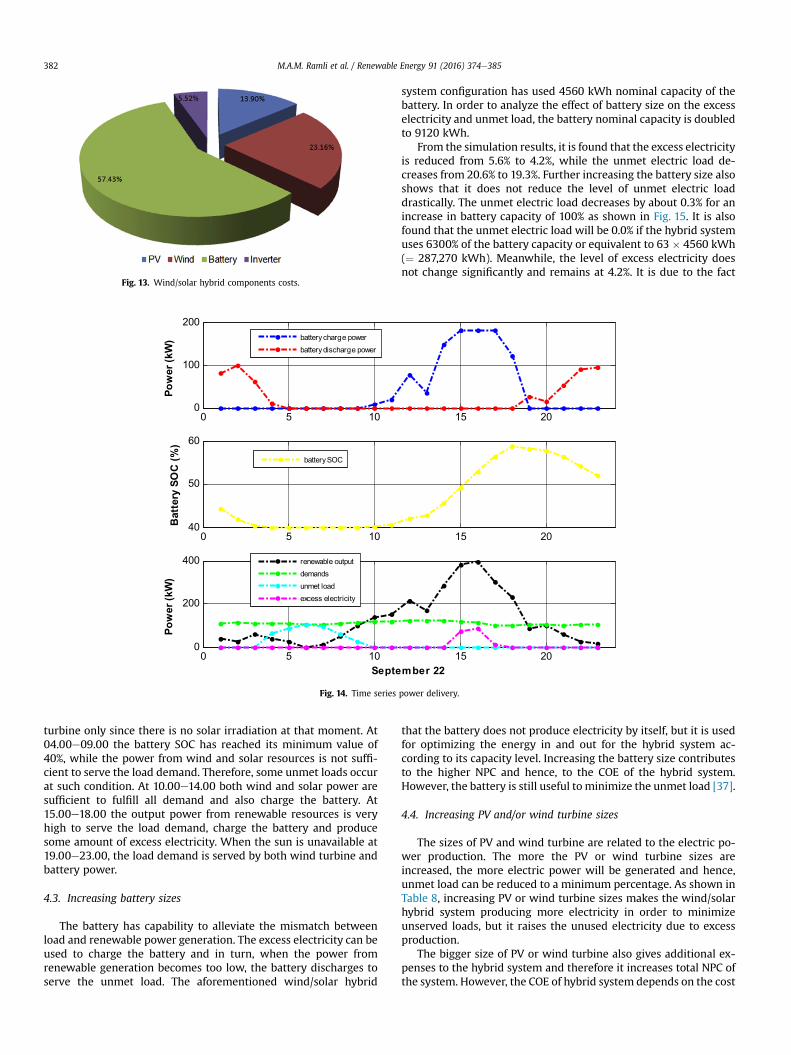
Fig. 13. Wind/solar hybrid components costs.
0 5 10 15 200
100
200
Po
wer (
kW
)
battery charge powerbattery discharge power
0 5 10 15 2040
50
60
Battery S
OC
(%
)
battery SOC
0 5 10 15 200
200
400
September 22
Po
wer (
kW
)
renewable outputdemandsunmet loadexcess electricity
Fig. 14. Time series power delivery.
M.A.M. Ramli et al. / Renewable Energy 91 (2016) 374e385382
turbine only since there is no solar irradiation at that moment. At04.00e09.00 the battery SOC has reached its minimum value of40%, while the power from wind and solar resources is not suffi-cient to serve the load demand. Therefore, some unmet loads occurat such condition. At 10.00e14.00 both wind and solar power aresufficient to fulfill all demand and also charge the battery. At15.00e18.00 the output power from renewable resources is veryhigh to serve the load demand, charge the battery and producesome amount of excess electricity. When the sun is unavailable at19.00e23.00, the load demand is served by both wind turbine andbattery power.
4.3. Increasing battery sizes
The battery has capability to alleviate the mismatch betweenload and renewable power generation. The excess electricity can beused to charge the battery and in turn, when the power fromrenewable generation becomes too low, the battery discharges toserve the unmet load. The aforementioned wind/solar hybrid
system configuration has used 4560 kWh nominal capacity of thebattery. In order to analyze the effect of battery size on the excesselectricity and unmet load, the battery nominal capacity is doubledto 9120 kWh.
From the simulation results, it is found that the excess electricityis reduced from 5.6% to 4.2%, while the unmet electric load de-creases from 20.6% to 19.3%. Further increasing the battery size alsoshows that it does not reduce the level of unmet electric loaddrastically. The unmet electric load decreases by about 0.3% for anincrease in battery capacity of 100% as shown in Fig. 15. It is alsofound that the unmet electric load will be 0.0% if the hybrid systemuses 6300% of the battery capacity or equivalent to 63 � 4560 kWh(¼ 287,270 kWh). Meanwhile, the level of excess electricity doesnot change significantly and remains at 4.2%. It is due to the fact
that the battery does not produce electricity by itself, but it is usedfor optimizing the energy in and out for the hybrid system ac-cording to its capacity level. Increasing the battery size contributesto the higher NPC and hence, to the COE of the hybrid system.However, the battery is still useful to minimize the unmet load [37].
4.4. Increasing PV and/or wind turbine sizes
The sizes of PV and wind turbine are related to the electric po-wer production. The more the PV or wind turbine sizes areincreased, the more electric power will be generated and hence,unmet load can be reduced to a minimum percentage. As shown inTable 8, increasing PV or wind turbine sizes makes the wind/solarhybrid system producing more electricity in order to minimizeunserved loads, but it raises the unused electricity due to excessproduction.
The bigger size of PV or wind turbine also gives additional ex-penses to the hybrid system and therefore it increases total NPC ofthe system. However, the COE of hybrid system depends on the cost

(a)
0 1000 2000 3000 4000 5000 60002
4
6
8
10
12
14
16
18
20
22
Battery Size (%)
Unm
et E
lect
ric
Load
(%)
(b)
0 200 400 600 800 1000 12004.2
4.4
4.6
4.8
5
5.2
5.4
5.6
5.8
Battery Size (%)
Exce
ss E
lect
rici
ty(%
)
Fig. 15. Increasing battery size related to: (a) unmet electric load, (b) excess electricity.
Table 8Hybrid system Configurations.
Configuration (PV, wind turbine) Energy production (kWh/yr) Total load (kWh/yr) Load served (kWh/yr) Unmet load Excess electricity COE ($/kWh)
200-kW, 200-kW 675,982 675,982 536,412 20.6% 5.6% 0.329400-kW, 200-kW 1,075,003 675,982 661,088 2.2% 24.7% 0.313200-kW, 400-kW 961,141 675,982 627,198 7.2% 21.4% 0.357400-kW, 400-kW 1,357,429 675,982 673,395 0.4% 40% 0.370
0
50
100
5
10
15
2020
22
24
26
28
30
32
PV Size (%)Excess Electricity(%)
Unm
et E
lect
ric
Load
(%)
Fig. 16. PV size combination.
M.A.M. Ramli et al. / Renewable Energy 91 (2016) 374e385 383
of producing electricity and the total electric load served as givenby (10). The total NPC of 400-kW PV, 200-kW wind turbineconfiguration is $ 4,037,980 and this value is higher than the 200-kW PV, 200-kW wind turbine configuration ($ 3,545,220). Asshown in Table 8, the COE of 400-kW PV, 200-kW wind turbineconfiguration is cheaper than the 200-kW PV, 200-kW wind tur-bine configuration. It is clear that applying greater sizes of PV thanwind turbine for the wind/solar hybrid system will produce moreenergy and more electricity demands can be served and hence, itdecreases the COE. However, on average wind energy is best atnight while solar PV energy is only available during the day hours.By combining these two renewable resources for a wind/solarhybrid system, it gives an advantage to produce more reliableelectricity.
4.5. Combining PV and wind turbine sizes
The electricity demand used for this study is 675,982 kWh/yr.The PV and wind turbine sizes can be combined to produce totalelectricity of 675,982 kWh/yr. However, this amount of electricityproduction will never meet the electricity demand. This is due tothe intermittent nature of wind and solar energy. Nevertheless, theunmet electric load can be minimized by choosing the best com-bination of PV and wind turbine sizes. As shown in Fig. 16, the bestcombination of systems to obtain the lowest unmet electric load isobtained by using 63% of PV and 37% of wind turbine to generatetotal electricity in the wind/solar hybrid system. This combinationgives 20.8% unserved electric load and 5.4% excess electricity.
According to the total NPC and the COE, employing the PV largerthan wind turbine sizes offers lower total NPC and thus lower COEof the hybrid system (as shown in Figs. 17 and 18). This is becausethe PV is less expensive and generates more electricity than thewind turbine at the same sizes on the site.
4.6. Increasing production capacity
It is clear that making the production capacity of the wind/solarhybrid system as large as the total demand of electricity will lead tosome unserved loads. The production capacity should be greaterthan the total demand of electricity to ensure that the entire load isserved. The ratio of the electricity production capacity to the totalelectricity demand of 150% gives the unmet electric load of 3.30% asshown in Fig. 19. This system is based on a combination of 63% PVand 37% wind turbine with 4560 kWh nominal capacity of thebattery. The larger electricity production capacity gives chance forthe generating system to serve more electricity demand, butincreasing unused electricity is unavoidable. By using the batterycapacity of 22,800 kWh (five times of its initial value), the unmetelectric load decreases to 0.0%, and the excess electricity is reducedslightly from 21.6% to 19.3%. Using a very large size of battery is

0 20 40 60 80 1003
3.2
3.4
3.6
3.8
4
4.2
4.4
PV Size (%)
Tota
l NPC
(mill
ion
$)
Fig. 17. PV size combination vs total NPC.
0 20 40 60 80 1000.3
0.32
0.34
0.36
0.38
0.4
0.42
0.44
0.46
PV Size (%)
CO
E ($
/kW
h)
Fig. 18. PV size combination vs total COE.
100120
140160
510
1520
250
5
10
15
20
25
Elect. Production (%)Excess Electricity(%)
Unm
et E
lect
ric
Load
(%)
Fig. 19. Electricity production capacity.
M.A.M. Ramli et al. / Renewable Energy 91 (2016) 374e385384
uneconomically, however it still plays a significant role in the wind/
solar hybrid system.
5. Conclusion
A technical and economic analysis of wind/solar hybrid systemperformance in west coast area of Saudi Arabia was presentedbased on electricity production and energy cost. For this analysis,the hybrid system configurations have been investigated by takinginto consideration the unmet load and excess electricity as themain key parameters in determining the best combination of sys-tems. Based on the simulation results, it has been demonstratedthat the west coast area of Saudi Arabia has sufficient potentialenergy from wind and solar to provide electricity. However, windturbine produces less energy than PV array of the same size and atthe same site. Wind turbine and battery are important componentsto meet load demand at night hours in a wind/solar hybrid system,despite the fact that both components contribute to the largest costfor the hybrid system. Therefore, it is important to select the bestsize of the wind/solar hybrid system components in order to ensurethat all electricity demands are served with minimum cost of en-ergy production.
Acknowledgment
This work was supported by the Deanship of Scientific Research(DSR), King Abdulaziz University, Jeddah, under grant No. (135-815-D1435). The authors, therefore, gratefully acknowledge the DSRtechnical and financial support.
References
[1] M.A.M. Ramli, A. Hiendro, S. Twaha, Economic analysis of PV/diesel hybridsystem with flywheel energy storage, Renew. Energy 78 (2015) 398e405.
[2] F. Al-Mansour, B. Sucic, M. Pusnik, Challenges and prospects of electricityproduction from renewable energy sources in Slovenia, Energy 77 (2014)73e81.
[3] T. Kuramochi, A. Ramírez, W. Turkenburg, A. Faaij, Techno-economic pros-pects for CO2 capture from distributed energy systems, Renew. Sustain EnergyRev. 19 (2013) 328e347.
[4] Z. Aljarboua, The national energy strategy for saudi arabia, World Acad. Sci.Eng. Technol. 3 (9) (2009) 472e481.
[5] A.H. Almasoud, H.M. Gandayh, Future of solar energy in Saudi Arabia, J. KingSaud Univ. Eng. Sci. 27 (2) (2015) 153e157.
[6] S. Rehman, Wind energy resources assessment for Yanbo, Saudi Arabia, En-ergy Convers. Manag. 45 (2004) 2019e2032.
[7] M.A.M. Ramli, A. Hiendro, K. Sedraoui, S. Twaha, Optimal sizing of grid-connected photovoltaic energy system in Saudi Arabia, Renew. Energy 75(2015) 489e495.
[8] S. Twaha, M.H. Idris, M. Anwari, A. Khairuddin, Applying grid-connectedphotovoltaic system as alternative source of electricity to supplement hydropower instead of using diesel in Uganda, Energy 37 (2012) 185e194.
[9] H. El Khashab, M. Al Ghamedi, Comparison between hybrid renewable energysystems in Saudi Arabia, J Electr. Syst. Inf. Technol. 2 (1) (2015) 111e119.
[10] A.M. Mahbub, S. Rehman, J. Meyer, L.M. Al-Hadhrami, Wind speed and powercharacteristics at different heights for a wind data collection tower in SaudiArabia, Proc. World Renew. Energy Congr. (2011) 4082e4089.
[11] N.M. Al-Abbadi, Wind energy resource assessment for five locations in SaudiArabia, Renew. Energy 30 (2005) 1489e1499.
[12] A. Hepbasli, Z. Alsuhaibani, A key review on present status and future di-rections of solar energy studies and applications in Saudi Arabia, Renew.Sustain Energy Rev. 15 (2011) 5021e5055.
[13] S.H. Alawaji, Evaluation of solar energy research and its applications in SaudiArabia-20 years of experience, Renew. Sustain Energy Rev. 5 (2001) 59e77.
[14] A. Kaabeche, M. Belhamel, R. Ibtiouen, Sizing optimization of grid-independent hybrid photovoltaic/wind power generation system, Energy 36(2011) 1214e1222.
[15] Y. Himri, A.B. Stambouli, B. Draoui, S. Himri, Techno-economical study ofhybrid power system for a remote village in Algeria, Energy 33 (7) (2008)1128e1136.
[16] G. Bekele, B. Palm, Feasibility study for a standalone solar-wind-based hybridenergy system for application in Ethiopia, Appl. Energy 87 (2) (2010)487e495.
[17] M. Dali, J. Belhadj, X. Roboam, Hybrid solar-wind system with battery storageoperating in grid-connected and standalone mode: control and energymanagement - experimental investigation, Energy 35 (6) (2010) 2587e2595.

M.A.M. Ramli et al. / Renewable Energy 91 (2016) 374e385 385
[18] M.O. Abdullah, V.C. Yung, M. Anyi, A.K. Othman, K.B. Ab Hamid, J. Tarawe,Review and comparison study of hybrid diesel/solar/hydro/fuel cell energyschemes for a rural ICT Telecenter, Energy 35 (2) (2010) 639e646.
[19] Z.W. Geem, Size Optimization for a hybrid photovoltaic-wind energy system,Int. J Electr. Power & Energy Syst. 42 (1) (2012) 448e451.
[20] Y. Himri, S. Rehman, B. Draoui, S. Himri, Wind power potential assessment forthree locations in Algeria, Renew. Sustain Energy Rev. 12 (2008) 2495e2504.
[21] Y. Himri, A.B. Stambouli, B. Draoui, Prospects of wind farm development inAlgeria, Desalination 239 (2009) 130e138.
[22] H.E. Garcia, A. Mohanty, W.C. Lin, R.S. Cherry, Dynamic analysis of hybridenergy systems under flexible operation and variable renewable generation ePart I: dynamic performance analysis, Energy 52 (2013) 1e16.
[23] G. Rohani, M. Nour, Techno-economical analysis of stand-alone hybridrenewable power system for Ras Musherib in United Arab Emirates, Energy 64(2014) 828e841.
[24] H. Bahaidarah, A. Subhan, P. Gandhidasan, S. Rehman, Performance evaluationof a PV (photovoltaic) module by back surface water cooling for hot climaticconditions, Energy 59 (2014) 445e453.
[25] P.M. Murphy, S. Twah, I.S. Murhpy, Analysis of the cost of reliable electricity: anew method for analyzing grid connected solar, diesel and hybrid distributedelectricity systems considering an unreliable electric grid, with examples inUganda, Energy 66 (2014) 523e534.
[26] S. Rehman, A. Ahmad, Assessment of wind energy potential for coastal loca-tions of the Kingdom of Saudi Arabia, Energy 29 (2004) 1105e1115.
[27] S. Rehman, Prospects of wind farm development in Saudi Arabia, Renew.Energy 30 (2005) 447e463.
[28] NREL, Getting Started Guide for HOMER Version 2.1, National RenewableEnergy Laboratory, 2005.
[29] International Electrotechnical Committee IEC. 61400e1, Wind Turbines Part1: Design Requirements, third ed., IEC, Geneva, Switzerland, 2005.
[30] International Electrotechnical Committee IEC. 61400e3, Wind Turbines Part3: Design Requirements for Offshore Wind Turbines, first ed., IEC, Geneva,Switzerland, 2009.
[31] D. Saheb-Koussa, M. Haddadi, M. Belhamel, S. Hadji, S. Nouredine, Modelingand simulation of the fixed-speed WECS (Wind Energy Conversion System):application to the Algerian Sahara area, Energy 35 (10) (2010) 4116e4125.
[32] W.A. Beckman, J.A. Duffie, Solar Engineering of Thermal Processes, third ed.,Wiley & Sons, , New York, 1991.
[33] A. Hiendro, R. Kurnianto, M. Rajagukguk, Y.M. Simanjuntak, Junaidi. Techno-economic analysis of photovoltaic/wind hybrid system for onshore/remotearea in Indonesia, Energy 59 (2013) 652e657.
[34] U.S. Energy Information and Administration EIA, Updated Capital Cost Esti-mates for Utility Scale Electricity Generating Plants, EIA, Washington DC,2013.
[35] K. Brecl, M. Topi�c, Energy and economic yield of photovoltaic systems: reac-tive power impact, Elektrotehni�ski Vestn. 81 (1e2) (2014) 9e14.
[36] V. Fthenakis, R. Frischknecht, M. Raugei, H.C. Kim, E. Alsema, M. Held, M. deWild-Scholten, Methodology Guidelines on Life Cycle Assessment of Photo-voltaic Electricity, 2011. Tech. Report IEA-PVPS T12e03.
[37] J.K. Kaldellis, K.A. Kavadias, Cost-benefit analysis of remote hybrid wind-ediesel power stations: case study Aegean Sea Islands, Energy Policy 35(2007) 1525e1538.


