Embed Size (px)
Citation preview

8/13/2019 1-s2.0-0008884692901077-main (1).pdf
http://slidepdf.com/reader/full/1-s20-0008884692901077-main-1pdf 1/8
CEMENT a n d CONCRETE RESEARCH. Vol. 22, pp. 833-840, 1992. Printed in the USA.0008-8846/92. $5.00+00. 1992 Pergamon Press Ltd.
A .C . I M P E D A N C E S P E C T R O S C O P Y
(I): A Ne w Eq uivalen t Circuit Model for Hydrated P o r t l a n d C e m e n t P a s t e
P I N G G U * , P I N G X I E * , J . J . B E A U D O I N * * , R . B R O U S S E A U * *
* Dept. o f Civil Eng., University of Ottawa,
Ottawa,Ont.,Canada, K 1N 6N 5** Materials L aboratory, Institute for Research in C onstruction,
National Research C ouncil, Ottawa,Ont., Canada, K 1A 0R6
(Communicated by Zhong-Wei Wu)
(Received Oct. 21, 1991; in final form Feb. 3, 1992)
A B S T R A C T
A.C . im pedance spec t roscopy has been used to inves t iga te the mechan i sm o f
hydra t ion o f por t land cem ent paste , f rom 48 to 38 0 hours . In te rpre ta tion of a .c.
measu remen t s ob ta ined ove r a w ide f requency range was compl imen ted by
equiva lent c i rcui t model l ing . The proposed equiva lent c i rcui t was chosen so tha t i t s
RC pa rame te r s wou ld phys ica l ly r ep re sen t mic ros t ruc tu ra l e l emen t s o f the cemen t
paste .
I N T R O D U C T I O N
Hydra ted cement paste i s a moisture sensi t ive microporous mater ia l . The main cement hydra t ion
produc t i s c a lc ium s i li c at e hydra te o r C -S-H . T he na tu re o f C -S-H changes w i th hy dra t ion t ime
and re l a t ive humid i ty . The s t ab i l i t y o f C -S-H depends on the va r i a t ion o f env i ronmen ta lcondi t ions as evidenced by changes in morphology, in te rfac ia l regions, pore s t ruc ture and
int r insic s trength . Thes e charac te r is t ics can be s tudied by mean s o f imped ance o r condu ctance
measuremen t s .
Previous appl ica t ions of res is t iv i ty measurements to cement paste invest iga t ions inc lude the
p ionee r ing w ork o f Sh imizu [1 ] . He obse rved an in f l ex ion po in t i n the re s i st ance -t ime d iag ram
for hydra t ing cement corresponding to the comple t ion of se t t ing under i so thermal condi t ions.
Cal le ja observ ed resis tance peaks wh en por t land cem ent is se t under adiaba t ic condi t ions[2] .
Ham mo nd and R obson w ere am ong the f i r s t t o app ly the ir t e chn iques to concre te [3 ] .
Th e a .c . impedan ce techniqu e has been app l ied recent ly to invest iga te the e lec t r ica l proper t ies of
hydra ted cement pastes[4-7] . New informat ion re la ted to microst ruc ture and hydra t ion
mechan i sm was ob ta ined . Impedance re su lt s on hydrated po r t land cem en t ob ta ined by means o f
f requency scanning a re among the ear l ies t to be repor ted . In these s tudies , a s ingle a rc was
obse rved in the h igh f requency range w i th a sma l l pa r t o f second a rc in the low f requency
833

8/13/2019 1-s2.0-0008884692901077-main (1).pdf
http://slidepdf.com/reader/full/1-s20-0008884692901077-main-1pdf 2/8
834 Ping Gu et al. Vol. 22, No. 5
region. The h igh-frequency arc was a t t r ibuted to a bulk cement re la ted e ffec t whereas the low
frequency a rc was due to the e l ec t rode -cemen t in t e r face e f fec t . The Maxwe l l -Wayne r e f fec t
model[8] and o ther compl ica ted equiva lent c i rcui t models[4-7] were proposed in order to
in te rpre t the impedan ce spec tra. Th e in t rinsic proper t ies of the cemen t system tha t lead to theobse rva t ion o f the h igh - frequency a rc and the phys ica l mean ing o f the p ropo sed R C e lemen t s in
the equiva lent c i rcui t models a re however not c lear . In th is paper , a s imple equiva lent c i rcui t
de r ived f rom fundamen ta l cons idera t ions o f c em en t pa s t e hydra t ion i s p roposed . The un iqueness
of th is model i s tha t a physica l meaning has been assigned to each RC e lement to expla in the
impedan ce behav io r o f hydrated cemen t .
N E W E Q U I V A L E N T C IR C U I T M O D E L F O R H Y D R A T E D C E M E N T P A S TE
Imped ance spec tra r eco rded ove r a w ide range o f the f requenc ie s have p rov ided new in fo rma t ion
and insight on cement paste microst ruc ture and hydra t ion . In te rpre ta t ion of an impedance
spec t rum (IS) i s however complex. I t requires model l ing wi th some equiva lent c i rcui t unt i l the
e lec t r ica l response of the e lementa l microst ruc ture of the cement paste i s wel l s imula ted . The
usefulness of the ana lyses i s s t rongly dependent on how the e lec t r ica l components a re se lec ted .
Each RC componen t shou ld have some phys ica l mean ing re l a t ed to the mic ros t ruc tu re o f
hydra t ing cem ent paste .
s o l id l iq u i d
u n i t c e l l
1 s t l a y e r
r n th l y e r
in ter f cese l e c t r o d e
a . c . s i g n a l
e l ect r ode
Figure 1
La ye r mod e l o f hydra t ing po r t land cem en t pa s t e u sed fo r equ iva len t c ir cu it s imu la tions .
Hy dra te d cem ent paste i s f requent ly v iew ed as an insulat ing porous m atr ix , i ts pores f i l led w i th a
conduct ive e lec t ro ly te . Elec t r ica l conduct ion through paste samples i s made possib le by the ne t
m ovem en t o f cha rge ca r ry ing ions such a s C a ++ , Na + , OH - and SO4= in the so lu t ion of i t s
con t inuous mic ropore ne twork . The mic ros t ruc tu re and the chemis t ry o f the po re so lu t ion o f
cement paste s t rongly a ffec t i t s e lec t r ica l impedance proper t ies . Consider a cement paste
spec imen to which the a .c . s igna l i s appl ied in Figure 1 .The spec imen is d iv ided hor izonta l ly
into m layers in the direction of the electric field. I t is postulated that three basic elements: sol id
(unhydra ted cement and hydra t ion products) , l iquid (so lu t ion in the micro-pores or capi l la r ies) ,
and sol id- liquid in te rfac ia l phas es ex is t in each layer of the cement paste . I t i s a lso assu me d tha t

8/13/2019 1-s2.0-0008884692901077-main (1).pdf
http://slidepdf.com/reader/full/1-s20-0008884692901077-main-1pdf 3/8
Vol. 22, No. 5 AC IMPEDAN CE SPECTROSCOPY ,CEME NT PASTE 835
ea ch div ided layer contains n "sol id- l iquid in ter face unit cel l s" il lus t rated sch em at ical ly in Figure
2a. T he ionic charges align the m selv es along the in ter face in paral lel wi th the d i rect ion o f the
elec t r ic f ie ld wh en the a .c . s ignal i s appl ied . Sim i larly , the induced opposi te cha rges l ine up in
the sol id s ide, like a charge p lane , para l lel to the solid- liquid in ter face. T he resul t ing separat ionof charges s imulates an elect r ic capaci tor capable of s tor ing elect r ic charge. The "uni t cel l "
m odel shown in F ig .2a can be r ep rese n t ed by an equ iva len t c i rcu it , ind i ca t ed i n F ig .2b, i n wh ich
the R s , R 1, Rin t and Cin term s are the res i s tance o f so lid, l iquid and in ter fa ce p hases , and the
capa ci tance o f so lid- liquid in ter fa ce f or a s ingle "uni t cel l " , respect ively .
a )
interl ces
l i q u i d
b )
C l n t C i n t
e ) I iR s L
CINT
R ~ r
Figure 2
(a) . Schem at ic of the "sol id- l iquid in ter fac e unit cel l " mod el ; (b) . The corres pon ding
equivalent circui t for a s in gle la ye r of ce m en t paste; (c). The s impl i f ied equ ivalent ci rcui t
fo r o ne l ayer o f ceme n t paste .
Sinc e i t is assumed that in eac h lay er of c em en t paste there are n "unit cel l s" , the imp edan ce of
that lay er can be expressed by n u ni t equ ivalent ci rcui t s in series . This m ul t ip le equivalen t ci rcui t
can even tua l ly be s impl i fi ed in to t he c i r cu i t d isp l ayed in F igure 2c, and the im pedan ce o f one
laye r o f c em ent paste, Z L i s :
Zt. = Rs+L + 1 / ( 1/R ig + jcx)Cxr~r) (1)
wh ere t he co r respond ing RC parameter s a re as fol lows :
RS,L= n ( R , + Rt ) (2)
an d
RI= 2nRi~ (3)
C I= C m ~ n (4 )

8/13/2019 1-s2.0-0008884692901077-main (1).pdf
http://slidepdf.com/reader/full/1-s20-0008884692901077-main-1pdf 4/8
836 Ping Gu et al. Vol. 22, No. 5
The t o t a l i m ped ance ne t wo r k o f t he who l e b l ock o f c em en t pa s t e is cons i de r ed t o be equa l to t ha t
of m layers in para l l e l , i . e . :
1/'-Z~ot~l = 1/ Z L t+ lf/-,L2+ .... .. + 1/ZL ~ (5)
I f eve r y l aye r is i den t i ca l ,
1/Z~ot~ = m / Z L (6)
o r
Z t o , ~ l = ZL/m (7)
Equa t i on ( 7 ) i nd i ca t e s t ha t t he t o t a l i m pedance o f a c em en t pa s t e can be equ i va l en t t o a s i m p l e
e l ec t r i c a l c i r cu i t a s exh i b i t ed i n F i g . 3 . The RC pa r am e t e r s r ep r e s en t t he t o t a l r e s i s t ance o rcapac i t ance o f a c em en t pa s t e . The i r phys i ca l m e an i ngs a r e de f i ne d a s f o l l ows :
ulk e m e n t e ff e t e l e c t r o d e effect
C t i n t ) C d l
R t i n t ) P e t
Fi gu r e 3
A s i m p l i f i ed equ i va l en t c i r cu i t
f o r h y d r a t i n g c e m e n t p a s te .
R l ( s + l ) : The s u m o f the b u l k s o l i d and l i qu id phas e r e s i s tances . S i nce t he bu l k s o l i d r e s is t ance i s
a l wa ys m uch l a r ge r than t h a t o f l i qu i d phas e i n cem en t pa s t e t he con t r ibu t i on o f t he l i qu i d phas e
r e s i s t ance can be con s i de r ed n eg l i g ib l e .
R t i n t ) : The s o l i d - l i qu i d i n t e r f ace r e s i s t ance . I t i s no t ed t ha t t he s t r uc t u r e o f t he i n t e r f ac i a l
r eg i on be t ween t he s o l i d s u r f ace and l i qu i d i s d i f f e r en t f r om t ha t o f bo t h bu l k s o l i d and l i qu i d
phas e s . The i r conduc t i on p r ope r t i e s a r e , t he r e f o r e , d i f f e r en t . I n t he hydr a t ed cem en t s ys t em ,
s i nce t he s i z e o f c em en t pa r t ic l e s and co r r e s po nd i ng hyd r a t ed p r oduc t s is m i nu t e ( r an ge o f a f ew
Hm i n d i am e t e r ) , t he con t r i bu t i on o f t he i n t e r f ace r e s i s tance t o t he cem en t e l ec t r i c a l p r ope r t i e s isl ike ly to be s igni f i cant .
C t ( i n t ) : The s o l i d - l iqu i d i n t e r f ace capac i t ance . Th i s com pon en t is a t tr i bu ted t o t he i ons ad s o r bed
ch em i ca l l y o r phys i ca l l y i n t he i n t e r f ac i a l a rea i n s i de t he m ac r opor e s o r c ap i l la r i e s , a c t i ng a s t i ny
"do ub l e - l a ye r c apac i t ance un i t s " when t he e l ec t r ic f i e l d i s app li ed . I t is no t ed t ha t e ach un i t i s no t
a pu r e capac i to r , bu t r a t he r a l e aky one a s i t c an be s e l f- d i s cha r ged , s i m i l a r t o a p o l a r i zed m e t a l -
s o l u t i on i n t e r -phas e obs e r ved i n e l ec t r ochem i s t r y . Th e e f f ec t c an a l s o be due t o t he geo m e t r i ca l
f ac t o r s s uch as po re s i z e and conn ec t i v i t y i n cem en t pa st e , r e s u l t ing i n u nev en cha r ge
d i s t r i bu t i on . I t i s a l s o em phas i zed t ha t on l y t hos e t i ny "doub l e l aye r c apac i t o r s " no r m a l t o t he
e l ec t r i c f i e l d con tr i bu te t o t h i s appa r en t c apac i t ance , w i t h no con t r i bu ti ons f r om t hos e pa r a l l e l t othe f i e ld .
Ca l l : Th i s i s t he e l ec t r ode - cem en t s ys t em i n t e r f ace o r s o - ca l l ed doub l e l aye r c apac i t ance , Cd l .
T h e f o r m a t i o n o f C d l i s d u e t o t h e e x i s t e n c e o f a b o u n d a r y b e t w e e n t h e e l e c t r o d e a n d c e m e n t
8/13/2019 1-s2.0-0008884692901077-main (1).pdf
http://slidepdf.com/reader/full/1-s20-0008884692901077-main-1pdf 5/8
Vol. 22, No. 5 AC IMPEDANCE SPECTROSCOPY, CEMENT PASTE 837
matrix in which a basic anisotropy in the force operating on the ionic particles causes a
redistribution of the mobile charges and orientable dipoles.This redistribution is the structural
basis of the potential difference across the inter-phase and resulting in the charge alignment at
both the cement(with its electrolyte) and electrode surfaces. The inter-phase behaves as acapacitor. This cement-electrode capacitance effect always exists and its signal is usually pickedup in the low frequency range.
Rct: The charge transfer resistance. When charges are separated, a potential difference develops
across the interphase so that to transfer a charge an energy barrier or so-called activation energy
has to be overcome. Rct represents this required energy in an electrochemical reaction. In a non-
electric-polarization system, Rct is usually very large. In our study, the cement-electrode surface
reactions are carefully avoided.
It is also noted that depression of the high frequency arc can occur due to geometrical factorsresulting in a spread of relaxation time of the ions. This has not been taken into account in the
present equivalent circuit model. It will be discussed in a subsequent contribution.
EXPERIMENTAL
Materials: Type 10 portland cement was used. The chemical composition (wt.%) is as follows:
SIO2=19.83; CAO=61.21; Fe203=3.20; A1203=4.18; MgO=4.09; SO3---3.93; Na20=0.45 and
K20=0.82.
Specimen Preparation: The fresh cement paste was mixed in a conventional Hobart mixer at a
water/cement ratio 0.35, and placed into a 1.2 cm x 1.5 cm stainless steel cylindrical cell
described previously[9]. The sample was left in a 100% relative humidity environment for 24
hours and subsequently immersed in l ime solution for the remainder of the test period.
Impedance Measurements: Impedance data was collected using a 1260 impedance gain-phase
analyzer from Schlumberger Technologies. Measurements were made logarithmically down in
frequency range from 20 Mhz to 1 Hz with 10 readings per decade.
RESULTS AND DISCUSSIONS
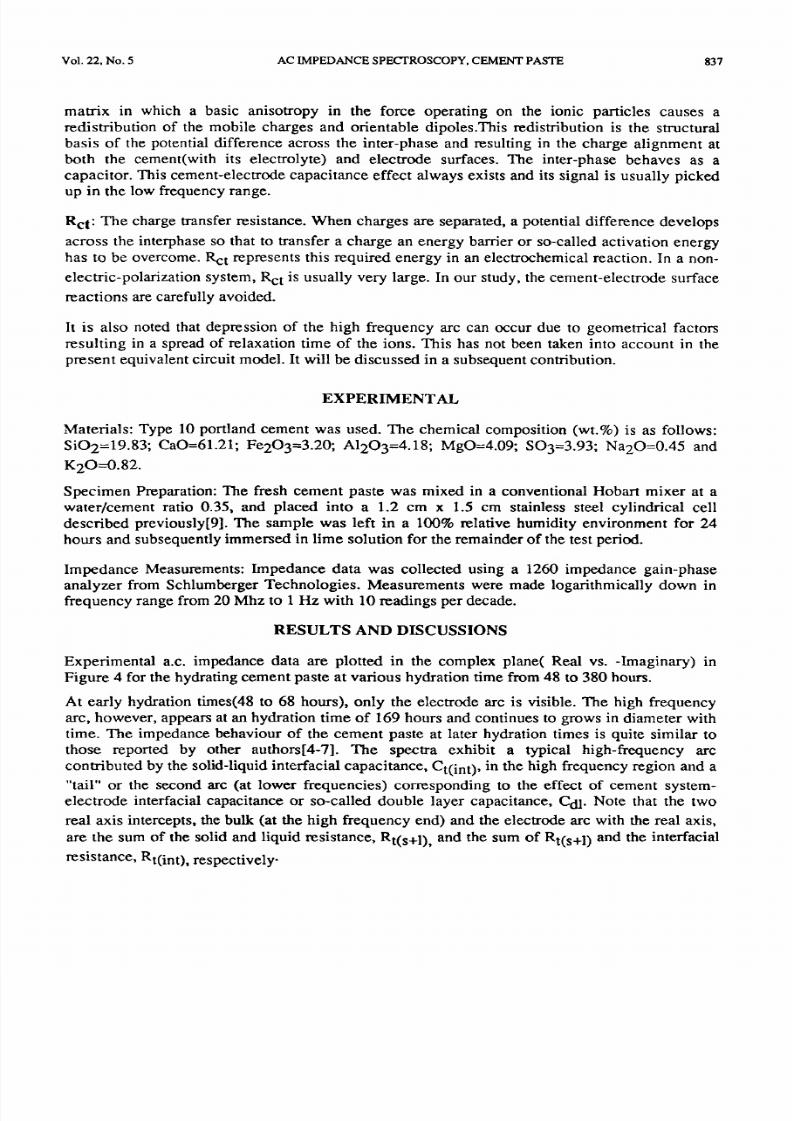
Experimental a.c. impedance data are plotted in the complex plane( Real vs. -Imaginary) in
Figure 4 for the hydrating cement paste at various hydration time from 48 to 380 hours.
At early hydration times(48 to 68 hours), only the electrode arc is visible. The high frequency
arc, however, appears at an hydration time of 169 hours and continues to grows in diameter with
time. The impedance behaviour of the cement paste at later hydration times is quite similar to
those reported by other authors[4-7]. The spectra exhibit a typical high-frequency arc
contributed by the solid-liquid interfacial capacitance, Ct(int), in the high frequency region and a
tail or the second arc (at lower frequencies) corresponding to the effect of cement system-
electrode interfacial capacitance or so-called double layer capacitance, Cdl. Note that the two
real axis intercepts, the bulk (at the high frequency end) and the electrode arc with the real axis,
are the sum of the solid and liquid resistance, Rt(s+l) ' and the sum of Rt(s+l) and the interfacial
resistance, Rt(int) respectively.
8/13/2019 1-s2.0-0008884692901077-main (1).pdf
http://slidepdf.com/reader/full/1-s20-0008884692901077-main-1pdf 6/8
8 3 8 P i n g Gu e t a l . Vo l . 2 2 , No . 5
100
i 6
70 90 110 130 150 1 7 0
Figure 4
Real vs Imag inary com ponen t o f
imp edan ce o f hydra t ed cem en t pas te ,
w/c=0.35, hydrated for var ious t imes.
Re~ ohms)
The delayed appearance of the h igh f requency arc i s evidence that the capaci t ive behaviour i s
related to m icrostructure chang es dur ing the cem ent hydrat ion process of the tes ted sample. The
sequent ial imp edance spect ra , Figure 4 , are in terpreted as fo l lows. A t ear ly hyd rat ion times, the
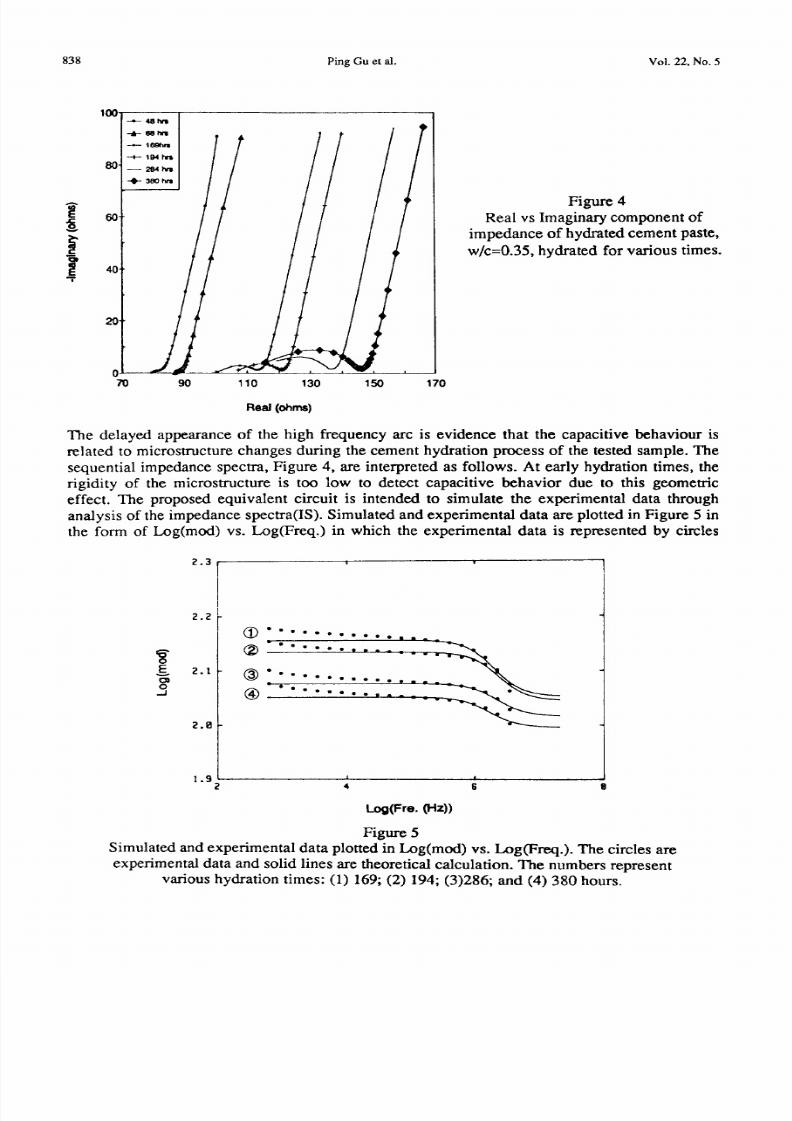
r ig id i ty of the microst ructure i s too low to detect capaci t ive behavior due to th i s geometr icef fect . The proposed equivalent ci rcui t i s in tended to s imulate the exper imental data through
analysis of the impedan ce spect ra( IS) . Simulated and expe r imen tal data are p lo tted in Figure 5 in
the form of Log(mod) vs . Log(Freq.) in which the exper imental data i s represented by ci rcles
2 . 3
O ~
O. . . J
2 . 2
2 . 1
2 8
®
11 9 4 6 9
l_og Fre. Hz))
Figure 5
Simulated and exper ime ntal data p lo t ted in Log(m od) vs. L og(Freq.) . T he ci rcles are
exper imental data and sol id l ines are theoret ical calculat ion . The num bers representvarious hy drat io n time s: (1) 169; (2) 19 4; (3)286; an d (4) 380 hou rs.

8/13/2019 1-s2.0-0008884692901077-main (1).pdf
http://slidepdf.com/reader/full/1-s20-0008884692901077-main-1pdf 7/8
Vol. 22, No. 5 AC IMPEDAN CE SPECTROSCOPY,CEMEN T PASTE 839
and the so l id lines a re ca lcula ted according to our m odel . T he mo dulus: IZl = [ (Rea l ) 2 +
(Imaginary)2] 1 /2 . The s imula ted resul ts of four hydra t ion t ime, i .e . 169, 194, 286 and 380 hours
as indica ted in numb er 1 to 4 , respec t ive ly .
I t i s apparent tha t the s imula t ion i s exce l lent in the range of Log(Freq. )>5 where the h igh
frequency arc appears . In th is region re l iable RC parameters can be acquired . In the region
Log(Freq, )<5, the exper imenta l da ta undula tes upwards, as the contr ibut ion of cement system-
e lec t rod e doub le layer capac i t ive e ffe c t is ev ident .
A l i s t of a ll s imula ted RC param eters i s g iven in Table 1 . I t can be seen tha t, wi th the increase of
hydra t ion t ime, (a ) the sum resis tance of so lid and liquid , Rt(s+l) increases to a cer ta in v a lue
and then approaches a constant; (b) the interfacial resistance, Rt(int) ,a lso increases as a function
of t ime; and (c) the solid-l iquid interfacial capacitance, Ct(int) , decreases with hydration t ime.
Th e capac i tance va lues e s tima ted from the top f requency o f the bu lk a rc a re a l so g iven in Tab le1 . Even though these est imated va lues a re s l ight ly la rger than those f rom the s imula t ion , the
decreasing t rend is s t i l l there . These observa t ions a re consis tent wi th the previous work by
M cC arte r e t a113,4] and Scuder i e t ai [5 ,9] but the exp lana t ions g iven here a re d i f fe rent .
Tab le 1 . Var ia t ion in mod el led and exper imenta l b y de te rmin ed e lec t r ica l parameters
with increasinl; hydration t ime.
Hydra t ion
Time(hours)
48
Rt0+l)
( o h ms )
80
68 87169 99
194
286
380
104
111
113
Rt(-m0 Ctfm0 C_x, am, ~ T o p Fre q .(ohms) (nF) (nF) (MHz)
13.5 7.2 12.0 0.978
15.0 5 .0 10.8 0.978
25.0 3.2 4.2 1.506
30.0 3.0 3.5 1.506
Th e increase o f the Rt(s+l) (h igh f reque ncy arc) f rom 80 ohm s to 99 ohm s in the ear ly hydra t ion
t ime is more rapid than a t la te r hydrat ion times i .e . 99 ohm s to 113 ohms. This i s because of the
signi f icant loss of the f ree water dur ing the ear ly days of the cement hydra t ion process .
However , once the degree of hydra t ion reaches a cer ta in leve l and the major i ty of f ree water i s
consu med , the m ic rost ructu ral e f fect s beg in to be o bse rved . The change o f R t ( s+ l ) is m a in ly due
to the d i f fe rence in resis t iv i ty va lues of the unhydra ted cement and i t s hydra t ion products ,
pr inc ipa l ly C-S-H. I t i s reasonable to expec t tha t there i s not much d i f fe rence in resis t iv i ty
be tw een the so l id reac tants and the so l id products ; hence , the v a lue of R t(s+l) remains re la t ive ly
constant .
The inc rea se s o f the a rc d iame te r w i th t ime can b e exp la ined w e l l w i th the p roposed new m ode l .
I t i s useful to re f lec t on the physica l meaning of the model parameters . The a rc d iameter
represen ts the so l id- l iquid in te rfac ia l res is tance ,Rt( in t ) . O nc e hyd ra t ion proce eds, the mechanism
involves d issolu t ion of anhydrous cement compounds to the i r ionic const i tuents , format ion ofhydra tes in the so lu t ion , and due to the i r low solubi l i ty , eventua l prec ip i ta t ion of the hydra tes
from the supersa tura ted so lu t ion . These hydra t ion reac t ions genera te a t remendous amount of
in te rfac ia l a rea which has im pedance proper t ies d i f fe rent f rom both bu lk so l id and l iquid phases .
Signi f icant in te rfac ia l a rea i s manifested by increasing va lues of the so l id- l iquid in te rfac ia l
resis tance , Rt( in t ) . This p oin t can a lso be expla ined by the equa t ion (3) where n i s the num ber o f
8/13/2019 1-s2.0-0008884692901077-main (1).pdf
http://slidepdf.com/reader/full/1-s20-0008884692901077-main-1pdf 8/8
840 Ping Gu et al. Vol. 22, No. 5
" the so l id- l iquid uni t ce l l" . I t i s obvious tha t n increases wi th hydra t ion t ime s ince more
prec ip i ta tes occur leading to more so l id- l iquid in te rfaces . The t rend of decreasing capac i tance
readings wi th hydra t ion t ime can a lso be expla ined by a s imi la r a rgument . Al l the in te rfaces
possess a capac i t ive component a rranged in se r ies . ,The measured capac i tance va lues decreasewi th n increasing accord ing to equa t ion (4) .
C O N C L U S I O N S
A.C . impedance spec t roscopy is a u se fu l t oo l fo r fo l lowing m ic rost ruc tu ra l changes o f a c emen t
paste . The a .c . spec t ra have been ana lyzed wi th some success using equiva lent e lec t r ica l c i rcui t
mode l s c a re fu l ly chosen so the componen t s have phys ica l mean ing wi th re spec t t o the cemen t
hydra tion p rocess . Co nc lus ions d rawn f rom the m ode l l ing p rocess inc lude the fo l lowing :
( i ) The s igni f icant decrease in f ree water content in the ear ly hydra t ion t ime causes the rapid
increase of Rt(s+l) . The sol id resis tance mainly contr ibutes to Rt(s+l) in the la te r s tages of the
hydra t ion process .
( i i ) The growth in d iameter of the h igh f requency arc i s d i rec t ly re la ted to the increase in the
num ber o f in t e rface s. D i f fe ren t impedance p rope r ti e s o f the in t e rface a re de r ived f rom bo th so l id
and l iquid phases dur ing the hydra t ion proc ess .
( ii i) The te rms Rt( in t ) and Ct( in t ) a re h ighly depend ent on the in te rface microst ruc ture . T hey can
be used to charac te r ize q ua l i ta t ive ly the degree o f hydra t ion and exten t of microst ruc tura l chang e
of cem en t pa s t e .
A C K N O W L E D G M E N T S
The au tho rs w ou ld l ike to thank M ssrs. B . M yers and Gord on C han fo r the ir a ss i s tance w i th the
expe r imen ta l appa ra tus . T he f inanc ial suppor t o f NS ER C and the Ne tw ork o f Cen te rs o f
Exce l l ence on H igh Pe r fo rm ance C onc re te is g ra t efu l ly acknow ledged .
R E F E R E N C E S
[1] Shim izu, Y . , Con cre te Cem ent M il l. Sec t . , 111 (1929) .
[2] Cal le ja , J . , J . Amer . Con. Inst . , 23 ,525-535 (1952) .[3] Ham mo nd , E . and R obson , T . D . , The Eng inee r , 199 , Jan .21 , 78 -80 (1955) .
[4] M cCarte r , W . J ., Garvin , S . , and Bo uzid , N. , J . M ater . Sc i . Le t t . , 7 (10) , 1056-1057 (1988) .
[5] McCarte r , W. J . , and Brousseau, R . , Cem. Conc . Res. , 20 891-900 (1990) .
[6] Branterv ik , K . , and Niklasson , G. A. , Cem. C onc . Res. , 21 469-508 (1991) .
[7] Scude r i , C . A. , Maso n, T. O. , and Jennings, H . M. , J . M ater . Sc i . Le t t. , 26 349-353 (1991)
[8] Bonanos, N. , Stee le , B . C . H. , But le r , E. P . , Johnson, W. B. , Worre l l , W. L. , MacDonald , D.
D . , and McKubre , M. C . H . , " App l i ca t ion o f Impedance Spec t roscopy" , Chp t . 4 , Ed . ,
M cDona ld , J . R . , W i ley & Sons , NY , 1987 .
[9] Chris tensen, B . J . , M ason , T. O. , and Jennings, H . M . , J . Mater . Sc i . Le t t . , in press .


