Embed Size (px)
Citation preview
University of Plymouth
PEARL https://pearl.plymouth.ac.uk
01 University of Plymouth Research Outputs University of Plymouth Research Outputs
2018-10
Rising levels of temperature and CO2
antagonistically affect phytoplankton
primary productivity in the South China
Sea.
Zhang, Y
http://hdl.handle.net/10026.1/12579
10.1016/j.marenvres.2018.08.011
Marine Environmental Research
Elsevier
All content in PEARL is protected by copyright law. Author manuscripts are made available in accordance with
publisher policies. Please cite only the published version using the details provided on the item record or
document. In the absence of an open licence (e.g. Creative Commons), permissions for further reuse of content
should be sought from the publisher or author.

1
Rising levels of temperature and CO2 antagonistically affect phytoplankton primary 1
productivity in the South China Sea 2
3
4
Yong Zhang1, Tifeng Wang1, He Li1, Nanou Bao1, Jason M. Hall-Spencer1,3,4, 5
Kunshan Gao1,2* 6
7
1State Key Laboratory of Marine Environmental Science and College of Ocean and 8
Earth Sciences, Xiamen University, Xiamen 361005, China 9
2Laboratory for Marine Ecology and Environmental Science, Qingdao National 10
Laboratory for Marine Science and Technology, Qingdao 266071, China 11
3Marine Biology and Ecology Research Centre, University of Plymouth, United 12
Kingdom 13
4Shimoda Marine Research Centre, University of Tsukuba, Japan 14
15
16
Running head: Temperature and CO2 on primary productivity 17
18
*Corresponding author: State Key Laboratory of Marine Environmental Science and 19
College of Ocean and Earth Sciences, Xiamen University, Xiamen 361005, China 20
E-mail address: [email protected] 21
22

2
ABSTRACT 23
Coastal and offshore waters in the South China Sea are warming and becoming 24
acidified due to rising atmospheric levels of carbon dioxide (CO2), yet the combined 25
effects of these two stressors are poorly known. Here, we carried out shipboard 26
incubations at ambient (398 μatm) and elevated (934 μatm) pCO2 at in situ and in 27
situ+1.8 oC temperatures and we measured primary productivity at two coastal and 28
two offshore stations. Both warming and increased CO2 levels individually increased 29
phytoplankton productivity at all stations, but the combination of high temperature 30
and high CO2 did not, reflecting an antagonistic effect. Warming decreased Chl a 31
concentrations in off-shore waters at ambient CO2, but had no effect in the coastal 32
waters. The high CO2 treatment increased night time respiration in the coastal 33
waters at ambient temperatures. Our findings show that phytoplankton assemblage 34
responses to rising temperature and CO2 levels differ between coastal and offshore 35
waters. While it is difficult to predict how ongoing warming and acidification will 36
influence primary productivity in the South China Sea, our data imply that predicted 37
increases in temperature and pCO2 will not boost surface phytoplankton primary 38
productivity. 39
40
Keywords: Chl a; night time respiration; ocean acidification; ocean warming; 41
primary productivity; South China Sea 42
43
44

3
1. Introduction 45
46
Rising atmospheric carbon dioxide (CO2) concentrations are warming and 47
acidifying the oceans worldwide (Caldeira and Wickett, 2003; IPCC, 2014), including 48
the South China Sea (Ji et al., 2017). On average, surface seawater temperatures are 49
projected to increase by 1.51–3.22 oC by the end of this century and CO2 levels to 50
increase from the current level of about 400 μatm up to 1000 μatm (Boyd et al., 2015). 51
Ocean warming and acidification are expected to affect the physiology, distribution 52
and structure of phytoplankton communities (Hare et al., 2007; Feng et al., 2009; 53
Taucher et al., 2012; Sommer et al., 2015; Riebesell et al., 2017). 54
Rising CO2 levels can increase the availability of dissolved inorganic carbon (DIC) 55
for phytoplankton carbon fixation, but they are also causing seawater acidification, 56
and this may inhibit algal calcification and photosynthetic carbon fixation (Falkowski 57
and Raven, 2007; Gao and Zheng, 2010; Gao et al., 2012; Brodie et al., 2014). Thus, 58
algal responses to increasing CO2 levels are dependent on the balance between the 59
positive effects of increasing DIC and the negative effects of decreasing pH (Wu et al., 60
2008; Bach et al., 2015; Liu et al., 2017). Several studies report that, in comparison to 61
current CO2 levels, elevated CO2 (800–1000 μatm) increases productivity of 62
phytoplankton assemblages that are dominated by diatoms (Kim et al., 2006; Tortell et 63
al, 2008; Domingues et al. 2014; Engel et al., 2014; Johnson et al. 2015). Others have 64
found that rising CO2 levels can decrease the productivity of phytoplankton 65
communities dominated by the coccolithophore Emiliania huxleyi (Delille et al., 2005; 66

4
Riebesell et al., 2017). Paradoxically, an increase in CO2 concentrations from 385 to 67
800 μatm decreased the productivity of surface phytoplankton assemblages dominated 68
by diatoms in the South China Sea under natural fluctuating solar radiation (Gao et al., 69
2012). These discrepancies highlight the fact that the effects of rising CO2 on 70
C-fixation are dependent on algal community composition as well as regional 71
environmental conditions (Egge et al., 2009; Gao et al., 2012; Celis-Pla et al. 2015; 72
Holding et al., 2015; Hoppe et al., 2018). 73
On a global scale, by using satellite records and in situ monitoring, rising 74
temperatures have been shown to reduce phytoplankton productivity in the open 75
ocean (Boyce et al., 2010; Siegel et al., 2013), because increased thermal stratification 76
of the water column can starve the algae of nutrients (Doney et al., 2006; Kletou and 77
Hall-Spencer, 2012). In general, it seems that photosynthetic C-fixation increases with 78
increasing temperature, reaches a maximum and decreases thereafter (Beardall and 79
Raven, 2004). Optimal temperatures for C-fixation differ between latitudes and 80
seasons, with small phytoplankton species functioning optimally at higher 81
temperatures than larger species (Daufresne et al., 2009; Finkel et al., 2010; Sommer 82
et al., 2015; Wolf et al., 2017). Carbon fixation was reduced when temperatures were 83
experimentally increased in cold adapted phytoplankton assemblages (Wohlers et al., 84
2009; Wolf et al., 2017). However, increases from 27 oC to 30 oC enhanced 85
photosynthetic C-fixation in incubations of samples of surface phytoplankton 86
assemblages from two stations off China (Gao et al., 2017). Regional differences in 87
physicochemical conditions may drive different responses of phytoplankton to ocean 88

5
climate change. 89
Temperature affects cellular membrane permeability, cell size of a single 90
phytoplankton cell and the uptake of dissolved inorganic carbon (Beardall and Raven, 91
2004) and so has fundamental control over the effects of changing carbonate 92
chemistry on photosynthetic C-fixation. For example, when CO2 concentrations were 93
increased from 390 to 690 μatm, C-fixation of a phytoplankton community at 12 oC 94
(in situ temperature) decreased in the North Atlantic spring bloom area, whereas at 16 95
oC rising CO2 levels enhanced C-fixation (Feng et al., 2009). Increasing CO2 levels 96
(from 150 to 300 μatm) combined with rising temperature (from –1 oC to 7 oC) 97
synergistically enhanced phytoplankton productivity in the European Arctic Ocean, 98
and the positive effect of rising CO2 on productivity was lower at 6 oC than at 1 oC 99
(Holding et al., 2015). Furthermore, elevated temperature reversed the positive effect 100
of rising CO2 on phytoplankton assemblages off Svalbard and did not affect the 101
response of phytoplankton primary productivity in coastal Arctic and subarctic 102
seawater to rising CO2 (Coello-Camba et al., 2014; Hoppe et al., 2018). These results 103
show that rising temperature and increasing CO2 can have synergistic or antagonistic 104
effects on the productivity of marine phytoplankton assemblages. Given that the 105
carbon cycle underpins the ecology and fisheries productivity of marine ecosystems, 106
region-specific research is urgently needed to assess whether rising atmospheric CO2 107
levels will positively or negatively affect photosynthetic production. 108
In this work, we performed shipboard incubations at two coastal and two off-shore 109
stations in the western South China Sea in autumn 2017 and measured photosynthetic 110

6
C-fixation rates and Chlorophyll a (Chl a) concentrations. Our aim was to assess how 111
rising levels of pCO2 and temperature are likely to affect coastal and offshore 112
productivity in the South China Sea. 113
114
2. Materials and methods 115
116
2.1. Sampling and culture condition 117
This study was carried out aboard RV ‘Shiyan III’ in off-shore and coastal waters of 118
the South China Sea from 11th September to 12th October, 2017 (Fig. 1). Surface 119
seawater (0–2 m) was collected with a 8 L acid-cleaned plastic bucket and stored in a 120
30 L acid-cleaned polycarbonate tank at 9:00 a.m. to 10:00 a.m., at station S1 (12.99o 121
N, 113.50o E) on September 21, station S2 (14.01 o N, 113.01 o E) on September 22, 122
station S3 (17.75 o N, 110.65 o E) on October 2, and station S4 (18.30o N, 111.29o E) 123
on October 3, respectively. Surface seawater at each station was filtered through a 200 124
μm mesh, and then dispensed into twelve 2 L Nalgene bottles. 1 μmol L–1 NaNO3 and 125
0.5 μmol L–1 NaH2PO4 was added into the seawater in all treatments to stimulate 126
phytoplankton growth (Chen et al., 2004; Tseng et al., 2005; Celis-Plá et al., 2015). 127
Six bottles for ambient temperature treatment were put into one deck incubator 128
(120 cm × 85 cm × 25 cm) bathed with flowing surface seawater. Six bottles for the 129
elevated temperature treatment were put into another deck incubator with an 130
auto-temperature control system (Fig. S1) which fitted with two circulating coolers 131
(AL36G-160, Shenzhen Aolinghengye Ltd., China) during the day, and heated at 132

7
night (Aqua Zonic, Shanghai AiKe Ltd., China). Temperatures in both incubators 133
were measured hourly (Fig. 2A). Bottles were held in place using wire mesh with a 134
pore size of 11.5 cm (Fig. S1). Three bottles of seawater in each incubator were 135
bubbled with filtered (PVDF 0.22 μm pore size, simplepure, Haining) ambient air 136
(~400 µatm) or air of elevated CO2 (~1,000 µatm) during the incubation periods, 137
respectively. The high CO2 concentration was controlled using a CO2 enricher 138
(CE100B, Wuhan Ruihua Instrument & Equipment Ltd., China). An Eldonet 139
broadband filter radiometer (ELDONET, Real Time Computer, Germany) was used to 140
measure the incident solar radiation (Fig. 2B), and solar light intensities and weather 141
condition were similar during the incubation periods. The positions of the bottles were 142
changed three times per day to ensure they were exposed equally to sunlight. Our four 143
treatments were: low temperature and low CO2 (LTLC), low temperature and high 144
CO2 (LTHC), high temperature and low CO2 (HTLC), high temperature and high CO2 145
(HTHC). Each treatment had three replicates and the incubations were run for 6 days. 146
147
2.2. pHnbs, total alkalinity and nutrient concentrations measurements 148
pHnbs (NBS scale) was measured before incubation, 24 hrs after incubation and at 149
the end of the 6 days experiment. At about 10:00 a.m., 20 mL samples for pHnbs 150
measurements were taken from the bottles and measured immediately at 25 oC with a 151
pH meter (Benchtop pH, Orion 8102BN) calibrated with an equimolar pH buffer (Tris152
•HCl, Hanna) which is isosmotic with seawater (Dickson, 1993). Total alkalinity (TA) 153
was measured before incubation and at the end of the incubation. At 10:00 a.m. to 154

8
10:30 a.m., 100 mL samples for TA measurements were filtered (GF/F filter) by 155
gentle pressure with 200 mbar in the pump (GM-0.5A, JINTENG). 100 μL saturated 156
HgCl2 solution was added into the TA samples which were stored at 4 oC. TA was 157
measured at 25 oC in the laboratory by potentiometric titration (AS-ALK1+, Apollo 158
SciTech) according to Dickson et al. (2003). Carbonate chemistry parameters were 159
calculated from TA, pHnbs, phosphate, silicate, temperature, and salinity using the 160
CO2SYS (Pierrot et al., 2006). 161
At the beginning of the incubation, dissolved inorganic nitrogen (DIN) and 162
phosphate (DIP) concentrations of seawater in situ were obtained from the dataset of 163
this cruise . At the end of the incubation, at 10:30 a. m. to 11:00 a. m., 50 mL samples 164
for determination of DIN and DIP concentrations were syringe-filtered (0.22 μm pore 165
size, Haining), stored at –20 oC, measured using a scanning spectrophotometer (Du 166
800, Beckman Coulter) in the laboratory after the nitrate had been reduced to nitrite 167
according to Hansen and Koroleff (1999). 168
169
2.3. Chlorophyll a analysis 170
At each station, at about 14:00 p.m., 2 L surface seawater were filtered onto a GF/F 171
glass filter (25 mm, Whatman) for in situ chlorophyll a (Chl a) measurement. At the 172
end of incubation, at 11:00 a.m to 12:00 a.m., 700 mL samples were filtered onto 173
GF/F glass filters, and all filters were stored at –20 oC until they were analyzed in the 174
laboratory. The filters were placed in 5 mL 100% methanol and stored at 4 oC for 12 175
hours. Then the solutions were centrifuged at 5000 g for 10 min and the absorbances 176

9
of the supernatant were determined using a scanning spectrophotometer (Du 800, 177
Beckman Coulter). Chl a concentrations were determined as follows: Chl a = 13.27 × 178
(A665 – A750) – 2.68 × (A632 – A750) (μg mL–1) (Ritchie, 2002). A632, A665, and A750 179
represent absorbances of the supernatant at 632 nm, 665 nm and 750 nm. 180
181
2.4. Primary productivity measurements 182
Primary productivity was obtained according to the method described by Gao et al. 183
(2017). On the final day of the incubations, at about 5:00 a.m., subsamples were taken 184
from each incubation bottle, dispensed into two 50 mL quartz tubes placed under a 185
plastic plate which allowed 85% PAR and non UVR transmissions, assuring that the 186
light environment was similar to that of incubations. 5 μCi (0.185 MBq) NaH14CO3 187
(ICN Radiochemical, USA) was added to the subsamples, which were cultured in the 188
corresponding deck incubators for 12 hrs (from 6:00 a.m. to 6:00 p.m.) and 24 hrs 189
(from 6:00 a.m. to 6:00 a.m. next day) under solar radiation. Subsamples were then 190
filtered onto GF/F glass filters, which were darkly stored at –20 oC until they were 191
analyzed in the laboratory. Each filter was put into a 10 mL scintillation vial, fumed 192
with HCl for 24 hours to remove inorganic carbon, and dried at 60 oC for 12 hrs. 3 mL 193
scintillation cocktail (Hisafe 3, Perkin Elmer, Shelton, USA) was added to the vial 194
and the activity of the fixed radiocarbon was measured using a liquid scintillation 195
counting (LS 6500, Beckman Coulter, USA). The activity of photosynthetic 196
C-fixation during 12 hrs incubation was defined to be the day-time primary 197
productivity (DPP), and the photosynthetic C-fixation during 24 hours was considered 198

10
to be the net primary productivity (NPP) (Delille et al., 2005). The difference between 199
DPP and NPP was taken as night time respiratory C loss. 200
201
2.5. Data analysis 202
Effects of temperature, CO2 and their interactions on Chl a, DPP, NPP and night 203
time respiration rates were assessed by a two-way analysis of variance (ANOVA). The 204
normal distribution of all data was assessed by a Shapiro-Wilk’s test, and 205
homogeneity of variance was determined by a Levene’s test. A Tukey Post hoc test 206
(Tukey HSD) was performed to show difference between temperature or CO2 207
treatments. Statistical analysis was tested by using R and significant difference was 208
indicated by p < 0.05. 209
210
3 Results 211
212
3.1. Incubation temperature, nutrient concentrations and carbonate chemistry 213
parameters 214
Incubation temperatures varied from 29.1 oC to 31.2 oC in our low temperature 215
treatment (to match the surface seawater temperature at the time of sampling); and 216
varied from 30.6 oC to 34.0 oC in our high temperature treatments (Fig. 2A). Average 217
temperatures were 29.7 ± 0.29 oC for the low temperature treatments and 31.5 ± 218
0.41 oC for the high temperature treatments, respectively. 219
Dissolved inorganic nitrogen (DIN) and phosphate (DIP) concentrations in situ 220

11
surface water of the South China Sea were 0.03–0.12 μmol L–1 and 0.14–0.21 μmol 221
L–1, respectively (Table 1). By adding NaNO3 and NaH2PO4 to the seawater, DIN and 222
DIP concentrations at the beginning of the incubation were 1.03–1.12 μmol L–1 and 223
0.64–0.71 μmol L–1, respectively. DIN concentrations at all treatments decreased 224
below the detection limit (< 0.04 μmol L–1) and DIP concentrations were about 0.05 225
μmol L–1 at the end of the experiments. This means that DIN and DIP concentrations 226
appeared to be replete at the beginning of incubations, and low DIN concentration 227
could have limited the phytoplankton abundance at the end of incubations. 228
CO2 concentrations were 354–439 μatm at low CO2 levels and were 804–1059 229
μatm at high CO2 levels (Table 2). Correspondingly, pHnbs values were 8.17–8.25 at 230
low CO2 levels, and 7.85–7.95 at high CO2 levels. Total alkalinities ranged 231
2319–2381 μmol L–1 in all treatments. 232
233
3.2. Chl a concentration 234
Chl a concentrations in situ were 0.080 μg L–1 at station S1, 0.091 μg L–1 at station 235
S2, 0.130 μg L–1 at station S3, and 0.092 μg L–1 at station S4 (Fig. 3). At the end of 236
the incubation, temperature and CO2 concentration did not significantly affect Chl a 237
concentrations at stations S1 and S2, individually and interactively (Table S1; Fig. 238
3A,B). Elevated temperature significantly reduced Chl a concentrations at station S3 239
at both LC and HC levels (Tukey HSD, both p < 0.05), and at station S4 at LC level 240
(Tukey HSD, p = 0.02) (Table S1; Fig. 3C,D). By the sixth day of the incubation, Chl 241
a concentrations at station S3 were 47%–55% lower at HT than at LT (Tukey HSD, p 242

12
< 0.05) (Fig. 3C). At LC level, Chl a concentration at station S4 reduced by 52% with 243
rising temperatures, while at HC Chl a concentration was not significantly affected by 244
rising temperatures (Tukey HSD, p = 0.7) (Fig. 3D). 245
246
3.3. Day-time primary productivity 247
On the final day of the incubations, temperature and CO2 concentration 248
interactively affected day-time primary productivity at stations S1 and S2, but not at 249
stations S3 and S4 (Table S1). Compared to low temperature and low CO2 (LTLC) 250
treatments, daytime productivity at station S1 was 41% higher at LTHC (Tukey HSD, 251
p = 0.02) and 44% higher at HTLC (Tukey HSD, p = 0.01) (Fig. 4A). At station S2, 252
daytime primary productivity was 12% higher at LTHC (Tukey HSD, p = 0.08) and 253
39% higher at HTLC (Tukey HSD, p = 0.04) than at LTLC. Daytime productivity at 254
stations S1 and S2 was similar between LTLC and HTHC treatments (Tukey HSD, p > 255
0.1). At stations S3 and S4, daytime productivity was not significantly different 256
between all treatments (Tukey HSD, all p > 0.05) (Fig. 4C,D). 257
258
3.4. Net primary productivity 259
On the final day of the incubations, at station S1, net primary productivity was 260
lower at LTLC than at LTHC or HTLC conditions (Tukey HSD, p = 0.3 between 261
LTLC and LTHC treatments; p = 0.04 between LTLC and HTLC treatments) (Fig. 262
5A). Net primary productivity was not significantly different between LTLC and 263
HTHC treatments at station S1. Similarly, at station S2, net primary productivity at 264
13
LTLC was significantly lower than at HTLC (Tukey HSD, p = 0.03), whereas it was 265
not significantly different between LTLC, LTHC and HTHC (Tukey HSD, all p > 0.05) 266
(Fig. 5B). At stations S3 and S4, net primary production did not differ between all 267
treatments (Tukey HSD, all p > 0.05) (Fig. 5C,D). 268
269
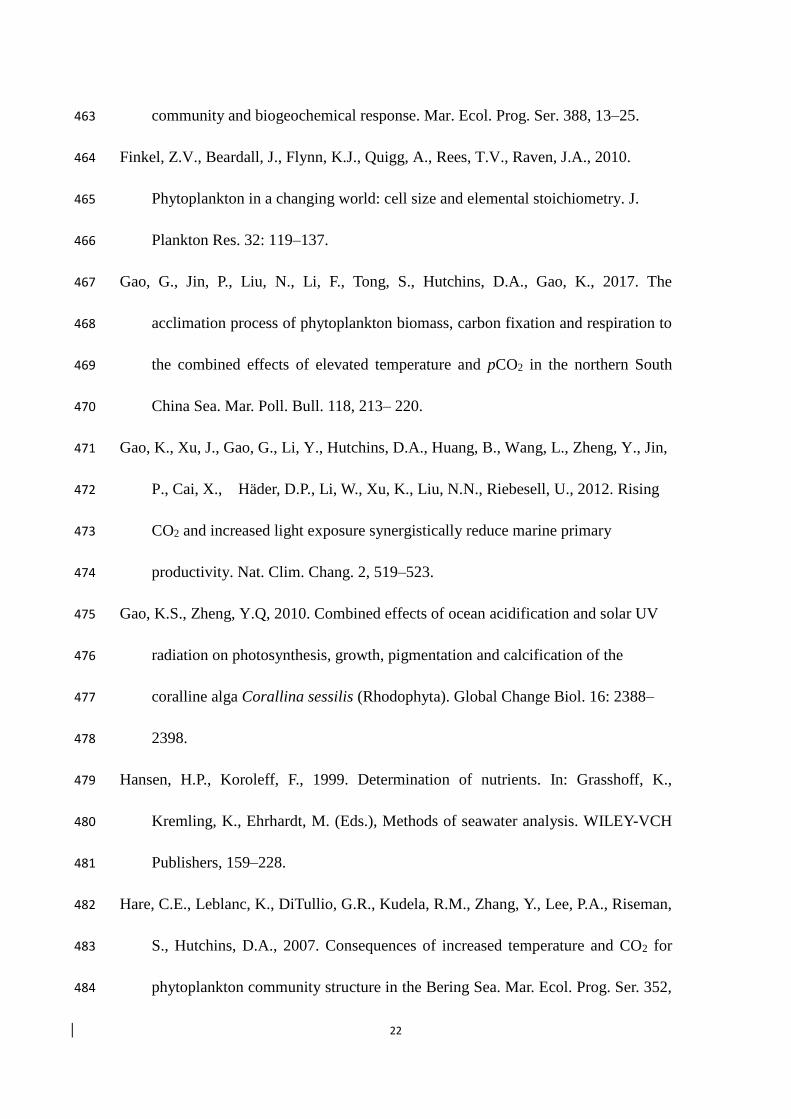
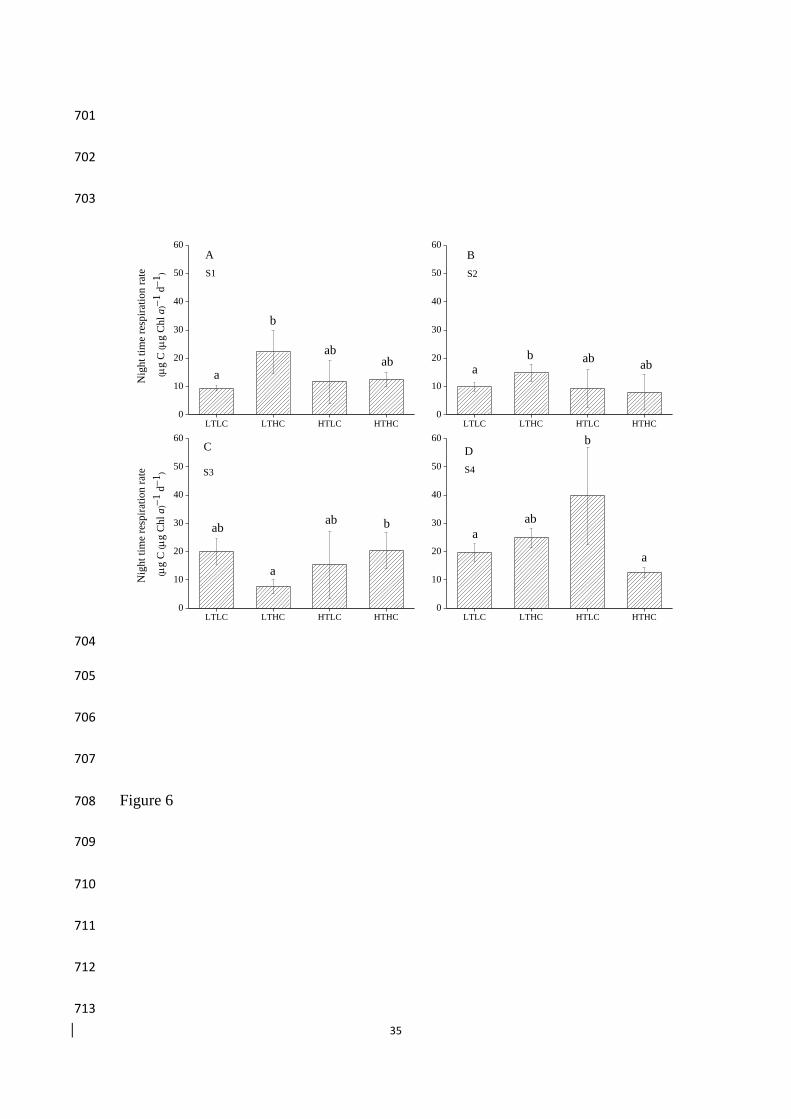
3.5. Night time respiration 270
Temperature and CO2 concentration independently and interactively affected night 271
time respiration rate at station S4, but not at the other stations (Table S1). At S1 and 272
S2, at ambient temperature, night time respiration rates increased significantly at 273
elevated CO2 (Tukey HSD, both p < 0.05, Fig. 6A,B); whereas at high temperature, 274
night time respiration rates were not affected by elevated CO2 levels (Tukey HSD, 275
both p > 0.05). At station S3, at HC, night time respiration rate was enhanced by 276
rising temperature (Tukey HSD, p = 0.03) (Fig. 6C); at station S4, at LC, night time 277
respiration rate was enhanced by rising temperature (Tukey HSD, p < 0.01) (Fig. 6D). 278
279
4 Discussion 280
281
Warming and increased CO2 levels both individually boosted primary productivity 282
in samples of phytoplankton communities taken in nearshore and offshore habitats in 283
the western South China Sea, although these were not all statistically significant 284
increases (Figs. 4; 5). The effect of rising CO2 on primary productivity and respiration 285
was temperature dependent, and the combination of elevated CO2 and temperature 286

14
resulted in antagonistic effects on production and respiration of the phytoplankton 287
assemblages (Figs. 4; 5; 6). 288
There were enhanced carbon fixation rates at elevated CO2 levels at all stations 289
(Figs. 4; 5), a similar result to that obtained in other experiments using shipboard 290
incubations, mesocosm experiments and CO2 seeps (Tortell et al., 2008; Engel et al., 291
2014; Holding et al., 2015; Johnson et al., 2015). The dominant phytoplankton groups 292
at our offshore stations were Synechococcus, Prochlorococcus and picoeukaryotes 293
(Zhong et al., 2013; Wu et al., 2014a) whereas diatoms (Pseudonitzschia pungens and 294
Chaetoceros pseudocurvisetus) and dinoflagelates (Protoperidinium conicum) dominated at 295
our inshore stations (Zhang et al., 2014). Rising seawater CO2 levels are expected to 296
increase carbon fixation rates of larger species more than small phytoplankton species 297
because it is more difficult for large species to take up sufficient inorganic carbon as 298
they have a smaller cell surface:volume quotient (Wu et al., 2014b). Furthermore, 299
elevated CO2 levels tend to increase the percentage of diatoms in phytoplanktonic and 300
sessile algal communities (Tortell et al., 2002; Domingues et al., 2014). In our 301
experiments, the different responses of offshore and inshore surface phytoplankton 302
assemblages to increased levels of temperature and pCO2 could be due to differences 303
in the phytoplankton communities. 304
Temperature increases of about 2oC significantly increased phytoplankton 305
assemblage productivity in coastal water at ambient levels of CO2. This can be 306
expected, since warming is known to increase enzyme activity, and enhance cellular 307
metabolic activity and so improve nutrient or CO2 uptake (Montagnes and Franklin, 308

15
2001; Beardall and Raven, 2004). However, warming did not lead to any increase in 309
night time respiration in coastal water, which might indicate less effect of rising 310
temperature on enzyme activity in our study (Fig. 6), suggesting that increased 311
productivity may be due to more efficient nutrient or CO2 uptake. Another possible 312
reason for greater primary productivity in the warming treatments may be a shift from 313
predominantly large to mainly small sized algal cells during the incubation 314
(Daufresne et al. 2009; Sommer et al. 2015). Unfortunately, we did not determine the 315
community structure at the end of experiments. However, both ambient and elevated 316
temperature treatments in this study are close to the upper thermal limit for growth of 317
most phytoplankton species (Boyd et al. 2013). In this case, rising temperature is 318
expected to shift community composition and cause an increase in the abundance of 319
small-celled phytoplankton. Small species show stronger temperature responses in 320
terms of their photosynthetic C-fixation compared with large species (Sommer et al., 321
2015), which may lead to higher productivity in warmer coastal water (Figs. 4, 5). 322
In the present work, we observed higher night respiratory under HC conditions 323
(Fig. 6) in coastal waters at ambient temperature, this could be due to enhanced 324
energy demand against the acidic stress such as maintaining the cell’s homoeostasis 325
(Jin et al. 2015). However, such a respiratory enhancement was not observed at 326
elevated temperature. It is possible that such a level of elevated temperature may 327
increase cellular metabolic activity and periplasmic redox activity that counter-acted 328
the acidic stress. On the other hand, small-sized species seem insensitive to increased 329
pCO2 in terms of carbon fixation (Tortell et al. 2002; Domingues et al., 2014; Wu et 330

16
al., 2014b), and they are highly sensitive to high light intensities that cause severe 331
inhibition of C-fixation (Li et al., 2011). Therefore, these effects might contribute to 332
the observed similar response in primary productivity of offshore-water where 333
small-sized species dominated (Zhong et al., 2013), and also contribute to the low 334
primary productivity of coastal water at warming and acidification treatments with 335
high percentage of small sized species (Figs 4, 5). Gao et al. (2012) reported that 336
rising CO2 decreased phytoplankton productivity in surface seawater under 90% 337
incident solar radiation in the South China Sea, due to enhanced photoinhibition. 338
Different nutrient concentrations can be responsible for the discrepancy between our 339
study and Gao et al., (2012), because seawater was enriched by 1 μmol L–1 NaNO3 340
and 0.5 μmol L–1 NaH2PO4 in this study whereas initial DIN and DIP concentration 341
were lower than 0.01 μmol L–1 and 0.15 μmol L–1, respectively, in the study of Gao et 342
al. (2012). Rising CO2 is known to increase primary productivity at high nutrient 343
concentrations, but the additional inorganic carbon does not boost productivity in 344
nutrient limited conditions (Yoshimura et al., 2009; Celis-Plá et al., 2015). 345
The temperature and CO2 concentrations of surface oceans are rising 346
simultaneously, but the carbonate chemistry of coastal water is complex, due to the 347
local effects of hydrography, metabolic activity, nutrient input and watershed 348
processes (Duarte et al. 2013). The effects of CO2 on phytoplankton physiology and 349
productivity has important biogeochemical implications. Increased productivity at 350
elevated CO2 level could accelerate carbon sequestration of phytoplankton which may 351
increase the CO2 uptake of coastal seawater from the atmosphere. Decreased 352

17
chlorophyll concentrations offshore due to warming may limit biological productivity 353
because phytoplankton are the primary energy source for marine food chains. Our 354
study shows that phytoplankton assemblages in different regions respond differently 355
to increases in CO2 and temperature. However, if our shipboard tests reflect natural 356
responses, then ongoing warming and acidification in the South China Sea is not 357
expected to increase overall regional primary productivity due to a lack of nutrients in 358
offshore waters. Other environmental factors such as changes in solar radiation, 359
wind-speed induced mixing and deposition of dusts may also affect the primary 360
productivity of phytoplankton communities. Therefore, shipboard incubations during 361
different seasons or with waters influenced by episodic events might lead to 362
differential responses to warming and acidification. 363
364
5. Conclusion 365
The present study shows combined effects of ocean warming and acidification 366
on phytoplankton primary productivity, Chl a concentration and night respiration of 367
two coastal and two offshore waters in the western South China Sea. Warming and 368
elevated CO2 levels individually increased primary productivity, especially in the 369
coastal water. However, the combination of elevated temperature and increased CO2 370
did not increase primary productivity at all stations. Different responses in primary 371
productivity, Chl a concentration and night respiration to warming and acidification 372
between the coastal and offshore waters may be due to differences in the 373
phytoplankton community composition and in their sensitivity to elevated temperature 374

18
or CO2 levels. 375
376
377
378
379
Acknowledgements 380
381
This study was supported by National Natural Science Foundation (41720104005, 382
41721005, 41430967, 41806129) and Joint Project of National Natural Science 383
Foundation of China and Shandong Province (No. U1606404), China Postdoctoral 384
Science Foundation (2017M612129) and the outstanding postdoctoral program of 385
State Key Laboratory of Marine Environmental Science (Xiamen University). We 386
thank the captain and crew of the research vessel Shiyan III and the chief Dr. Zhen 387
Shi for his organization during the cruises. 388
389
390
391
392
393
394
395
396

19
References 397
Bach, L.T., Riebesell, U., Gutowska, M.A., Federwisch, L., Schulz, K.G., 2015. A 398
unifying concept of coccolithophore sensitivity to changing carbonate chemistry 399
embedded in an ecological framework, Prog. Oceanogr., 135, 125–138. 400
Beardall, J., Raven, J.A., 2004. Potential effects of global change on microalgal 401
photosynthesis, growth and ecology. Phycologia 43: 26–40. 402
Boyce, D.G., Lewis, M.R., Worm, B., 2010. Global phytoplankton decline over the 403
past century. Nature 466, 591–596 404
Boyd, P.W., Lennartz, S.T., Glover, D.M., Doney, S.C., 2015. Biological ramifications 405
of climate-change-mediated oceanic multi-stressors. Nat. Clim. Change 5, 406
71–79. 407
Boyd, P.W., Rynearson, T.A., Armstrong, E.A., Fu, F., Hayashi, K., Hu, Z., Hutchins, 408
D.A., Kudela, R.M., Litchman, E., Mulholland, M.R., Passow, U., Strzepek, R.F., 409
Whittaker, K.A., Yu, E., Thomas, M.K., 2013. Marine phytoplankton temperature 410
versus growth responses from polar to tropical waters–outcome of a scientific 411
community-wide study. PLOS ONE 8, e63091. doi: 412
10.1371/journal.pone.0063091. 413
Brodie, J., Williamson, C.J., Smale, D.A., Kamenos, N.A.,Mieszkowska, N., Santos, 414
R., Cunliffe, M., Steinke, M., Yesson, C., Anderson, K.M., Asnaghi, V., 415
Brownlee, C., Burdett, H.L., Burrows, M.T., Collins, S., Donohue, P.J.C., Harvey, 416
B., Foggo, A., Noisette, F., Nunes, J., Ragazzola, F., Raven, J.A., Schmidt, D.N., 417
Suggett, D., Teichberg, M., Hall-Spencer, J.M., 2014. The future of the NE 418

20
Atlantic benthic flora in a high CO2 world. Ecol. Evol. 4, 2787–2789. 419
Caldeira, K., Wickett, M.E., 2003. Oceanography: anthropogenic carbon and ocean 420
pH. Nature 425, 365–365. 421
Celis-Plá, P.S.M., Hall-Spencer, J.M., Horta, P., Milazzo, M., Korbee, N., Cornwall, 422
C.E., Figueroa, F.L., 2015. Macroalgal responses to ocean acidification depend 423
on nutrient and light levels. Front. Mar. Sci. 2, 26. 424
Chen, Y.L., Chen, H.Y., Karl, D.M., Takahashi, M., 2004. Nitrogen modulates 425
phytoplankton growth in spring in the South China Sea. Cont. Shelf Res. 24, 426
527–541. 427
Coello-Camba, A., Agustí, S., Holding, J., Arrieta, J.M., Duarte, C.M., 2014. 428
Interactive effect of temperature and CO2 increase in Arctic phytoplankton. Front. 429
Mar. Sci. 1, 49. doi: 10.3389/fmars.2014.00049 430
Daufresne, M., Lengfellner, K., Sommer, U., 2009. Global warming benefits the small 431
in aquatic ecosystems. Proc. Natl. Acad. Sci. USA 106, 12788–12793. 432
Delille, B., Harlay, J., Zondervan, I., Jacquet, S., Chou, L., Wollast, R., Bellerby, R.G., 433
Frankignoulle, M., Borges, A.V., Riebesell, U., Gattuso, J.P., 2005. Response of 434
primary production and calcification to changes of pCO2 during experimental 435
blooms of the coccolithophorid Emiliania huxleyi. Global Biogeochem. Cy. 19, 436
GB2023. doi: 10.1029/2004GB002318. 437
Dickson, A.G., 1993. pH buffers for sea water media based on the total hydrogen ion 438
concentration scale. Deep Sea Res. 40, 107–118. 439
Dickson, A.G., Afghan, J.D., Anderson, G.C., 2003. Reference materials for oceanic 440

21
CO2 analysis: a method for the certification of total alkalinity. Mar. Chem. 80, 441
185–197. 442
Domingues, R.B., Guerra, C., Barbosa, A.B., Brotas, V., Galvão, H.M., 2014. Effects 443
of ultraviolet radiation and CO2 increase on winter phytoplankton assemblages in 444
a temperate coastal lagoon. J. Plankton Res. 36: 672–684. 445
Doney, S.C., 2006. Phytoplankton in a warmer world. Nature 444, 695–696. 446
Duarte, C.M., Hendriks, I.E., Moore, T.S., Olsen, Y.S., Steckbauer, A., Ramajo, L., 447
Carstensen, J., Trotter, J.A., McCulloch, M., 2013. Is ocean acidification an 448
open-ocean syndrome? Understanding anthropogenic impacts on seawater pH. 449
Estuar. Coast. 36, 221–236. 450
Egge, J.K., Thingstad, T.F., Larsen, A., Engel, A., Wohlers, J., Bellerby, R.G.J., 451
Riebesell, U., 2009. Primary production during nutrient-induced blooms at 452
elevated CO2 concentrations. Biogeosciences 6: 877–885. 453
Engel, A., Piontek, J., Grossart, H.P., Riebesell, U., Schulz, K.G., Sperling, M., 2014. 454
Impact of CO2 enrichment on organic matter dynamics during nutrient induced 455
coastal phytoplankton blooms. J. Plankton Res. 36, 641–657. 456
Falkowski, P.G., Raven, J.A., 2007. Aquatic Photosynthesis Second Edition. 457
Princeton University Press, USA. 458
Feng, Y., Hare, C.E., Leblanc, K., Rose, J.M., Zhang, Y., DiTullio, G.R., Lee, 459
P.A.,Wilhelm, S.W., Rowe, J.M., Sun, J., Nemcek, N., Gueguen, C., Passow, U., 460
Benner, I., Brown, C., Hutchins, D.A., 2009. Effects of increased pCO2 and 461
temperature on the North Atlantic spring bloom. I. The phytoplankton 462
22
community and biogeochemical response. Mar. Ecol. Prog. Ser. 388, 13–25. 463
Finkel, Z.V., Beardall, J., Flynn, K.J., Quigg, A., Rees, T.V., Raven, J.A., 2010. 464
Phytoplankton in a changing world: cell size and elemental stoichiometry. J. 465
Plankton Res. 32: 119–137. 466
Gao, G., Jin, P., Liu, N., Li, F., Tong, S., Hutchins, D.A., Gao, K., 2017. The 467
acclimation process of phytoplankton biomass, carbon fixation and respiration to 468
the combined effects of elevated temperature and pCO2 in the northern South 469
China Sea. Mar. Poll. Bull. 118, 213– 220. 470
Gao, K., Xu, J., Gao, G., Li, Y., Hutchins, D.A., Huang, B., Wang, L., Zheng, Y., Jin, 471
P., Cai, X., Häder, D.P., Li, W., Xu, K., Liu, N.N., Riebesell, U., 2012. Rising 472
CO2 and increased light exposure synergistically reduce marine primary 473
productivity. Nat. Clim. Chang. 2, 519–523. 474
Gao, K.S., Zheng, Y.Q, 2010. Combined effects of ocean acidification and solar UV 475
radiation on photosynthesis, growth, pigmentation and calcification of the 476
coralline alga Corallina sessilis (Rhodophyta). Global Change Biol. 16: 2388– 477
2398. 478
Hansen, H.P., Koroleff, F., 1999. Determination of nutrients. In: Grasshoff, K., 479
Kremling, K., Ehrhardt, M. (Eds.), Methods of seawater analysis. WILEY-VCH 480
Publishers, 159–228. 481
Hare, C.E., Leblanc, K., DiTullio, G.R., Kudela, R.M., Zhang, Y., Lee, P.A., Riseman, 482
S., Hutchins, D.A., 2007. Consequences of increased temperature and CO2 for 483
phytoplankton community structure in the Bering Sea. Mar. Ecol. Prog. Ser. 352, 484

23
9–16. 485
Holding, J.M., Duarte, C.M., Sanz-Martín, M., Mesa, E., Arrieta, J.M., Chierici, M., 486
Hendriks, I., Garcia-Corral, L., Regaudie-de-Gioux, A., Delgado, A., 2015. 487
Temperature dependence of CO2-enhanced primary production in the European 488
Arctic Ocean. Nat. Clim. Chang 5, 1079–1082 489
Hoppe, C.J.M., Wolf, K.K.E., Schuback, N., Tortell, P.D., Rost, B., 2018. 490
Compensation of ocean acidification effects in Arctic phytoplankton assemblages. 491
Nat. Clim. Chang 8, 529–533. 492
IPCC, 2014. Climate Change 2014: Impacts, Adaptation, and Vulnerability. Part B: 493
Regional Aspects. Contribution of Working Group II to the Fifth Assessment 494
Report of the Intergovernmental Panel on Climate Change. Cambridge Univ. 495
Press, New York. 496
Ji, X., Liu, G., Gao, S., Wang, H., Zhang, M., 2017. Comparison of air-sea CO2 flux 497
and biological productivity in the South China Sea, East China Sea, and Yellow 498
Sea: a three-dimension physical-biogeochemical modeling study. Acta Oceanol. 499
Sin. 36, 1–10. 500
Jin, P., Wang, T., Liu, N., Dupont, S., Beardall, J., Boyd, P.W., Riebesell, U., Gao, 501
K.S., 2015. Ocean acidification increases the accumulation of toxic phenolic 502
compounds across trophic levels. Nature Comm. 6: 8714. 503
Johnson, V.R., Brownlee, C., Milazzo, M., Hall-Spencer, J.M., 2015. Microalgal 504
assemblage shift along a marine CO2 gradient subjected to multiple 505
environmental stressors. J. Mar. Sci. Eng. 3, 1425–1447. 506

24
Kim, J.M., Lee, K., Shin, K., Kang, J.H., Lee, H.W., Kim, M., Jang, P.G., Jang, M.C., 507
2006. The effect of seawater CO2 concentration on growth of a natural 508
phytoplankton assemblage in a controlled mesocosm experiment. Limnol. 509
Oceanogr. 51, 1629–1636. 510
Kletou, D., Hall-Spencer, J.M., 2012. Threats to ultraoligotrophic marine ecosystems. 511
In Cruzado A (ed): Marine Ecosystems. In Tech - Open Access Publisher. 512
ISBN 979-953-307-430-5. 513
Li, G., Gao, K., Gao, G., 2011. Differential impacts of solar UV radiation on 514
photosynthetic carbon fixation from the coastal to offshore surface waters in the 515
South China Sea. Photochem. Photobio. 87, 329–334. 516
Liu, N., Beardall, J., Gao, K., 2017. Elevated CO2 and associated seawater chemistry 517
do not benefit a model diatom grown with increased availability of light. Aquat. 518
Microb. Ecol. 79, 137–147. 519
Montagnes, D.J., Franklin, M., 2001. Effect of temperature on diatom volume, growth 520
rate, and carbon and nitrogen content: reconsidering some paradigms. Limnol. 521
Oceanogr. 46, 2008–2018. 522
Pierrot, D., Lewis, E., Wallace, D.W.R., 2006. MS Excel program developed for CO2 523
system calculations, ORNL/CDIAC-105, Carbon Dioxide Information Analysis 524
Centre, Oak Ridge National Laboratory, U.S. Department of Energy. 525
https://doi.org/10.3334/CDIAC/otg.CO2SYS_XLS_CDIAC105a. 526
Riebesell, U., Bach, L.T., Bellerby, R.G.J., Monsalve, J.R.B., Boxhammer, T., Czerny, 527
J., Larsen, A., Ludwig, A., Schulz, K.G., 2017. Competitive fitness of a 528

25
predominant pelagic calcifier impaired by ocean acidification. Nat. Geosci. 10, 529
19–23. 530
Ritchie, R.J., 2006. Consistent sets of spectrophotometric chlorophyll equations for 531
acetone, methanol and ethanol solvents. Photosyn. Res. 89, 27–41. 532
Siegel, D.A., Behrenfeld, M.J., Maritorena, S., McClain, C.R., Antoine, D., Bailey, 533
S.W., Bontempi, P.S., Boss, E.S., Dierssen, H.M., Doney, S.C., 2013. Regional to 534
global assessments of phytoplankton dynamics from the SeaWiFS mission. 535
Remote Sens. Environ. 135, 77–91. 536
Sommer, U., Paul, C., Moustaka-Gouni, M., 2015. Warming and ocean acidification 537
effects on phytoplankton–from species shifts to size shifts within species in a 538
Mesocosm Experiment. PLoS ONE 10, e0125239, 539
doi:10.1371/journal.pone.0125239. 540
Taucher, J., Schulz, K.G., Dittmar, T., Sommer, U., Oschlies, A., Riebesell, U., 2012. 541
Enhanced carbon overconsumption in response to increasing temperatures during 542
a mesocosm experiment. Biogeosciences 9, 3531–3545. 543
Tortell, P.D., DiTullio, G.R., Sigman, D.M., Morel, F.M.M., 2002. CO2 effects on 544
taxonomic composition and nutrient utilization in an Equatorial Pacific 545
phytoplankton assemblage. Mar. Ecol. Prog. Ser. 236, 37–43. 546
Tortell, P.D., Payne, C.D., Li, Y., Trimborn, S., Rost, B., Smith, W.O., Riesselman, C., 547
Dunbar, R.B., Sedwick, P., DiTullio, G.R., 2008. CO2 sensitivity of Southern 548
Ocean phytoplankton. Geophys. Res. Let. 35, L04605, doi: 549
10.1029/2007GL032583. 550

26
Tseng, C.M., Wong, G.T.F., Lin, I.I., Wu, C.R., Liu, K.K., 2005. A unique seasonal 551
pattern in phytoplankton biomass in low-latitude waters in the South China Sea. 552
Geophys. Res. Lett. 32, L08608, doi: 10.1029/2004GL022111. 553
Wohlers, J., Engel, A., Zöllner, E., Breithaupt, P., Jürgens, K, Hoppe, H.G., Sommer, 554
U., Riebesell, U., 2009. Changes in biogenic carbon flow in response to sea 555
surface warming. Proc. Natl. Acad. Sci. USA 106, 7067–7072. 556
Wolf, K.K.E., Hoppe, C.J.M., Rost, B., 2017. Resilience by diversity: Large 557
intraspecific differences in climate change responses of an Arctic diatom. Limnol. 558
Oceanogr. 63, 397–411. 559
Wu, W., Huang, B., Liao, Y., Sun, P., 2014a. Picoeukaryotic diversity and distribution 560
in the subtropical–tropical South China Sea. FEMS Microbiol. Ecol. 89, 561
563–579. 562
Wu, Y., Campbell, D.A., Irwin, A.J., Suggett, D.J., Finkel, Z.V., 2014b. Ocean 563
acidification enhances the growth rate of larger diatoms. Limnol. Oceanogr. 59, 564
1027–1034. 565
Wu, H.Y., Zou, D.H., Gao, K.S., 2008. Impacts of increased atmospheric CO2 566
concentration on photosynthesis and growth of micro- and macro-algae. Sci. 567
China Ser. C-Life Sci. 51: 1144–1150. 568
Yoshimura, T., Nishioka, J., Suzuki, K., Hattori, H., Kiyosawa, H., Watanabe, Y.W., 569
2009. Impacts of elevated CO2 on phytoplankton community composition and 570
organic carbon dynamics in nutrient-depleted Okhotsk Sea surface waters. 571
Biogeosci. Discus. 6, 4143–4163. 572

27
Zhang, G., Pang, Y., Chen, S., Wu, Z., Chen, D., Wang, D., Huang, B., 2014. Study on 573
the communities of the netz-phytoplankton in the coastal waters of Hainan Island 574
in the early summer. Trans. Oceanol. Limnol. 3, 97–104. 575
Zhong, C., Xiao, W., Huang, B., 2013. The response of phytoplankton to mesoscale 576
eddies in western South China Sea. Adv. Mar. Sci. 31, 213–220. 577
578
579
580
581
582
583
584
585
586
587
588
589
590
591
592
593
594

28
Figure Legend 595
596
Figure 1. Sampling stations in the western South China Sea in the cruise during 597
autumn 2017. 598
599
Figure 2. Water temperature in the deck incubators for the low and high temperature 600
treatments during the incubations, and solar radiation. 601
602
Figure 3. Chl a concentration of surface phytoplankton assemblages in situ and in the 603
bottle after 6 days of incubation at different experiment conditions. Different letters 604
indicated statistically difference based on Tukey post hoc test. The values represent 605
the mean ± standard deviation (error bar) for three replicates. 606
607
Figure 4. Daytime primary productivity (DPP) of surface phytoplankton assemblages 608
in the bottle after 6 days of incubation at different experiment conditions. Different 609
letters indicated statistically difference based on Tukey post hoc test. The values 610
represent the mean ± standard deviation (error bar) for three replicates 611
612
Figure 5. Net primary productivity (NPP) of surface phytoplankton assemblages in the 613
bottle after 6 days of incubation at different experiment conditions. Different letters 614
indicated statistically difference based on Tukey post hoc test. The values represent 615
the mean ± standard deviation (error bar) for three replicates 616

29
617
Figure 6. Night time respiration rate of surface phytoplankton assemblages in the 618
bottle after 6 days of incubation at different experiment conditions. Different letters 619
indicated statistically difference based on Tukey post hoc test. The values represent 620
the mean ± standard deviation (error bar) for three replicates 621
622
623
624
625
626
627
628
629
630
631
632
633
634
635
636
637
638

30
639
640
641
642
643
Figure 1 644
645
646
647
648
649

31
650
04:00 06:00 08:00 10:00 12:00 14:00 16:00 18:00 20:000
100
200
300
400
500
28
29
30
31
32
33
34
04:00 06:00 08:00 10:00 12:00 14:00 16:00 18:00 20:00
B
Time (hour)
So
lar
rad
iati
on
(W
m
2)
Tem
per
atu
re (
oC
) low temperature
high temperature
A
651
652
653
Figure 2 654
655
656
657
658
659
660
661

32
662
663
In situ LTLC LTHC HTLC HTHC0.0
0.3
0.6
0.9
1.2
1.5
aa
a
Chl
a (
g L
1)
Chl
a (
g L
1)
S1
a
In situ LTLC LTHC HTLC HTHC0.0
0.3
0.6
0.9
1.2
1.5
a
aa
a
B
S2
In situ LTLC LTHC HTLC HTHC0.0
0.3
0.6
0.9
1.2
1.5
bb
aa
C
S3
In situ LTLC LTHC HTLC HTHC0.0
0.3
0.6
0.9
1.2
1.5
ab
bab
a
D
S4
A
664
665
666
667
Figure 3 668
669
670
671
672
673
674

33
675
676
LTLC LTHC HTLC HTHC0
20
40
60
80
100
120
140
160
a
bb
a
Day
tim
e pri
mar
y p
rod
uct
ivit
y (
DP
P)
(g
C (
g C
hl
a)
1 d
1)
Day
tim
e pri
mar
y p
rod
uct
ivit
y (
DP
P)
(g
C (
g C
hl
a)
1 d
1)
S1
A
LTLC LTHC HTLC HTHC0
20
40
60
80
100
120
140
160
a
baba
B
S2
LTLC LTHC HTLC HTHC0
20
40
60
80
100
120
140
160
aa
aa
C
S3
LTLC LTHC HTLC HTHC0
20
40
60
80
100
120
140
160
a
a
a
a
D
S4
677
678
679
680
Figure 4 681
682
683
684
685
686
687

34
688
689
LTLC LTHC HTLC HTHC0
20
40
60
80
100
120
140
ab
a a
S1
LTLC LTHC HTLC HTHC0
20
40
60
80
100
120
140
a
b
aa
B
S2
LTLC LTHC HTLC HTHC0
20
40
60
80
100
120
140
aaaa
b
C
S3
Net
pri
mar
y p
rod
uct
ivit
y (
NP
P)
(g
C (
g C
hl
a)
1 d
1)
Net
pri
mar
y p
rod
uct
ivit
y (
NP
P)
(g
C (
g C
hl
a)
1 d
1)
LTLC LTHC HTLC HTHC0
20
40
60
80
100
120
140
a
a
a
a
D
A
S4
690
691
692
693
Figure 5 694
695
696
697
698
699
700
35
701
702
703
LTLC LTHC HTLC HTHC0
10
20
30
40
50
60
abab
b
a
BA
S1
Nig
ht
tim
e re
spir
atio
n r
ate
(g
C (
g C
hl
a)
1 d
1)
Nig
ht
tim
e re
spir
atio
n r
ate
(g
C (
g C
hl
a)
1 d
1)
LTLC LTHC HTLC HTHC0
10
20
30
40
50
60
ababb
a
S2
LTLC LTHC HTLC HTHC0
10
20
30
40
50
60
bab
a
ab
C
S3
LTLC LTHC HTLC HTHC0
10
20
30
40
50
60
a
b
ab
a
D
S4
704
705
706
707
Figure 6 708
709
710
711
712
713

36
Table 1. Dissolved inorganic nitrogen (DIN) and phosphate (DIP) concentrations at 714
the beginning and end of the incubation. 1 μmol L–1 NaNO3 and 0.5 μmol L–1 715
NaH2PO4 was added into the seawater in the beginning of the incubation. Data in the 716
bracket were DIN and DIP concentrations in situ. ND indicates that concentration was 717
below the detection limit (< 0.04 μmol L–1). 718
DIN (μmol L–1) DIP (μmol L–1)
S1 Before culture 1 (0.08) 0.5 (0.17)
After culture ND 0.05±0.01
S2 Before culture 1 (0.03) 0.5 (0.21)
After culture ND 0.04±0.02
S3 Before culture 1 (0.03) 0.5 (0.14)
After culture ND 0.05±0.01
S4 Before culture 1 (0.12) 0.5 (0.16)
After culture ND 0.05±0.01
719
720
721
722
723
724
725
726
727
728
729
730

37
Table 2. Carbonate chemistry parameters of the seawater in the final day of the 731
incubations at different temperature and pCO2 conditions. TA and pH samples were 732
collected and measured. Different letters (a and b) indicated statistically difference 733
based on Tukey post hoc test. pHnbs means the pH measurements in seawater on the 734
NBS scale. 735
pCO2
(μatm)
pHnbs TA
(μmol
L-1)
DIC
(μmol L-1)
3HCO
(μmol
L-1)
2
3CO
(μmol
L-1)
CO2
(μmol
L-1)
Ω
calcite
LTLC 419±13a 8.19±0.01a 2342±15a 2050±12a 1818±11a 220±5a 12±0.4a 5.5±0.1a
LTHC 977±64b 7.88±0.03b 2349±18a 2210±16b 2060±17b 121±7b 28±1.8b 3.0±0.2b
HTLC 376±14a 8.23±0.01a 2343±16a 2028±8a 1782±7a 235±8a 11±0.4a 5.8±0.2a
HTHC 891±61b 7.91±0.03b 2348±22a 2194±18b 2038±18b 130±8b 26±1.8b 3.2±0.2b
736
737
738
739
740
741
742
743
744
745
746
747
748

38
Table S1. Results of two-way ANOVAs of the effects of temperature and pCO2 on Chl 749
a, day-time primary productivity (DPP), net primary productivity (NPP) and night 750
time respiration rate. Temp indicates temperature and significant difference was setup 751
to p < 0.05. 752
Station Parameter Treatment df F-value p
S1 Chl a Temp 1 2.80 0.13
CO2 1 0.30 0.61
Temp × CO2 1 0.14 0.71
DPP Temp 1 2.38 0.15
CO2 1 0.68 0.43
Temp × CO2 1 31.53 <0.01
NPP Temp 1 1.65 0.21
CO2 1 0.14 0.75
Temp × CO2 1 14.77 <0.01
Respiration Temp 1 1.36 0.26
CO2 1 4.43 0.07
Temp × CO2 1 3.56 0.09
S2 Chl a Temp 1 2.43 0.15
CO2 1 2.20 0.18
Temp × CO2 1 0.38 0.53
DPP Temp 1 0.006 0.94
CO2 1 20.74 <0.01
Temp × CO2 1 7.62 <0.05
NPP Temp 1 0.37 0.57
CO2 1 4.03 0.08
Temp × CO2 1 3.98 0.08
Respiration Temp 1 0.92 0.37
CO2 1 4.65 0.06
Temp × CO2 1 1.16 0.31
S3 Chl a Temp 1 38.58 <0.01
CO2 1 0.67 0.41
Temp × CO2 1 0.32 0.61
DPP Temp 1 2.43 0.17
CO2 1 0.02 0.93
Temp × CO2 1 0.34 0.59
NPP Temp 1 0.88 0.39
CO2 1 0.050 0.82
Temp × CO2 1 1.77 0.21
Respiration Temp 1 1.52 0.20
CO2 1 0.14 0.71

39
Temp × CO2 1 1.03 0.34
S4 Chl a Temp 1 7.53 <0.05
CO2 1 0.005 0.95
Temp × CO2 1 7.53 <0.05
DPP Temp 1 0.39 0.55
CO2 1 0.0001 0.99
Temp × CO2 1 5.45 <0.05
NPP Temp 1 1.64 0.23
CO2 1 0.46 0.56
Temp × CO2 1 2.50 0.16
Respiration Temp 1 17.01 <0.05
CO2 1 17.97 <0.05
Temp × CO2 1 28.04 <0.05
753
754
755
756
757
758
759
760
761
762
763
764
765
766
767
768
40
769
770
A B
771
772
773
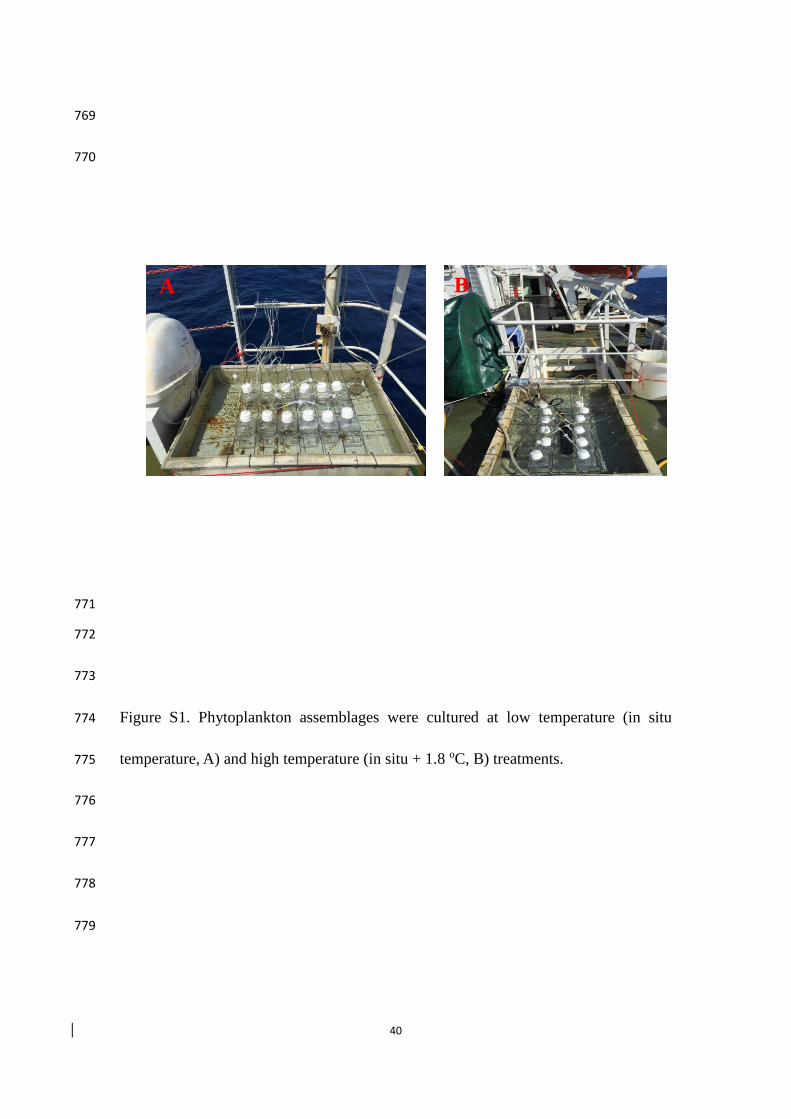
Figure S1. Phytoplankton assemblages were cultured at low temperature (in situ 774
temperature, A) and high temperature (in situ + 1.8 oC, B) treatments. 775
776
777
778
779