Embed Size (px)
Citation preview

Commercial Bank of Ceylon PLCCommercial Bank of Ceylon PLC
Annual Report 2012Annual Report 2012
This is Commercial BankOperating HighlightsFinancial Highlights
Letter from the ChairmanManaging Director’s ReviewManagement Discussion and AnalysisStewardshipFinancial ReportsAnnexes
316
1. Reporting Entity
1.1 Corporate Information
Commercial Bank of Ceylon PLC (the ‘Bank’) is a public limited liability company listed on the Colombo Stock Exchange, incorporated on June 25, 1969, (and domiciled) in Sri Lanka. It is a licensed commercial bank regulated under the Banking Act No. 30 of 1988 and amendments thereto. The Bank was re-registered under the Companies Act No. 07 of 2007. The registered office of the Bank is situated at ‘Commercial House’, No. 21, Sir Razik Fareed Mawatha, Colombo 01, Sri Lanka. The ordinary shares of the Bank have a primary listing on the Colombo Stock Exchange. For further information please refer page 468.
The staff strength of the Bank as at December 31, 2012 was 4,602 (4,524 as at December 31, 2011).
1.2 Consolidated Financial Statements
The Consolidated Financial Statements of the Bank as at and for the year ended December 31, 2012, comprise the Bank (Parent Company) and its Subsidiaries (together referred to as the ‘Group’ and individually as ‘Group entities’), and the Group’s interest in its Associates.
The Bank does not have an identifiable Parent of its own.
Notes to the Financial StatementsNotes to the Financial Statements
1.3 Principal Activities and Nature of Operations of the Bank and its Subsidiaries and Associates
Entity Principal Business Activities
Bank The Bank provides a comprehensive range of financial services encompassing accepting deposits, personal banking, trade financing, off-shore banking, resident and non-resident foreign currency operations, travel-related services, corporate and retail credit, syndicated financing, project financing, development banking, lease financing, rural credit, issuing of local and international debit and credit cards, tele-banking facilities, internet banking, money remittance facilities, dealing in Government Securities and treasury-related products, salary remittance package, bullion trading, export and domestic factoring, pawning, margin trading, e-Banking services, Bancassurance and Islamic banking products and services, etc.
SubsidiariesCommercial Development Company PLC.
Property development & related ancillary services and outsourcing of staff for non-critical functions of the Bank.
ONEzero Company Ltd. Providing IT-related services.
Commex Sri Lanka S.R.L. Acting as an agent to the Bank and providing money transfer services, opening accounts, issuance and encashment of foreign currencies and travellers’ cheques and collecting applications for credit facilities. The commercial operations of this company are yet to be commenced.
AssociatesEquity Investments Lanka Ltd. Fund management.
Commercial Insurance Brokers (Pvt) Ltd.
Insurance brokering.
There were no significant changes in the nature of the principal business activities of the Bank and the Group during the financial year under review.

Commercial Bank of Ceylon PLCCommercial Bank of Ceylon PLC
Annual Report 2012Annual Report 2012
This is Commercial BankOperating HighlightsFinancial Highlights
Letter from the ChairmanManaging Director’s Review
Management Discussion and AnalysisStewardship
Financial ReportsAnnexes
317
2. Basis of Preparation
2.1 Statement of Compliance
The Consolidated Financial Statements of the Group and the separate Financial Statements of the Bank, have been prepared and presented in accordance with the Sri Lanka Accounting Standards laid down by The Institute of Chartered Accountant of Sri Lanka and in compliance with the requirements of the Companies Act No. 07 of 2007 and the Banking Act No. 30 of 1988 and amendments thereto, provide appropriate disclosures as required by the Listing Rules of the Colombo Stock Exchange. These Sri Lanka Accounting Standards are available at www.casrilanka.com.
For all periods up to and including the year ended December 31, 2011, the Group and the Bank prepared their Financial Statements in accordance with Sri Lanka Accounting Standards which were in effect up to that date. Following the convergence of Sri Lanka Accounting Standards with the International Financial Reporting Standards (IFRSs), all existing/new Sri Lanka Accounting Standards were prefixed as SLFRS and LKAS (referred to as ‘SLFRS’ in these Financial Statements) to represent Sri Lanka Accounting Standards corresponding to International Financial Reporting Standards and Sri Lanka Accounting Standards corresponding to International Accounting Standards (IASs), respectively. Accordingly, the Group and the Bank adopted these new Sri Lanka Accounting Standards (which are commonly known as SLFRSs) applicable for financial periods commencing from January 1, 2012.
These Financial Statements for the year ended December 31, 2012 are the first the Group and the Bank prepared in accordance with SLFRS and Sri Lanka Accounting Standard – SLFRS 1 on ‘First-time Adoption of Sri Lanka Accounting Standards’ has been applied.
An explanation of how the transition to SLFRSs has affected the reported financial position, financial performance and cash flows of the Group and the Bank is provided in Note 59 on pages 418 to 431.
The Group and the Bank did not adopt any inappropriate accounting treatments which are not complying with the requirements of the SLFRSs and other laws and regulations governing the preparation and presentation of Financial Statements.
The formats used in the preparation of the Financial Statements and disclosures made comply with the specified format prescribed by the Central Bank of Sri Lanka for the preparation of Annual Statement of Licensed Commercial Banks.
2.2 Responsibility for Financial Statements
The Board of Directors is responsible for the preparation and presentation of the Financial Statements of the Group and the Bank as per the provisions of the Companies Act No. 07 of 2007 and the new Sri Lanka Accounting Standards.
The Board of Directors acknowledges their responsibility as set out in the ‘Annual Report of the Board of Directors’, ‘Statement of Directors’ Responsibility’ and in the statement following the Statement of Financial Position on pages 218, 297 and 309 respectively.
These Financial Statements include the following components:
a Statement of Comprehensive Income providing the information on the financial performance of the Group and the Bank for the year under review (Refer page 306);
a Statement of Financial Position providing the information on the financial position of the Group and the Bank as at the year-end (Refer page 308);
a Statement of Changes in Equity depicting all changes in shareholders’ funds during the year under review of the Group and the Bank (Refer pages 310 to 313);
a Statement of Cash Flows providing the information to the users, on the ability of the Group and the Bank to generate cash and cash equivalents and the needs of entities to utilise those cash flows (Refer pages 314 and 315); and
Notes to the Financial Statements comprising Accounting Policies and other explanatory information (Refer pages 316 to 437).
2.3 Approval of Financial Statements by the Board of Directors
The Financial Statements of the Group and the Bank for the year ended December 31, 2012 (including comparatives) were approved and authorised for issue by the Board of Directors on February 27, 2013.
Notes to the Financial Statements

Commercial Bank of Ceylon PLCCommercial Bank of Ceylon PLC
Annual Report 2012Annual Report 2012
This is Commercial BankOperating HighlightsFinancial Highlights
Letter from the ChairmanManaging Director’s ReviewManagement Discussion and AnalysisStewardshipFinancial ReportsAnnexes
318
2.4 Bases of Measurement
The Financial Statements of the Group and the Bank have been prepared on the historical cost basis except for the following material items in the Statement of Financial Position:
Item and basis of measurement Note No./sPage
reference
Held for trading investments in quoted equity instruments are measured at fair value; 24 353
Liability for defined benefit obligations is recognised as the present value of the defined benefit obligation less the net total of the plan assets, plus unrecognised actuarial gains, less unrecognised past service cost and unrecognised actuarial losses 40 392
Available-for-sale financial assets are measured at fair value 27 371
Land & Buildings which are stated at valuation 30 380
2.5 Functional and Presentation Currency
Items included in the Financial Statements of the Group and the Bank are measured using the currency of the primary economic environment in which the Bank operates (the Functional Currency). These Financial Statements are presented in Sri Lankan Rupees, the Group’s Functional and Presentation Currency. Each entity in the Group determines its own functional currency and items included in the Financial Statements of these entities are measured using that Functional Currency. There was no change in the Group’s Presentation and Functional Currency during the year under review.
The information presented in US Dollars in the Section on ‘Stewardship’ on pages 286 and 287 does not form part of the Financial Statements and is solely for the information of stakeholders.
2.6 Presentation of Financial Statements
The assets and liabilities of the Bank presented in its Statement of Financial Position are grouped by nature and listed in an order that reflects their relative liquidity and maturity pattern. No adjustments have been made for inflationary factors affecting the Financial Statements. An analysis on recovery or settlement within 12 months after the Reporting date and more than 12 months after the Reporting date is presented in Note 50 on pages 403 to 407.
Financial assets and financial liabilities are offset and the net amount reported in the consolidated statement of financial position only when there is a legally enforceable right to offset the recognised amounts and there is an intention to settle on a net basis, or to realise the assets and settle the liability simultaneously. Income and expenses are not offset in the consolidated Statement of Comprehensive Income unless required or permitted by an Accounting Standard or interpretation, and as specifically disclosed in the Accounting Policies of the Bank.
2.7 Materiality and Aggregation
Each material class of similar items is presented separately in the Financial Statements. Items of dissimilar nature or function are presented separately unless they are immaterial as permitted by the Sri Lanka Accounting Standard-LKAS 1 on ‘Presentation of Financial Statements’.
2.8 Rounding
The amounts in the Financial Statements have been rounded-off to the nearest Rupees thousands, except where otherwise indicated as permitted by the Sri Lanka Accounting Standard-LKAS 1 on ‘Presentation of Financial Statements’.
2.9 Significant Accounting Judgments, Estimates and Assumptions
The preparation of the Financial Statements of the Group and the Bank in conformity with SLFRSs requires management to make judgments, estimates and assumptions that affect the application of Accounting Policies and the reported amounts of assets, liabilities, income and expenses. Actual results may differ from these estimates. Estimates and underlying assumptions are reviewed on an ongoing basis. Revisions to accounting estimates are recognised in the period in which the estimate is revised and in any future periods affected.
The most significant areas of estimation, uncertainty and critical judgments in applying accounting policies that have most significant effect on the amounts recognised in the Financial Statements of the Group and Bank are as follows:
2.9.1 Going Concern
The management has made an assessment of its ability to continue as a going concern and is satisfied that it has the resources to continue in business for the foreseeable future. Furthermore, management is not aware of any material uncertainties that may cast significant doubt upon the Group’s ability to continue as a going concern. Therefore, the Financial Statements continue to be prepared on a going concern basis.
Notes to the Financial Statements
Commercial Bank of Ceylon PLCCommercial Bank of Ceylon PLC
Annual Report 2012Annual Report 2012
This is Commercial BankOperating HighlightsFinancial Highlights
Letter from the ChairmanManaging Director’s Review
Management Discussion and AnalysisStewardship
Financial ReportsAnnexes
319
2.9.2 Fair Value of Financial Instruments
The determination of fair values of financial assets and financial liabilities recorded on the Statement of Financial Position for which there is no observable market price are determined using a variety of valuation techniques that include the use of mathematical models. The inputs to these models are derived from observable market data where possible, but if this is not available, judgment is required to establish their fair values. The valuation of financial instruments is described in more detail in Note 3.3.9 on page 328.
The Bank measures fair value using the fair value hierarchy that reflects the significance of input used in making measurements, as described in Note 3.3.9 on page 328.
2.9.3 Financial Assets and Liability Classification
The Bank’s accounting policies provide scope for assets and liabilities to be designated at inception into different accounting categories in certain circumstances
In classifying financial assets or liabilities as ‘Trading’, the Bank has determined that it meets the description of trading assets and liabilities set out in Note 3.3.9 on pages 328 and 329.
In designating financial assets or liabilities at fair value through profit or loss, the Bank has determined that it has met the criteria for this designation set out in Note 3.3.3.1 on page 324. In classifying financial assets as held to maturity, the Bank has determined that it has both the positive intention and ability to hold the assets unit their maturity date as required by Note 3.3.3.4 on page 325.
2.9.4 Impairment Losses on Loans and Advances
The Bank reviews its individually significant loans and advances at each reporting date to assess whether an impairment loss should be provided for in the Statement of Comprehensive Income. In particular, management’s judgment is required in the estimation of the amount and timing of future cash flows when determining the impairment loss. These estimates are based on assumptions about a number of factors and actual results may differ, resulting in future changes to the allowance made.
Loans and advances that have been assessed individually and found not to be impaired and all individually insignificant loans and advances are then assessed collectively, by categorising them into groups of assets with similar risk characteristics, to determine whether a provision should be made due to incurred loss events for which there is objective evidence, but the effects of which are not yet evident. The collective assessment takes account of data from the loan portfolio (such as loan to collateral ratio, level of restructured performing loans, etc.), and judgment on the effect of concentrations of risks and economic data (including policy rates, inflation, growth in GDP, sovereign rating, etc).
The impairment loss on loans and advances is disclosed in more detail in Note 26.2 on page 365.
2.9.5 Impairment Losses on Available for Sale Investments
The Bank reviews its debt securities classified as available for sale investments at each Reporting date to assess whether they are impaired. This requires similar judgments as applied to the individual assessment of loans and advances.
The Bank also records impairment charges on available for sale equity investments when there has been a significant or prolonged decline in the fair value below their cost. The determination of what is ‘significant’ or ‘prolonged’ requires judgment. In making this judgment, the Bank evaluates, among other factors, historical share price movements and duration and extent to which the fair value of an investment is less than its cost.
The impairment loss on available for sale investments is disclosed in Note 27 on page 371.
2.9.6 Impairment Losses on Other Assets
The Group assesses whether there are any indicators of impairment for an asset or a cash-generating unit at each Reporting date or more frequently, if events or changes in circumstances necessitate to do so. This requires the estimation of the ‘value in use’ of such individual assets or the cash-generating units. Estimating value in use requires management to make an estimate of the expected future cash flows from the asset or the cash-generating unit and also to select a suitable discount rate in order to calculate the present value of the relevant cash flows. This valuation requires the Group to make estimates about expected future cash flows and discount rates, and hence, they are subject to uncertainty.
Specific Accounting Policies on impairment of assets are discussed in Note 3.3.10 on page 328.
2.9.7 Deferred Tax Assets
Deferred tax assets are recognised in respect of tax losses to the extent that it is probable that future taxable profit will be available against which the losses can be utilised. Judgment is required to determine the amount of deferred tax assets that can be recognised, based upon the likely timing and level of future taxable profits, together with future tax-planning strategies (Refer Note 5.2 on page 340).
2.9.8 Defined Benefit Obligation
The cost of the defined benefit plans is determined using an actuarial valuation. The actuarial valuation involves making assumptions about discount rates, expected rates of return on assets, future salary increases,
Notes to the Financial Statements

Commercial Bank of Ceylon PLCCommercial Bank of Ceylon PLC
Annual Report 2012Annual Report 2012
This is Commercial BankOperating HighlightsFinancial Highlights
Letter from the ChairmanManaging Director’s ReviewManagement Discussion and AnalysisStewardshipFinancial ReportsAnnexes
320
mortality rates and future pension increases. Due to the long term nature of these plans, such estimates are subject to significant uncertainty. Refer Note 51 on page 407 for the assumptions used.
2.9.9 Provisions for Liabilities and Contingencies
The Group receives legal claims against it in the normal course of business. Management has made judgments as to the likelihood of any claim succeeding in making provisions. The time of concluding legal claims is uncertain, as is the amount of possible outflow of economic benefits. Timing and cost ultimately depend on the due process in respective legal jurisdictions.
Information about significant areas of estimation uncertainty and critical judgments in applying accounting policies other than those stated above that have significant effects on the amounts recognised in the Consolidated Financial Statements are described in Notes 3.14 and 3.15 on page 337.
2.10 Events after the Reporting Period
Events after the reporting period are those events, favourable and unfavourable, that occur between the Reporting date and the date when the Financial Statements are authorised for issue.
In this regard, all material and important events that occurred after the Reporting Period have been considered and appropriate disclosures are made in Note 54 on page 416 where necessary.
Significant Accounting Policies
The Accounting Policies set out below have been applied consistently to all periods presented in the Financial Statements of the Group and the Bank and in preparing the opening SLFRS Statement of Financial Position at January 1, 2011 for the purposes of the transition to SLFRSs, unless otherwise indicated.
These Accounting Policies have been applied consistently by Group entities.
3. Significant Accounting Policies - Statement of Financial Position
3.1 Basis of Consolidation
The Bank’s Financial Statements comprise the amalgamation of the Financial Statements of the Domestic Banking Unit, the Off-Shore Banking Centre and the international operations of the Bank. The Group’s Financial Statements comprise consolidation of the Financial Statements of the Bank, its Subsidiaries in terms of the Sri Lanka Accounting Standard - LKAS 27 on ‘Consolidated and Separate Financial Statements’ and the proportionate share of the profit or loss and net assets of its Associates in terms of the Sri Lanka Accounting Standard - LKAS 28 on ‘Investments in Associates’.
3.1.1 Business combinations and goodwill
Acquisitions on or after January 1, 2010
For acquisitions on or after January 1, 2010, the Group measures goodwill as the fair value of the consideration transferred including the recognised amount of any Non-Controlling Interest in the acquiree, less the net recognised amount (generally fair value) of the identifiable assets acquired and liabilities assumed, all measured as of the acquisition date in terms of the Sri Lanka Accounting Standard - SLFRS 3 on ‘Business Combinations’.
The Group elects on a transaction-by-transaction basis whether to measure non-controlling interest at its fair value, or at its proportionate share of the recognised amount of the identifiable net assets, at the acquisition date.
Transaction costs, other than those associated with the issue of debt or equity securities, that the Group incurs in connection with a business combination are expensed as incurred.
The Sri Lanka Accounting Standard - SLFRS 3 on ‘Business Combinations’ requires that following the initial recognition, goodwill is to be measured at cost, less any accumulated impairment losses and goodwill to be reviewed for impairment, annually or more frequently if events or changes in circumstances indicate that the carrying value may be impaired.
However, acquired goodwill, if any, is written-off in full in the year of acquisition, since the Bank is not permitted to pay dividends otherwise, as per the Section 22 of the Banking Act No. 30 of 1988.
When the excess is negative, a gain from a bargain purchase (formerly known as discount on acquisition) is recognised immediately in profit or loss.
When Subsidiaries/Associates/Other Business Units are disposed off, the difference between the proceeds on disposal and the net assets plus cumulative translation differences which have been directly recognised in equity and unimpaired goodwill, if any, is recognised in the Statement of Comprehensive Income in the year of disposal.
Acquisitions prior to January 1, 2010
As part of its transition to SLFRSs, the Group elected to restate only those business combinations that occurred on or after January 1, 2010. In respect of acquisitions prior to January 1, 2010, goodwill represents the amount recognised under the Group’s previous accounting framework (i.e.; Sri Lanka Accounting Standards (SLASs) that were in force up to December 31, 2010).
Notes to the Financial Statements

Commercial Bank of Ceylon PLCCommercial Bank of Ceylon PLC
Annual Report 2012Annual Report 2012
This is Commercial BankOperating HighlightsFinancial Highlights
Letter from the ChairmanManaging Director’s Review
Management Discussion and AnalysisStewardship
Financial ReportsAnnexes
321
No goodwill/ gain from a bargain purchase arose from the treatment of Associates under the Equity Method since the Group had the respective percentages of ownership in Associates from the commencement of those Associates.
3.1.2 Subsidiaries
Subsidiaries are entities controlled by the Group. The Financial Statements of Subsidiaries are fully consolidated from the date on which control is transferred to the Bank and continue to be consolidated until the date when such control ceases. Control is achieved where the Bank has the power to govern the financial and operating policies of an entity so as to obtain benefits from its activities.
Non-controlling Interests represent the portion of profit or loss and net assets of Subsidiaries not owned, directly or indirectly, by the Bank.
Non-controlling interests are presented separately in the Consolidated Statement of Comprehensive Income and within equity in the Consolidated Statement of Financial Position, but separate from Parent shareholders’ equity. Any losses applicable to the Non-Controlling Interests are allocated against the interests of the Non-Controlling Interest even if this results in a deficit balance. Acquisitions of Non-Controlling Interests are accounted for using the Parent entity extension method, whereby the difference between the consideration and the fair value of the share of the net assets acquired is recognised as equity. Therefore, no goodwill recognised as a result of such transactions.
The Financial Statements of the Bank’s Subsidiaries are prepared for the same reporting year, using consistent accounting policies.
The Financial Statements of all subsidiaries in the Group have a common financial year which ends on December 31.
All intra-group balances, transactions, unrealised gains and losses resulting from intra-group transaction, income and expenses are eliminated in full.
There are no significant restrictions on the ability of Subsidiaries to transfer funds to the Parent (Bank) in the form of cash dividend or repayment of loans and advances.
All Subsidiaries of the Bank have been incorporated in Sri Lanka except Commex Sri Lanka S.R.L. which was incorporated in Italy.
A listing of the Bank’s Subsidiaries together with contingencies of Subsidiaries is set out in Notes 28 and 48.3 (a) to the Financial Statements on pages 376 and 402.
The Bank’s interests in all its Subsidiaries together with the summarised financial information including total assets, total liabilities, revenue, profit or loss and the dividend are given in the Section on ‘Group Structure’ on page 459.
3.1.3 Associates
Associates are those entities in which the Group has significant influence, but not control, over the financial and operating policies. Significant influence is presumed to exist when the Group holds between 20% and 50% of the voting power of another entity.
Investments in associates are accounted for using the equity method (equity accounted investees) and are recognised initially at cost, in terms of Sri Lanka Accounting Standards - LKAS 28 on ‘Investments in Associates’. The Group’s investment includes goodwill identified on acquisition, net of any accumulated impairment losses. The Consolidated Financial Statements include the Group’s share of the income and expenses and equity movements of equity-accounted investees, after adjustments to align the Accounting Policies with those of the Group, from the date that significant influence commences until the date that significant influence ceases. Accordingly, under the Equity Method, investments in Associates are carried at cost plus post-acquisition changes in the Group’s share of net assets of the Associates and are reported as a separate line item in the Statement of Financial Position. The Statement of Comprehensive Income reflects the Group’s share of current year’s profit or loss of the Associates.
When the Group’s share of losses exceeds its interest in an equity-accounted investee, the carrying amount of that interest, including any long-term investments, is reduced to nil, and the recognition of further losses is discontinued except to the extent that the Group has an obligation or has made payments on behalf of the investee. If the Associate subsequently reports profits, the Bank resumes recognising its share of those profits only after its share of the profits equal the share of losses not recognised previously.
The Group discontinues the use of the Equity Method from the date that it ceases to have significant influence over an Associate and accounts for such investments in accordance with the Sri Lanka Accounting Standard - LKAS 39 on ‘Financial Instruments: Recognition and Measurement’.
Where there has been a change recognised directly in the equity of the Associate, the Bank recognises its share of any such changes and discloses this, when applicable, in the Consolidated Statement of Changes in Equity.
Notes to the Financial Statements

Commercial Bank of Ceylon PLCCommercial Bank of Ceylon PLC
Annual Report 2012Annual Report 2012
This is Commercial BankOperating HighlightsFinancial Highlights
Letter from the ChairmanManaging Director’s ReviewManagement Discussion and AnalysisStewardshipFinancial ReportsAnnexes
322
Profits and losses resulting from transactions between the Bank and the Associates are eliminated to the extent of the interest in such Associate.
The Financial Statements of all associates in the Group have a common financial year which ends on December 31.
There are no significant restrictions on the ability of the Associates to transfer funds to the Parent (the Bank) in the form of cash dividend or repayment of loans and advances.
A listing of the Group’s Associates together with their fair values and the Group’s share of contingent liabilities of such Associates are set out in Notes 29 and 48.3 (b) to the Financial Statements on pages 378 and 402.
Summarised financial information of all Associates of the Bank together with the Bank’s interests is given in the Section on ‘Group Structure’ on page 459.
3.1.4 Loss of Control
Upon the loss of control, the Group derecognises the assets and liabilities of the subsidiary, any Non-Controlling Interests and the other components of equity related to the subsidiary. Any surplus or deficit arising on the loss of control is recognised in profit or loss. If the Group retains any interest in the previous subsidiary, then such interest is measured at fair value at the date that control is lost. Subsequently it is accounted for as an equity-accounted investee or in accordance with the Group’s Accounting Policy for financial instruments (see Accounting Policy 3.1.3 above) depending on the level of influence retained.
3.1.5 Transactions Eliminated on Consolidations
Intra-group balances and transactions, and any unrealised income and expenses arising from intra-group transactions, are eliminated in preparing the Consolidated Financial Statements. Unrealised gains arising from transactions with equity accounted investees are eliminated against the investment to the extent of the Group’s interest in the investee. Unrealised losses are eliminated in the same way as unrealised gains, but only to the extent that there is no evidence of impairment.
3.1.6 Material Gains or Losses, Provisional Values or Error Corrections
There were no material gains or losses, provisional values or error corrections recognised during the year in respect of the business combinations that took place in previous periods.
3.2 Foreign Currency
3.2.1 Foreign Currency Translations
The Group’s Consolidated Financial Statements are presented in Sri Lankan Rupees, which is also the Bank’s functional currency. Each entity in the Group determines its own functional currency and items included in the Financial Statements of each entity are measured using that functional currency. The Group has elected to recycle the gain or loss that arises from the direct method of consolidation, which is the method the Group uses to complete its consolidation. The Financial Statements of the Off-Shore Banking Unit of the Bank and the Financial Statements of the Foreign Operation of the Bank have been translated into the Group’s Presentation Currency as explained under Notes 3.2.2 and 3.2.3 below:
3.2.2 Foreign Currency Transactions and Balances
Foreign currency transactions are translated into the Functional Currency, which is Sri Lankan Rupees, using the exchange rates prevailing at the dates of the transactions. In this regard, the Bank’s practice is to use the middle rate of exchange ruling at the date of the transaction.
Monetary assets and liabilities denominated in foreign currencies at the Reporting date are retranslated to the Functional Currency at the middle exchange rate of the Functional Currency Ruling at the Reporting date. The foreign currency gain or loss on monetary items is the difference between amortised cost in the Functional Currency at the beginning of the year adjusted for effective interest and payments during the year, and the amortised cost in foreign currency translated at the exchange rate at the end of the year.
Non-monetary assets and liabilities denominated in foreign currencies that are measured at fair value are retranslated to the Functional Currency at the exchange rate at the date that the fair value was determined. Foreign currency differences arising on retranslation are recognised in profit or loss, except for differences arising on the retranslation of available-for-sale equity instruments, a financial liability designated as a hedge of the net investment in a foreign operation, or qualifying cash flow hedges, which are recognised in Other Comprehensive Income. Non-monetary items that are measured in terms of historical cost in a foreign currency are translated using the exchange rate at the date of the transaction.
Goodwill arising on the acquisition of a foreign operation and any fair value adjustments to the carrying amounts of assets and liabilities arising on the acquisition are treated as assets and liabilities of the foreign operation and are translated at the exchange rates ruling at the Reporting date.
Notes to the Financial Statements

Commercial Bank of Ceylon PLCCommercial Bank of Ceylon PLC
Annual Report 2012Annual Report 2012
This is Commercial BankOperating HighlightsFinancial Highlights
Letter from the ChairmanManaging Director’s Review
Management Discussion and AnalysisStewardship
Financial ReportsAnnexes
323
3.2.3 Transactions of the Off-Shore Banking Centre
These have been recorded in accordance with Note 3.2.1 above, except the application of the annual weighted average exchange rate for translation of the Statement of Comprehensive Income. Net gains and losses are dealt through the Statement of Comprehensive Income.
3.2.4 Foreign Operations
The results and financial position of overseas branch operations that have a Functional Currency different from the Bank’s Presentation Currency are translated into the Bank’s Presentation Currency as follows:
Assets and liabilities are translated at the rates of exchange ruling at the Reporting date.
Income and expenses are translated at the average exchange rate for the period, unless this average rate is not a reasonable approximation of the rate prevailing at the transaction date, in which case income and expenses are translated at the exchange rate ruling at the transaction date.
All resulting exchange differences are recognised in the Foreign Currency Translation Reserve, which is a separate component of Equity.
When a foreign operation is disposed off, the deferred cumulative translation gain or loss recognised in Equity relating to that particular foreign operation is recognised in the Statement of Comprehensive Income as part of the gain or loss on disposal.
Goodwill arising on the acquisition of a foreign operation and any fair value adjustments to the carrying amounts of assets and liabilities arising on the acquisition are treated as assets and liabilities of the foreign operation and are translated at the exchange rates ruling at the Reporting date.
3.3 Financial Instruments - Initial Recognition, Classification and Subsequent Measurement
3.3.1 Date of Recognition
All financial assets and liabilities except ‘Regular way trades’ are initially recognised on the trade date, i.e., the date that the Group becomes a party to the contractual provisions of the instrument. Regular way trades means purchases or sales of financial assets that require delivery of assets within the time frame generally established by regulation or convention in the market place. Those trades are initially recognised on the settlement date.
3.3.2 Initial Measurement of Financial Instruments
The classification of financial instruments at initial recognition depends on their purpose and characteristics and the management’s intention in acquiring them. Please refer 3.3.3 and 3.3.4 below for further details on classification of Financial Instruments.
All financial instruments are measured initially at their fair value plus transaction costs that are directly attributable to acquisition or issue of such financial instrument, except in the case of financial assets and financial liabilities at fair value through profit or loss as per the Sri Lanka Accounting Standard - LKAS 39 on ‘Financial Instruments: Recognition and Measurement’.
Transaction cost in relation to financial assets and financial liabilities at fair value through profit or loss are dealt with through the Statement of Comprehensive Income.
3.3.2.1 ‘Day 1’ profit or loss
When the transaction price differs from the fair value of other observable current market transactions in the same instrument, or based on a valuation technique whose variables include only data from observable markets, the Bank immediately recognises the difference between the transaction price and fair value (a ‘Day 1’ profit or loss) in ‘Interest Income and Personnel Expenses’. In cases where fair value is determined using data which is not observable, the difference between the transaction price and model value is only recognised in the Statement of Comprehensive Income when the inputs become observable, or when the instrument is derecognised. The ‘Day 1 loss’ arising in the case of loans granted to employees at concessionary rates under uniformly applicable schemes is deferred and amortised using Effective Interest Rates (EIR) over the remaining service period of the employees or tenure of the loan whichever is shorter.
3.3.3 Classification and Subsequent Measurement of Financial Assets
At inception a financial asset is classified into one of the following categories:
At fair value through profit or loss:
Held for trading; or
Designated at fair value through profit or loss.
Available-for-sale.
Loans and receivables;
Held to maturity; or
The subsequent measurement of financial assets depends on their classification.
Please refer accounting policies 3.3.3.1.1, 3.3.3.1.2 and 3.3.3.1.3 on pages 324 and 325.
Notes to the Financial Statements

Commercial Bank of Ceylon PLCCommercial Bank of Ceylon PLC
Annual Report 2012Annual Report 2012
This is Commercial BankOperating HighlightsFinancial Highlights
Letter from the ChairmanManaging Director’s ReviewManagement Discussion and AnalysisStewardshipFinancial ReportsAnnexes
324
3.3.3.1 Financial Assets at Fair Value through Profit or Loss
Financial assets at fair value through profit or loss includes financial assets held for trading and financial assets designated upon initial recognition at fair value through profit or loss which are discussed in 3.3.3.1.1 and 3.3.3.1.2 below.
3.3.3.1.1 Financial Assets Held for Trading
Financial assets are classified as held for trading if they are acquired principally for the purpose of selling or repurchasing in the near term or holds as a part of a portfolio that is managed together for short-term profit or position taking. This category also includes derivative financial instruments entered into by the Group that are not designated as hedging instruments in hedge relationships as defined by the Sri Lanka Accounting Standard - LKAS 39 on ‘Financial Instruments: Recognition and Measurement’.
Financial assets held for trading are recorded in the Statement of Financial Position at fair value. Changes in fair value are recognised in profit or loss. Interest and dividend income is recorded in ‘Net trading income’ according to the terms of the contract, or when the right to receive the payment has been established.
The Group evaluates its financial assets held for trading, other than derivatives, to determine whether the intention to sell them in the near term is still appropriate. When the Group is unable to trade these financial assets due to inactive markets and management’s intention to sell them in the foreseeable future significantly changes, the Group may elect to reclassify these financial assets in rare circumstances.
Financial assets held for trading include instruments such as Government and other debt securities and equity instrument that have been acquired principally for the purpose of selling or repurchasing in the near term and derivatives, including separated embedded derivatives explained below unless they are designated as effective hedging instruments.
Details of Financial assets held for trading are given in Note 24 on page 353 and on the face of the Statement of Financial Position.
Derivatives Recorded at Fair Value through Profit or LossThe Bank uses derivatives such as interest rate swaps, foreign currency swaps and forward foreign exchange contracts, etc. Derivatives are recorded at fair value and carried as assets when their fair value is positive and as liabilities when their fair value is negative. Changes in the fair value of derivatives are included in ‘Net trading income’.
Derivatives embedded in other financial instruments are treated as separate derivatives and recorded at fair value if their economic characteristics and risks are not closely related to those of the host
contract, and the host contract is not itself held for trading or designated at fair value through profit or loss. The embedded derivatives separated from the host are carried at fair value in the trading portfolio with changes in fair value recognised in the Statement of Comprehensive Income.
Details of derivatives recorded at fair value through profit or loss are given in Notes 23 and 36 on pages 353 and 391.
3.3.3.1.2 Financial Assets Designated at Fair Value through Profit or Loss
The Group designates financial assets at fair value through profit or loss in the following circumstances:
the assets are managed, evaluated and reported internally at fair value;
the designation eliminates or significantly reduces an accounting mismatch, which would otherwise have arisen; or
the asset contains an embedded derivative that significantly modifies the cash flows that would otherwise have been required under the contract.
Financial assets designated at fair value through profit or loss are recorded in the Statement of Financial Position at fair value. Changes in fair value are recorded in ‘Net gain or loss on financial assets and liabilities designated at fair value through profit or loss’. Interest earned is accrued in ‘Interest Income’, using the EIR, while dividend income is recorded in ‘other operating income’ when the right to the payment has been established.
The Group has not designated any financial assets upon initial recognition as at fair value through profit or loss.
3.3.3.2 Loans and Receivables to Banks and Other Customers
‘Loans and receivables to banks and other customers’ include non-derivative financial assets with fixed or determinable payments that are not quoted in an active market, other than:
Those that the Group intends to sell immediately or in the near term and those that the Group, upon initial recognition, designates as at fair value through profit or loss
Those that the Group, upon initial recognition, designates as available for sale
Those for which the Group may not recover substantially all of its initial investment, other than because of credit deterioration
‘Loans and receivable to banks and other customers’ include Loans & Advances, Bills of Exchange and Lease Receivable of the Group.
Notes to the Financial Statements

Commercial Bank of Ceylon PLCCommercial Bank of Ceylon PLC
Annual Report 2012Annual Report 2012
This is Commercial BankOperating HighlightsFinancial Highlights
Letter from the ChairmanManaging Director’s Review
Management Discussion and AnalysisStewardship
Financial ReportsAnnexes
325
When the Group is the lessor in a lease agreement that transfers substantially all of the risks and rewards incidental to ownership of the asset to the lessee, the arrangement is classified as a finance lease. Amounts receivable under finance leases net of initial rentals received, unearned lease income and provision for impairment are classified as Lease receivable and are presented within ‘loans and receivables to customers’ in the Statement of Financial Position.
After initial measurement, ‘loans and receivables to banks and other customers’ are subsequently measured at amortised cost using the EIR, less allowance for impairment except when the Group recognises loans and receivables at fair value through profit or loss. Amortised cost is calculated by taking into account any discount or premium on acquisition and fees and costs that are an integral part of the EIR. The amortisation is included in ‘Interest Income’ in the Statement of Comprehensive Income. The losses arising from impairment are recognised in the Statement of Comprehensive Income in ‘Impairment charges for loans and other losses’.
The Bank may enter into certain lending commitments where the loan, on draw down, is expected to be classified as Held for Trading because the intent is to sell the loans in the short term. These commitments to lend, if any are recorded as derivatives and measured at fair value through profit or loss. Where the loan, on drawdown, is expected to be retained by the Bank, and not sold in the short term, the commitment is recorded only when it is an onerous contract that is likely to give rise to a loss.
Details of ‘loans and receivables to banks and other customers’ are given in Notes 25 and 26 on pages 362 and 363 respectively.
3.3.3.3 Other Financial Investments Classified as Loans and Receivables
‘Other financial investments classified as loans and receivables’ include unquoted debt instruments. After initial measurement, these are subsequently measured at amortised cost using the EIR, less allowance for impairment. Amortised cost is calculated by taking into account any discount or premium on acquisition and fees and costs that are an integral part of the EIR. The amortisation is included in ‘Interest Income’ in the Statement of Comprehensive Income . The losses arising from impairment are recognised in the Statement of Comprehensive Income in ‘impairment charges for loans and other losses’.
Details of ‘Other Financial Investments Classified as Loans and Receivables’ are given in Note 26 on page 363.
3.3.3.4 Held to Maturity Financial Investments
Held to Maturity financial investments are non-derivative financial assets with fixed or determinable payments and fixed maturities, which the Group has the intention and ability to hold to maturity. After initial measurement, held to maturity financial investments are subsequently measured at amortised cost using the EIR, less impairment. Amortised cost is calculated by taking into account any discount or premium on acquisition and fees that are an integral part of the EIR. The amortisation is included in ‘Interest Income’ in the Statement of Comprehensive Income. The losses arising from impairment of such investments are recognised in the Statement of Comprehensive Income in ‘impairment charges for loans and other losses’.
If the Group were to sell or reclassify more than an insignificant amount of Held to Maturity investments before maturity (other than in certain specific circumstances permitted in the Sri Lanka Accounting Standard - LKAS 39 on ‘Financial Instruments: Recognition and Measurement’), the entire category would be tainted and would have to be reclassified as Available for Sale. Furthermore, the Group would be prohibited from classifying any financial asset as Held to Maturity during the following two years.
The Group has not designated any financial instrument as Held to Maturity financial investment.
3.3.3.5 Available for Sale Financial Investments
Available-for-sale investments include equity and debt securities. Equity investments classified as Available-for-Sale are those which are neither classified as held for trading nor designated at fair value through profit or loss. Debt securities in this category are intended to be held for an indefinite period of time and may be sold in response to needs for liquidity or in response to changes in the market conditions.
The Group has not designated any loans or receivables as available-for-sale.
After initial measurement, available for sale financial investments are subsequently measured at fair value.
Unrealised gains and losses are recognised directly in Equity through Other Comprehensive Income in the ‘available-for-sale reserve’. When the investment is disposed of, the cumulative gain or loss previously recognised in Equity is recognised in the Statement of Comprehensive Income in ‘Other operating income’. Where the Group holds more than one investment in the same security, they are deemed to be disposed of on a first-in first-out basis. Interest earned whilst holding Available-for-Sale financial investments is reported as ‘Interest Income’ using the EIR. Dividends earned whilst holding Available-for-Sale financial investments are recognised in the Statement of Comprehensive Income as ‘Other
Notes to the Financial Statements

Commercial Bank of Ceylon PLCCommercial Bank of Ceylon PLC
Annual Report 2012Annual Report 2012
This is Commercial BankOperating HighlightsFinancial Highlights
Letter from the ChairmanManaging Director’s ReviewManagement Discussion and AnalysisStewardshipFinancial ReportsAnnexes
326
operating income’ when the right to receive the payment has been established. The losses arising from impairment of such investments are recognised in the Statement of Comprehensive Income in ‘Impairment losses on financial investments’ and removed from the ‘Available for Sale reserve’.
Details of Available-for-Sale financial investments are given in Note 27 on page 371.
3.3.3.6 Cash and cash equivalents
Cash and Short-term funds include cash in hand, placements with banks and loans at call and at short notice that are subject to an insignificant risk of changes in their fair value, and are used by the Group in the management of its short-term commitments. They are brought to Financial Statements at their face values or the gross values, where appropriate. There were no cash and cash equivalents held by the Group companies that were not available for use by the Group.
Cash and cash equivalents are carried at amortised cost in the Statement of Financial Position.
Details of cash and cash equivalents are given in Note 20 to the Financial Statements on page 351.
3.3.3.7 Balances with Central Banks
The Monetary Law Act requires that all commercial banks operating in Sri Lanka to maintain a statutory reserve equal to 8% on all deposit liabilities denominated in Sri Lankan Rupees (8% in 2011). The Bank’s Bangladesh operation is required to maintain the statutory liquidity requirement of 19% (19% in 2011) on time and demand liabilities (both local and foreign currencies), inclusive of 6% (6% in 2011) in the form of a Cash Reserve Requirement and the balance 13% (13% in 2011) by way of foreign currency and/or in the form of unencumbered securities held with the Bangladesh Bank.
Cash and cash equivalents are carried at amortised cost in the Statement of Financial Position.
Details of the balances with Central Banks are given in Note 21 to the Financial Statements on page 352.
3.3.4 Classification and Subsequent Measurement of Financial Liabilities
At inception a financial liability is classified into one of the following categories:
At fair value through profit or loss or
Held for trading; or
Designated at fair value through profit or loss.
At amortised cost
The subsequent measurement of financial liabilities depends on their classification.
Please refer accounting policies 3.3.4.1 and 3.3.4.2 on page 326.
3.3.4.1 Financial Liabilities at Fair Value through Profit or Loss
Financial liabilities at fair value through profit or loss include financial liabilities held for trading and financial liabilities designated upon initial recognition as at fair value through profit or loss.
Financial liabilities are classified as held for trading if they are acquired principally for the purpose of selling or repurchasing in the near term or holds as a part of a portfolio that is managed together for short-term profit or position taking. This category includes derivative financial instruments entered into by the Group that are not designated as hedging instruments in hedge relationships as defined by the Sri Lanka Accounting Standard - LKAS 39 on ‘Financial Instruments: Recognition and Measurement’. Separated embedded derivatives are also classified as held for trading unless they are designated as effective hedging instruments.
Gains or losses on liabilities held for trading are recognised in the Statement of Comprehensive Income.
The Group has not designated any financial liabilities upon initial recognition as at fair value through profit or loss.
3.3.4.2 Financial Liabilities at Amortised Cost
Financial instruments issued by the Bank that are not designated at fair value through profit or loss, are classified as liabilities under ‘Due to Banks’, ‘Debt Securities Issued’ or ‘Subordinated Term Debts’ as appropriate, where the substance of the contractual arrangement results in the Bank having an obligation either to deliver cash or another financial asset to the holder, or to satisfy the obligation other than by the exchange of a fixed amount of cash or another financial asset for a fixed number of own equity shares.
After initial recognition, such financial liabilities are subsequently measured at amortised cost using the EIR method. Amortised cost is calculated by taking into account any discount or premium on acquisition and fees or costs that are an integral part of the EIR. The EIR amortisation is included in ‘Interest Expenses’ in the Statement of Comprehensive Income. Gains and losses are recognised in the Statement of Comprehensive Income when the liabilities are derecognised as well as through the EIR amortisation process.
The details of the Bank’s Financial liabilities at amortised cost is disclosed in Notes 35 and 42 on pages 390 and 393.
Notes to the Financial Statements

Commercial Bank of Ceylon PLCCommercial Bank of Ceylon PLC
Annual Report 2012Annual Report 2012
This is Commercial BankOperating HighlightsFinancial Highlights
Letter from the ChairmanManaging Director’s Review
Management Discussion and AnalysisStewardship
Financial ReportsAnnexes
327
3.3.5 Reclassification of Financial Instruments
The Bank reclassifies non-derivative financial assets out of the ‘held for trading’ category and into the ‘available-for-sale’, ‘loans and receivables’, or ‘held to maturity’ categories as permitted by the Sri Lanka Accounting Standards - LKAS 39 on ‘Financial Instruments: Recognition and Measurement’. Further, in certain circumstances, the Bank is permitted to reclassify financial instruments out of the ‘available-for-sale’ category and into the ‘loans and receivables’ category. Reclassifications are recorded at fair value at the date of reclassification, which becomes the new amortised cost.
For a financial asset with a fixed maturity reclassified out of the ‘available-for-sale’ category, any previous gain or loss on that asset that has been recognised in equity is amortised to profit or loss over the remaining life of the investment using the EIR. Any difference between the new amortised cost and the expected cash flows is also amortised over the remaining life of the asset using the EIR. In the case of a financial asset does not have a fixed maturity, the gain or loss is recognised in the profit or loss when such financial asset is sold or disposed of. If the financial asset is subsequently determined to be impaired, then the amount recorded in equity is recycled to the Statement of Comprehensive Income.
The Bank may reclassify a non-derivative trading asset out of the ‘held for trading’ category and into the ‘loans and receivables’ category if it meets the definition of loans and receivables and the Bank has the intention and ability to hold the financial asset for the foreseeable future or until maturity. If a financial asset is reclassified, and if the Bank subsequently increases its estimates of future cash receipts as a result of increased recoverability of those cash receipts, the effect of that increase is recognised as an adjustment to the EIR from the date of the change in estimate.
Reclassification is at the election of management, and is determined on an instrument-by-instrument basis.
The Bank does not reclassify any financial instrument into the fair value through profit or loss category after initial recognition. Further, the Bank does not reclassify any financial instrument out of the fair value through profit or loss category if upon initial recognition it was designated as at fair value through profit or loss.
3.3.6 Derecognition of Financial Assets and Financial Liabilities
3.3.6.1 Financial Assets
A financial asset (or, where applicable a part of a financial asset or part of a group of similar financial assets) is derecognised when:
The rights to receive cash flows from the asset have expired; or
The Bank has transferred its rights to receive cash flows from the asset or has assumed an obligation to pay the received cash flows in full without material delay to a third party under a ‘pass-through’ arrangement; and either:
The Bank has transferred substantially all the risks and rewards of the asset; or
The Bank has neither transferred nor retained substantially all the risks and rewards of the asset, but has transferred control of the asset.
On derecognition of a financial asset, the difference between the carrying amount of the asset (or the carrying amount allocated to the portion of the asset transferred), and consideration received (including any new asset obtained less any new liability assumed) and any cumulative gain or loss that had been recognised in Other Comprehensive Income is recognised in profit or loss.
When the Bank has transferred its rights to receive cash flows from an asset or has entered into a pass-through arrangement, and has neither transferred nor retained substantially all of the risks and rewards of the asset nor transferred control of the asset, the asset is recognised to the extent of the Bank’s continuing involvement in the asset. In that case, the Bank also recognises an associated liability. The transferred asset and the associated liability are measured on a basis that reflects the rights and obligations that the Bank has retained.
Continuing involvement that takes the form of a guarantee over the transferred asset is measured at the lower of the original carrying amount of the asset and the maximum amount of consideration that the Bank could be required to repay.
3.3.6.2 Financial Liabilities
A financial liability is derecognised when the obligation under the liability is discharged or cancelled or expires.
Where an existing financial liability is replaced by another from the same lender on substantially different terms, or the terms of an existing liability are substantially modified, such an exchange or modification is treated as a derecognition of the original liability and the recognition of a new liability. The difference between the carrying value of the original financial liability and the consideration paid, including any non-cash assets transferred or liabilities assumed, is recognised in profit or loss.
Notes to the Financial Statements

Commercial Bank of Ceylon PLCCommercial Bank of Ceylon PLC
Annual Report 2012Annual Report 2012
This is Commercial BankOperating HighlightsFinancial Highlights
Letter from the ChairmanManaging Director’s ReviewManagement Discussion and AnalysisStewardshipFinancial ReportsAnnexes
328
3.3.7 Reverse Repurchase Agreements
Securities sold under agreements to repurchase at a specified future date are not derecognised from the Statement of Financial Position as the Bank retains substantially all of the risks and rewards of ownership. The corresponding cash received is recognised in the Consolidated Statement of Financial Position as an asset with a corresponding obligation to return it, including accrued interest as a liability under ‘securities sold under repurchase agreements’, reflecting the transaction’s economic substance as a loan to the Bank. The difference between the sale and repurchase prices is treated as interest expense and is accrued over the life of agreement using the EIR. When the counterparty has the right to sell or repledge the securities, the Bank reclassifies those securities in its Statement of Financial Position to ‘financial assets held for trading pledged as collateral’ or to ‘financial investments available for sale pledged as collateral’, as appropriate.
3.3.8 Offsetting of Financial Instruments
Financial assets and financial liabilities are offset and the net amount reported in the Consolidated Statement of Financial Position if, and only if, there is a currently enforceable legal right to offset the recognised amounts and there is an intention to settle on a net basis, or to realise the assets and settle the liabilities simultaneously.
Income and expenses are presented on a net basis only when permitted under SLFRSs, or for gains and losses arising from a group of similar transactions such as in the Group’s trading activity.
3.3.9 Determination of Fair Value
Fair value is the amount for which an asset could be exchanged, or a liability settled, between knowledgeable, willing parties in an arm’s length transaction on the measurement date.
Fair Value Measurement Hierarchy
Level 1
When available, the Group measures the fair value of an instrument using active quoted prices or dealer price quotations (assets and long positions are measured at a bid price; liabilities and short positions are measured at an asking price), without any deduction for transaction costs. A market is regarded as active if quoted prices are readily and regularly available and represent actual and regularly occurring market transactions on an arm’s length basis.
Level 2
If a market for a financial instrument is not active, then the Group establishes fair value using a valuation technique. Valuation techniques include using recent arm’s length transactions between knowledgeable, willing parties (if available), reference to the current fair value of other instruments that are substantially the same, discounted cash flow analyses, credit models, option pricing models and other relevant valuation models. The chosen valuation technique makes maximum use of market inputs, relies as little as possible on estimates specific to the Group, incorporates all factors that market participants would consider in setting a price, and is consistent with accepted economic methodologies for pricing financial instruments. Inputs to valuation techniques reasonably represent market expectations and measures of the risk-return factors inherent in the financial instrument. The Group calibrates valuation techniques and tests them for validity using prices from observable current market transactions in the same instrument or based on other available observable market data.
Level 3
Certain financial instruments are recorded at fair value using valuation techniques in which current market transactions or observable market data are not available. Their fair value is determined by using valuation models that have been tested against prices or inputs to actual market transactions and also using the Bank’s best estimate of the most appropriate model assumptions. Models are adjusted to reflect the spread for bid and ask prices to reflect costs to close out positions, credit and debit valuation adjustments, liquidity spread and limitations in the models. Also, profit or loss calculated when such financial instruments are first recorded (‘Day 1’ profit or loss) is deferred and recognised only when the inputs become observable or on derecognition of the instrument (See Note 3.3.2.1 on page 323).
An analysis of fair values of financial instruments and further details as to how they are measured are provided in Note 3.3 on page 323.
3.3.10 Impairment of Financial Assets
At each reporting date the Group assesses whether there is objective evidence that a financial asset or a group of financial assets not carried at fair value through profit or loss are impaired. A financial asset or a group of financial assets is deemed to be impaired if, and only if, there is objective evidence of impairment as a result of one or more events that have occurred after the initial recognition of the asset (an ‘incurred loss event’) and that loss event (or events) has an impact on the estimated future cash flows of the financial asset or the group of financial assets that can be reliably estimated.
Notes to the Financial Statements

Commercial Bank of Ceylon PLCCommercial Bank of Ceylon PLC
Annual Report 2012Annual Report 2012
This is Commercial BankOperating HighlightsFinancial Highlights
Letter from the ChairmanManaging Director’s Review
Management Discussion and AnalysisStewardship
Financial ReportsAnnexes
329
Objective evidence that financial assets (including equity securities) are impaired can include:
significant financial difficulty of the borrower or issuer,
reschedulement of credit facilities,
default or delinquency by a borrower,
restructuring of a loan or advance by the Group on terms that the Group would not otherwise consider,
indications that a borrower or issuer will enter bankruptcy,
the disappearance of an active market for a security, or
other observable data relating to a group of assets such as adverse changes in the payment status of borrowers or issuers in the group, or economic conditions that correlate with defaults in the group.
In addition, for an investment in an equity security, a significant or prolonged decline in its fair value below its cost is objective evidence of impairment.
3.3.10.1 Impairment of Financial Assets carried at Amortised Cost
For financial assets carried at amortised cost (such as amounts due from banks, loans and advances to customers as well as held to maturity investments, if any), the Bank first assesses individually whether objective evidence of impairment exists for financial assets that are individually significant, or collectively for financial assets that are not individually significant. If the Bank determines that no objective evidence of impairment exists for an individually assessed financial asset, it includes the asset in a group of financial assets with similar credit risk characteristics and collectively assesses them for impairment. Assets that are individually assessed for impairment and for which an impairment loss is, or continues to be, recognised are not included in a collective assessment of impairment.
If there is objective evidence that an impairment loss has been incurred, the amount of the loss is measured as the difference between the asset’s carrying amount and the present value of estimated future cash flows (excluding future expected credit losses that have not yet been incurred). The carrying amount of the asset is reduced through the use of an allowance account and the amount of impairment loss is recognised in the Statement of Comprehensive Income. Interest income continues to be accrued on the reduced carrying amount/impaired balance and is accrued using the rate of interest used to discount the future cash flows for the purpose of measuring the impairment loss. The interest income is recorded as part of ‘Interest income’.
Loans together with the associated allowance are written-off when there is no realistic prospect of future recovery and all collateral has been realised or has been transferred to the Bank. If, in a subsequent year, the amount of the estimated impairment loss increases or decreases because of an event occurring after the impairment was recognised, the previously recognised impairment loss is increased or reduced by adjusting the allowance account. If a future write-off is later recovered, the recovery is credited to the ’credit loss expense’.
The present value of the estimated future cash flows is discounted at the financial asset’s original EIR. If a loan has a variable interest rate, the discount rate for measuring any impairment loss is the current EIR. If the Bank has reclassified trading assets to loans and advances, the discount rate for measuring any impairment loss is the new EIR determined at the reclassification date. The calculation of the present value of the estimated future cash flows of a collateralised financial asset reflects the cash flows that may result from foreclosure less costs for obtaining and selling the collateral, whether or not foreclosure is probable.
For the purpose of a collective evaluation of impairment, financial assets are grouped on the basis of the Bank’s internal credit grading system, that considers credit risk characteristics such as asset type, industry, geographical location, collateral type, past-due status and other relevant factors.
Future cash flows on a group of financial assets that are collectively evaluated for impairment are estimated on the basis of historical loss experience for assets with credit risk characteristics similar to those in the group. Historical loss experience is adjusted on the basis of current observable data to reflect the effects of current conditions on which the historical loss experience is based and to remove the effects of conditions in the historical period that do not exist currently.
Estimates of changes in future cash flows reflect, and are directionally consistent with, changes in related observable data from year-to-year (such as changes in policy rates, inflation, growth in GDP, sovereign rating, or other factors that are indicative of incurred losses in the group and their magnitude). The methodology and assumptions used for estimating future cash flows are reviewed regularly to reduce any differences between loss estimates and actual loss experience.
Details of impairment losses on financial assets carried at amortised cost and an analysis of the impairment allowance on loans and advances by class are given in Note 12 on page 343.
Notes to the Financial Statements

Commercial Bank of Ceylon PLCCommercial Bank of Ceylon PLC
Annual Report 2012Annual Report 2012
This is Commercial BankOperating HighlightsFinancial Highlights
Letter from the ChairmanManaging Director’s ReviewManagement Discussion and AnalysisStewardshipFinancial ReportsAnnexes
330
Impairment of Rescheduled Loans and Advances
Where possible, the Bank seeks to reschedule loans and advances rather than to take possession of collateral. This may involve extending the payment arrangements and the agreement of new loan conditions. In case of individually significant rescheduled credit facilities, once the terms have been renegotiated, any impairment is measured using the original EIR as calculated before the modification of terms and the loan/advance is no longer considered past due. Management continually reviews renegotiated loans and advances to ensure that all criteria are met and that future payments are likely to occur.
Collateral Valuation
The Bank seeks to use collateral, where possible, to mitigate its risks on financial assets. The collateral comes in various forms such as cash, gold, securities, letters of credit/guarantees, real estate, receivables, inventories, other non-financial assets and credit enhancements such as netting agreements. The fair value of collateral is generally assessed, at a minimum, at inception and based on the Bank’s annual reporting schedule.
To the extent possible, the Bank uses active market data for valuing financial assets, held as collateral. Other financial assets which do not have a readily determinable market value are valued using models. Non-financial collateral, such as real estate, is valued based on data provided by third parties such as professional valuers, Audited Financial Statements, and other independent sources.
Collateral Repossessed
The Bank’s policy is to carry collaterals repossessed at fair value at the repossession date and such assets will be disposed at the earliest possible opportunity. These assets are recorded under assets held for sale as per the Sri Lanka Accounting Standard - SLFRS 5 on ‘Non-Current Assets Held for Sale and Discontinued Operations’.
3.3.10.2 Impairment of Financial Investments - Available for Sale
For available for sale financial investments, the Bank assesses at each Reporting date whether there is objective evidence that an investment is impaired.
In the case of debt instruments classified as available-for-sale, the Bank assesses individually whether there is objective evidence of impairment based on the same criteria as financial assets carried at amortised cost. However, the amount recorded for impairment is the cumulative loss measured as the difference between the amortised cost and the current fair value, less any impairment loss on that investment previously recognised in the Statement of Comprehensive Income. Future interest
income is based on the reduced carrying amount/impaired balance and is accrued using the rate of interest used to discount the future cash flows for the purpose of measuring the impairment loss. The interest income on such assets too is recorded within ‘Interest income’. If, in a subsequent period, the fair value of a debt instrument increases and the increase can be objectively related to a credit event occurring after the impairment loss was recognised in the Statement of Comprehensive Income, the impairment loss is reversed through the Statement of Comprehensive Income.
In the case of equity investments classified as available for sale, objective evidence would also include a ‘significant’ or ‘prolonged’ decline in the fair value of the investment below its cost. Where there is evidence of impairment, the cumulative loss measured as the difference between the acquisition cost and the current fair value, less any impairment loss on that investment previously recognised in the Statement of Comprehensive Income is removed from equity and recognised in the Statement of Comprehensive Income. However, any subsequent recovery in the fair value of an impaired available-for-sale equity security is recognised in Other Comprehensive Income.
The Group writes-off certain Financial Investment - Available-for-Sale when they are determined to be uncollectible.
3.4 Non-Current Assets Held-for-Sale and Disposal Groups
These are Non-current Assets and disposal groups classified as held-for-sale as at the Reporting date. The Bank intends to recover the value of these assets principally through a sale transaction rather than through continuing use. This condition is regarded as met only when the sale is highly probable and the asset or disposal group is available for immediate sale in its present condition, management has committed to the sale, and the sale is expected to have been completed within one year from the date of classification.
As per the Sri Lanka Accounting Standard - SLFRS 5 on ‘Non-current Assets held for Sale and Discontinued Operations’, these assets are measured at the lower of the carrying amount and fair value, less costs to sell. Thereafter, the Bank assesses at each Reporting date or more frequently if events or changes in circumstances indicate that the investment or a group of investment is impaired. The Bank recognises an impairment loss for any initial or subsequent write down of the assets to fair value less costs to sell and also recognises a gain for any subsequent increase in fair value less costs to sell of an asset, only to the extent of the cumulative impairment losses that have been recognised previously. As a result, once classified, the Bank neither amortise nor depreciate the assets classified as held for sale.
Notes to the Financial Statements

Commercial Bank of Ceylon PLCCommercial Bank of Ceylon PLC
Annual Report 2012Annual Report 2012
This is Commercial BankOperating HighlightsFinancial Highlights
Letter from the ChairmanManaging Director’s Review
Management Discussion and AnalysisStewardship
Financial ReportsAnnexes
331
In the Consolidated Statement of Comprehensive Income of the Reporting period, and of the comparable period of the previous year, income and expenses from discontinued operations are reported separately from income and expenses from continuing operations, down to the level of profit after taxes, even when the Bank retains a non-controlling interest in the subsidiary after the sale. The resulting profit or loss (after taxes) is reported separately in the Statement of Comprehensive Income.
3.5 Leasing
The determination of whether an arrangement is a lease, or it contains a lease, is based on the substance of the arrangement and requires an assessment of whether the fulfilment of the arrangement is dependent on the use of a specific asset or assets and the arrangement conveys a right to use the asset.
3.5.1 Operating Leases - Bank as a Lessee
Leases that do not transfer to the Bank substantially all the risks and benefits incidental to ownership of the leased items are operating leases. Operating lease payments are recognised as an expense in the Statement of Comprehensive Income on a straight line basis over the lease term. Contingent rental payable is recognised as an expense in the period in which they are incurred.
Details of Operating Leases - Bank as a lessee are given in Note 32 on page 389.
3.5.2 Operating Leases - Bank as a Lessor
Leases where the Bank does not transfer substantially all of the risk and benefits of ownership of the asset are classified as operating leases. Initial direct costs incurred in negotiating operating leases are added to the carrying amount of the leased asset and recognised over the lease term on the same basis as rental income.
Contingent rents are recognised as revenue in the period in which they are earned.
3.6 Property, Plant & Equipment
The Group applies the requirements of the Sri Lanka Accounting Standard - LKAS 16 on ‘Property, Plant & Equipment’ in accounting for its owned assets (including buildings under operating leases where the Bank is the lessor) which are held for and use in the provision of services, for rental to others or for administrative purposes and are expected to be used for more than one year.
3.6.1 Basis of Recognition
Property, Plant & Equipment are recognised if it is probable that future economic benefits associated with the asset will flow to the Group and cost of the asset can be reliably measured.
3.6.2 Basis of Measurement
An item of Property, Plant & Equipment that qualifies for recognition as an asset is initially measured at its cost. Cost includes expenditure that is directly attributable to the acquisition of the asset and subsequent costs (excluding the costs of day-to-day servicing) as explained in Note 3.6.3 below. The cost of self-constructed assets includes the cost of materials and direct labour, any other costs directly attributable to bringing the asset to a working condition for its intended use and the costs of dismantling and removing the items and restoring the site on which they are located and capitalised borrowing costs. Purchased software which is integral to the functionality of the related equipment is capitalised as part of Computer Equipment.
When parts of an item of property or equipment have different useful lives, they are accounted for as separate items (major components) of property and equipment.
3.6.2.1 Cost Model
The Group applies the Cost Model to all Property, Plant & Equipment except freehold land and freehold and leasehold buildings and records at cost of purchase together with any incidental expenses thereon, less accumulated depreciation and any accumulated impairment losses.
3.6.2.2 Revaluation Model
The Group applies the Revaluation Model for the entire class of freehold land and freehold and leasehold buildings for measurement after initial recognition. Such properties are carried at revalued amounts, being their fair value at the date of revaluation, less any subsequent accumulated depreciation on buildings and any accumulated impairment losses charged subsequent to the date of valuation. Freehold land and building of the Group are revalued every five to seven years or more frequently if the fair values are substantially different from their carrying amounts to ensure that the carrying amounts do not differ from the fair values at the Reporting date.
On revaluation of an asset, any increase in the carrying amount is recognised in Other Comprehensive Income and presented in Revaluation Reserve in equity or used to reverse a previous loss on revaluation of the same asset, which was charged to the Statement of Comprehensive Income. In this circumstance, the increase is recognised as income only to the extent of the previous write down in value. Any decrease in the carrying amount is recognised as an expense in the Statement of Comprehensive Income or charged in Other Comprehensive Income and
Notes to the Financial Statements

Commercial Bank of Ceylon PLCCommercial Bank of Ceylon PLC
Annual Report 2012Annual Report 2012
This is Commercial BankOperating HighlightsFinancial Highlights
Letter from the ChairmanManaging Director’s ReviewManagement Discussion and AnalysisStewardshipFinancial ReportsAnnexes
332
Notes to the Financial Statements
presented in Revaluation Reserve in equity only to the extent of any credit balance existing in the Revaluation Reserve in respect of that asset. Any balance remaining in the Revaluation Reserve in respect of an asset, is transferred directly to Retained Earnings on retirement or disposal of the asset.
The Group last revalued all its freehold land & buildings as at December 31, 2011.
3.6.3 Subsequent Cost
These are costs that are recognised in the carrying amount of an item if it is probable that the future economic benefits embodied within that part of the cost will flow to the Group and it can be reliably measured. The costs of the day-to-day servicing of property and equipment are recognised in profit or loss as incurred.
3.6.4 Derecognition
An item of Property, Plant & Equipment is derecognised upon disposal or when no future economic benefits are expected from its use. Any gain or loss arising on derecognising of the asset (calculated as the difference between the net disposal proceeds and the carrying amount of the asset), is recognised in ‘Other Operating Income/Other Expenses’ in profit or loss in the year the asset is derecognised.
When replacement costs are recognised in the carrying amount of an item of Property, Plant & Equipment, the remaining carrying amount of the replaced part is derecogn ised as required by Sri Lanka Accounting Standard - LKAS 16 on ‘Property, Plant & Equipment’.
3.6.5 Capital Work-in-Progress
These are expenses of a capital nature directly incurred in the construction of buildings, major plant and machinery and system development, awaiting capitalisation. These are stated in the Statement of Financial Position at cost.
3.6.6 Depreciation
Depreciation is recognised in profit or loss on a straight-line basis over the estimated useful lives of each part of an item of property and equipment since this method most closely reflects the expected pattern of consumption of the future economic benefits embodied in the asset. Leased assets under finance leases are depreciated over the shorter of the lease term and their useful lives. Freehold land is not depreciated.
The estimated useful lives for the current and comparative years are as follows:
Class of Asset % Per Annum Period
Freehold and Leasehold Buildings 2.5 40 years
Motor Vehicles 20 5 years
Computer Equipment 20 5 years
Office Equipment 20 5 years
Furniture & Fittings 10 10 years
Office Interior Work 10 10 years
Machinery & Equipment 10 10 years
The above rates are compatible with the rates used by all Group entities.
The depreciation rates are determined separately for each significant part of an item of Property, Plant & Equipment and commence to depreciate when it is available for use, i.e., when it is in the location and condition necessary for it to be capable of operating in the manner intended by the management. Depreciation of an asset ceases at the earlier of the date that the asset is classified as held for sale or the date that the asset is derecognised.
Depreciation methods, useful lives and residual values are reassessed at each reporting date and adjusted if appropriate.
All classes of Property, Plant & Equipment together with the reconciliation of carrying amounts and accumulated depreciation at the beginning and at the end of the year are given in Note 30 on page 380.
3.7 Intangible Assets
The Bank’s intangible assets include the value of computer software and copy rights.
3.7.1 Basis of Recognition
An intangible asset is recognised if it is probable that future economic benefits that are attributable to the asset will flow to the entity and the cost of the asset can be measured reliably in accordance with the Sri Lanka Accounting Standard - LKAS 38 on ‘Intangible Assets’.
Intangible assets acquired separately are measured on initial recognition at cost. The cost of intangible assets acquired in a business combination is their fair value as at the date of acquisition. Following initial recognition, these assets are stated in the Statement of Financial Position at cost, less accumulated amortisation and accumulated impairment losses, if any.

Commercial Bank of Ceylon PLCCommercial Bank of Ceylon PLC
Annual Report 2012Annual Report 2012
This is Commercial BankOperating HighlightsFinancial Highlights
Letter from the ChairmanManaging Director’s Review
Management Discussion and AnalysisStewardship
Financial ReportsAnnexes
333
Notes to the Financial Statements
3.7.2 Subsequent Expenditure
Subsequent expenditure on intangible assets is capitalised only when it increases the future economic benefits embodied in the specific asset to which it relates. All other expenditure is expensed as incurred.
3.7.3 Useful Economic Lives, Amortisation and Impairment
The useful economic lives of intangible assets are assessed to be either finite or indefinite. The Group does not possess intangible assets with indefinite useful economic lives. Useful economic lives, amortisation and impairment of finite and indefinite intangible assets are described below:
3.7.3.1 Intangible Assets with Finite Lives and Amortisation
Intangible assets with finite lives are amortised over the useful economic lives. The amortisation period and the amortisation method for an intangible asset with a finite useful life are reviewed at least at each Reporting Date. Changes in the expected useful life or the expected pattern of consumption of future economic benefits embodied in the asset are accounted for by changing the amortisation period or method, as appropriate, and are treated as changes in accounting estimates. The amortisation expense on intangible assets with finite lives is expensed as incurred.
3.7.3.1.1 Computer Software
All computer software costs incurred, licensed for use by the Group, which are not integrally related to associated hardware, which can be clearly identified, reliably measured and it is probable that they will lead to future economic benefits, are included in the Statement of Financial Position under the category of intangible assets and carried at cost, less accumulated amortisation and accumulated impairment losses, if any.
3.7.3.1.2 Amortisation of Intangible Assets
Intangible assets are amortised using the straight line method to write down the cost over its estimated useful economic lives at the rates specified below:
Class of Asset % Per Annum Period
Computer Software 20 5 years
Above rate is in consistent with the rates used in the comparative years.
The unamortised balances of intangible assets with finite lives are reviewed for impairment whenever there is an indication for impairment and recognised in profit or loss to the extent that they are no longer probable of being recovered from the expected future benefits.
3.7.3.2 Intangible Assets with Indefinite Useful Lives
Intangible assets with indefinite useful lives are not amortised but are tested for impairment annually either individually or at the cash-generating unit level as appropriate, when circumstances indicate that the carrying value is impaired. The useful life of an intangible asset with an indefinite life is reviewed annually to determine whether indefinite life assessment continues to be supportable. If not, the change in the useful life assessment from indefinite to finite is made on a prospective basis.
3.7.4 Derecognition of Intangible Assets
Intangible assets are derecognised on disposal or when no future economic benefits are expected from its use. Gains or losses arising from derecognition of an intangible asset are measured as the difference between the net disposal proceeds and the carrying amount of the asset and are recognised in profit or loss.
The Group has only acquired intangible assets, a list of which with the reconciliation of carrying amounts, accumulated amortisation at the beginning and at the end of the periods is given in Note 31 on page 388.
Amortisation recognised during the year in respect of intangible assets is included under the item of ‘Amortisation and impairment of intangible assets’ in the Statement of Comprehensive Income.
3.8 Impairment of Non-Financial Assets
The carrying amounts of the Group’s non-financial assets, other than deferred tax assets are reviewed at each Reporting date whether there is an indication that an asset may be impaired. If any indication exists, or when annual impairment testing for an asset is required, the Group estimates the asset’s recoverable amount. An asset’s recoverable amount is the higher of an asset’s or Cash Generating Unit’s fair value less costs to sell and its value in use. Where the carrying amount of an asset or Cash Generating Unit exceeds its recoverable amount, the asset is considered impaired and is written down to its recoverable amount.
In assessing value in use, the estimated future cash flows are discounted to their present value using a pre-tax discount rate that reflects current market assessments of the time value of money and the risks specific to the asset. In determining fair value less costs to sell, an appropriate valuation model is used. These calculations are corroborated by valuation multiples, quoted share prices for publicly traded subsidiaries or other available fair value indicators.
Impairment losses of continuing operations are recognised in profit or loss under those expense categories consistent with the function of the impaired asset, except for property previously revalued where the gain or loss on revaluation was taken to Equity. In this case, the impairment is also recognised in Equity up to the extent of any previously recognised revaluation gains.

Commercial Bank of Ceylon PLCCommercial Bank of Ceylon PLC
Annual Report 2012Annual Report 2012
This is Commercial BankOperating HighlightsFinancial Highlights
Letter from the ChairmanManaging Director’s ReviewManagement Discussion and AnalysisStewardshipFinancial ReportsAnnexes
334
For assets excluding goodwill, an assessment is made at each Reporting date as to whether there is any indication that previously recognised impairment losses may no longer exist or may have decreased. If such indication exists, the Group estimates the asset’s or Cash-Generating Unit’s recoverable amount. A previously recognised impairment loss is reversed only if there has been a change in the assumptions used to determine the asset’s recoverable amount since the last impairment loss was recognised. The reversal is limited so that the carrying amount of the asset does not exceed its recoverable amount, nor exceeds the carrying amount that would have been determined, net of depreciation/amortisation, had no impairment loss been recognised for the asset in prior years. Such reversal is recognised in profit or loss.
3.9 Deposits, Borrowings, Debt Securities Issued and Subordinated Liabilities
Deposits, debt securities issued and subordinated liabilities are the Group’s sources of debt funding.
3.9.1 Due to Banks and Other Financial Institutions
These represents refinance borrowings, call money borrowings, credit balances in Nostro Accounts and borrowings from financial institutions. Subsequent to initial recognition deposits are measured at their amortised cost using the effective interest method. Interest paid/payable on these borrowings is recognized in profit or loss.
Details of the ‘Due to banks and other financial institutions’ are given in Notes 35 and 37 on pages 390 and 391, respectively.
3.9.2 Due to Customers
These include non-interest-bearing deposits, savings deposits, term deposits, deposits payable at call and certificates of deposit. Subsequent to initial recognition deposits are measured at their amortised cost using the effective interest method, except where the Group designates liabilities at fair value through profit or loss. Interest paid/payable on these deposits is recognised in profit or loss.
Details of ‘Deposits from customers’ are given in Note 37 on page 391.
3.9.3 Debt Securities Issued
These represent the funds borrowed by the Bank for long-term funding requirements. Subsequent to initial recognition debt securities issued are measured at their amortised cost using the effective interest method, except where the Group designates debt securities issued at fair value through profit or loss. Interest paid/payable is recognized in profit or loss.
3.9.4 Securities Purchased Under Resale Agreements (Repos)
When the Group sells a financial asset and simultaneously enters into an agreement to repurchase the asset (or a similar asset) at a fixed price on a future date (Repo), the arrangement is accounted for as a financial liability, and the underlying asset continues to be recognised in the Group’s Financial Statements.
Securities purchased under agreements to resell at a specified future date are initially recognised in the Statement of Financial Position at the consideration paid, including accrued interest thereon. Subsequent to initial recognition debt securities issued are measured at their amortised cost using the effective interest method, except where the Group designates debt securities issued at fair value through profit or loss. Interest paid/payable is recognised in profit or loss.
Details of ‘Securities purchased under resale agreements’ are given in Note 38 on page 392.
3.10 Dividends Payable
Dividends on ordinary shares are recognised as a liability and deducted from equity when they are recommended and declared by the Board of Directors and approved by the shareholders. Interim dividends are deducted from equity when they are declared and no longer at the discretion of the Bank.
Dividends for the year that are approved after the Reporting date are disclosed as an event after the Reporting Period in accordance with the Sri Lanka Accounting Standard - LKAS 10 on ‘Events after the Reporting Period’.
3.11 Other Liabilities
Other Liabilities include interest, fees and expenses and amounts payable for gratuity/pensions and other provisions. These liabilities are recorded at amounts expected to be payable at the Reporting date.
Details of ‘Other Liabilities’ are given in Note 40 on page 392.
3.12 Provisions
A provision is recognised in the Statement of Financial Position when the Group has a legal or constructive obligation as a result of a past event and it is probable that an outflow of economic benefits will be required to settle the obligation and the amount of the provision can be measured reliably in accordance with the Sri Lanka Accounting Standard - LKAS 37 on ‘Provisions, Contingent Liabilities and Contingent Assets’. The amount recognised is the best estimate of the consideration required to settle the
Notes to the Financial Statements

Commercial Bank of Ceylon PLCCommercial Bank of Ceylon PLC
Annual Report 2012Annual Report 2012
This is Commercial BankOperating HighlightsFinancial Highlights
Letter from the ChairmanManaging Director’s Review
Management Discussion and AnalysisStewardship
Financial ReportsAnnexes
335
present obligation at the Reporting date, taking into account the risks and uncertainties surrounding the obligation at that date. Where a provision is measured using the cash flows estimated to settle the present obligation, its carrying amount is determined based on the present value of those cash flows.
3.13 Employee Benefits
3.13.1 Defined Benefit Plans (DBPs)
A Defined Benefit Plan is a post-employment benefit plan other than a Defined Contribution Plan as defined in the Sri Lanka Accounting Standard - LKAS 16 on ‘Employee Benefits’.
3.13.1.1 Defined Benefit Pension Plans
3.13.1.1.1 Description of the Plans and Employee Groups Covered
The Bank operates three types of Defined Benefit Pension Plans for its employees as described below:
(a) The Bank has an approved Pension Fund, which was established in 1992. As per the Deed of Trust, only those employees who were less than 45 years of age as at January 01, 1992 were covered by the Pension Fund in order to leave a minimum contribution for a period of 10 years before they are eligible to draw pension from the Pension Fund. Further, only the employees who joined the Bank on or before December 31, 2001, were in pensionable service of the Bank.
During 2006 the Bank offered a restructured pension scheme to convert the Defined Benefit Plan (DBP) to a Defined Contribution Plan (DCP) for the pensionable employees of the Bank and over 99% of them accepted it. As a result, the above Pension Fund now covers only those employees who did not opt for the restructured pension scheme and those employees who were covered by the Pension Fund previously but retired before the restructured pension scheme came into effect.
(b) Provision for pensions has been made for those employees who retired on or before December 31, 2001, and on whose behalf the Bank could not make contributions to the Retirement Pension Fund for more than 10 years. This liability although not funded has been provided for in full in the Financial Statements.
(c) Provision has been made in the Financial Statements for Retirement Gratuity from the first year of service for all employees who joined the Bank on or after January 01, 2002, as they are not in pensionable service of the Bank under either the DBP or DCP. However, if any of these employees resigns before retirement, the Bank is liable to pay gratuity to such employees. This liability although not funded has been provided for in full in the Financial Statements.
The Subsidiaries of the Bank do not operate Pension Funds.
The Bank’s net obligation in respect of Defined Benefit Pension Plans is calculated separately for each plan by using the Projected Unit Credit Actuarial Valuation Method, as per the Sri Lanka Accounting Standard - LKAS 16 on ‘Employee Benefits’. This method involves estimating the amount of future benefit that employees have earned in return for their service in the current and prior periods that benefit is discounted to determine its present value as detailed in Note 51 on page 407.
3.13.1.1.4 Recognition of Actuarial Gains or Losses
Actuarial gains or losses are recognised in the profit or loss in the period in which they arise. The past service cost is recognised as an expense on a straight-line basis over the period until the benefits become vested. If the benefits are already vested following the introduction of, or changes to, a pension plan, past service cost is recognised immediately.
3.13.1.1.5 Recognition of Retirement Benefit Obligation
The defined benefit asset or liability comprises the present value of the defined benefit obligation, less past service cost not yet recognised and less the fair value of plan assets out of which the obligations are to be settled directly. The value of any asset is restricted to the sum of any past service cost not yet recognised and the present value of any economic benefits available in the form of refunds from the plan or reductions in the future contributions to the plan.
3.13.2 Defined Contribution Plans (DCPs)
A Defined Contribution Plan is a post-employment plan under which an entity pays fixed contributions into a separate entity and will have no legal or constructive obligations to pay a further amount. Obligations to DCPs are recognised in the profit or loss as incurred. The Group has three such plans as explained in Notes 3.13.2.1, 3.13.2.2 and 3.13.2.3 below.
Amounts recognised in profit or loss as expenses on DCPs are given in Note 13 on page 343.
3.13.2.1 Defined Contribution Pension Plans
As explained in Note 3.13.1.1.1, during 2006, the Bank restructured its pension scheme which was a DBP to a DCP. This restructured plan was offered on a voluntary basis to the eligible employees of the Bank. The scheme provides for lump sum payments instead of commuted/monthly pensions to the eligible employees at the point of their separation, in return for surrendering their pension rights. The lump sum offered consisted of a past service package and a future service package. The shortfall on account of the past service package in excess of the funds available in the Pension Fund was borne by the Bank in 2006.
Notes to the Financial Statements

Commercial Bank of Ceylon PLCCommercial Bank of Ceylon PLC
Annual Report 2012Annual Report 2012
This is Commercial BankOperating HighlightsFinancial Highlights
Letter from the ChairmanManaging Director’s ReviewManagement Discussion and AnalysisStewardshipFinancial ReportsAnnexes
336
The future service package includes monthly contributions to be made by the Bank for the employees who accepted the offer, to be made during their remaining period of service, at pre determined contribution rates to be applied for on their salaries, which are estimated to increase for this purpose at 10% p.a. based on the salary levels that prevailed as at the date of implementation of this scheme. In addition, interest to be earned on the assets of the DCP is also allocated to the employees who opted for the restructured scheme.
The assets of this Fund are held separately from those of the Bank and are independently administered by the Trustees as per the provisions of the Trust Deed.
3.13.2.2 Employees’ Provident Fund
The Bank and employees contribute to the approved Private Provident Fund at 12% and 8% respectively, on the salaries of each employee. Other entities of the Group and their employees contribute at the same percentages as above to the Employees’ Provident Fund managed by the Central Bank of Sri Lanka.
3.13.2.3 Employees’ Trust Fund
The Bank and other entities of the Group contribute at the rate of 3% of the salaries of each employee to the Employees’ Trust Fund managed by the Central Bank of Sri Lanka.
3.13.3 Other Long-Term Employee Benefits
The Group’s net obligation in respect of long-term employee benefits other than pension plans is the amount of future benefits that employees have earned in return for their service in the current and prior periods; that benefit is discounted to determine its present value, and the fair value of any related assets is deducted. The discount rate used as the yield at the Reporting date was the current market rate that has been extrapolated to reflect long-term rate of discount based on market rates of interest on short-term corporate/government bonds and anticipated long-term rate of inflation. The calculation is performed using the Projected Unit Credit Method. Any actuarial gains and losses are recognised in profit or loss in the period in which they arise.
3.13.4 Terminal Benefits
Termination benefits are recognised as an expense when the Group is committed demonstrably, without realistic possibility of withdrawal, to a formal detailed plan to either terminate employment before the normal retirement date, or to provide termination benefits as a result of an offer made to encourage voluntary redundancy. Termination benefits for voluntary redundancies are recognised as an expense if the Group has made an offer of voluntary redundancy, it is probable that the offer will be accepted, and the number of acceptances can be estimated reliably. If benefits are payable more than 12 months after the Reporting Period, then they are discounted to their present value.
3.13.5 Other Long-Term Employee Benefits
Short-term employee benefit obligations are measured on an undiscounted basis and are expensed as the related service is provided. A liability is recognised for the amount expected to be paid under short term cash bonus or profit-sharing plans if the Group has a present legal or constructive obligation to pay this amount as a result of past service provided by the employee and the obligation can be estimated reliably.
3.13.6 Equity Compensation Benefits
Share-based payment arrangements in which the Group receives goods or services as consideration for its own equity instruments are accounted for as equity-settled share-based payment transactions, regardless of how the equity instruments are obtained by the Group. Employees (including senior executives) of the Group receive remuneration in the form of share-based payment transactions, whereby employees render services as consideration for equity instruments (equity-settled transactions). The Group does not operate any cash-settled share based payment transactions.
The Group applies the requirements of the Sri Lanka Accounting Standard - SLFRS 2 on ‘Share-based Payment’ in accounting for equity settled share-based payment transaction, if any, that were granted after January 01, 2012 and had not vested at the same date. As per the Sri Lanka Accounting Standard - SLFRS 2 on ‘Share-based Payment’, on the grant date fair value of equity-settled share-based payment awards (i.e. share options) granted to employees is recognised as an employee expense, with a corresponding increase in equity, over the period in which the employees unconditionally become entitled to the awards. The amount recognised as an expense is adjusted to reflect the number of share awards for which the related service and non-market performance vesting conditions are expected to be met such that the amount ultimately recognised as an expense is based on the number of share awards that do meet the related service and non-market performance conditions at the vesting date. For share-based payment awards with non-vesting conditions, the grant-date fair value of the share-based payment is measured to reflect such conditions and there is no true-up for differences between expected and actual outcomes.
As the Group does not grant any share-based payment transaction after January 01, 2012, it did not apply the above accounting treatment during the year and the proceeds received by the Bank in consideration for the shares issued were accounted for as Stated Capital within equity.
The details of Employee Share Option Plans are given in Notes 43 on page 395.
The dilutive effect of outstanding options is reflected as additional share dilution in the computation of diluted earnings per share (see Note 16 on page 346).
Notes to the Financial Statements

Commercial Bank of Ceylon PLCCommercial Bank of Ceylon PLC
Annual Report 2012Annual Report 2012
This is Commercial BankOperating HighlightsFinancial Highlights
Letter from the ChairmanManaging Director’s Review
Management Discussion and AnalysisStewardship
Financial ReportsAnnexes
337
3.14 Commitments and Contingencies
All discernible risks are accounted for in determining the amount of other liabilities as explained in Note 3.15 below. The Bank’s share of any Contingencies and capital commitments of a Subsidiary or an Associate for which the Bank is also liable severally or otherwise is included with appropriate disclosures.
Contingent Liabilities are possible obligations whose existence will be confirmed only by uncertain future events or present obligations where the transfer of economic benefit is not probable or cannot be readily measured as defined in the Sri Lanka Accounting Standard - 36 on ‘Provisions, Contingent Liabilities and Contingent Assets’. Contingent liabilities are not recognised in the Statement of Financial Position but are disclosed unless its occurrence is remote.
Details of the commitments and contingencies are given in Note 48 to the Financial Statements on page 400.
3.15 Contingent Liabilities, Commitments and Leasing Arrangements
Contingent liabilities are possible obligations whose existence will be confirmed only by uncertain future events or present obligations where the transfer of economic benefit is not probable or cannot be readily measured as defined in the Sri Lanka Accounting Standard - LKAS 37 on ‘Provisions, Contingent Liabilities and Contingent Assets’.
To meet the financial needs of customers, the Bank enters into various irrevocable commitments and contingent liabilities. These consist of financial guarantees, letters of credit and other undrawn commitments to lend. Letters of credit and guarantees commit the Bank to make payments on behalf of customers in the event of a specific act, generally related to the import or export of goods. Guarantees and standby letters of credit carry a similar credit risk to loans.
Operating lease commitments of the Bank (as a lessor and as a lessee) and pending legal claims against the Bank too form part of commitments of the Bank.
Even though these obligations may not be recognised on the Statement of Financial Position, they do contain credit risk and are therefore part of the overall risk of the Bank (See Note 60 on page 432).
All discernible risks are accounted for in determining the amount of other liabilities as explained in Note 39 on page 392.
3.15.1 Legal Claims
Litigation is a common occurrence in the banking industry due to the nature of the business undertaken. The Bank has formal controls and policies for managing legal claims. Once professional advice has been obtained and the amount of loss reasonably estimated, the Bank makes adjustments to account for any adverse effects which the claims may have on its financial standing. At the Reporting Date the Bank had several unresolved legal claims. The significant unresolved legal claims against the Bank for which legal advisor of the Bank advised as the loss is possible, but not probable, that the action will succeed. Accordingly, no provision for any claims has been made in these Financial Statements.
A detailed list of significant pending litigations against the Bank is given in Note 49 on page 402.
3.15.2 Contingent Liabilities, Commitments of Other Group Entities
The Bank’s share of any contingencies and capital commitments of a Subsidiary or an Associate for which the Bank is also liable severally or otherwise is included with appropriate disclosures.
Details of the Commitments and Contingencies are given in Note 48 on page 400.
3.16 Earnings Per Share (EPS)
Basic EPS is calculated by dividing the profit or loss attributable to ordinary shareholders of the Bank by the weighted average number of ordinary shares outstanding during the period. Diluted EPS is determined by adjusting the profit or loss attributable to ordinary shareholders and the weighted average number of ordinary shares outstanding for the effects of all dilutive potential ordinary shares, which comprise share options granted to employees.
Details of earnings per share are given in Note 16 on page 346.
3.17 Segment Reporting
An operating segment is a component of the Group that engages in business activities from which it may earn revenues and incur expenses, including revenues and expenses that relate to transactions with any of the Group’s other components, whose operating results are reviewed regularly by the Group Management Committee (being the chief operating decision-maker) to make decisions about resources allocated to each segment and assess its performance, and for which discrete financial information is available.
Notes to the Financial Statements

Commercial Bank of Ceylon PLCCommercial Bank of Ceylon PLC
Annual Report 2012Annual Report 2012
This is Commercial BankOperating HighlightsFinancial Highlights
Letter from the ChairmanManaging Director’s ReviewManagement Discussion and AnalysisStewardshipFinancial ReportsAnnexes
338
For each of the strategic divisions, the Group’s management monitors the operating results separately for the purpose of making decisions about resource allocation and performance assessment. Segment performance is evaluated based on operating profits or losses which, in certain respects, are measured differently from operating profits or losses in the Consolidated Financial Statements. Income taxes are managed on a group basis and are not allocated to operating segments.
Interest income is reported net as management primarily relies on net interest revenue as a performance measure, not the gross income and expense.
Inter-segment transactions are accounted for at fair market prices charged to inter-bank counterparts for similar services on an arm’s length basis. Such transfers are eliminated on consolidation.
No revenue from transactions with a single external customer or counterparty amounted to 10% or more of the Bank’s total revenue in 2012 or 2011.
Detailed information on the results of each reportable segment as required by the Sri Lanka Accounting Standard - SLFRS 8 on ‘Operating Segments’ is provided in Note 52 on page 409.
3.18 Fiduciary Assets
The Bank provides trust and other fiduciary services that result in the holding or investing of assets on behalf of its clients. Assets held in a fiduciary capacity are not reported in these Financial Statements as they do not belong to the Bank.
3.19 New Standards and Interpretations not yet Adopted
A number of new standards, amendments to standards and interpretations which have been issued but not yet effective as at the reporting date have not been applied in preparing these Consolidated Financial Statements. None of these is expected to have a significant effect on the Consolidated Financial Statements of the Group. The extent of the impact has not been determined.
4. Significant Accounting Policies - Recognition of Income and Expenses
Revenue is recognised to the extent that it is probable that the economic benefits will flow to the Bank and the revenue can be reliably measured. The following specific recognition criteria must also be met before revenue is recognised.
4.1 Interest Income and Expense
For all financial instruments measured at amortised cost, interest bearing financial assets classified as available-for-sale and financial instruments designated at fair value through profit or loss, interest income and expense are recognised in profit or loss using the Effective Interest Rate (EIR) method. The EIR is the rate that exactly discounts the estimated future cash payments and receipts through the expected life of the financial asset or liability (or, where appropriate, a shorter period) to the carrying amount of the financial asset or liability. When calculating the EIR, the Group estimates future cash flows considering all contractual terms of the financial instrument, but not future credit losses.
The calculation of the EIR takes into account all contractual terms of the financial instrument (for example, prepayment options) and includes all material transaction costs and fees and points paid or received that are an integral part of the EIR. Transaction costs include incremental costs that are directly attributable to the acquisition or issue of a financial asset or liability.
The carrying amount of the financial asset or financial liability is adjusted if the Group revises its estimates of payments or receipts. The adjusted carrying amount is calculated based on the original EIR and the change in carrying amount is recorded in ‘Interest Income’ for financial assets and in ’Interest and similar expense’ for financial liabilities. However, for a reclassified financial asset for which the Bank subsequently increases its estimates of future cash receipts as a result of increased recoverability of those cash receipts, the effect of that increase is recognised as an adjustment to the EIR from the date of the change in estimate.
Once the recorded value of a financial asset or a group of similar financial assets has been reduced due to an impairment loss, interest income continues to be recognised using the rate of interest used to discount the future cash flows for the purpose of measuring the impairment loss.
4.2 Fees and Commission Income and Expense
Fees and commission income and expense that are integral to the EIR on a financial asset or liability are included in the measurement of the EIR.
Other fees and commission income, including account servicing fees, investment management fees, sales commission, placement fees and syndication fees, are recognised as the related services are performed. Fees earned for the provision of services over a period of time are accrued over that period. Loan commitment fees for loans that are likely to be drawn down and other credit related fees are deferred (together with any incremental costs) and recognised as an adjustment to the EIR on the loan. When it is unlikely that a loan will be drawn down, the loan commitment fees are recognised over the commitment period on a straight-line basis.
Notes to the Financial Statements
Commercial Bank of Ceylon PLCCommercial Bank of Ceylon PLC
Annual Report 2012Annual Report 2012
This is Commercial BankOperating HighlightsFinancial Highlights
Letter from the ChairmanManaging Director’s Review
Management Discussion and AnalysisStewardship
Financial ReportsAnnexes
339
Other fees and commission expense relate mainly to transaction and service fees, which are expensed as the services are received.
4.3 Net Trading Income
Results arising from trading activities include all realised and unrealised gains and losses from changes in fair value and related interest income or expense, dividends and foreign exchange differences for financial assets and financial liabilities ‘held for trading’.
4.4 Dividend Income
Dividend income is recognised when the Group’s right to receive the payment is established. Usually this is the ex-dividend date for equity securities.
Dividends are presented in ‘net trading income’ for financial instruments at fair value through profit or loss held for trading. Dividends on available-for-sale equity securities are presented in ‘other operating income’ in profit or loss unless the dividend clearly represents a recovery of part of the cost of the investment, in which case it is presented in Other Comprehensive Income.
4.5 Lease Income
In terms of the provisions of the Sri Lanka Accounting Standard - LKAS 17 on ‘Leases’, the recognition of finance income on leasing is accounted, based on a pattern reflecting a constant periodic rate of return on capital outstanding.
The excess of aggregate lease rentals receivable over the cost of the leased assets constitutes the total unearned finance income at the commencement of a lease. The unearned finance income included in the lease rentals receivable is recognised in profit or loss over the term of the lease commencing from the month in which the lease is executed using Effective Interest Rate.
4.6 Lease Payments
Payments made under operating leases are recognised in profit or loss on a straight-line basis over the term of the lease. Lease incentives received are recognised as an integral part of the total lease expense, over the term of the lease.
Minimum lease payments made under finance leases are apportioned between the finance expense and the reduction of the outstanding liability. The finance expense is allocated to each period during the lease term so as to produce a constant periodic rate of interest on the remaining balance of the liability.
Contingent lease payments are accounted for by revising the minimum lease payments over the remaining term of the lease when the lease adjustment is confirmed.
4.7 Rental Income and Expense
Rental income and expense are recognised in the profit or loss on an accrual basis.
4.8 Borrowing Costs
As per the Sri Lanka Accounting Standard - LKAS 23 on ‘Borrowing costs’, the Group capitalises borrowing costs that are directly attributable to the acquisition, construction or production of a qualifying asset as part of the cost of the asset. A qualifying asset is an asset which takes a substantial period of time to get ready for its intended use or sale. Other borrowing costs are recognized in the profit or loss in the period in which they occur.
5. Significant Accounting Policies - Tax Expense
As per the Sri Lanka Accounting Standards - LKAS 12 on ‘Income taxes’, tax expense (tax income) is the aggregate amount included in determination of profit or loss for the period in respect of current and deferred taxes. Income tax expense is recognised in the Statement of Comprehensive Income except to the extent it relates to items recognised directly in Equity or in Other Comprehensive Income (OCI), in which case it is recognised in Equity or in OCI.
5.1 Current Taxation
Current tax assets and liabilities consist of amounts expected to be recovered from or paid to the taxation authorities in respect of the current as well as prior years. The tax rates and tax laws used to compute the amounts are those that are enacted or substantially enacted by the Reporting date. Accordingly, provision for taxation is made on the basis of the accounting profit for the year as adjusted for taxation purposes in accordance with the provisions of the Inland Revenue Act No. 10 of 2006 and the amendments thereto, at the rates specified in Note 15 on page 344. This Note also includes the major components of tax expense, the effective tax rates and a reconciliation between the profit before tax and tax expense as required by the Sri Lanka Accounting Standard - LKAS 12 on ‘Income Taxes’.
Provision for taxation on the overseas branch operations is made on the basis of the accounting profit for the year as adjusted for taxation purposes in accordance with the provisions of the relevant statutes in those countries.
Notes to the Financial Statements

Commercial Bank of Ceylon PLCCommercial Bank of Ceylon PLC
Annual Report 2012Annual Report 2012
This is Commercial BankOperating HighlightsFinancial Highlights
Letter from the ChairmanManaging Director’s ReviewManagement Discussion and AnalysisStewardshipFinancial ReportsAnnexes
340
5.2 Deferred Taxation
Deferred tax is provided on temporary differences at the Reporting date between the tax bases of assets and liabilities and their carrying amounts for financial reporting purposes for all Group Entities. Deferred tax liabilities are recognised for all temporary differences, except:
Where the deferred tax liability arises from the initial recognition of goodwill or of an asset or liability in a transaction that is not a business combination and at the time of the transaction, affects neither the accounting profit or loss nor taxable profit or loss; and
In respect of taxable temporary differences associated with investments in Subsidiaries and Associates, where the timing of the reversal of the temporary differences can be controlled and it is probable that the temporary differences will not reverse in the foreseeable future.
Deferred tax assets are recognised for all deductible differences, unused tax credits and unused tax losses carried forward, if any, to the extent that it is probable that taxable profits will be available against which the deductible temporary differences and the unused tax credits and unused tax losses carried forward can be utilised, except:
Where the deferred tax assets relating to the deductible temporary difference arise from the initial recognition of an asset or liability in a transaction that is not a business combination and at the time of the transaction, affects neither the accounting profit nor the taxable profit or loss; and
In respect of deductible temporary differences associated with investments in Subsidiaries and Associates, deferred tax assets are recognised only to the extent that it is probable that the temporary differences will reverse in the foreseeable future and taxable profits will be available against which the temporary differences can be utilised.
The carrying amount of deferred tax assets is reviewed at each Reporting date and reduced to the extent that it is no longer probable that sufficient taxable profits will be available to allow all or part of the deferred tax assets to be utilised. Unrecognised deferred tax assets are reassessed at each Reporting date and are recognised to the extent that it is probable that future taxable profits will allow the deferred tax assets to be recovered.
Deferred tax assets and liabilities are measured at the tax rates that are expected to apply in the year when the assets are realised or the liabilities are settled, based on tax rates and tax laws that have been enacted or substantially enacted at the Reporting date.
Current tax and deferred tax relating to items recognised directly in Equity are also recognised in Equity and not in the Statement of Comprehensive Income.
Deferred tax assets and Deferred tax liabilities are set-off, if a legally enforceable right exists to set-off current tax assets against current tax liabilities and they relate to taxes levied by the same tax authority on the same taxable entity, or on different tax entities, but they intend to settle current tax liabilities and assets on a net basis or their tax assets and liabilities will be realised simultaneously.
Details of Deferred Tax Assets and Liabilities as at the Reporting date are given in Note 33 on page 389.
5.3 Withholding Tax on Dividends, Distributed by the Bank, Subsidiaries and Associates
Withholding tax on dividends distributed by the Bank Withholding tax that arises from the distribution of dividends by the
Bank is recognised at the time the liability to pay the related dividend is recognised.
Withholding tax on dividends distributed by the Subsidiaries and Associates
Dividends received by the Bank from its Subsidiaries and Associates, have attracted a 10% deduction at source.
5.4 Economic Service Charge (ESC)
As per the provisions of the Finance Act No. 11 of 2004, and amendments thereto, the ESC was introduced with effect from April 01, 2004. Currently, the ESC is payable at 0.25% on ‘Exempt Turnover’ and is deductible from the income tax payments. Unclaimed ESC, if any, can be carried forward and set-off against the income tax payable in the five subsequent years.
5.5 Value Added Tax on Financial Services
The base for the computation of Value Added Tax on Financial Services is the accounting profit before emoluments paid to employees and income tax, which is adjusted for the depreciation computed on prescribed rates. The amount of Value Added Tax charged in determining the profit or loss for the period is given in the Income Statement on page 306.
6. Statement of Cash Flows
The Statement of Cash Flows has been prepared by using the ‘Indirect Method’ of preparing cash flows in accordance with the Sri Lanka Accounting Standard - LKAS 7 on ‘Statement of Cash Flows’, whereby gross cash receipts and gross cash payments on operating activities, investing activities and financing activities are separately recognised. Cash and Cash Equivalents comprise of short-term, highly liquid investments that are readily convertible to known amounts of cash and are subject to an insignificant risk of changes in value. Cash and Cash Equivalents as referred to in the Statement of Cash Flows are comprised of those items as explained in Note 20 on page 351.
The Statement of Cash Flows is given on pages 314 and 315.
Notes to the Financial Statements

Commercial Bank of Ceylon PLCCommercial Bank of Ceylon PLC
Annual Report 2012Annual Report 2012
This is Commercial BankOperating HighlightsFinancial Highlights
Letter from the ChairmanManaging Director’s Review
Management Discussion and AnalysisStewardship
Financial ReportsAnnexes
341
GROUP BANK
2012 2011 2012 2011Rs. ’000 Rs. ’000 Rs. ’000 Rs. ’000
7. Net Interest Income
Interest IncomeCash and cash equivalents 470,764 176,192 470,764 176,192
Placements with banks 339,115 88,254 339,115 88,254
Derivative financial instruments 314 4,320 314 4,320
Financial assets held-for-trading 421,315 280,459 421,315 280,459
Loans and receivables to banks 19,557 20,134 19,557 20,134
Loans and receivables to other customers 45,037,407 31,174,117 45,057,595 31,216,003
Financial investments - Available-for-sale 6,374,471 6,570,181 6,374,471 6,570,181
Financial investments - Held-to-maturity – – – –
Other interest income - Subsidiaries 21 91 2,296 –
Total interest income 52,662,964 38,313,748 52,685,427 38,355,543
Interest ExpensesDue to banks 3,877,367 3,516,102 3,877,367 3,516,102
Derivative financial instruments 314 4,340 314 4,340
Financial liabilities at fair value through profit or loss – – – –
Due to other customers 25,284,506 15,419,270 25,289,941 15,423,509
Other borrowings 516,312 467,089 529,969 477,831
Debt securities issued – – – –
Subordinated term debts 132,806 228,547 132,806 228,547
Total Interest expenses 29,811,305 19,635,348 29,830,397 19,650,329
Net interest income 22,851,659 18,678,400 22,855,030 18,705,214
7.1 Net Interest Income from Sri Lanka Government SecuritiesInterest income 9,277,397 8,673,110 9,277,397 8,673,110
Less: Interest expenses 3,441,531 3,305,293 3,441,531 3,305,293
Sub total 5,835,866 5,367,817 5,835,866 5,367,817
7.2 Interest Income from Financial Assets Fair Value through Profit and LossDerivative financial instruments 314 4,320 314 4,320
Financial assets held-for-trading 421,315 280,459 421,315 280,459
Sub total 421,629 284,779 421,629 284,779
7.3 Interest Income on impaired financial assetsInterest income from impaired loans and receivables to other customers 359,350 196,243 359,350 196,243
Add: Unwinding interest 249,760 285,139 249,760 285,139
Sub total 609,110 481,382 609,110 481,382
Notes to the Financial Statements
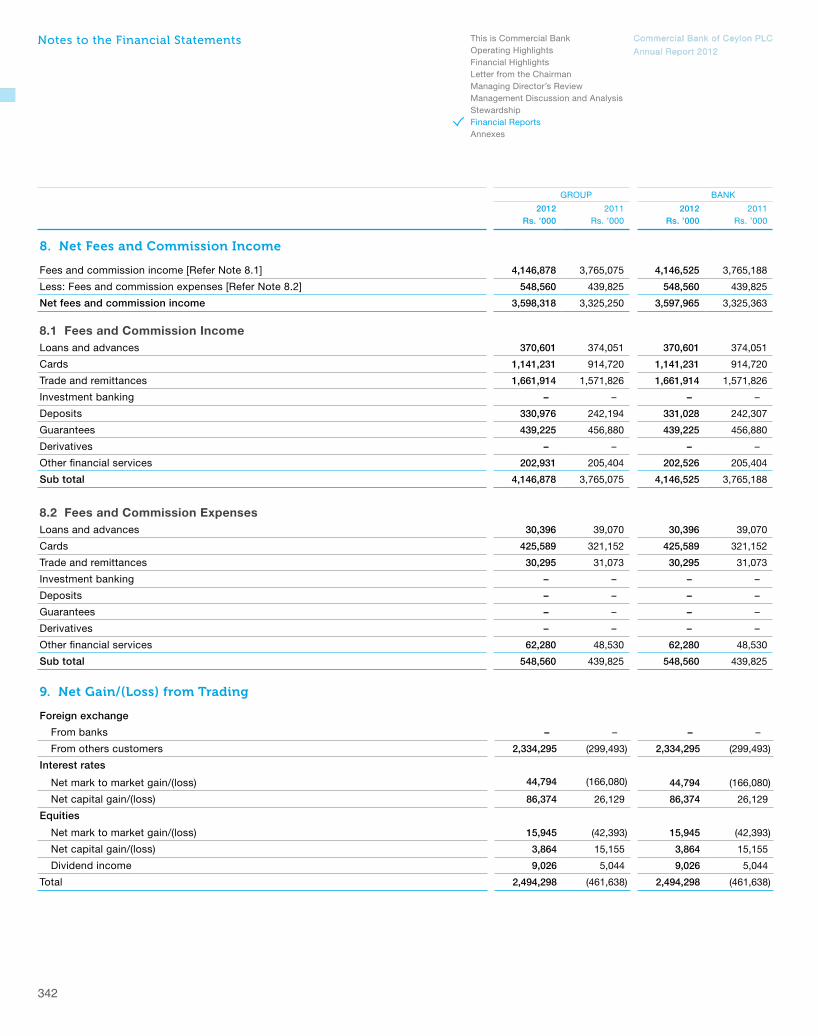
Commercial Bank of Ceylon PLCCommercial Bank of Ceylon PLC
Annual Report 2012Annual Report 2012
This is Commercial BankOperating HighlightsFinancial Highlights
Letter from the ChairmanManaging Director’s ReviewManagement Discussion and AnalysisStewardshipFinancial ReportsAnnexes
342
GROUP BANK
2012 2011 2012 2011Rs. ’000 Rs. ’000 Rs. ’000 Rs. ’000
8. Net Fees and Commission Income
Fees and commission income [Refer Note 8.1] 4,146,878 3,765,075 4,146,525 3,765,188
Less: Fees and commission expenses [Refer Note 8.2] 548,560 439,825 548,560 439,825
Net fees and commission income 3,598,318 3,325,250 3,597,965 3,325,363
8.1 Fees and Commission IncomeLoans and advances 370,601 374,051 370,601 374,051
Cards 1,141,231 914,720 1,141,231 914,720
Trade and remittances 1,661,914 1,571,826 1,661,914 1,571,826
Investment banking – – – –
Deposits 330,976 242,194 331,028 242,307
Guarantees 439,225 456,880 439,225 456,880
Derivatives – – – –
Other financial services 202,931 205,404 202,526 205,404
Sub total 4,146,878 3,765,075 4,146,525 3,765,188
8.2 Fees and Commission ExpensesLoans and advances 30,396 39,070 30,396 39,070
Cards 425,589 321,152 425,589 321,152
Trade and remittances 30,295 31,073 30,295 31,073
Investment banking – – – –
Deposits – – – –
Guarantees – – – –
Derivatives – – – –
Other financial services 62,280 48,530 62,280 48,530
Sub total 548,560 439,825 548,560 439,825
9. Net Gain/(Loss) from Trading
Foreign exchange
From banks – – – –
From others customers 2,334,295 (299,493) 2,334,295 (299,493)
Interest rates
Net mark to market gain/(loss) 44,794 (166,080) 44,794 (166,080)
Net capital gain/(loss) 86,374 26,129 86,374 26,129
Equities
Net mark to market gain/(loss) 15,945 (42,393) 15,945 (42,393)
Net capital gain/(loss) 3,864 15,155 3,864 15,155
Dividend income 9,026 5,044 9,026 5,044
Total 2,494,298 (461,638) 2,494,298 (461,638)
Notes to the Financial Statements
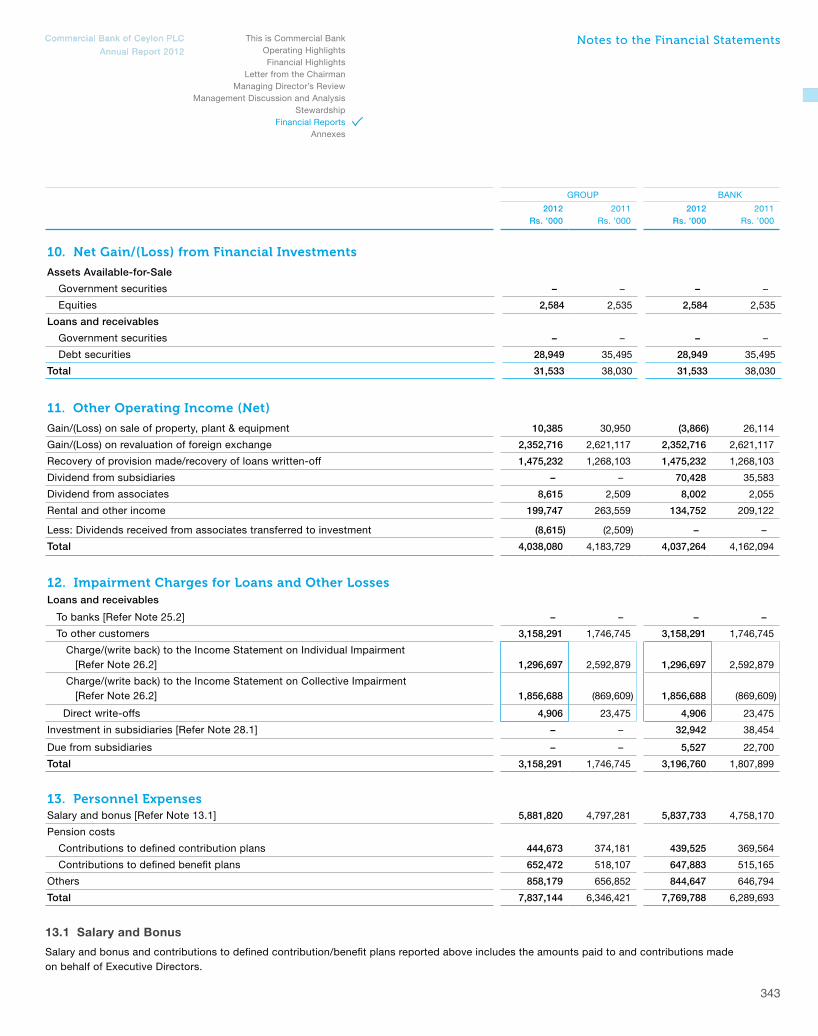
Commercial Bank of Ceylon PLCCommercial Bank of Ceylon PLC
Annual Report 2012Annual Report 2012
This is Commercial BankOperating HighlightsFinancial Highlights
Letter from the ChairmanManaging Director’s Review
Management Discussion and AnalysisStewardship
Financial ReportsAnnexes
343
GROUP BANK
2012 2011 2012 2011Rs. ’000 Rs. ’000 Rs. ’000 Rs. ’000
10. Net Gain/(Loss) from Financial Investments
Assets Available-for-Sale
Government securities – – – –
Equities 2,584 2,535 2,584 2,535
Loans and receivables
Government securities – – – –
Debt securities 28,949 35,495 28,949 35,495
Total 31,533 38,030 31,533 38,030
11. Other Operating Income (Net)
Gain/(Loss) on sale of property, plant & equipment 10,385 30,950 (3,866) 26,114
Gain/(Loss) on revaluation of foreign exchange 2,352,716 2,621,117 2,352,716 2,621,117
Recovery of provision made/recovery of loans written-off 1,475,232 1,268,103 1,475,232 1,268,103
Dividend from subsidiaries – – 70,428 35,583
Dividend from associates 8,615 2,509 8,002 2,055
Rental and other income 199,747 263,559 134,752 209,122
Less: Dividends received from associates transferred to investment (8,615) (2,509) – –
Total 4,038,080 4,183,729 4,037,264 4,162,094
12. Impairment Charges for Loans and Other LossesLoans and receivables
To banks [Refer Note 25.2] – – – –
To other customers 3,158,291 1,746,745 3,158,291 1,746,745
Charge/(write back) to the Income Statement on Individual Impairment [Refer Note 26.2] 1,296,697 2,592,879 1,296,697 2,592,879
Charge/(write back) to the Income Statement on Collective Impairment [Refer Note 26.2] 1,856,688 (869,609) 1,856,688 (869,609)
Direct write-offs 4,906 23,475 4,906 23,475
Investment in subsidiaries [Refer Note 28.1] – – 32,942 38,454
Due from subsidiaries – – 5,527 22,700
Total 3,158,291 1,746,745 3,196,760 1,807,899
13. Personnel ExpensesSalary and bonus [Refer Note 13.1] 5,881,820 4,797,281 5,837,733 4,758,170
Pension costs
Contributions to defined contribution plans 444,673 374,181 439,525 369,564
Contributions to defined benefit plans 652,472 518,107 647,883 515,165
Others 858,179 656,852 844,647 646,794
Total 7,837,144 6,346,421 7,769,788 6,289,693
13.1 Salary and Bonus
Salary and bonus and contributions to defined contribution/benefit plans reported above includes the amounts paid to and contributions made on behalf of Executive Directors.
Notes to the Financial Statements

Commercial Bank of Ceylon PLCCommercial Bank of Ceylon PLC
Annual Report 2012Annual Report 2012
This is Commercial BankOperating HighlightsFinancial Highlights
Letter from the ChairmanManaging Director’s ReviewManagement Discussion and AnalysisStewardshipFinancial ReportsAnnexes
344
GROUP BANK
2012 2011 2012 2011Rs. ’000 Rs. ’000 Rs. ’000 Rs. ’000
14. Other ExpensesDirectors’ emoluments [Refer Note 14.1] 20,549 20,699 19,524 19,937
Auditors’ remunerations 21,210 19,470 17,235 15,408
Audit fee and expenses 11,207 15,819 7,929 12,246
Audit related fee and expenses 5,631 1,332 5,230 1,332
Non-audit fee and expenses 4,372 2,319 4,076 1,830
Professional and legal expenses 280,154 253,289 275,987 253,920
Depreciation of property, plant & equipment [Refer Note 30] 942,765 734,115 859,675 648,543
Amortisation of leasedhold property [Refer Note 32] 1,452 1,452 942 942
Amortisation of intangible assets [Refer Note 31] 174,104 98,172 174,055 98,118
Office administration and establishment expenses 3,536,867 3,377,787 3,663,775 3,538,029
Maintenance of fixed assets 753,485 673,308 755,703 676,372
Total 5,730,586 5,178,292 5,766,896 5,251,269
14.1 Directors’ Emoluments
Directors emoluments represent the fees paid to both the Executive and Non-Executive Directors of the Bank/Group.
15. Income Tax Expense
15.1 Entity–wise Breakup of the Income Tax Expense is as follows:
GROUP BANK
2012 2011 2012 2011Rs. ’000 Rs. ’000 Rs. ’000 Rs. ’000
BankCurrent Year Tax expense
Current year Income tax expense of Domestic banking unit 3,082,348 2,392,800 3,082,348 2,392,800
Current year Income tax expense of Off-shore banking centre 204,960 37,544 204,960 37,544
Current year Income tax expense of Bangladesh operations 827,480 596,317 827,480 596,317
Profit remittance tax of Bangladesh operations 81,406 – 81,406 –
Prior years
(Over)/Under provision of taxes in respect of prior years (140,315) (223,522) (140,315) (223,522)
Deferred Tax Expense
Effect of change in tax rates – – – –
Temporary differences 141,125 211,222 141,125 211,222
4,197,004 3,014,361 4,197,004 3,014,361
Subsidiaries
Income tax expense of Commercial Development Company PLC 25,216 30,518 – –
Income tax expense of ONEzero Company Ltd. 8,456 2,327 – –
Associates
Share of income tax expense of Equity Investments Lanka Ltd. 18 18 – –
Share of income tax expense of Commercial Insurance Brokers (Pvt) Ltd. 1,053 694 – –
Total Income tax expense 4,231,747 3,047,918 4,197,004 3,014,361
Effective tax rate (excluding deferred tax) 28.37% 25.72%
Notes to the Financial Statements

Commercial Bank of Ceylon PLCCommercial Bank of Ceylon PLC
Annual Report 2012Annual Report 2012
This is Commercial BankOperating HighlightsFinancial Highlights
Letter from the ChairmanManaging Director’s Review
Management Discussion and AnalysisStewardship
Financial ReportsAnnexes
345
The Bank’s and Subsidiary’s, income tax for 2012 and 2011 have been provided on the taxable income at the rates shown below:
2012 2011% %
Domestic operations of the Bank 28.0 28.0
Off-shore banking Centre of the Bank 28.0 28.0
Bangladesh operations of the Bank 42.5 42.5
Commercial Development Company PLC 28.0 10.0 - 35.0
ONEzero Company Ltd. 28.0 10.0 - 28.0
15.2 Notional Tax Credit for Withholding Tax on Government Securities on Secondary Market Transactions
The Inland Revenue Act No. 10 of 2006 and the amendments thereto, provide that a company which derives interest income from the secondary market transactions on Government Securities (on or after April 1, 2002) would be entitled to a notional tax credit (being one-ninth of the net interest income), provided such interest income forms part of statutory income of the Company for that year of assessment.
Accordingly, the net interest income earned by the Group and the Bank from the secondary market transactions in Government Securities for the year, has been grossed up in these Financial Statements and the resulting notional tax credit amounted to Rs. 331.288 Mn. and Rs. 329.922 Mn. respectively (Rs. 351.687 Mn. and Rs. 350.026 Mn. respectively in 2011).
15.3 A Reconciliation between Tax Expense and the Product of Accounting Profit Multiplied by the Statutory Tax Rate is as Follows:
Tax Rate GROUP BANK
2012 2011 2012 2011 2012 2011
% % Rs. ’000 Rs. ’000 Rs. ’000 Rs. ’000
Accounting profit before tax from operations 14,312,914 10,980,219 14,295,333 10,897,230
Tax effect at the statutory income tax rates- 4,333,483 3,339,001 4,300,497 3,320,911
Domestic operations of the bank 28 28 3,287,958 2,722,966 3,287,958 2,722,966
Operations of the off–shore banking centre of the bank (on-shore and off-shore) 28 28 189,513 (8,161) 189,513 (8,161)
Bangladesh operation 42.5 42.5 823,026 606,106 823,026 606,106
Subsidiaries 28 10 - 35 32,986 18,090 – –
Tax effect of exempt income (574,543) (455,403) (574,543) (455,403)
Tax effect of non-deductible expenses 4,301,816 3,009,877 4,279,897 3,009,743
Tax effect of deductible expenses (3,919,113) (2,848,693) (3,891,063) (2,848,589)
Remittance tax of Bangladesh operation 81,406 – 81,406 –
Share of income tax expense of Associates 1,070 712 – –
Social responsibility levy at 1.5% of income tax – 145 – –
(Over)/under provision of taxes in respect of prior years (140,243) (222,274) (140,315) (223,523)
Deferred tax expense [Refer Note 33] 147,871 224,553 141,125 211,222
Income tax expense reported in the income statement at the effective income tax rate 4,231,747 3,047,918 4,197,004 3,014,361
Notes to the Financial Statements

Commercial Bank of Ceylon PLCCommercial Bank of Ceylon PLC
Annual Report 2012Annual Report 2012
This is Commercial BankOperating HighlightsFinancial Highlights
Letter from the ChairmanManaging Director’s ReviewManagement Discussion and AnalysisStewardshipFinancial ReportsAnnexes
346
16. Earnings Per Share (EPS)
GROUP BANK
2012 2011 2012 2011
Amounts used as the numerator:
Profit for the year attributable to equity holders of the Bank for basic and diluted earnings per share (Rs. ‘000) 10,079,829 7,932,062 10,098,329 7,882,869
Number of ordinary shares used as the denominator:
Weighted average number of ordinary shares used for basic earnings per share calculation 832,618,649 832,618,649 832,618,649 832,618,649
Effect of dilution:
Number of outstanding options under ESOP 2008, as at the year end [Refer Note 43.2] 9,018,320 9,018,320 9,018,320 9,018,320
Number of outstanding options under ESOP 2002, as at the year end [Refer Note 43.3] – –
Weighted average number of ordinary shares adjusted for the effect of dilution 841,636,969 841,636,969 841,636,969 841,636,969
Basic earnings per ordinary share (Rs.) 12.11 9.53 12.13 9.47
Diluted earnings per ordinary share (Rs.) 11.98 9.42 12.00 9.37
17. Dividends
GROUP BANK
2012 2011 2012 2011
Interim Rs. 1.50
Interim Rs. 2.50
Interim Rs. 1.50
Interim Rs. 2.50
(Paid during 2012)
(Paid during2011)
(Paid during2012)
(Paid during2011)
Rs. ’000 Rs. ’000 Rs. ’000 Rs. ’000
On Ordinary Shares
Net dividend paid to the ordinary shareholders 1,132,618 1,854,690 1,132,618 1,854,690
Withholding tax deducted at source 117,543 188,935 117,543 188,935
Gross ordinary dividend paid 1,250,161 2,043,625 1,250,161 2,043,625
Notes to the Financial Statements
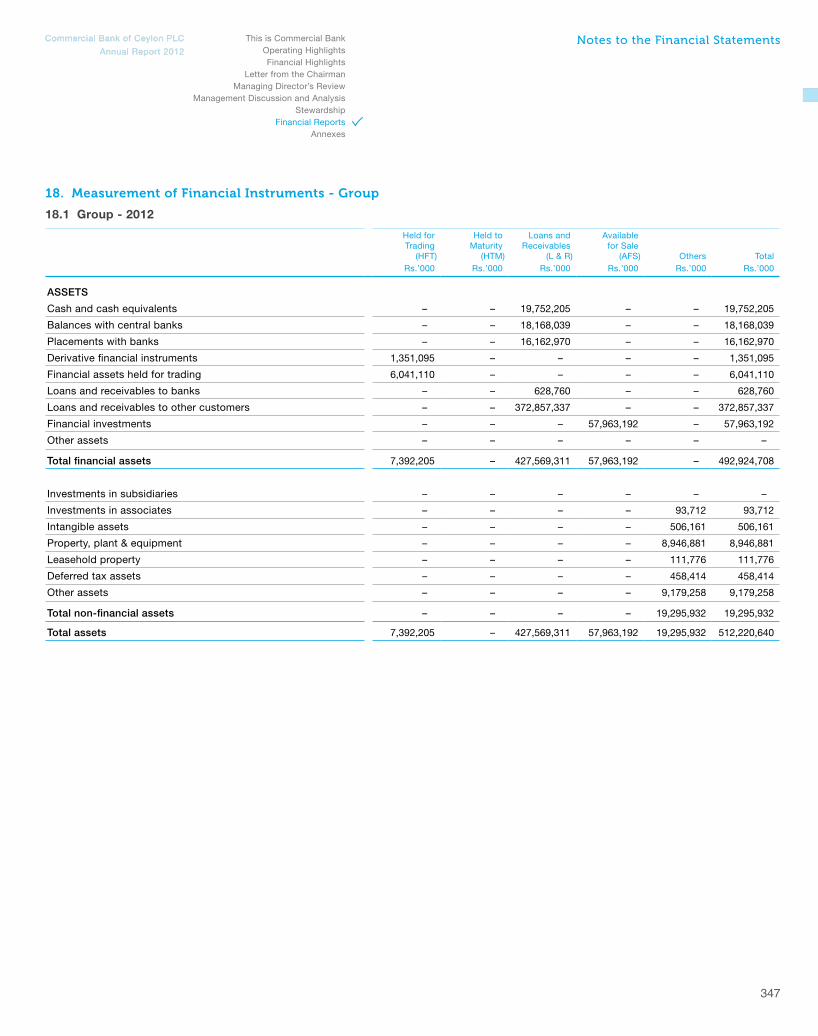
Commercial Bank of Ceylon PLCCommercial Bank of Ceylon PLC
Annual Report 2012Annual Report 2012
This is Commercial BankOperating HighlightsFinancial Highlights
Letter from the ChairmanManaging Director’s Review
Management Discussion and AnalysisStewardship
Financial ReportsAnnexes
347
18. Measurement of Financial Instruments - Group
18.1 Group - 2012
Held forTrading
(HFT)
Held toMaturity
(HTM)
Loans and Receivables
(L & R)
Available for Sale
(AFS) Others TotalRs.’000 Rs.’000 Rs.’000 Rs.’000 Rs.’000 Rs.’000
ASSETS
Cash and cash equivalents – – 19,752,205 – – 19,752,205
Balances with central banks – – 18,168,039 – – 18,168,039
Placements with banks – – 16,162,970 – – 16,162,970
Derivative financial instruments 1,351,095 – – – – 1,351,095
Financial assets held for trading 6,041,110 – – – – 6,041,110
Loans and receivables to banks – – 628,760 – – 628,760
Loans and receivables to other customers – – 372,857,337 – – 372,857,337
Financial investments – – – 57,963,192 – 57,963,192
Other assets – – – – – –
Total financial assets 7,392,205 – 427,569,311 57,963,192 – 492,924,708
Investments in subsidiaries – – – – – –
Investments in associates – – – – 93,712 93,712
Intangible assets – – – – 506,161 506,161
Property, plant & equipment – – – – 8,946,881 8,946,881
Leasehold property – – – – 111,776 111,776
Deferred tax assets – – – – 458,414 458,414
Other assets – – – – 9,179,258 9,179,258
Total non-financial assets – – – – 19,295,932 19,295,932
Total assets 7,392,205 – 427,569,311 57,963,192 19,295,932 512,220,640
Notes to the Financial Statements

Commercial Bank of Ceylon PLCCommercial Bank of Ceylon PLC
Annual Report 2012Annual Report 2012
This is Commercial BankOperating HighlightsFinancial Highlights
Letter from the ChairmanManaging Director’s ReviewManagement Discussion and AnalysisStewardshipFinancial ReportsAnnexes
348
Held forTrading
(HFT)Amortised
cost Others TotalRs.’000 Rs.’000 Rs.’000 Rs.’000
LIABILITIES
Due to banks – 4,763,565 – 4,763,565
Derivative financial instruments 84,291 – – 84,291
Other financial liabilities held for trading – – – –
Due to other customers – 390,568,682 – 390,568,682
Other borrowings – 47,565,945 – 47,565,945
Debt securities issued – – – –
Other liabilities – – – –
Subordinated term debts – 1,106,016 – 1,106,016
Total financial liabilities 84,291 444,004,208 – 444,088,499
Current tax liabilities – – 2,821,975 2,821,975
Deferred tax liabilities – – 1,889,983 1,889,983
Other provisions – – 2,409 2,409
Other liabilities – – 10,417,213 10,417,213
Due to subsidiaries – – – –
Total non-financial liabilities – – 15,131,580 15,131,580
Total liabilities 84,291 444,004,208 15,131,580 459,220,079
18.2 Group - 2011
Held forTrading
(HFT)
Held toMaturity
(HTM)
Loans and Receivables
(L & R)
Availablefor Sale
(AFS) Others TotalRs.’000 Rs.’000 Rs.’000 Rs.’000 Rs.’000 Rs.’000
ASSETSCash and cash equivalents – – 12,934,995 – – 12,934,995
Balances with central banks – – 17,342,959 – – 17,342,959
Placements with banks – – 11,674,363 – – 11,674,363
Derivative financial instruments 39,612 – – – – 39,612
Financial assets held for trading 6,418,010 – – – – 6,418,010
Loans and receivables to banks – – 580,158 – – 580,158
Loans and receivables to other customers – – 314,326,998 – – 314,326,998
Financial investments – – – 61,415,395 – 61,415,395
Other assets – – – –
Total financial assets 6,457,622 – 356,859,473 61,415,395 – 424,732,490
Investments in subsidiaries – – – – – –
Investments in associates – – – – 119,981 119,981
Intangible assets – – – – 475,038 475,038
Property, plant & equipment – – – – 8,503,211 8,503,211
Leasehold property – – – – 113,228 113,228
Deferred tax assets – – – – 363,711 363,711
Other assets – – – – 7,290,298 7,290,298
Total non-financial assets – – – – 16,865,467 16,865,467
Total assets 6,457,622 – 356,859,473 61,415,395 16,865,467 441,597,957
Notes to the Financial Statements

Commercial Bank of Ceylon PLCCommercial Bank of Ceylon PLC
Annual Report 2012Annual Report 2012
This is Commercial BankOperating HighlightsFinancial Highlights
Letter from the ChairmanManaging Director’s Review
Management Discussion and AnalysisStewardship
Financial ReportsAnnexes
349
Held forTrading
(HFT)Amortised
cost Others TotalRs.’000 Rs.’000 Rs.’000 Rs.’000
LIABILITIESDue to banks – 11,574,105 – 11,574,105
Derivative financial instruments 435,171 – – 435,171
Other financial liabilities held for trading – – – –
Due to other customers – 323,697,628 – 323,697,628
Other borrowings – 49,455,005 – 49,455,005
Debt securities issued – – – –
Other liabilities – – – –
Subordinated term debts – 1,105,639 – 1,105,639
Total financial liabilities 435,171 385,832,377 – 386,267,548
Current tax liabilities – – 1,307,079 1,307,079
Deferred tax liabilities – – 1,639,827 1,639,827
Other provisions – – 535 535
Other liabilities – – 8,213,999 8,213,999
Due to Subsidiaries – – – –
Total non-financial liabilities – – 11,161,440 11,161,440
Total liabilities 435,171 385,832,377 11,161,440 397,428,988
19. Measurement of Financial Instruments - Bank
19.1 Bank - 2012
Held forTrading
(HFT)
Held toMaturity
(HTM)
Loans and Receivables
(L & R)
Availablefor Sale
(AFS) Others TotalRs.’000 Rs.’000 Rs.’000 Rs.’000 Rs.’000 Rs.’000
ASSETSCash and cash equivalents – – 19,732,834 – – 19,732,834
Balances with central banks – – 18,168,039 – – 18,168,039
Placements with banks – – 16,162,970 – – 16,162,970
Derivative financial instruments 1,351,095 – – – – 1,351,095
Financial assets held for trading 6,041,110 – – – – 6,041,110
Loans and receivables to banks – – 628,760 – – 628,760
Loans and receivables to other customers – – 372,915,081 – – 372,915,081
Financial investments – – – 57,963,192 – 57,963,192
Other assets – – – – – –
Total financial assets 7,392,205 – 427,607,684 57,963,192 – 492,963,081
Investments in subsidiaries – – – – 303,130 303,130
Investments in associates – – – – 44,331 44,331
Intangible assets – – – – 497,038 497,038
Property, plant & equipment – – – – 8,221,118 8,221,118
Leasehold property – – – – 77,304 77,304
Deferred tax assets – – – – 448,500 448,500
Other assets – – – – 9,188,206 9,188,206
Total non-financial assets – – – – 18,779,627 18,779,627
Total assets 7,392,205 – 427,607,684 57,963,192 18,779,627 511,742,708
Notes to the Financial Statements

Commercial Bank of Ceylon PLCCommercial Bank of Ceylon PLC
Annual Report 2012Annual Report 2012
This is Commercial BankOperating HighlightsFinancial Highlights
Letter from the ChairmanManaging Director’s ReviewManagement Discussion and AnalysisStewardshipFinancial ReportsAnnexes
350
Held forTrading
(HFT)Amortised
cost Others TotalRs.’000 Rs.’000 Rs.’000 Rs.’000
LIABILITIES
Due to banks – 4,763,565 – 4,763,565
Derivative financial instruments 84,291 – – 84,291
Other financial liabilities held for trading – – – –
Due to other customers – 390,611,548 – 390,611,548
Other borrowings – 47,713,199 – 47,713,199
Debt securities issued – – – –
Other liabilities – – – –
Subordinated term debts – 1,106,016 – 1,106,016
Total financial liabilities 84,291 444,194,328 – 444,278,619
Current tax liabilities – – 2,801,541 2,801,541
Deferred tax liabilities – – 1,698,067 1,698,067
Other provisions – – 2,409 2,409
Other liabilities – – 10,362,808 10,362,808
Due to subsidiaries – – 22,264 22,264
Total non-financial liabilities – – 14,887,089 14,887,089
Total liabilities 84,291 444,194,328 14,887,089 459,165,708
19.2 Bank - 2011
Held forTrading
(HFT)
Held toMaturity
(HTM)
Loans and Receivables
(L & R)
Availablefor Sale
(AFS) Others TotalRs.’000 Rs.’000 Rs.’000 Rs.’000 Rs.’000 Rs.’000
ASSETS
Cash and cash equivalents – – 12,910,989 – – 12,910,989
Balances with central banks – – 17,342,959 – – 17,342,959
Placements with banks – – 11,674,363 – – 11,674,363
Derivative financial instruments 39,612 – – – – 39,612
Financial assets held for trading 6,418,010 – – – – 6,418,010
Loans and receivables to banks – – 580,158 – – 580,158
Loans and receivables to other customers – – 314,485,967 – – 314,485,967
Financial investments – – – 61,415,395 – 61,415,395
Other assets –
Total financial assets 6,457,622 – 356,994,436 61,415,395 – 424,867,453
Investments in subsidiaries – – – – 315,444 315,444
Investments in associates – – – – 44,331 44,331
Intangible assets – – – – 467,014 467,014
Property, plant & equipment – – – – 7,907,030 7,907,030
Leasehold property – – – – 78,246 78,246
Deferred tax assets – – – – 359,617 359,617
Other assets – – – – 7,290,514 7,290,514
Total non-financial assets – – – – 16,462,196 16,462,196
Total assets 6,457,622 – 356,994,436 61,415,395 16,462,196 441,329,649
Notes to the Financial Statements

Commercial Bank of Ceylon PLCCommercial Bank of Ceylon PLC
Annual Report 2012Annual Report 2012
This is Commercial BankOperating HighlightsFinancial Highlights
Letter from the ChairmanManaging Director’s Review
Management Discussion and AnalysisStewardship
Financial ReportsAnnexes
351
Held forTrading
(HFT)Amortised
cost Others TotalRs.’000 Rs.’000 Rs.’000 Rs.’000
LIABILITIES
Due to banks – 11,574,105 – 11,574,105
Derivative financial instruments 435,171 – – 435,171
Other Financial liabilities held for trading – – – –
Due to other customers – 323,754,748 – 323,754,748
Other borrowings – 49,603,142 – 49,603,142
Debt securities issued – – – –
Other liabilities – – – –
Subordinated term debts 1,105,639 1,105,639
Total financial liabilities 435,171 386,037,634 – 386,472,805
Current tax liabilities – – 1,305,442 1,305,442
Deferred tax liabilities – – 1,594,086 1,594,086
Other provisions – – 535 535
Other liabilities – – 8,162,382 8,162,382
Due to Subsidiaries – – 29,734 29,734
Total non-financial liabilities – – 11,092,179 11,092,179
Total liabilities 435,171 386,037,634 11,092,179 397,564,984
20. Cash and Cash Equivalents
GROUP BANK
2012 2011 January 1, 2011 2012 2011 January 1, 2011Rs. ’000 Rs. ’000 Rs. ’000 Rs. ’000 Rs. ’000 Rs. ’000
Cash in hand
Coins and notes held in local currency 9,993,872 7,926,727 5,610,040 9,974,501 7,902,721 5,562,824
Coins and notes held in foreign currency 1,100,258 612,124 573,927 1,100,258 612,124 573,927
Balances with banks 4,140,608 2,707,563 1,553,139 4,140,608 2,707,563 1,553,139
Money at call and short notice 4,517,467 1,688,581 579,942 4,517,467 1,688,581 579,942
Total 19,752,205 12,934,995 8,317,048 19,732,834 12,910,989 8,269,832
Notes to the Financial Statements

Commercial Bank of Ceylon PLCCommercial Bank of Ceylon PLC
Annual Report 2012Annual Report 2012
This is Commercial BankOperating HighlightsFinancial Highlights
Letter from the ChairmanManaging Director’s ReviewManagement Discussion and AnalysisStewardshipFinancial ReportsAnnexes
352
21. Balances with Central Banks
GROUP BANK
2012 2011 January 1, 2011 2012 2011 January 1, 2011Rs. ’000 Rs. ’000 Rs. ’000 Rs. ’000 Rs. ’000 Rs. ’000
Statutory balances with central banks
Central Bank of Sri Lanka 15,786,899 15,354,543 10,110,850 15,786,899 15,354,543 10,110,850
Bangladesh Bank 2,381,140 1,988,416 2,077,984 2,381,140 1,988,416 2,077,984
Non-statutory balances with central banks – – – – – –
Central Bank of Sri Lanka – – – – – –
Bangladesh Bank – – – – – –
Total 18,168,039 17,342,959 12,188,834 18,168,039 17,342,959 12,188,834
As required by the provisions of Section 93 of the Monetary Law Act, a cash balance is maintained with the Central Bank of Sri Lanka. As at December 31, 2012, the minimum cash reserve requirement was 8.00% of the rupee deposit liabilities (8.00% in 2011). There is no reserve requirement for foreign currency deposit liabilities of the Domestic Banking Unit and the deposit liabilities of the Off-shore Banking Centre in Sri Lanka.
As per the Bangladesh Bank regulations, the Statutory Liquidity Requirement is 19.00% (19.00% in 2011) on time and demand liabilities (both local and foreign currencies), which includes a 6.00% (6.00% in 2011) cash reserve requirement and the balance 13.00% is permitted to be maintained in foreign currency and/or also in unencumbered securities held with the Bangladesh Bank.
22. Placements with Banks
GROUP BANK
2012 2011 January 1, 2011 2012 2011 January 1, 2011Rs. ’000 Rs. ’000 Rs. ’000 Rs. ’000 Rs. ’000 Rs. ’000
Placements - Sri Lanka 3,584,000 3,432,390 1,112,000 3,584,000 3,432,390 1,112,000
Placements - Outside Sri Lanka 12,578,970 8,241,973 723,260 12,578,970 8,241,973 723,260
Total 16,162,970 11,674,363 1,835,260 16,162,970 11,674,363 1,835,260
Notes to the Financial Statements

Commercial Bank of Ceylon PLCCommercial Bank of Ceylon PLC
Annual Report 2012Annual Report 2012
This is Commercial BankOperating HighlightsFinancial Highlights
Letter from the ChairmanManaging Director’s Review
Management Discussion and AnalysisStewardship
Financial ReportsAnnexes
353
GROUP BANK
2012 2011 January 1, 2011 2012 2011 January 1, 2011Rs. ’000 Rs. ’000 Rs. ’000 Rs. ’000 Rs. ’000 Rs. ’000
23. Derivative Financial Instruments
Interest rate derivatives
Interest rate swaps – 109 1,006 – 109 1,006
Foreign currency derivatives
Forward foreign exchange contracts 1,351,095 39,503 168,910 1,351,095 39,503 168,910
Total 1,351,095 39,612 169,916 1,351,095 39,612 169,916
24. Other Financial Assets Held for Trading
Sri Lanka Government Securities [Refer Note 24.1] 5,718,231 6,193,392 10,192,150 5,718,231 6,193,392 10,192,150
Equity shares [Refer Note 24.2] 322,879 224,618 184,791 322,879 224,618 184,791
Total 6,041,110 6,418,010 10,376,941 6,041,110 6,418,010 10,376,941
24.1 Investments in Government Securities
Treasury Bills 4,175,815 4,062,170 3,772,580 4,175,815 4,062,170 3,772,580
Treasury Bonds 1,542,416 2,013,449 5,812,444 1,542,416 2,013,449 5,812,444
Sri Lanka Sovereign Bonds – 117,773 607,126 – 117,773 607,126
Sri Lanka development bond – – – – – –
Sub Total 5,718,231 6,193,392 10,192,150 5,718,231 6,193,392 10,192,150
Notes to the Financial Statements
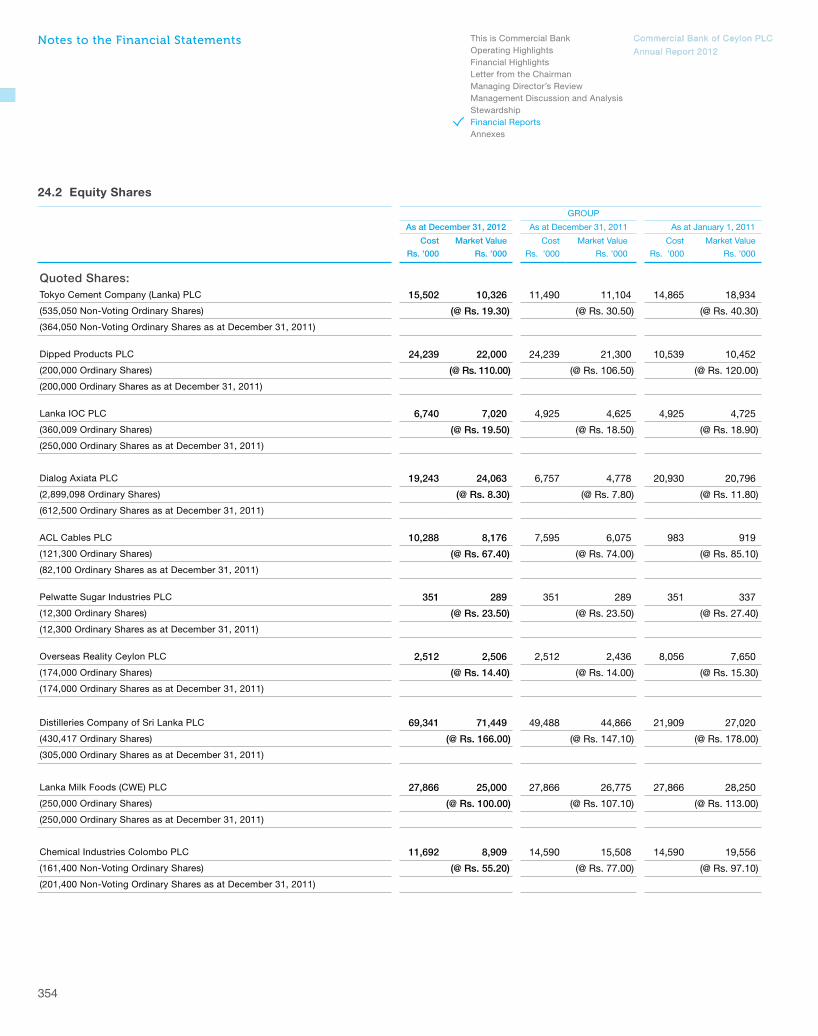
Commercial Bank of Ceylon PLCCommercial Bank of Ceylon PLC
Annual Report 2012Annual Report 2012
This is Commercial BankOperating HighlightsFinancial Highlights
Letter from the ChairmanManaging Director’s ReviewManagement Discussion and AnalysisStewardshipFinancial ReportsAnnexes
354
24.2 Equity Shares
GROUP BANK
As at December 31, 2012 As at December 31, 2011 As at January 1, 2011 As at December 31, 2012 As at December 31, 2011 As at January 1, 2011
Cost Market Value Cost Market Value Cost Market Value Cost Market Value Cost Market Value Cost Market Value
Rs. ’000 Rs. ’000 Rs. ’000 Rs. ’000 Rs. ’000 Rs. ’000 Rs. ’000 Rs. ’000 Rs. ’000 Rs. ’000 Rs. ’000 Rs. ’000
Quoted Shares:Tokyo Cement Company (Lanka) PLC 15,502 10,326 11,490 11,104 14,865 18,934 15,502 10,326 11,490 11,104 14,865 18,934
(535,050 Non-Voting Ordinary Shares) (@ Rs. 19.30) (@ Rs. 30.50) (@ Rs. 40.30) (@ Rs. 19.30) (@ Rs. 30.50) (@ Rs. 40.30)
(364,050 Non-Voting Ordinary Shares as at December 31, 2011)
Dipped Products PLC 24,239 22,000 24,239 21,300 10,539 10,452 24,239 22,000 24,239 21,300 10,539 10,452
(200,000 Ordinary Shares) (@ Rs. 110.00) (@ Rs. 106.50) (@ Rs. 120.00) (@ Rs. 110.00) (@ Rs. 106.50) (@ Rs. 120.00)
(200,000 Ordinary Shares as at December 31, 2011)
Lanka IOC PLC 6,740 7,020 4,925 4,625 4,925 4,725 6,740 7,020 4,925 4,625 4,925 4,725
(360,009 Ordinary Shares) (@ Rs. 19.50) (@ Rs. 18.50) (@ Rs. 18.90) (@ Rs. 19.50) (@ Rs. 18.50) (@ Rs. 18.90)
(250,000 Ordinary Shares as at December 31, 2011)
Dialog Axiata PLC 19,243 24,063 6,757 4,778 20,930 20,796 19,243 24,063 6,757 4,778 20,930 20,796
(2,899,098 Ordinary Shares) (@ Rs. 8.30) (@ Rs. 7.80) (@ Rs. 11.80) (@ Rs. 8.30) (@ Rs. 7.80) (@ Rs. 11.80)
(612,500 Ordinary Shares as at December 31, 2011)
ACL Cables PLC 10,288 8,176 7,595 6,075 983 919 10,288 8,176 7,595 6,075 983 919
(121,300 Ordinary Shares) (@ Rs. 67.40) (@ Rs. 74.00) (@ Rs. 85.10) (@ Rs. 67.40) (@ Rs. 74.00) (@ Rs. 85.10)
(82,100 Ordinary Shares as at December 31, 2011)
Pelwatte Sugar Industries PLC 351 289 351 289 351 337 351 289 351 289 351 337
(12,300 Ordinary Shares) (@ Rs. 23.50) (@ Rs. 23.50) (@ Rs. 27.40) (@ Rs. 23.50) (@ Rs. 23.50) (@ Rs. 27.40)
(12,300 Ordinary Shares as at December 31, 2011)
Overseas Reality Ceylon PLC 2,512 2,506 2,512 2,436 8,056 7,650 2,512 2,506 2,512 2,436 8,056 7,650
(174,000 Ordinary Shares) (@ Rs. 14.40) (@ Rs. 14.00) (@ Rs. 15.30) (@ Rs. 14.40) (@ Rs. 14.00) (@ Rs. 15.30)
(174,000 Ordinary Shares as at December 31, 2011)
Distilleries Company of Sri Lanka PLC 69,341 71,449 49,488 44,866 21,909 27,020 69,341 71,449 49,488 44,866 21,909 27,020
(430,417 Ordinary Shares) (@ Rs. 166.00) (@ Rs. 147.10) (@ Rs. 178.00) (@ Rs. 166.00) (@ Rs. 147.10) (@ Rs. 178.00)
(305,000 Ordinary Shares as at December 31, 2011)
Lanka Milk Foods (CWE) PLC 27,866 25,000 27,866 26,775 27,866 28,250 27,866 25,000 27,866 26,775 27,866 28,250
(250,000 Ordinary Shares) (@ Rs. 100.00) (@ Rs. 107.10) (@ Rs. 113.00) (@ Rs. 100.00) (@ Rs. 107.10) (@ Rs. 113.00)
(250,000 Ordinary Shares as at December 31, 2011)
Chemical Industries Colombo PLC 11,692 8,909 14,590 15,508 14,590 19,556 11,692 8,909 14,590 15,508 14,590 19,556
(161,400 Non-Voting Ordinary Shares) (@ Rs. 55.20) (@ Rs. 77.00) (@ Rs. 97.10) (@ Rs. 55.20) (@ Rs. 77.00) (@ Rs. 97.10)
(201,400 Non-Voting Ordinary Shares as at December 31, 2011)
Notes to the Financial Statements

Commercial Bank of Ceylon PLCCommercial Bank of Ceylon PLC
Annual Report 2012Annual Report 2012
This is Commercial BankOperating HighlightsFinancial Highlights
Letter from the ChairmanManaging Director’s Review
Management Discussion and AnalysisStewardship
Financial ReportsAnnexes
355
24.2 Equity Shares
GROUP BANK
As at December 31, 2012 As at December 31, 2011 As at January 1, 2011 As at December 31, 2012 As at December 31, 2011 As at January 1, 2011
Cost Market Value Cost Market Value Cost Market Value Cost Market Value Cost Market Value Cost Market Value
Rs. ’000 Rs. ’000 Rs. ’000 Rs. ’000 Rs. ’000 Rs. ’000 Rs. ’000 Rs. ’000 Rs. ’000 Rs. ’000 Rs. ’000 Rs. ’000
Quoted Shares:Tokyo Cement Company (Lanka) PLC 15,502 10,326 11,490 11,104 14,865 18,934 15,502 10,326 11,490 11,104 14,865 18,934
(535,050 Non-Voting Ordinary Shares) (@ Rs. 19.30) (@ Rs. 30.50) (@ Rs. 40.30) (@ Rs. 19.30) (@ Rs. 30.50) (@ Rs. 40.30)
(364,050 Non-Voting Ordinary Shares as at December 31, 2011)
Dipped Products PLC 24,239 22,000 24,239 21,300 10,539 10,452 24,239 22,000 24,239 21,300 10,539 10,452
(200,000 Ordinary Shares) (@ Rs. 110.00) (@ Rs. 106.50) (@ Rs. 120.00) (@ Rs. 110.00) (@ Rs. 106.50) (@ Rs. 120.00)
(200,000 Ordinary Shares as at December 31, 2011)
Lanka IOC PLC 6,740 7,020 4,925 4,625 4,925 4,725 6,740 7,020 4,925 4,625 4,925 4,725
(360,009 Ordinary Shares) (@ Rs. 19.50) (@ Rs. 18.50) (@ Rs. 18.90) (@ Rs. 19.50) (@ Rs. 18.50) (@ Rs. 18.90)
(250,000 Ordinary Shares as at December 31, 2011)
Dialog Axiata PLC 19,243 24,063 6,757 4,778 20,930 20,796 19,243 24,063 6,757 4,778 20,930 20,796
(2,899,098 Ordinary Shares) (@ Rs. 8.30) (@ Rs. 7.80) (@ Rs. 11.80) (@ Rs. 8.30) (@ Rs. 7.80) (@ Rs. 11.80)
(612,500 Ordinary Shares as at December 31, 2011)
ACL Cables PLC 10,288 8,176 7,595 6,075 983 919 10,288 8,176 7,595 6,075 983 919
(121,300 Ordinary Shares) (@ Rs. 67.40) (@ Rs. 74.00) (@ Rs. 85.10) (@ Rs. 67.40) (@ Rs. 74.00) (@ Rs. 85.10)
(82,100 Ordinary Shares as at December 31, 2011)
Pelwatte Sugar Industries PLC 351 289 351 289 351 337 351 289 351 289 351 337
(12,300 Ordinary Shares) (@ Rs. 23.50) (@ Rs. 23.50) (@ Rs. 27.40) (@ Rs. 23.50) (@ Rs. 23.50) (@ Rs. 27.40)
(12,300 Ordinary Shares as at December 31, 2011)
Overseas Reality Ceylon PLC 2,512 2,506 2,512 2,436 8,056 7,650 2,512 2,506 2,512 2,436 8,056 7,650
(174,000 Ordinary Shares) (@ Rs. 14.40) (@ Rs. 14.00) (@ Rs. 15.30) (@ Rs. 14.40) (@ Rs. 14.00) (@ Rs. 15.30)
(174,000 Ordinary Shares as at December 31, 2011)
Distilleries Company of Sri Lanka PLC 69,341 71,449 49,488 44,866 21,909 27,020 69,341 71,449 49,488 44,866 21,909 27,020
(430,417 Ordinary Shares) (@ Rs. 166.00) (@ Rs. 147.10) (@ Rs. 178.00) (@ Rs. 166.00) (@ Rs. 147.10) (@ Rs. 178.00)
(305,000 Ordinary Shares as at December 31, 2011)
Lanka Milk Foods (CWE) PLC 27,866 25,000 27,866 26,775 27,866 28,250 27,866 25,000 27,866 26,775 27,866 28,250
(250,000 Ordinary Shares) (@ Rs. 100.00) (@ Rs. 107.10) (@ Rs. 113.00) (@ Rs. 100.00) (@ Rs. 107.10) (@ Rs. 113.00)
(250,000 Ordinary Shares as at December 31, 2011)
Chemical Industries Colombo PLC 11,692 8,909 14,590 15,508 14,590 19,556 11,692 8,909 14,590 15,508 14,590 19,556
(161,400 Non-Voting Ordinary Shares) (@ Rs. 55.20) (@ Rs. 77.00) (@ Rs. 97.10) (@ Rs. 55.20) (@ Rs. 77.00) (@ Rs. 97.10)
(201,400 Non-Voting Ordinary Shares as at December 31, 2011)
Notes to the Financial Statements

Commercial Bank of Ceylon PLCCommercial Bank of Ceylon PLC
Annual Report 2012Annual Report 2012
This is Commercial BankOperating HighlightsFinancial Highlights
Letter from the ChairmanManaging Director’s ReviewManagement Discussion and AnalysisStewardshipFinancial ReportsAnnexes
356
GROUP BANK
As at December 31, 2012 As at December 31, 2011 As at January 1, 2011 As at December 31, 2012 As at December 31, 2011 As at January 1, 2011
Cost Market Value Cost Market Value Cost Market Value Cost Market Value Cost Market Value Cost Market Value
Rs. ’000 Rs. ’000 Rs. ’000 Rs. ’000 Rs. ’000 Rs. ’000 Rs. ’000 Rs. ’000 Rs. ’000 Rs. ’000 Rs. ’000 Rs. ’000
Haycarb PLC 31,748 35,070 1,251 1,101 1,251 1,196 31,748 35,070 1,251 1,101 1,251 1,196
(204,968 Ordinary Shares) (@ Rs. 171.10) (@ Rs. 155.00) (@ Rs. 168.50) (@ Rs. 171.10) (@ Rs. 155.00) (@ Rs. 168.50)
(7,100 Ordinary Shares as at December 31, 2011)
Ceylon Hospitals PLC 4,423 4,094 4,423 3,849 411 456 4,423 4,094 4,423 3,849 411 456
(61,100 Non-Voting Ordinary Shares) (@ Rs. 67.00) (@ Rs. 63.00) (@ Rs. 82.90) (@ Rs. 67.00) (@ Rs. 63.00) (@ Rs. 82.90)
(61,100 Non-Voting Ordinary Shares as at December 31, 2011)
Lanka Walltile PLC 5 4 5 6 3,431 4,234 5 4 5 6 3,431 4,234
(60 Ordinary Shares) (@ Rs. 60.80) (@ Rs. 94.50) (@ Rs. 131.90) (@ Rs. 60.80) (@ Rs. 94.50) (@ Rs. 131.90)
(60 Ordinary Shares as at December 31, 2011)
NDB Bank PLC 13,348 13,790 18,884 13,810 – – 13,348 13,790 18,884 13,810 – –
(100,000 Ordinary Shares ) (@ Rs. 137.90) (@ Rs. 138.10) – (@ Rs. 137.90) (@ Rs. 138.10) –
(100,000 Ordinary Shares as at December 31, 2011)
Ceylon Hospitals PLC 16,665 14,435 16,665 13,337 – – 16,665 14,435 16,665 13,337 – –
(156,900 Ordinary Shares ) (@ Rs. 92.00) (@ Rs. 85.00) – (@ Rs. 92.00) (@ Rs. 85.00) –
(156,900 Ordinary Shares as at December 31, 2011)
Kotagala Plantations PLC 156 104 156 90 – – 156 104 156 90 – –
(1,400 Ordinary Shares) (@ Rs. 74.00) (@ Rs. 64.30) – (@ Rs. 74.00) (@ Rs. 64.30) –
(1,400 Ordinary Shares as at December 31, 2011)
Hatton National Bank PLC 5,013 6,031 21,567 18,653 – – 5,013 6,031 21,567 18,653 – –
(53,608 Non-Voting Ordinary Shares) (@ Rs. 112.50) (@ Rs. 83.20) – (@ Rs. 112.50) (@ Rs. 83.20) –
(224,200 Ordinary Shares as at December 31, 2011)
DFCC Bank PLC 6,353 6,142 11,141 10,771 – – 6,353 6,142 11,141 10,771 – –
(54,400 Ordinary Shares) (@ Rs. 112.90) (@ Rs. 112.90) – (@ Rs. 112.90) (@ Rs. 112.90) –
(95,400 Ordinary Shares as at December 31, 2011)
Royal Ceramics Lanka PLC 7,772 5,445 7,772 7,783 – – 7,772 5,445 7,772 7,783 – –
(55,000 Ordinary Shares ) (@ Rs. 99.00) (@ Rs. 141.50) – (@ Rs. 99.00) (@ Rs. 141.50) –
(55,000 Ordinary Shares as at December 31, 2011)
COCO Lanka PLC 7,062 7,316 – – 3,087 3,364 7,062 7,316 – – 3,087 3,364
(201,000 Ordinary Shares) (@ Rs. 36.40) – (@ Rs. 60.50) (@ Rs. 36.40) – (@ Rs. 60.50)
(2011 - Nil)
Citizen Development Bank PLC 4,130 3,719 – – – – 4,130 3,719 – – – –
(123,950 Non-Voting Ordinary Shares) (@ Rs. 30.00) – – (@ Rs. 30.00) – –
(2011 - Nil)
Notes to the Financial Statements

Commercial Bank of Ceylon PLCCommercial Bank of Ceylon PLC
Annual Report 2012Annual Report 2012
This is Commercial BankOperating HighlightsFinancial Highlights
Letter from the ChairmanManaging Director’s Review
Management Discussion and AnalysisStewardship
Financial ReportsAnnexes
357
GROUP BANK
As at December 31, 2012 As at December 31, 2011 As at January 1, 2011 As at December 31, 2012 As at December 31, 2011 As at January 1, 2011
Cost Market Value Cost Market Value Cost Market Value Cost Market Value Cost Market Value Cost Market Value
Rs. ’000 Rs. ’000 Rs. ’000 Rs. ’000 Rs. ’000 Rs. ’000 Rs. ’000 Rs. ’000 Rs. ’000 Rs. ’000 Rs. ’000 Rs. ’000
Haycarb PLC 31,748 35,070 1,251 1,101 1,251 1,196 31,748 35,070 1,251 1,101 1,251 1,196
(204,968 Ordinary Shares) (@ Rs. 171.10) (@ Rs. 155.00) (@ Rs. 168.50) (@ Rs. 171.10) (@ Rs. 155.00) (@ Rs. 168.50)
(7,100 Ordinary Shares as at December 31, 2011)
Ceylon Hospitals PLC 4,423 4,094 4,423 3,849 411 456 4,423 4,094 4,423 3,849 411 456
(61,100 Non-Voting Ordinary Shares) (@ Rs. 67.00) (@ Rs. 63.00) (@ Rs. 82.90) (@ Rs. 67.00) (@ Rs. 63.00) (@ Rs. 82.90)
(61,100 Non-Voting Ordinary Shares as at December 31, 2011)
Lanka Walltile PLC 5 4 5 6 3,431 4,234 5 4 5 6 3,431 4,234
(60 Ordinary Shares) (@ Rs. 60.80) (@ Rs. 94.50) (@ Rs. 131.90) (@ Rs. 60.80) (@ Rs. 94.50) (@ Rs. 131.90)
(60 Ordinary Shares as at December 31, 2011)
NDB Bank PLC 13,348 13,790 18,884 13,810 – – 13,348 13,790 18,884 13,810 – –
(100,000 Ordinary Shares ) (@ Rs. 137.90) (@ Rs. 138.10) – (@ Rs. 137.90) (@ Rs. 138.10) –
(100,000 Ordinary Shares as at December 31, 2011)
Ceylon Hospitals PLC 16,665 14,435 16,665 13,337 – – 16,665 14,435 16,665 13,337 – –
(156,900 Ordinary Shares ) (@ Rs. 92.00) (@ Rs. 85.00) – (@ Rs. 92.00) (@ Rs. 85.00) –
(156,900 Ordinary Shares as at December 31, 2011)
Kotagala Plantations PLC 156 104 156 90 – – 156 104 156 90 – –
(1,400 Ordinary Shares) (@ Rs. 74.00) (@ Rs. 64.30) – (@ Rs. 74.00) (@ Rs. 64.30) –
(1,400 Ordinary Shares as at December 31, 2011)
Hatton National Bank PLC 5,013 6,031 21,567 18,653 – – 5,013 6,031 21,567 18,653 – –
(53,608 Non-Voting Ordinary Shares) (@ Rs. 112.50) (@ Rs. 83.20) – (@ Rs. 112.50) (@ Rs. 83.20) –
(224,200 Ordinary Shares as at December 31, 2011)
DFCC Bank PLC 6,353 6,142 11,141 10,771 – – 6,353 6,142 11,141 10,771 – –
(54,400 Ordinary Shares) (@ Rs. 112.90) (@ Rs. 112.90) – (@ Rs. 112.90) (@ Rs. 112.90) –
(95,400 Ordinary Shares as at December 31, 2011)
Royal Ceramics Lanka PLC 7,772 5,445 7,772 7,783 – – 7,772 5,445 7,772 7,783 – –
(55,000 Ordinary Shares ) (@ Rs. 99.00) (@ Rs. 141.50) – (@ Rs. 99.00) (@ Rs. 141.50) –
(55,000 Ordinary Shares as at December 31, 2011)
COCO Lanka PLC 7,062 7,316 – – 3,087 3,364 7,062 7,316 – – 3,087 3,364
(201,000 Ordinary Shares) (@ Rs. 36.40) – (@ Rs. 60.50) (@ Rs. 36.40) – (@ Rs. 60.50)
(2011 - Nil)
Citizen Development Bank PLC 4,130 3,719 – – – – 4,130 3,719 – – – –
(123,950 Non-Voting Ordinary Shares) (@ Rs. 30.00) – – (@ Rs. 30.00) – –
(2011 - Nil)
Notes to the Financial Statements

Commercial Bank of Ceylon PLCCommercial Bank of Ceylon PLC
Annual Report 2012Annual Report 2012
This is Commercial BankOperating HighlightsFinancial Highlights
Letter from the ChairmanManaging Director’s ReviewManagement Discussion and AnalysisStewardshipFinancial ReportsAnnexes
358
GROUP BANK
As at December 31, 2012 As at December 31, 2011 As at January 1, 2011 As at December 31, 2012 As at December 31, 2011 As at January 1, 2011
Cost Market Value Cost Market Value Cost Market Value Cost Market Value Cost Market Value Cost Market Value
Rs. ’000 Rs. ’000 Rs. ’000 Rs. ’000 Rs. ’000 Rs. ’000 Rs. ’000 Rs. ’000 Rs. ’000 Rs. ’000 Rs. ’000 Rs. ’000
Lanka Venture PLC 3,033 3,200 – – – – 3,033 3,200 – – – –
(100,000 Ordinary Shares) (@ Rs. 32.00) – – (@ Rs. 32.00) – –
(2011 - Nil)
COCO Lanka PLC 15 15 – – – – 15 15 – – – –
(500 Non-Voting Ordinary Shares) (@ Rs. 29.50) – – (@ Rs. 29.50) – –
(2011 - Nil)
Renuka Holdings PLC 2,477 2,450 – – – – 2,477 2,450 – – – –
(100,000 Non-Voting Ordinary Shares) (@ Rs. 24.50) – – (@ Rs. 24.50) – –
(2011 - Nil)
Renuka Holdings PLC 1,770 1,805 – – – – 1,770 1,805 – – – –
(50,000 Ordinary Shares) (@ Rs. 36.10) (@ Rs. 36.10)
(2011 - Nil)
Hemas Power PLC 4,622 4,864 – – – – 4,622 4,864 – – – –
(222,100 Ordinary Shares) (@ Rs. 21.90) (@ Rs. 21.90)
(2011 - Nil)
Hatton National Bank PLC 29,925 30,728 – – – – 29,925 30,728 – – – –
(207,623 Ordinary Shares) (@ Rs. 148.00) (@ Rs. 148.00)
(2011 - Nil)
Property Developments Ltd. 4,693 3,929 – – – – 4,693 3,929 – – – –
(83,235 Ordinary Shares) (@ Rs. 47.20) (@ Rs. 47.20)
(2011 - Nil)
Tokyo Cement Company (Lanka) PLC – – 1,603 1,703 – – – – 1,603 1,703 – –
(2012 - Nil) – (@ Rs. 44.00) – – (@ Rs. 44.00) –
(38,700 Ordinary Shares as at December 31, 2011)
Chevron Lubricants Lanka PLC – – 15,391 15,759 – – – – 15,391 15,759 – –
(2012 - Nil) (@ Rs. 170.00) – (@ Rs. 170.00) –
(92,700 Ordinary Shares as at December 31, 2011)
Hemas Holdings PLC – – – – 3,642 4,072 – – – – 3,642 4,072
(2012 - Nil) – – (@ Rs. 44.50) – – (@ Rs. 44.50)
(2011 - Nil)
Chemical Industries Colombo PLC – – – – 5,102 5,723 – – – – 5,102 5,723
(2012 - Nil) – – (@ Rs. 139.10) – – (@ Rs. 139.10)
(2011 - Nil)
Notes to the Financial Statements

Commercial Bank of Ceylon PLCCommercial Bank of Ceylon PLC
Annual Report 2012Annual Report 2012
This is Commercial BankOperating HighlightsFinancial Highlights
Letter from the ChairmanManaging Director’s Review
Management Discussion and AnalysisStewardship
Financial ReportsAnnexes
359
GROUP BANK
As at December 31, 2012 As at December 31, 2011 As at January 1, 2011 As at December 31, 2012 As at December 31, 2011 As at January 1, 2011
Cost Market Value Cost Market Value Cost Market Value Cost Market Value Cost Market Value Cost Market Value
Rs. ’000 Rs. ’000 Rs. ’000 Rs. ’000 Rs. ’000 Rs. ’000 Rs. ’000 Rs. ’000 Rs. ’000 Rs. ’000 Rs. ’000 Rs. ’000
Lanka Venture PLC 3,033 3,200 – – – – 3,033 3,200 – – – –
(100,000 Ordinary Shares) (@ Rs. 32.00) – – (@ Rs. 32.00) – –
(2011 - Nil)
COCO Lanka PLC 15 15 – – – – 15 15 – – – –
(500 Non-Voting Ordinary Shares) (@ Rs. 29.50) – – (@ Rs. 29.50) – –
(2011 - Nil)
Renuka Holdings PLC 2,477 2,450 – – – – 2,477 2,450 – – – –
(100,000 Non-Voting Ordinary Shares) (@ Rs. 24.50) – – (@ Rs. 24.50) – –
(2011 - Nil)
Renuka Holdings PLC 1,770 1,805 – – – – 1,770 1,805 – – – –
(50,000 Ordinary Shares) (@ Rs. 36.10) (@ Rs. 36.10)
(2011 - Nil)
Hemas Power PLC 4,622 4,864 – – – – 4,622 4,864 – – – –
(222,100 Ordinary Shares) (@ Rs. 21.90) (@ Rs. 21.90)
(2011 - Nil)
Hatton National Bank PLC 29,925 30,728 – – – – 29,925 30,728 – – – –
(207,623 Ordinary Shares) (@ Rs. 148.00) (@ Rs. 148.00)
(2011 - Nil)
Property Developments Ltd. 4,693 3,929 – – – – 4,693 3,929 – – – –
(83,235 Ordinary Shares) (@ Rs. 47.20) (@ Rs. 47.20)
(2011 - Nil)
Tokyo Cement Company (Lanka) PLC – – 1,603 1,703 – – – – 1,603 1,703 – –
(2012 - Nil) – (@ Rs. 44.00) – – (@ Rs. 44.00) –
(38,700 Ordinary Shares as at December 31, 2011)
Chevron Lubricants Lanka PLC – – 15,391 15,759 – – – – 15,391 15,759 – –
(2012 - Nil) (@ Rs. 170.00) – (@ Rs. 170.00) –
(92,700 Ordinary Shares as at December 31, 2011)
Hemas Holdings PLC – – – – 3,642 4,072 – – – – 3,642 4,072
(2012 - Nil) – – (@ Rs. 44.50) – – (@ Rs. 44.50)
(2011 - Nil)
Chemical Industries Colombo PLC – – – – 5,102 5,723 – – – – 5,102 5,723
(2012 - Nil) – – (@ Rs. 139.10) – – (@ Rs. 139.10)
(2011 - Nil)
Notes to the Financial Statements

Commercial Bank of Ceylon PLCCommercial Bank of Ceylon PLC
Annual Report 2012Annual Report 2012
This is Commercial BankOperating HighlightsFinancial Highlights
Letter from the ChairmanManaging Director’s ReviewManagement Discussion and AnalysisStewardshipFinancial ReportsAnnexes
360
GROUP BANK
As at December 31, 2012 As at December 31, 2011 As at January 1, 2011 As at December 31, 2012 As at December 31, 2011 As at January 1, 2011
Cost Market Value Cost Market Value Cost Market Value Cost Market Value Cost Market Value Cost Market Value
Rs. ’000 Rs. ’000 Rs. ’000 Rs. ’000 Rs. ’000 Rs. ’000 Rs. ’000 Rs. ’000 Rs. ’000 Rs. ’000 Rs. ’000 Rs. ’000
Ceylinco Insurance PLC – – – – 9,169 11,367 – – – – 9,169 11,367
(2012 - Nil) – – (@ Rs. 270.00) – – (@ Rs. 270.00)
(2011 - Nil)
Citizen Development Bank PLC – – – – 1,051 1,048 – – – – 1,051 1,048
(2012 - Nil) – – (@ Rs. 52.40) – – (@ Rs. 52.40)
(2011 - Nil)
Sri Lanka Telecom PLC – – – – 13,543 13,757 – – – – 13,543 13,757
(2012 - Nil) – – (@ Rs. 48.00) – – (@ Rs. 48.00)
(2011 - Nil)
Laugfs Gas PLC – – – – 750 935 – – – – 750 935
(2012 - Nil) – – (@ Rs. 18.70) – – (@ Rs. 18.70)
(2011 - Nil)
Sub total 330,984 322,879 248,671 224,618 166,451 184,791 330,984 322,879 248,671 224,618 166,451 184,791
Mark to market gain/(loss) (8,105) (24,053) 18,340 (8,105) (24,053) 18,340
Total 322,879 224,618 184,791 322,879 224,618 184,791
24.3 Equity Shares - Composition
Issued byBanks 58,769 60,410 51,592 43,234 1,051 1,048 58,769 60,410 51,592 43,234 1,051 1,048
Corporate entities 272,215 262,469 197,079 181,384 165,400 183,743 272,215 262,469 197,079 181,384 165,400 183,743
Sub total 330,984 322,879 248,671 224,618 166,451 184,791 330,984 322,879 248,671 224,618 166,451 184,791
Notes to the Financial Statements

Commercial Bank of Ceylon PLCCommercial Bank of Ceylon PLC
Annual Report 2012Annual Report 2012
This is Commercial BankOperating HighlightsFinancial Highlights
Letter from the ChairmanManaging Director’s Review
Management Discussion and AnalysisStewardship
Financial ReportsAnnexes
361
GROUP BANK
As at December 31, 2012 As at December 31, 2011 As at January 1, 2011 As at December 31, 2012 As at December 31, 2011 As at January 1, 2011
Cost Market Value Cost Market Value Cost Market Value Cost Market Value Cost Market Value Cost Market Value
Rs. ’000 Rs. ’000 Rs. ’000 Rs. ’000 Rs. ’000 Rs. ’000 Rs. ’000 Rs. ’000 Rs. ’000 Rs. ’000 Rs. ’000 Rs. ’000
Ceylinco Insurance PLC – – – – 9,169 11,367 – – – – 9,169 11,367
(2012 - Nil) – – (@ Rs. 270.00) – – (@ Rs. 270.00)
(2011 - Nil)
Citizen Development Bank PLC – – – – 1,051 1,048 – – – – 1,051 1,048
(2012 - Nil) – – (@ Rs. 52.40) – – (@ Rs. 52.40)
(2011 - Nil)
Sri Lanka Telecom PLC – – – – 13,543 13,757 – – – – 13,543 13,757
(2012 - Nil) – – (@ Rs. 48.00) – – (@ Rs. 48.00)
(2011 - Nil)
Laugfs Gas PLC – – – – 750 935 – – – – 750 935
(2012 - Nil) – – (@ Rs. 18.70) – – (@ Rs. 18.70)
(2011 - Nil)
Sub total 330,984 322,879 248,671 224,618 166,451 184,791 330,984 322,879 248,671 224,618 166,451 184,791
Mark to market gain/(loss) (8,105) (24,053) 18,340 (8,105) (24,053) 18,340
Total 322,879 224,618 184,791 322,879 224,618 184,791
24.3 Equity Shares - Composition
Issued byBanks 58,769 60,410 51,592 43,234 1,051 1,048 58,769 60,410 51,592 43,234 1,051 1,048
Corporate entities 272,215 262,469 197,079 181,384 165,400 183,743 272,215 262,469 197,079 181,384 165,400 183,743
Sub total 330,984 322,879 248,671 224,618 166,451 184,791 330,984 322,879 248,671 224,618 166,451 184,791
Notes to the Financial Statements

Commercial Bank of Ceylon PLCCommercial Bank of Ceylon PLC
Annual Report 2012Annual Report 2012
This is Commercial BankOperating HighlightsFinancial Highlights
Letter from the ChairmanManaging Director’s ReviewManagement Discussion and AnalysisStewardshipFinancial ReportsAnnexes
362
25. Loans and Receivables to Banks
GROUP BANK
2012 2011 January 1, 2011 2012 2011 January 1, 2011Rs. ’000 Rs. ’000 Rs. ’000 Rs. ’000 Rs. ’000 Rs. ’000
Loans and receivables to banks
Gross loans and receivables 628,760 580,158 568,704 628,760 580,158 568,704
Less: Allowance for Individual impairment [Refer 25.2] – – – – – –
Net loans and receivables 628,760 580,158 568,704 628,760 580,158 568,704
25.1 Analysis 25.1 (a) By productLoans and advances
Overdrafts – – – – – –
Short-term loans – – – – – –
Long-term loans – – – – – –
Reverse repo agreements – – – – – –
Others
Sri Lanka Government Securities – – – – – –
Investments [Refer Note 25.3] 95,000 104,778 105,000 95,000 104,778 105,000
Others (*) 533,760 475,380 463,704 533,760 475,380 463,704
Gross total 628,760 580,158 568,704 628,760 580,158 568,704
( * ) The Bank did not make payments to counter party banks for the oil hedging transactions with effect from June 2, 2009 in response to a Directive received from the Exchange Controller of the Central Bank of Sri Lanka. Consequently, one of the counter party bank appropriated USD 4.172 Mn. (Rs. 533.760 Mn.) which was kept as a deposit with them. This action has been contested by the Bank. In view of the stance taken by the Bank in this regard, both the deposit and the amount due to the said counter party bank were recorded in the Statement of Financial Position.
GROUP BANK
2012 2011 January 1, 2011 2012 2011 January 1, 2011Rs. ’000 Rs. ’000 Rs. ’000 Rs. ’000 Rs. ’000 Rs. ’000
25.1 (b) By currency
Sri Lankan Rupee 95,000 104,778 105,000 95,000 104,778 105,000
United States Dollar 533,760 475,380 463,704 533,760 475,380 463,704
Great Britain Pounds – – – – – –
Bangladesh Taka – – – – – –
Others – – – – – –
Gross total 628,760 580,158 568,704 628,760 580,158 568,704
25.2 Movement in Allowance for Individual Impairment Opening balance – – – – – –
Charge/(Write back) to the Income Statement – – – – – –
Write-off during the year – – – – – –
Other movements – – – – – –
Closing balance – – – – – –
Notes to the Financial Statements

Commercial Bank of Ceylon PLCCommercial Bank of Ceylon PLC
Annual Report 2012Annual Report 2012
This is Commercial BankOperating HighlightsFinancial Highlights
Letter from the ChairmanManaging Director’s Review
Management Discussion and AnalysisStewardship
Financial ReportsAnnexes
363
25.3 Investments GROUP BANK
As at December 31, 2012 As at December 31, 2011 As at January 1, 2011 As at December 31, 2012 As at December 31, 2011 As at January 1, 2011
Cost Market Value Cost Market Value Cost Market Value Cost Market Value Cost Market Value Cost Market Value
Rs. ’000 Rs. ’000 Rs. ’000 Rs. ’000 Rs. ’000 Rs. ’000 Rs. ’000 Rs. ’000 Rs. ’000 Rs. ’000 Rs. ’000 Rs. ’000
Nations Trust Bank PLC (20.53% - 2013)
(95,000 Debentures of Rs. 1,000.00 each) 95,000 95,000 104,778 104,778 95,000 95,000 95,000 95,000 104,778 104,778 95,000 95,000
(95,000 Debentures of Rs. 1,000.00 each as at December 31, 2011) (@ Rs. 1,000.00) (@ Rs. 1,000.00) (@ Rs. 1,000.00) (@ Rs. 1,000.00) (@ Rs. 1,000.00) (@ Rs. 1,000.00)
DFCC Bank PLC (Floating rate - 2011) – – – – 10,000 10,000 – – – – 10,000 10,000
(2012 - Nil) – – (@ Rs. 1,000.00) – – (@ Rs. 1,000.00)
(2011 - Nil)
Total 95,000 95,000 104,778 104,778 105,000 105,000 95,000 95,000 104,778 104,778 105,000 105,000
26. Loans and Receivables to Other Customers
GROUP BANK
2012 2011 January 1, 2011 2012 2011 January 1, 2011Rs. ’000 Rs. ’000 Rs. ’000 Rs. ’000 Rs. ’000 Rs. ’000
Gross loans and receivables [Refer Note 26.1] 386,358,564 325,927,890 259,656,153 386,416,308 326,086,859 259,879,053
Less: Allowance for individual impairment [Refer 26.2] 3,402,168 3,363,859 2,231,520 3,402,168 3,363,859 2,231,520
Allowance for collective impairment [Refer 26.2] 10,099,059 8,237,033 9,114,586 10,099,059 8,237,033 9,114,586
Net loans and receivables 372,857,337 314,326,998 248,310,047 372,915,081 314,485,967 248,532,947
26.1 Analysis 26.1 (a) By productLoans and advances
Overdrafts 69,476,949 60,306,298 48,879,783 69,477,242 60,309,228 48,879,783
Trade finance 39,006,056 35,666,637 33,290,177 39,006,056 35,666,637 33,290,177
Lease receivable ( * ) 25,188,248 21,511,965 11,684,434 25,245,649 21,668,460 11,906,631
Credit cards 2,779,375 2,186,796 1,657,829 2,779,375 2,186,796 1,657,829
Pawning 10,947,448 11,700,829 2,152,821 10,947,448 11,700,829 2,152,821
Staff loans 3,175,953 2,845,463 2,740,105 3,175,953 2,844,982 2,739,440
Housing loans 25,466,504 22,549,457 18,098,050 25,466,504 22,549,457 18,098,050
Personal loans 18,016,009 20,558,927 17,432,072 18,016,009 20,558,927 17,432,072
Term loans Short-term 29,144,209 19,007,256 18,043,680 29,144,259 19,007,281 18,045,047
Long-term 111,155,039 84,113,158 68,708,463 111,155,039 84,113,158 68,708,463
Bills of Exchange 5,685,865 7,652,428 5,396,602 5,685,865 7,652,428 5,396,602
Securities purchased under resale agreements 3,697,682 1,544,693 12,954 3,697,682 1,544,693 12,954
Sub total of gross loans and advances 343,739,337 289,643,907 228,096,970 343,797,081 289,802,876 228,319,869
OthersGovernment securities 39,283,936 32,546,230 29,188,343 39,283,936 32,546,230 29,188,344
Investments 3,335,291 3,737,753 2,370,840 3,335,291 3,737,753 2,370,840
Sub total 42,619,227 36,283,983 31,559,183 42,619,227 36,283,983 31,559,184
Total of gross loans and receivables 386,358,564 325,927,890 259,656,153 386,416,308 326,086,859 259,879,053
* The product wise analysis was based on the criteria used for the purpose of impairment computation. Therefore, the lease rentals receivable amount classified based on the impairment criterion.
Notes to the Financial Statements

Commercial Bank of Ceylon PLCCommercial Bank of Ceylon PLC
Annual Report 2012Annual Report 2012
This is Commercial BankOperating HighlightsFinancial Highlights
Letter from the ChairmanManaging Director’s ReviewManagement Discussion and AnalysisStewardshipFinancial ReportsAnnexes
364
GROUP BANK
2012 2011 January 1, 2011 2012 2011 January 1, 2011Rs. ’000 Rs. ’000 Rs. ’000 Rs. ’000 Rs. ’000 Rs. ’000
26.1 (b) By currency
Sri Lanka rupee 285,107,232 247,572,721 188,065,971 285,164,976 247,731,690 188,288,871
United States dollar 69,930,980 57,379,038 51,548,023 69,930,980 57,379,038 51,548,023
Great Britain pound 525,914 382,953 117,338 525,914 382,953 117,338
Euro currency 867,484 1,113,916 312,724 867,484 1,113,916 312,724
Australian dollar 105,795 72,611 57,674 105,795 72,611 57,674
Japanese yen 12,111 212,508 65,225 12,111 212,508 65,225
Singapore dollars 715 59,541 107,095 715 59,541 107,095
Bangladesh taka 29,779,782 19,128,919 19,369,292 29,779,782 19,128,919 19,369,292
Others 28,551 5,683 12,811 28,551 5,683 12,811
Gross total 386,358,564 325,927,890 259,656,153 386,416,308 326,086,859 259,879,053
26.1 (c) By Industry ( * )
Agriculture and fishing 37,799,861 33,103,202 26,174,187 37,799,861 33,103,202 26,174,187
Manufacturing 43,557,515 42,411,190 35,272,857 43,557,515 42,411,190 35,272,857
Tourism 12,203,840 10,919,354 7,727,796 12,203,840 10,919,354 7,727,796
Transport 5,665,451 4,754,633 2,678,048 5,665,451 4,754,633 2,678,048
Construction 29,425,050 26,598,500 19,448,857 29,425,050 26,598,500 19,448,857
Traders 49,426,885 31,053,542 20,175,744 49,426,885 31,053,542 20,175,744
New economy 5,456,003 4,475,863 2,947,975 5,456,003 4,475,863 2,947,975
Financial and Business Services 15,112,163 13,410,350 10,118,060 15,112,163 13,410,350 10,118,060
Infrastructure 6,917,962 2,557,929 1,716,001 6,917,962 2,557,929 1,716,001
Other Services 27,135,490 26,106,613 21,341,692 27,135,490 26,106,613 21,341,692
Other Customers 111,039,177 94,252,731 80,495,753 111,096,861 94,411,700 80,718,652
Gross total 343,739,337 289,643,907 228,096,970 343,797,081 289,802,876 228,319,869
* Industry-wise breakdown is provided only for loans and advances.
Notes to the Financial Statements

Commercial Bank of Ceylon PLCCommercial Bank of Ceylon PLC
Annual Report 2012Annual Report 2012
This is Commercial BankOperating HighlightsFinancial Highlights
Letter from the ChairmanManaging Director’s Review
Management Discussion and AnalysisStewardship
Financial ReportsAnnexes
365
GROUP BANK
2012 2011 January 1, 2011 2012 2011 January 1, 2011Rs. ’000 Rs. ’000 Rs. ’000 Rs. ’000 Rs. ’000 Rs. ’000
26.2 Movement in Allowance for Individual and Collective Impairment during the YearMovement in Allowance for Individual Impairment
Opening balance 3,363,859 2,231,520 – 3,363,859 2,231,520 –
Charge/(write back) to the income statement 1,296,697 2,592,879 3,524,491 1,296,697 2,592,879 3,524,491
Net write-off/(recoveries) during the year (1,491,247) (1,351,607) (1,278,953) (1,491,247) (1,351,607) (1,278,953)
Exchange rate variance on foreign currency provisions 14,807 1,853 (14,018) 14,807 1,853 (14,018)
Interest accrued on impaired loans and advances (249,760) (285,139) – (249,760) (285,139) –
Other movements 467,812 174,353 – 467,812 174,353 –
Closing balance 3,402,168 3,363,859 2,231,520 3,402,168 3,363,859 2,231,520
Movement in Allowance for Collective Impairment
Opening balance 8,237,033 9,114,586 – 8,237,033 9,114,586 –
Charge/(write back) to the income statement 1,856,688 (869,609) 9,122,689 1,856,688 (869,609) 9,122,689
Exchange rate variance on foreign currency provisions 5,338 (7,944) (8,103) 5,338 (7,944) (8,103)
Closing balance 10,099,059 8,237,033 9,114,586 10,099,059 8,237,033 9,114,586
Total of individual and collective impairment 13,501,227 11,600,892 11,346,106 13,501,227 11,600,892 11,346,106
26.3 Lease Rentals Receivable
26.3 (a) Lease Rentals Receivable within One YearTotal lease rentals receivable within one year 11,658,721 9,228,926 5,905,473 11,692,130 9,315,662 6,005,734
Less: Unearned lease income 3,315,301 2,761,696 1,714,562 3,315,301 2,787,726 1,754,275
Provision for individual impairment 16,366 10,194 6,346 16,366 10,194 6,346
Provision for collective impairment 192,440 106,201 70,004 192,440 106,201 70,004
Sub total 8,134,614 6,350,835 4,114,561 8,168,023 6,411,541 4,175,109
26.3 (b) Lease Rentals Receivable from One to Five YearsTotal lease rentals receivable from one to five years 20,005,414 17,427,346 8,781,282 20,029,406 17,539,828 8,987,022
Less: Unearned lease income 3,305,888 2,516,142 1,417,705 3,305,888 2,532,835 1,461,797
Provision for individual impairment 33,735 24,137 11,528 33,735 24,137 11,528
Provision for collective impairment 396,667 251,449 127,160 396,667 251,449 127,160
Sub total 16,269,124 14,635,618 7,224,889 16,293,116 14,731,407 7,386,537
Notes to the Financial Statements

Commercial Bank of Ceylon PLCCommercial Bank of Ceylon PLC
Annual Report 2012Annual Report 2012
This is Commercial BankOperating HighlightsFinancial Highlights
Letter from the ChairmanManaging Director’s ReviewManagement Discussion and AnalysisStewardshipFinancial ReportsAnnexes
366
GROUP BANK
2012 2011 January 1, 2011 2012 2011 January 1, 2011Rs. ’000 Rs. ’000 Rs. ’000 Rs. ’000 Rs. ’000 Rs. ’000
26.3 (c) Lease Rentals Receivable after Five Years
Total lease rentals receivable after five years 209 4,186 2,211 209 4,186 2,211
Less: Unearned lease income 6 130 114 6 130 114
Provision for individual impairment – 7 3 – 7 3
Provision for collective impairment 5 68 35 5 68 35
Sub total 198 3,981 2,059 198 3,981 2,059
Total gross lease receivable 25,043,149 21,382,490 11,556,585 25,100,550 21,538,985 11,778,781
Total net lease receivable 24,403,936 20,990,434 11,341,509 24,461,337 21,146,929 11,563,705
26.3 (d) Movement in Allowance for Individual Impairment on Lease Rentals Receivable
Opening balance 34,337 17,877 – 34,337 17,877 –
Charge/(write back) to the income statement 74,471 214,385 310,276 74,471 214,385 310,276
Net write-off/(recoveries) during the year (58,114) (171,038) (292,399) (58,114) (171,038) (292,399)
Exchange rate variance on foreign currency provisions – – – – – –
Interest accrued on impaired loans and advances (1,270) (27,615) – (1,270) (27,615) –
Other movements 676 728 – 676 728 –
Closing balance 50,100 34,337 17,877 50,100 34,337 17,877
26.3 (e) Movement in the Allowance for Collective Impairment on Lease Rentals Receivable
Opening balance 357,719 197,201 – 357,719 197,201 –
Charge/(write back) to the Income Statement 231,394 160,518 197,201 231,394 160,518 197,201
Exchange rate variance on foreign currency provisions – – – – – –
Other movements – – – – – –
Closing balance 589,113 357,719 197,201 589,113 357,719 197,201
Total of Individual and Collective impairment on Lease Rental Receivable 639,213 392,056 215,078 639,213 392,056 215,078
26.4 Summary of Gross Loans and Receivables to Other Customers 26.4 (a) Gross Loans and Receivables to Other Customers
Bill of Exchange 5,685,865 7,652,428 5,396,602 5,685,865 7,652,428 5,396,602
Loans and advances 309,167,542 258,934,821 211,002,980 309,167,885 258,937,295 211,003,682
Lease receivable 25,188,248 21,511,965 11,684,434 25,245,649 21,668,460 11,906,631
Securities purchased under resale agreements 3,697,682 1,544,693 12,954 3,697,682 1,544,693 12,954
Total gross loans and advances 343,739,337 289,643,907 228,096,970 343,797,081 289,802,876 228,319,869
Notes to the Financial Statements

Commercial Bank of Ceylon PLCCommercial Bank of Ceylon PLC
Annual Report 2012Annual Report 2012
This is Commercial BankOperating HighlightsFinancial Highlights
Letter from the ChairmanManaging Director’s Review
Management Discussion and AnalysisStewardship
Financial ReportsAnnexes
367
GROUP BANK
2012 2011 January 1, 2011 2012 2011 January 1, 2011Rs. ’000 Rs. ’000 Rs. ’000 Rs. ’000 Rs. ’000 Rs. ’000
26.4 (b) Gross Other Receivables
Government Securities [Refer Note 26.5] 39,283,936 32,546,230 29,188,343 39,283,936 32,546,230 29,188,343
Investments [Refer Note 26.6] 3,335,291 3,737,753 2,370,840 3,335,291 3,737,753 2,370,840
Total gross other receivables 42,619,227 36,283,983 31,559,183 42,619,227 36,283,983 31,559,183
Total gross loans and receivables to other customers 386,358,564 325,927,890 259,656,153 386,416,308 326,086,859 259,879,053
26.5 Investment in Government SecuritiesInvestments in Government Securities - Sri LankaTreasury bills 17,000 82,960 55,499 17,000 82,960 55,499
Treasury bonds 605,859 605,827 605,859 605,859 605,827 605,859
Sri Lanka development bond 33,694,269 27,345,345 26,177,448 33,694,269 27,345,345 26,177,448
Sub Total 34,317,128 28,034,132 26,838,806 34,317,128 28,034,132 26,838,806
Investments in Government Securities - BangladeshTreasury bills and bonds 4,966,808 4,512,098 2,349,537 4,966,808 4,512,098 2,349,537
Sub Total 4,966,808 4,512,098 2,349,537 4,966,808 4,512,098 2,349,537
Total of Investment in Government Securities 39,283,936 32,546,230 29,188,343 39,283,936 32,546,230 29,188,343
26.6 Investments
Debentures [Refer Note 26.6 (a)] 447,296 447,296 447,847 447,296 447,296 447,847
Investments in preference shares [Refer Note 26.6 (b)] – 298,998 597,514 – 298,998 597,514
Lease backed securities [Refer Note 26.6 (c)] 106,477 333,927 471,760 106,477 333,927 471,760
Trust certificates [Refer Note 26.6 (d)] 2,137,534 2,537,245 696,317 2,137,534 2,537,245 696,317
Corporate debts [Refer Note 26.6 (e)] 539,831 – – 539,831 – –
Corporate bonds in Bangladesh [Refer Note 26.6 (f)] 104,153 120,287 157,402 104,153 120,287 157,402
Total investment 3,335,291 3,737,753 2,370,840 3,335,291 3,737,753 2,370,840
Notes to the Financial Statements

Commercial Bank of Ceylon PLCCommercial Bank of Ceylon PLC
Annual Report 2012Annual Report 2012
This is Commercial BankOperating HighlightsFinancial Highlights
Letter from the ChairmanManaging Director’s ReviewManagement Discussion and AnalysisStewardshipFinancial ReportsAnnexes
368
GROUP BANK
As at December 31, 2012 As at December 31, 2011 As at January 1, 2011 As at December 31, 2012 As at December 31, 2011 As at January 1, 2011
Cost Market Value Cost Market Value Cost Market Value Cost Market Value Cost Market Value Cost Market ValueRs. ’000 Rs. ’000 Rs. ’000 Rs. ’000 Rs. ’000 Rs. ’000 Rs. ’000 Rs. ’000 Rs. ’000 Rs. ’000 Rs. ’000 Rs. ’000
26.6 (a) DebenturesUrban Development Authority 102,652 92,687 102,652 96,649 103,203 98,600 102,652 92,687 102,652 96,649 103,203 98,600
(1,000,000 Debentures) (@ Rs. 92.68) (@ Rs. 96.64) (@ Rs. 98.60) (@ Rs. 92.68) (@ Rs. 96.64) (@ Rs. 98.60)
(1,000,000 Debentures as at December 31, 2011)
Urban Development Authority (11% - 2015) 344,644 335,740 344,644 335,740 344,644 335,740 344,644 335,740 344,644 335,740 344,644 335,740
(3,357,400 Debentures of Rs. 100.00 each) (@ Rs. 100.00) (@ Rs. 100.00) (@ Rs. 100.00) (@ Rs. 100.00) (@ Rs. 100.00) (@ Rs. 100.00)
(3,357,400 Debentures of Rs. 100.00 each as at December 31, 2011)
Sub total 447,296 428,427 447,296 432,389 447,847 434,340 447,296 428,427 447,296 432,389 447,847 434,340
26.6 (b) Investments in Preference Shares Dialog Telekom PLC – – 298,998 292,500 597,514 585,000 – – 298,998 292,500 597,514 585,000
(2012 - Nil) (@ Rs. 1.00) (@ Rs. 1.00) (@ Rs. 1.00) (@ Rs. 1.00)
(585,500,000 Preference Shares as at December 31, 2011)
Sub total – – 298,998 292,500 597,514 585,000 – – 298,998 292,500 597,514 585,000
26.6 (c) Lease backed securitiesPeople’s Leasing Company PLC 106,477 106,477 333,927 280,700 471,760 448,100 106,477 106,477 333,927 280,700 471,760 448,100
Sub total 106,477 106,477 333,927 280,700 471,760 448,100 106,477 106,477 333,927 280,700 471,760 448,100
26.6 (d) Trust CertificatesPeople’s Leasing Company PLC 1,297,269 1,297,269 1,334,506 1,256,400 255,159 250,000 1,297,269 1,297,269 1,334,506 1,256,400 255,159 250,000
LB Finance PLC 573,835 573,835 678,510 615,300 441,158 428,700 573,835 573,835 678,510 615,300 441,158 428,700
Softlogic Finance PLC 184,879 184,879 213,937 199,400 – – 184,879 184,879 213,937 199,400 – –
Central Finance PLC 81,551 81,551 310,292 292,200 – – 81,551 81,551 310,292 292,200 – –
Sub total 2,137,534 2,137,534 2,537,245 2,363,300 696,317 678,700 2,137,534 2,137,534 2,537,245 2,363,300 696,317 678,700
26.6 (e) Corporate DebtsSinger Sri Lanka PLC - 2012/2013 539,831 539,831 – – – – 539,831 539,831 – – – –
Sub total 539,831 539,831 – – – – 539,831 539,831 – – – –
26.6 (f) Bonds in BangladeshCorporate Bonds in Bangladesh 104,153 104,153 120,287 112,589 157,402 157,402 104,153 104,153 120,287 112,589 157,402 157,402
Sub total 104,153 104,153 120,287 112,589 157,402 157,402 104,153 104,153 120,287 112,589 157,402 157,402
Notes to the Financial Statements

Commercial Bank of Ceylon PLCCommercial Bank of Ceylon PLC
Annual Report 2012Annual Report 2012
This is Commercial BankOperating HighlightsFinancial Highlights
Letter from the ChairmanManaging Director’s Review
Management Discussion and AnalysisStewardship
Financial ReportsAnnexes
369
GROUP BANK
As at December 31, 2012 As at December 31, 2011 As at January 1, 2011 As at December 31, 2012 As at December 31, 2011 As at January 1, 2011
Cost Market Value Cost Market Value Cost Market Value Cost Market Value Cost Market Value Cost Market ValueRs. ’000 Rs. ’000 Rs. ’000 Rs. ’000 Rs. ’000 Rs. ’000 Rs. ’000 Rs. ’000 Rs. ’000 Rs. ’000 Rs. ’000 Rs. ’000
26.6 (a) DebenturesUrban Development Authority 102,652 92,687 102,652 96,649 103,203 98,600 102,652 92,687 102,652 96,649 103,203 98,600
(1,000,000 Debentures) (@ Rs. 92.68) (@ Rs. 96.64) (@ Rs. 98.60) (@ Rs. 92.68) (@ Rs. 96.64) (@ Rs. 98.60)
(1,000,000 Debentures as at December 31, 2011)
Urban Development Authority (11% - 2015) 344,644 335,740 344,644 335,740 344,644 335,740 344,644 335,740 344,644 335,740 344,644 335,740
(3,357,400 Debentures of Rs. 100.00 each) (@ Rs. 100.00) (@ Rs. 100.00) (@ Rs. 100.00) (@ Rs. 100.00) (@ Rs. 100.00) (@ Rs. 100.00)
(3,357,400 Debentures of Rs. 100.00 each as at December 31, 2011)
Sub total 447,296 428,427 447,296 432,389 447,847 434,340 447,296 428,427 447,296 432,389 447,847 434,340
26.6 (b) Investments in Preference Shares Dialog Telekom PLC – – 298,998 292,500 597,514 585,000 – – 298,998 292,500 597,514 585,000
(2012 - Nil) (@ Rs. 1.00) (@ Rs. 1.00) (@ Rs. 1.00) (@ Rs. 1.00)
(585,500,000 Preference Shares as at December 31, 2011)
Sub total – – 298,998 292,500 597,514 585,000 – – 298,998 292,500 597,514 585,000
26.6 (c) Lease backed securitiesPeople’s Leasing Company PLC 106,477 106,477 333,927 280,700 471,760 448,100 106,477 106,477 333,927 280,700 471,760 448,100
Sub total 106,477 106,477 333,927 280,700 471,760 448,100 106,477 106,477 333,927 280,700 471,760 448,100
26.6 (d) Trust CertificatesPeople’s Leasing Company PLC 1,297,269 1,297,269 1,334,506 1,256,400 255,159 250,000 1,297,269 1,297,269 1,334,506 1,256,400 255,159 250,000
LB Finance PLC 573,835 573,835 678,510 615,300 441,158 428,700 573,835 573,835 678,510 615,300 441,158 428,700
Softlogic Finance PLC 184,879 184,879 213,937 199,400 – – 184,879 184,879 213,937 199,400 – –
Central Finance PLC 81,551 81,551 310,292 292,200 – – 81,551 81,551 310,292 292,200 – –
Sub total 2,137,534 2,137,534 2,537,245 2,363,300 696,317 678,700 2,137,534 2,137,534 2,537,245 2,363,300 696,317 678,700
26.6 (e) Corporate DebtsSinger Sri Lanka PLC - 2012/2013 539,831 539,831 – – – – 539,831 539,831 – – – –
Sub total 539,831 539,831 – – – – 539,831 539,831 – – – –
26.6 (f) Bonds in BangladeshCorporate Bonds in Bangladesh 104,153 104,153 120,287 112,589 157,402 157,402 104,153 104,153 120,287 112,589 157,402 157,402
Sub total 104,153 104,153 120,287 112,589 157,402 157,402 104,153 104,153 120,287 112,589 157,402 157,402
Notes to the Financial Statements
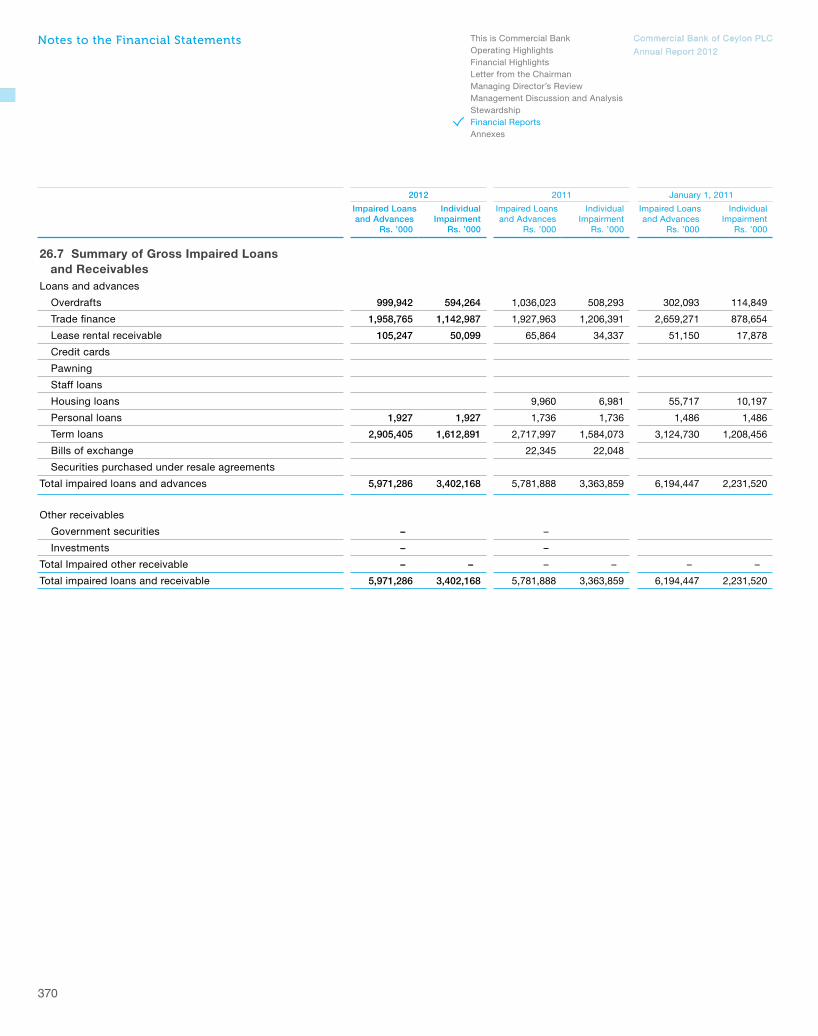
Commercial Bank of Ceylon PLCCommercial Bank of Ceylon PLC
Annual Report 2012Annual Report 2012
This is Commercial BankOperating HighlightsFinancial Highlights
Letter from the ChairmanManaging Director’s ReviewManagement Discussion and AnalysisStewardshipFinancial ReportsAnnexes
370
2012 2011 January 1, 2011
Impaired Loans and Advances
Rs. ’000
Individual Impairment
Rs. ’000
Impaired Loans and Advances
Rs. ’000
Individual Impairment
Rs. ’000
Impaired Loans and Advances
Rs. ’000
Individual Impairment
Rs. ’000
26.7 Summary of Gross Impaired Loans and ReceivablesLoans and advances
Overdrafts 999,942 594,264 1,036,023 508,293 302,093 114,849
Trade finance 1,958,765 1,142,987 1,927,963 1,206,391 2,659,271 878,654
Lease rental receivable 105,247 50,099 65,864 34,337 51,150 17,878
Credit cards
Pawning
Staff loans
Housing loans 9,960 6,981 55,717 10,197
Personal loans 1,927 1,927 1,736 1,736 1,486 1,486
Term loans 2,905,405 1,612,891 2,717,997 1,584,073 3,124,730 1,208,456
Bills of exchange 22,345 22,048
Securities purchased under resale agreements
Total impaired loans and advances 5,971,286 3,402,168 5,781,888 3,363,859 6,194,447 2,231,520
Other receivables
Government securities – –
Investments – –
Total Impaired other receivable – – – – – –
Total impaired loans and receivable 5,971,286 3,402,168 5,781,888 3,363,859 6,194,447 2,231,520
Notes to the Financial Statements

Commercial Bank of Ceylon PLCCommercial Bank of Ceylon PLC
Annual Report 2012Annual Report 2012
This is Commercial BankOperating HighlightsFinancial Highlights
Letter from the ChairmanManaging Director’s Review
Management Discussion and AnalysisStewardship
Financial ReportsAnnexes
371
27. Financial Investments - Available-for-Sale
GROUP BANK
2012 2011 January 1, 2011 2012 2011 January 1, 2011Rs. ’000 Rs. ’000 Rs. ’000 Rs. ’000 Rs. ’000 Rs. ’000
Government securities [Refer Note 27.1] 57,923,776 61,385,225 76,293,937 57,923,776 61,385,225 76,293,937
Equity securities [Refer Note 27.2] 39,416 30,170 60,717 39,416 30,170 60,717
Quoted shares - (Marked to market value) 3,737 3,723 5,866 3,737 3,723 5,866
Unquoted shares 35,679 26,447 54,851 35,679 26,447 54,851
Total 57,963,192 61,415,395 76,354,654 57,963,192 61,415,395 76,354,654
27.1 Government Securities
Treasury Bills 29,872,941 45,903,707 61,805,599 29,872,941 45,903,707 61,805,599
Treasury Bonds 28,050,835 14,303,785 13,274,086 28,050,835 14,303,785 13,274,086
Sri Lanka Sovereign Bonds – 1,177,733 1,214,252 – 1,177,733 1,214,252
Total 57,923,776 61,385,225 76,293,937 57,923,776 61,385,225 76,293,937
Notes to the Financial Statements
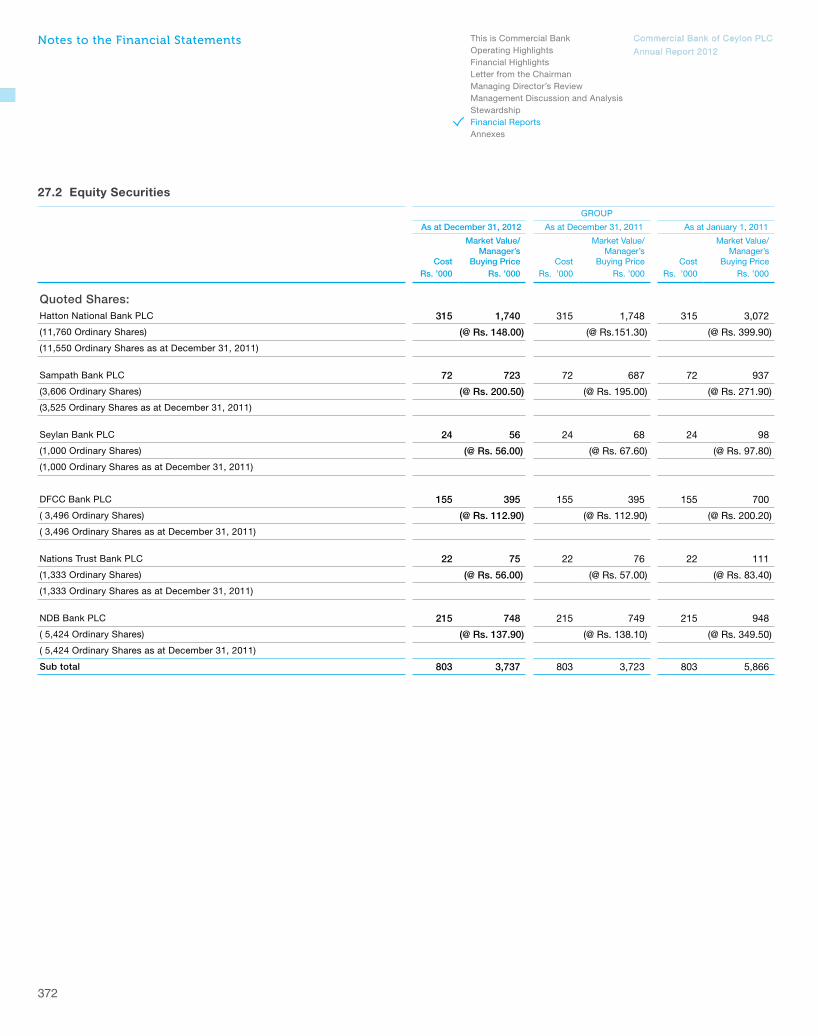
Commercial Bank of Ceylon PLCCommercial Bank of Ceylon PLC
Annual Report 2012Annual Report 2012
This is Commercial BankOperating HighlightsFinancial Highlights
Letter from the ChairmanManaging Director’s ReviewManagement Discussion and AnalysisStewardshipFinancial ReportsAnnexes
372
27.2 Equity Securities
GROUP BANK
As at December 31, 2012 As at December 31, 2011 As at January 1, 2011 As at December 31, 2012 As at December 31, 2011 As at January 1, 2011
Cost
Market Value/Manager’s
Buying Price Cost
Market Value/Manager’s
Buying Price Cost
Market Value/Manager’s
Buying Price Cost
Market Value/Manager’s
Buying Price Cost
Market Value/Manager’s
Buying Price Cost
Market Value/Manager’s
Buying PriceRs. ’000 Rs. ’000 Rs. ’000 Rs. ’000 Rs. ’000 Rs. ’000 Rs. ’000 Rs. ’000 Rs. ’000 Rs. ’000 Rs. ’000 Rs. ’000
Quoted Shares:Hatton National Bank PLC 315 1,740 315 1,748 315 3,072 315 1,740 315 1,748 315 3,072
(11,760 Ordinary Shares) (@ Rs. 148.00) (@ Rs.151.30) (@ Rs. 399.90) (@ Rs. 148.00) (@ Rs. 151.30) (@ Rs. 399.90)
(11,550 Ordinary Shares as at December 31, 2011)
Sampath Bank PLC 72 723 72 687 72 937 72 723 72 687 72 937
(3,606 Ordinary Shares) (@ Rs. 200.50) (@ Rs. 195.00) (@ Rs. 271.90) (@ Rs. 200.50) (@ Rs. 195.00) (@ Rs. 271.90)
(3,525 Ordinary Shares as at December 31, 2011)
Seylan Bank PLC 24 56 24 68 24 98 24 56 24 68 24 98
(1,000 Ordinary Shares) (@ Rs. 56.00) (@ Rs. 67.60) (@ Rs. 97.80) (@ Rs. 56.00) (@ Rs. 67.60) (@ Rs. 97.80)
(1,000 Ordinary Shares as at December 31, 2011)
DFCC Bank PLC 155 395 155 395 155 700 155 395 155 395 155 700
( 3,496 Ordinary Shares) (@ Rs. 112.90) (@ Rs. 112.90) (@ Rs. 200.20) (@ Rs. 112.90) (@ Rs. 112.90) (@ Rs. 200.20)
( 3,496 Ordinary Shares as at December 31, 2011)
Nations Trust Bank PLC 22 75 22 76 22 111 22 75 22 76 22 111
(1,333 Ordinary Shares) (@ Rs. 56.00) (@ Rs. 57.00) (@ Rs. 83.40) (@ Rs. 56.00) (@ Rs. 57.00) (@ Rs. 83.40)
(1,333 Ordinary Shares as at December 31, 2011)
NDB Bank PLC 215 748 215 749 215 948 215 748 215 749 215 948
( 5,424 Ordinary Shares) (@ Rs. 137.90) (@ Rs. 138.10) (@ Rs. 349.50) (@ Rs. 137.90) (@ Rs. 138.10) (@ Rs. 349.50)
( 5,424 Ordinary Shares as at December 31, 2011)
Sub total 803 3,737 803 3,723 803 5,866 803 3,737 803 3,723 803 5,866
Notes to the Financial Statements

Commercial Bank of Ceylon PLCCommercial Bank of Ceylon PLC
Annual Report 2012Annual Report 2012
This is Commercial BankOperating HighlightsFinancial Highlights
Letter from the ChairmanManaging Director’s Review
Management Discussion and AnalysisStewardship
Financial ReportsAnnexes
373
27.2 Equity Securities
GROUP BANK
As at December 31, 2012 As at December 31, 2011 As at January 1, 2011 As at December 31, 2012 As at December 31, 2011 As at January 1, 2011
Cost
Market Value/Manager’s
Buying Price Cost
Market Value/Manager’s
Buying Price Cost
Market Value/Manager’s
Buying Price Cost
Market Value/Manager’s
Buying Price Cost
Market Value/Manager’s
Buying Price Cost
Market Value/Manager’s
Buying PriceRs. ’000 Rs. ’000 Rs. ’000 Rs. ’000 Rs. ’000 Rs. ’000 Rs. ’000 Rs. ’000 Rs. ’000 Rs. ’000 Rs. ’000 Rs. ’000
Quoted Shares:Hatton National Bank PLC 315 1,740 315 1,748 315 3,072 315 1,740 315 1,748 315 3,072
(11,760 Ordinary Shares) (@ Rs. 148.00) (@ Rs.151.30) (@ Rs. 399.90) (@ Rs. 148.00) (@ Rs. 151.30) (@ Rs. 399.90)
(11,550 Ordinary Shares as at December 31, 2011)
Sampath Bank PLC 72 723 72 687 72 937 72 723 72 687 72 937
(3,606 Ordinary Shares) (@ Rs. 200.50) (@ Rs. 195.00) (@ Rs. 271.90) (@ Rs. 200.50) (@ Rs. 195.00) (@ Rs. 271.90)
(3,525 Ordinary Shares as at December 31, 2011)
Seylan Bank PLC 24 56 24 68 24 98 24 56 24 68 24 98
(1,000 Ordinary Shares) (@ Rs. 56.00) (@ Rs. 67.60) (@ Rs. 97.80) (@ Rs. 56.00) (@ Rs. 67.60) (@ Rs. 97.80)
(1,000 Ordinary Shares as at December 31, 2011)
DFCC Bank PLC 155 395 155 395 155 700 155 395 155 395 155 700
( 3,496 Ordinary Shares) (@ Rs. 112.90) (@ Rs. 112.90) (@ Rs. 200.20) (@ Rs. 112.90) (@ Rs. 112.90) (@ Rs. 200.20)
( 3,496 Ordinary Shares as at December 31, 2011)
Nations Trust Bank PLC 22 75 22 76 22 111 22 75 22 76 22 111
(1,333 Ordinary Shares) (@ Rs. 56.00) (@ Rs. 57.00) (@ Rs. 83.40) (@ Rs. 56.00) (@ Rs. 57.00) (@ Rs. 83.40)
(1,333 Ordinary Shares as at December 31, 2011)
NDB Bank PLC 215 748 215 749 215 948 215 748 215 749 215 948
( 5,424 Ordinary Shares) (@ Rs. 137.90) (@ Rs. 138.10) (@ Rs. 349.50) (@ Rs. 137.90) (@ Rs. 138.10) (@ Rs. 349.50)
( 5,424 Ordinary Shares as at December 31, 2011)
Sub total 803 3,737 803 3,723 803 5,866 803 3,737 803 3,723 803 5,866
Notes to the Financial Statements

Commercial Bank of Ceylon PLCCommercial Bank of Ceylon PLC
Annual Report 2012Annual Report 2012
This is Commercial BankOperating HighlightsFinancial Highlights
Letter from the ChairmanManaging Director’s ReviewManagement Discussion and AnalysisStewardshipFinancial ReportsAnnexes
374
GROUP BANK
As at December 31, 2012 As at December 31, 2011 As at January 1, 2011 As at December 31, 2012 As at December 31, 2011 As at January 1, 2011
Cost
Market Value/Manager’s
Buying Price Cost
Market Value/Manager’s
Buying Price Cost
Market Value/Manager’s
Buying Price Cost
Market Value/Manager’s
Buying Price Cost
Market Value/Manager’s
Buying Price Cost
Market Value/Manager’s
Buying PriceRs. ’000 Rs. ’000 Rs. ’000 Rs. ’000 Rs. ’000 Rs. ’000 Rs. ’000 Rs. ’000 Rs. ’000 Rs. ’000 Rs. ’000 Rs. ’000
Unquoted Shares:Credit Information Bureau of Sri Lanka 440 440 440 440 440 440 440 440 440 440 440 440
(4,400 Ordinary Shares) (@ Rs. 100.00) (@ Rs. 100.00) (@ Rs. 100.00) (@ Rs. 100.00) (@ Rs. 100.00) (@ Rs. 100.00)
(4,400 Ordinary Shares as at December 31, 2011)
Fitch Ratings Lanka Ltd. 625 625 625 625 625 625 625 625 625 625 625 625
(62,500 Ordinary Shares) (@ Rs. 10.00) (@ Rs. 10.00) (@ Rs. 10.00) (@ Rs. 10.00) (@ Rs. 10.00) (@ Rs. 10.00)
(62,500 Ordinary Shares as at December 31, 2011)
Lanka Clear (Pvt) Ltd. 10,000 10,000 10,000 10,000 10,000 10,000 10,000 10,000 10,000 10,000 10,000 10,000
(1,000,000 Ordinary Shares) (@ Rs. 10.00) (@ Rs. 10.00) (@ Rs. 10.00) (@ Rs. 10.00) (@ Rs. 10.00) (@ Rs. 10.00)
(1,000,000 Ordinary Shares as at December 31, 2011)
Lanka Financial Service Bureau Ltd. 2,250 2,250 2,250 2,250 2,250 2,250 2,250 2,250 2,250 2,250 2,250 2,250
(225,000 Ordinary Shares) (@ Rs. 10.00) (@ Rs. 10.00) (@ Rs. 10.00) (@ Rs. 10.00) (@ Rs. 10.00) (@ Rs. 10.00)
(225,000 Ordinary Shares as at December 31, 2011)
SWIFT 7,259 7,259 – – – – 7,259 7,259 – – – –
(47 Ordinary Shares) – – – (@ Rs. 10.00) – –
(Nil - Ordinary Shares as at December 31, 2011)
Central Depository of Bangladesh Ltd.
(342,782 Shares of Bangladesh Taka 27.47 each.
Converted @ Rs.1.60411 per Taka)
15,105 15,105 13,132 13,132 41,536 41,536 15,105 15,105 13,132 13,132 41,536 41,536
(342,782 Shares of Bangladesh Taka 27.47 each.
Converted @ Rs. 1.39458 per Taka as at December 31, 2011)
Sub total 35,679 35,679 26,447 26,447 54,851 54,851 35,679 35,679 26,447 26,447 54,851 54,851
Total 36,482 39,416 27,250 30,170 55,654 60,717 36,482 39,416 27,250 30,170 55,654 60,717
Notes to the Financial Statements

Commercial Bank of Ceylon PLCCommercial Bank of Ceylon PLC
Annual Report 2012Annual Report 2012
This is Commercial BankOperating HighlightsFinancial Highlights
Letter from the ChairmanManaging Director’s Review
Management Discussion and AnalysisStewardship
Financial ReportsAnnexes
375
GROUP BANK
As at December 31, 2012 As at December 31, 2011 As at January 1, 2011 As at December 31, 2012 As at December 31, 2011 As at January 1, 2011
Cost
Market Value/Manager’s
Buying Price Cost
Market Value/Manager’s
Buying Price Cost
Market Value/Manager’s
Buying Price Cost
Market Value/Manager’s
Buying Price Cost
Market Value/Manager’s
Buying Price Cost
Market Value/Manager’s
Buying PriceRs. ’000 Rs. ’000 Rs. ’000 Rs. ’000 Rs. ’000 Rs. ’000 Rs. ’000 Rs. ’000 Rs. ’000 Rs. ’000 Rs. ’000 Rs. ’000
Unquoted Shares:Credit Information Bureau of Sri Lanka 440 440 440 440 440 440 440 440 440 440 440 440
(4,400 Ordinary Shares) (@ Rs. 100.00) (@ Rs. 100.00) (@ Rs. 100.00) (@ Rs. 100.00) (@ Rs. 100.00) (@ Rs. 100.00)
(4,400 Ordinary Shares as at December 31, 2011)
Fitch Ratings Lanka Ltd. 625 625 625 625 625 625 625 625 625 625 625 625
(62,500 Ordinary Shares) (@ Rs. 10.00) (@ Rs. 10.00) (@ Rs. 10.00) (@ Rs. 10.00) (@ Rs. 10.00) (@ Rs. 10.00)
(62,500 Ordinary Shares as at December 31, 2011)
Lanka Clear (Pvt) Ltd. 10,000 10,000 10,000 10,000 10,000 10,000 10,000 10,000 10,000 10,000 10,000 10,000
(1,000,000 Ordinary Shares) (@ Rs. 10.00) (@ Rs. 10.00) (@ Rs. 10.00) (@ Rs. 10.00) (@ Rs. 10.00) (@ Rs. 10.00)
(1,000,000 Ordinary Shares as at December 31, 2011)
Lanka Financial Service Bureau Ltd. 2,250 2,250 2,250 2,250 2,250 2,250 2,250 2,250 2,250 2,250 2,250 2,250
(225,000 Ordinary Shares) (@ Rs. 10.00) (@ Rs. 10.00) (@ Rs. 10.00) (@ Rs. 10.00) (@ Rs. 10.00) (@ Rs. 10.00)
(225,000 Ordinary Shares as at December 31, 2011)
SWIFT 7,259 7,259 – – – – 7,259 7,259 – – – –
(47 Ordinary Shares) – – – (@ Rs. 10.00) – –
(Nil - Ordinary Shares as at December 31, 2011)
Central Depository of Bangladesh Ltd.
(342,782 Shares of Bangladesh Taka 27.47 each.
Converted @ Rs.1.60411 per Taka)
15,105 15,105 13,132 13,132 41,536 41,536 15,105 15,105 13,132 13,132 41,536 41,536
(342,782 Shares of Bangladesh Taka 27.47 each.
Converted @ Rs. 1.39458 per Taka as at December 31, 2011)
Sub total 35,679 35,679 26,447 26,447 54,851 54,851 35,679 35,679 26,447 26,447 54,851 54,851
Total 36,482 39,416 27,250 30,170 55,654 60,717 36,482 39,416 27,250 30,170 55,654 60,717
Notes to the Financial Statements

Commercial Bank of Ceylon PLCCommercial Bank of Ceylon PLC
Annual Report 2012Annual Report 2012
This is Commercial BankOperating HighlightsFinancial Highlights
Letter from the ChairmanManaging Director’s ReviewManagement Discussion and AnalysisStewardshipFinancial ReportsAnnexes
376
28. Investments in Subsidiaries
GROUP BANK
As at December 31, 2012 As at December 31, 2011 As at January 1, 2011 As at December 31, 2012 As at December 31, 2011 As at January 1, 2011
Holding Balance
Market Value/Directors’Valuation Balance
Market Value/Directors’Valuation Balance
Market Value/Directors’Valuation Balance
Market Value/Directors’Valuation Balance
Market Value/Directors’Valuation Balance
Market Value/Directors’Valuation
% Rs. ’000 Rs. ’000 Rs. ’000 Rs. ’000 Rs. ’000 Rs. ’000 Rs. ’000 Rs. ’000 Rs. ’000 Rs. ’000 Rs. ’000 Rs. ’000
Local Subsidiaries:Quoted:
Commercial Development Company PLC 94.55 – – – – – – 274,393 692,088 274,393 1,249,162 274,393 612,668
(11,345,705 Ordinary Shares) (@ Rs. 61.00) (@ Rs. 110.10) (@ Rs. 54.00)
(11,345,705 Ordinary Shares as at December 31, 2011)
Unquoted:
ONEzero Company Ltd. 100.00 – – – – – – 5,000 5,000 5,000 5,000 5,000 5,000
(500,002 Ordinary Shares) (@ Rs. 10.00) (@ Rs. 10.00) (@ Rs. 10.00)
(500,002 Ordinary Shares as at December 31, 2011)
Foreign Subsidiary: Unquoted:
Commex - Sri Lanka S.R.L (Incorporated in Italy) 100.00 – – – – – – 95,133 95,133 74,505 74,505 74,505 74,505
Gross Total 374,526 792,221 353,898 1,328,667 353,898 692,173
Less: Allowance for impairment [Refer Note 28.1] (71,396) (71,396) (38,454) (38,454) – –
Net Total – – – – – – 303,130 720,825 315,444 1,290,213 353,898 692,173
28.1 Movement in Allowance for Impairment during the year
GROUP BANK
2012 2011 January 1, 2011 2012 2011 January 1, 2011Rs. ’000 Rs. ’000 Rs. ’000 Rs. ’000 Rs. ’000 Rs. ’000
Opening balance – – – 38,454 – –
Charge/(write back) to the Income Statement – – – 32,942 38,454 –
Net write-off during the year – – – – –
Other movements – – – – –
Closing balance – – – 71,396 38,454 –
Notes to the Financial Statements

Commercial Bank of Ceylon PLCCommercial Bank of Ceylon PLC
Annual Report 2012Annual Report 2012
This is Commercial BankOperating HighlightsFinancial Highlights
Letter from the ChairmanManaging Director’s Review
Management Discussion and AnalysisStewardship
Financial ReportsAnnexes
377
28. Investments in Subsidiaries
GROUP BANK
As at December 31, 2012 As at December 31, 2011 As at January 1, 2011 As at December 31, 2012 As at December 31, 2011 As at January 1, 2011
Holding Balance
Market Value/Directors’Valuation Balance
Market Value/Directors’Valuation Balance
Market Value/Directors’Valuation Balance
Market Value/Directors’Valuation Balance
Market Value/Directors’Valuation Balance
Market Value/Directors’Valuation
% Rs. ’000 Rs. ’000 Rs. ’000 Rs. ’000 Rs. ’000 Rs. ’000 Rs. ’000 Rs. ’000 Rs. ’000 Rs. ’000 Rs. ’000 Rs. ’000
Local Subsidiaries:Quoted:
Commercial Development Company PLC 94.55 – – – – – – 274,393 692,088 274,393 1,249,162 274,393 612,668
(11,345,705 Ordinary Shares) (@ Rs. 61.00) (@ Rs. 110.10) (@ Rs. 54.00)
(11,345,705 Ordinary Shares as at December 31, 2011)
Unquoted:
ONEzero Company Ltd. 100.00 – – – – – – 5,000 5,000 5,000 5,000 5,000 5,000
(500,002 Ordinary Shares) (@ Rs. 10.00) (@ Rs. 10.00) (@ Rs. 10.00)
(500,002 Ordinary Shares as at December 31, 2011)
Foreign Subsidiary: Unquoted:
Commex - Sri Lanka S.R.L (Incorporated in Italy) 100.00 – – – – – – 95,133 95,133 74,505 74,505 74,505 74,505
Gross Total 374,526 792,221 353,898 1,328,667 353,898 692,173
Less: Allowance for impairment [Refer Note 28.1] (71,396) (71,396) (38,454) (38,454) – –
Net Total – – – – – – 303,130 720,825 315,444 1,290,213 353,898 692,173
28.1 Movement in Allowance for Impairment during the year
GROUP BANK
2012 2011 January 1, 2011 2012 2011 January 1, 2011Rs. ’000 Rs. ’000 Rs. ’000 Rs. ’000 Rs. ’000 Rs. ’000
Opening balance – – – 38,454 – –
Charge/(write back) to the Income Statement – – – 32,942 38,454 –
Net write-off during the year – – – – –
Other movements – – – – –
Closing balance – – – 71,396 38,454 –
Notes to the Financial Statements

Commercial Bank of Ceylon PLCCommercial Bank of Ceylon PLC
Annual Report 2012Annual Report 2012
This is Commercial BankOperating HighlightsFinancial Highlights
Letter from the ChairmanManaging Director’s ReviewManagement Discussion and AnalysisStewardshipFinancial ReportsAnnexes
378
29. Investments in Associates
GROUP BANK As at December 31, 2012 As at December 31, 2011 As at January 1, 2011 As at December 31, 2012 As at December 31, 2011 As at January 1, 2011
Holding Balance
Market Value/Directors’Valuation Balance
Market Value/Directors’Valuation Balance
Market Value/Directors’Valuation Balance
Market Value/Directors’Valuation Balance
Market Value/Directors’Valuation Balance
Market Value/Directors’Valuation
% Rs. ’000 Rs. ’000 Rs. ’000 Rs. ’000 Rs. ’000 Rs. ’000 Rs. ’000 Rs. ’000 Rs. ’000 Rs. ’000 Rs. ’000 Rs. ’000
Local Associates:
Unquoted:Equity Investments Lanka Ltd. 22.92 44,331 44,331 44,331 44,331 44,331 44,331
(4,110,938 Ordinary Shares)
(4,110,938 Ordinary Shares as at December 31, 2011)
Add: Share of profit applicable to the Bank:
Balance at the beginning of the year 47,580 37,472 3,352
Current year's share of profit after tax (21,198) 12,163 37,278
Less: Dividend received during the year (8,002) (2,055) (3,158)
Current year's retained profit (29,200) 10,108 34,120
Balance at the end of the year 18,380 47,580 37,472
Total 62,711 62,711 91,911 91,911 81,803 81,803 44,331 44,331 44,331
Commercial Insurance Brokers (Pvt) Ltd. 18.91 100 100 100 – – – – – –
(120,000 Ordinary Shares)
(120,000 Ordinary Shares as at December 31, 2011)
Add: Share of profit applicable to the Bank:
Balance at the beginning of the year 27,970 24,956 24,850
Current year's share of profit after tax 3,544 3,468 538
Less: Dividend received during the year (613) (454) (432)
Current year's retained profit 2,931 3,014 106
Balance at the end of the year 30,901 27,970 24,956
Total 31,001 31,001 28,070 28,070 25,056 25,056 – – – – – –
Total value of Investments in Unquoted Associates at carrying value on equity basis 93,712 119,981 106,859 44,331 44,331 44,331
Less: Allowance for Impairment – – – – – –
Net Total 93,712 119,981 106,859 44,331 44,331 44,331
Total Market Value/Directors’ Valuation of Investments in Associates 93,712 119,981 106,859
Notes to the Financial Statements

Commercial Bank of Ceylon PLCCommercial Bank of Ceylon PLC
Annual Report 2012Annual Report 2012
This is Commercial BankOperating HighlightsFinancial Highlights
Letter from the ChairmanManaging Director’s Review
Management Discussion and AnalysisStewardship
Financial ReportsAnnexes
379
29. Investments in Associates
GROUP BANK As at December 31, 2012 As at December 31, 2011 As at January 1, 2011 As at December 31, 2012 As at December 31, 2011 As at January 1, 2011
Holding Balance
Market Value/Directors’Valuation Balance
Market Value/Directors’Valuation Balance
Market Value/Directors’Valuation Balance
Market Value/Directors’Valuation Balance
Market Value/Directors’Valuation Balance
Market Value/Directors’Valuation
% Rs. ’000 Rs. ’000 Rs. ’000 Rs. ’000 Rs. ’000 Rs. ’000 Rs. ’000 Rs. ’000 Rs. ’000 Rs. ’000 Rs. ’000 Rs. ’000
Local Associates:
Unquoted:Equity Investments Lanka Ltd. 22.92 44,331 44,331 44,331 44,331 44,331 44,331
(4,110,938 Ordinary Shares)
(4,110,938 Ordinary Shares as at December 31, 2011)
Add: Share of profit applicable to the Bank:
Balance at the beginning of the year 47,580 37,472 3,352
Current year's share of profit after tax (21,198) 12,163 37,278
Less: Dividend received during the year (8,002) (2,055) (3,158)
Current year's retained profit (29,200) 10,108 34,120
Balance at the end of the year 18,380 47,580 37,472
Total 62,711 62,711 91,911 91,911 81,803 81,803 44,331 44,331 44,331
Commercial Insurance Brokers (Pvt) Ltd. 18.91 100 100 100 – – – – – –
(120,000 Ordinary Shares)
(120,000 Ordinary Shares as at December 31, 2011)
Add: Share of profit applicable to the Bank:
Balance at the beginning of the year 27,970 24,956 24,850
Current year's share of profit after tax 3,544 3,468 538
Less: Dividend received during the year (613) (454) (432)
Current year's retained profit 2,931 3,014 106
Balance at the end of the year 30,901 27,970 24,956
Total 31,001 31,001 28,070 28,070 25,056 25,056 – – – – – –
Total value of Investments in Unquoted Associates at carrying value on equity basis 93,712 119,981 106,859 44,331 44,331 44,331
Less: Allowance for Impairment – – – – – –
Net Total 93,712 119,981 106,859 44,331 44,331 44,331
Total Market Value/Directors’ Valuation of Investments in Associates 93,712 119,981 106,859
Notes to the Financial Statements
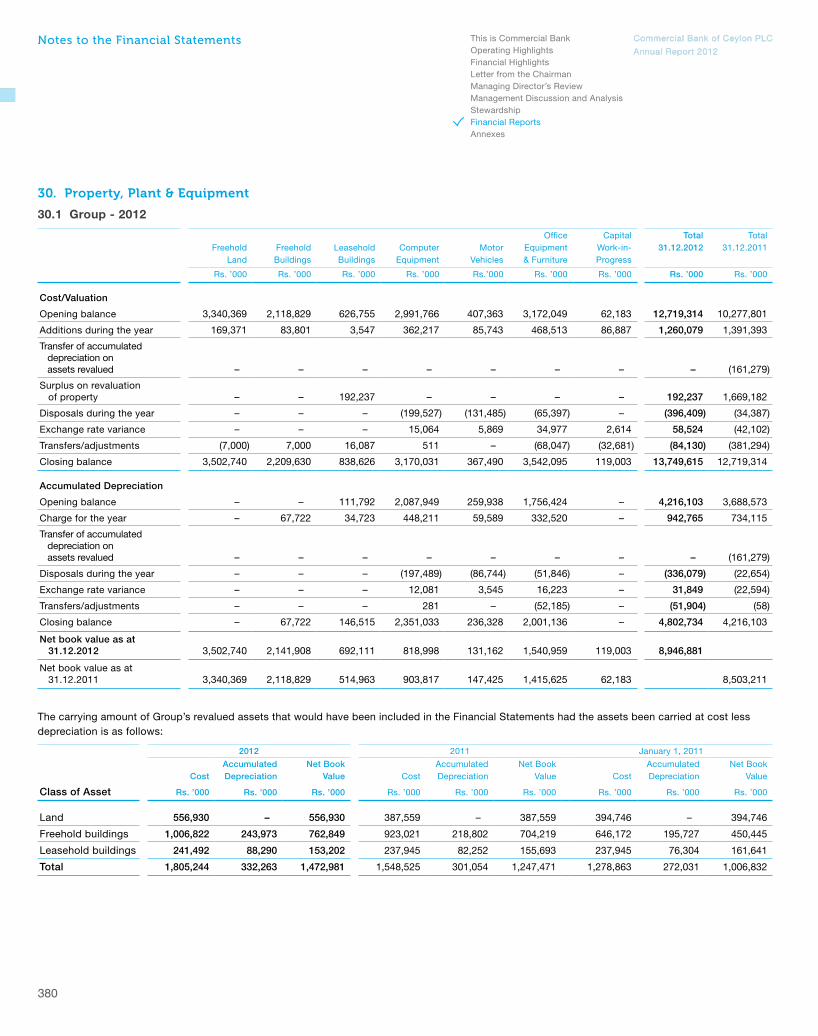
Commercial Bank of Ceylon PLCCommercial Bank of Ceylon PLC
Annual Report 2012Annual Report 2012
This is Commercial BankOperating HighlightsFinancial Highlights
Letter from the ChairmanManaging Director’s ReviewManagement Discussion and AnalysisStewardshipFinancial ReportsAnnexes
380
30. Property, Plant & Equipment
30.1 Group - 2012
Office Capital Total TotalFreehold Freehold Leasehold Computer Motor Equipment Work-in- 31.12.2012 31.12.2011
Land Buildings Buildings Equipment Vehicles & Furniture Progress
Rs. ’000 Rs. ’000 Rs. ’000 Rs. ’000 Rs.’000 Rs. ’000 Rs. ’000 Rs. ’000 Rs. ’000
Cost/Valuation
Opening balance 3,340,369 2,118,829 626,755 2,991,766 407,363 3,172,049 62,183 12,719,314 10,277,801
Additions during the year 169,371 83,801 3,547 362,217 85,743 468,513 86,887 1,260,079 1,391,393
Transfer of accumulated depreciation on assets revalued – – – – – – – – (161,279)
Surplus on revaluation of property – – 192,237 – – – – 192,237 1,669,182
Disposals during the year – – – (199,527) (131,485) (65,397) – (396,409) (34,387)
Exchange rate variance – – – 15,064 5,869 34,977 2,614 58,524 (42,102)
Transfers/adjustments (7,000) 7,000 16,087 511 – (68,047) (32,681) (84,130) (381,294)
Closing balance 3,502,740 2,209,630 838,626 3,170,031 367,490 3,542,095 119,003 13,749,615 12,719,314
Accumulated Depreciation
Opening balance – – 111,792 2,087,949 259,938 1,756,424 – 4,216,103 3,688,573
Charge for the year – 67,722 34,723 448,211 59,589 332,520 – 942,765 734,115
Transfer of accumulated depreciation on assets revalued – – – – – – – – (161,279)
Disposals during the year – – – (197,489) (86,744) (51,846) – (336,079) (22,654)
Exchange rate variance – – – 12,081 3,545 16,223 – 31,849 (22,594)
Transfers/adjustments – – – 281 – (52,185) – (51,904) (58)
Closing balance – 67,722 146,515 2,351,033 236,328 2,001,136 – 4,802,734 4,216,103
Net book value as at 31.12.2012 3,502,740 2,141,908 692,111 818,998 131,162 1,540,959 119,003 8,946,881
Net book value as at 31.12.2011 3,340,369 2,118,829 514,963 903,817 147,425 1,415,625 62,183 8,503,211
The carrying amount of Group’s revalued assets that would have been included in the Financial Statements had the assets been carried at cost less depreciation is as follows:
2012 2011 January 1, 2011
Accumulated Net Book Accumulated Net Book Accumulated Net BookCost Depreciation Value Cost Depreciation Value Cost Depreciation Value
Class of Asset Rs. ’000 Rs. ’000 Rs. ’000 Rs. ’000 Rs. ’000 Rs. ’000 Rs. ’000 Rs. ’000 Rs. ’000
Land 556,930 – 556,930 387,559 – 387,559 394,746 – 394,746
Freehold buildings 1,006,822 243,973 762,849 923,021 218,802 704,219 646,172 195,727 450,445
Leasehold buildings 241,492 88,290 153,202 237,945 82,252 155,693 237,945 76,304 161,641
Total 1,805,244 332,263 1,472,981 1,548,525 301,054 1,247,471 1,278,863 272,031 1,006,832
Notes to the Financial Statements

Commercial Bank of Ceylon PLCCommercial Bank of Ceylon PLC
Annual Report 2012Annual Report 2012
This is Commercial BankOperating HighlightsFinancial Highlights
Letter from the ChairmanManaging Director’s Review
Management Discussion and AnalysisStewardship
Financial ReportsAnnexes
381
30.2 Group - 2011
Office Capital Total TotalFreehold Freehold Leasehold Computer Motor Equipment Work-in- 31.12.2011 01.01.2011
Land Buildings Buildings Equipment Vehicles & Furniture Progress
Rs. ’000 Rs. ’000 Rs. ’000 Rs. ’000 Rs.’000 Rs. ’000 Rs. ’000 Rs. ’000 Rs. ’000
Cost/Valuation
Opening balance 2,151,957 1,544,529 621,745 2,656,294 422,826 2,562,847 317,603 10,277,801 7,897,416
Additions during the year – 276,849 – 346,824 14,904 629,260 123,556 1,391,393 921,436
Transfer of accumulated depreciation on assets revalued – (161,279) – – – – – (161,279) (159,575)
Surplus on revaluation of property 1,195,599 458,730 14,853 – – – – 1,669,182 1,738,876
Disposals during the year (7,187) – – – (26,705) (495) – (34,387) (61,367)
Exchange rate variance – – – (11,352) (3,662) (27,061) (27) (42,102) (17,533)
Transfers/adjustments – – (9,843) – – 7,498 (378,949) (381,294) (41,452)
Closing balance 3,340,369 2,118,829 626,755 2,991,766 407,363 3,172,049 62,183 12,719,314 10,277,801
Accumulated Depreciation
Opening balance – 61,703 84,222 1,829,120 214,480 1,499,048 – 3,688,573 3,287,959
Charge for the year – 99,576 27,570 267,920 70,403 268,646 – 734,115 629,050
Transfer of accumulated depreciation on assets revalued – (161,279) – – – – – (161,279) (159,575)
Disposals during the year – – – – (22,616) (38) – (22,654) (57,745)
Exchange rate variance – – – (8,945) (2,329) (11,320) – (22,594) (10,967)
Transfers/adjustments – – – (146) – 88 – (58) (149)
Closing balance – – 111,792 2,087,949 259,938 1,756,424 – 4,216,103 3,688,573
Net book value as at 31.12.2011 3,340,369 2,118,829 514,963 903,817 147,425 1,415,625 62,183 8,503,211
Net book value as at 01.01.2011 2,151,957 1,482,826 537,523 827,174 208,346 1,063,799 317,603 6,589,228
Notes to the Financial Statements

Commercial Bank of Ceylon PLCCommercial Bank of Ceylon PLC
Annual Report 2012Annual Report 2012
This is Commercial BankOperating HighlightsFinancial Highlights
Letter from the ChairmanManaging Director’s ReviewManagement Discussion and AnalysisStewardshipFinancial ReportsAnnexes
382
30.3 Bank - 2012
Office Capital Total TotalFreehold Freehold Leasehold Computer Motor Equipment Work-in- 31.12.2012 31.12.2011
Land Buildings Buildings Equipment Vehicles & Furniture Progress
Rs. ’000 Rs. ’000 Rs. ’000 Rs. ’000 Rs.’000 Rs. ’000 Rs. ’000 Rs. ’000 Rs. ’000
Cost/Valuation
Opening balance 3,340,369 2,118,829 104,625 2,987,702 95,111 3,102,138 44,398 11,793,172 9,351,129
Additions during the year 169,371 83,801 – 361,787 28,464 467,329 86,887 1,197,639 1,379,607
Transfer of accumulated depreciation on assets revalued – – – – – – – – (161,279)
Surplus on revaluation of property – – – – – – – – 1,654,329
Disposals during the year – – – (199,527) (1,740) (65,397) – (266,664) (7,682)
Exchange rate variance – – – 15,064 5,869 34,855 – 55,788 (42,075)
Transfers/adjustments (7,000) 7,000 – 511 – 221 (32,681) (31,949) (380,857)
Closing balance 3,502,740 2,209,630 104,625 3,165,537 127,704 3,539,146 98,604 12,747,986 11,793,172
Accumulated Depreciation
Opening balance – – 23,571 2,086,344 68,923 1,707,304 – 3,886,142 3,421,568
Charge for the year – 67,722 3,599 447,698 12,569 328,087 – 859,675 648,543
Transfer of accumulated depreciation on assets revalued – – – – – – – – (161,279)
Disposals during the year – – – (197,489) (1,740) (51,846) – (251,075) (38)
Exchange rate variance – – – 12,081 3,545 16,223 – 31,849 (22,594)
Transfers/adjustments – – – 281 – (4) – 277 (58)
Closing balance – 67,722 27,170 2,348,915 83,297 1,999,764 – 4,526,868 3,886,142
Net book value as at 31.12.2012 3,502,740 2,141,908 77,455 816,622 44,407 1,539,382 98,604 8,221,118
Net book value as at 31.12.2011 3,340,369 2,118,829 81,054 901,358 26,188 1,394,834 44,398 7,907,030
The carrying amount of Bank’s revalued assets that would have been included in the Financial Statements had the assets been carried at cost less depreciation is as follows:
2012 2011 January 1, 2011
Accumulated Net Book Accumulated Net Book Accumulated Net BookCost Depreciation Value Cost Depreciation Value Cost Depreciation Value
Rs. ’000 Rs. ’000 Rs. ’000 Rs. ’000 Rs. ’000 Rs. ’000 Rs. ’000 Rs. ’000 Rs. ’000
Class of Asset
Land 556,930 – 556,930 387,559 – 387,559 394,746 – 394,746
Freehold buildings 1,006,822 243,973 762,849 923,021 218,802 704,219 646,172 195,727 450,445
Leasehold buildings 102,726 35,869 66,857 102,726 33,301 69,425 102,726 30,733 71,993
Total 1,666,478 279,842 1,386,636 1,413,306 252,103 1,161,203 1,143,644 226,460 917,184
Notes to the Financial Statements

Commercial Bank of Ceylon PLCCommercial Bank of Ceylon PLC
Annual Report 2012Annual Report 2012
This is Commercial BankOperating HighlightsFinancial Highlights
Letter from the ChairmanManaging Director’s Review
Management Discussion and AnalysisStewardship
Financial ReportsAnnexes
383
30.4 Bank - 2011
Office Capital Total TotalFreehold Freehold Leasehold Computer Motor Equipment Work-in- 31.12.2011 01.01.2011
Land Buildings Buildings Equipment Vehicles & Furniture Progress
Rs. ’000 Rs. ’000 Rs. ’000 Rs. ’000 Rs.’000 Rs. ’000 Rs. ’000 Rs. ’000 Rs. ’000
Cost/Valuation
Opening balance 2,151,957 1,544,529 104,625 2,653,279 88,771 2,505,072 302,896 9,351,129 7,008,176
Additions during the year – 276,849 – 345,775 10,002 626,530 120,451 1,379,607 862,678
Accumulated depreciation – (161,279) – – – – – (161,279) (159,575)
Surplus on revaluation of property 1,195,599 458,730 – – – – – 1,654,329 1,738,876
Disposals during the year (7,187) – – – – (495) – (7,682) (40,041)
Exchange rate variance – – – (11,352) (3,662) (27,061) – (42,075) (17,533)
Transfers/adjustments – – – – – (1,908) (378,949) (380,857) (41,452)
Closing balance 3,340,369 2,118,829 104,625 2,987,702 95,111 3,102,138 44,398 11,793,172 9,351,129
Accumulated Depreciation
Opening balance – 61,703 19,922 1,827,905 58,722 1,453,316 – 3,421,568 3,093,426
Charge for the year – 99,576 3,649 267,530 12,530 265,258 – 648,543 537,657
Transfer of accumulated depreciation on assets revalued – (161,279) – – – – – (161,279) (159,575)
Disposals during the year – – – – – (38) – (38) (38,857)
Exchange rate variance – – – (8,945) (2,329) (11,320) – (22,594) (10,967)
Transfers/adjustments – – – (146) – 88 – (58) (116)
Closing balance – – 23,571 2,086,344 68,923 1,707,304 – 3,886,142 3,421,568
Net book value as at 31.12.2011 3,340,369 2,118,829 81,054 901,358 26,188 1,394,834 44,398 7,907,030
Net book value as at 01.01.2011 2,151,957 1,482,826 84,703 825,374 30,049 1,051,756 302,896 5,929,561
Notes to the Financial Statements

Commercial Bank of Ceylon PLCCommercial Bank of Ceylon PLC
Annual Report 2012Annual Report 2012
This is Commercial BankOperating HighlightsFinancial Highlights
Letter from the ChairmanManaging Director’s ReviewManagement Discussion and AnalysisStewardshipFinancial ReportsAnnexes
384
30.5 Information on the Freehold Land and Buildings of the Bank
[As required by Rule No. 7.6 (viii) of the Continuing Listing Requirements of the Colombo Stock Exchange]
LocationExtent
(Perches)Buildings
(Square Feet)
Revalued Amounts Buildings Rs. ’000
RevaluedAmounts
LandRs. ’000
Net Book Value
Rs. ’000As a % ofTotal NBV
Holiday Bungalow - Haputale No. 23, Lily Avenue, Welimada Road, Haputale 207 4,533 15,300 25,700 40,237 0.71
Holiday Bungalow - Bandarawela Ambatenne Estate, Bandarawela 423 5,546 11,400 51,400 62,345 1.10
CEO’s Bungalow - No. 27, Queens Road, Colombo 3 64 5,616 8,350 416,650 423,815 7.51
Union Place - No. 1, Union Place, Colombo 2 30 63,385 640,000 360,000 978,696 17.34
Kandy - No. 120, Kotugodella Veediya, Kandy 45 44,500 231,000 342,000 565,311 10.01
Galle Fort - No. 22, Church Street, Fort, Galle 100 11,625 50,000 100,000 148,751 2.64
Jaffna - No. 474, Hospital Road, Jaffna 77 5,146 12,865 272,135 284,485 5.04
Matara - No. 18, Station Road, Matara 37 8,137 24,145 28,155 51,690 0.92
Matale - No. 70, King Street, Matale 51 9,950 62,000 60,000 120,452 2.13
Galewela - No. 49/57, Matale Road, Galewela 99 6,380 13,200 19,800 32,670 0.58
Wellawatte - No. 343, Galle Road, Colombo 6 45 15,050 35,900 204,100 238,209 4.22
Kollupitiya - No. 285, Galle Road, Colombo 3 17 16,254 63,000 100,000 161,427 2.86
Kotahena - No. 198, George R. De Silva Mawatha, Kotahena, Colombo 13 28 33,017 218,846 110,000 323,389 5.73
Negombo - No. 24, 26, Fernando Avenue, Negombo 37 14,439 25,500 49,500 74,171 1.31
Hikkaduwa - No. 217, Galle Road, Hikkaduwa 37 6,713 21,260 16,740 37,469 0.66
Kurunegala - No. 4, Suratissa Mawatha, Kurunegala 15 8,916 85,000 140,000 222,877 3.95
Maharagama - No. 154, High Level Road, Maharagama 18 8,000 43,200 62,125 103,887 1.84
Borella - No. 92, D.S. Senanayake Mawatha, Borella, Colombo 8 16 12,566 62,202 70,335 130,466 2.31
Nugegoda - No. 100, Stanley Thilakaratne Mawatha, Nugegoda 39 11,138 44,552 195,000 237,773 4.21
Notes to the Financial Statements

Commercial Bank of Ceylon PLCCommercial Bank of Ceylon PLC
Annual Report 2012Annual Report 2012
This is Commercial BankOperating HighlightsFinancial Highlights
Letter from the ChairmanManaging Director’s Review
Management Discussion and AnalysisStewardship
Financial ReportsAnnexes
385
LocationExtent
(Perches)Buildings
(Square Feet)
Revalued Amounts Buildings Rs. ’000
RevaluedAmounts
LandRs. ’000
Net Book Value
Rs. ’000As a % ofTotal NBV
Kegalle - No. 186, Main Street, Kegalle 85 2,650 7,000 115,000 121,767 2.16
Narahenpita - No. 201, Kirula Road, Narahenpita, Colombo 5 22 11,193 70,775 99,225 167,644 2.97
Mutwal - No. 160, St. James Street, Colombo 15 17 – – 22,300 22,300 0.40
Pettah - People's Park Shopping Complex, Colombo 11 – 3,183 50,000 – 48,573 0.86
Pettah - Stores - People's Park Shopping Complex, Colombo 11 – 218 4,000 – 3,840 0.07
Wennappuwa - No. 262, 264, Colombo Road, Wennappuwa 36 8,852 22,500 37,500 59,438 1.05
Galle City - No. 130, Main Street, Galle 7 3,675 7,250 33,750 40,759 0.72
Battaramulla - No. 213, Kaduwela Road, Battaramulla 14 11,216 61,483 24,517 83,953 1.49
Minuwangoda - No. 42, Siriwardena Mawatha, Minuwangoda 25 4,950 36,956 37,500 73,522 1.30
Nuwara Eliya - No. 36, Buddha Jayanthi Mawatha, Nuwara Eliya 42 10,184 69,000 72,000 139,277 2.47
Trincomalee - No. 474, Power House Road, Trincomalee 100 – – 75,000 75,000 1.33
Keyzer Street - No. 32, Keyzer Street, Colombo 11 7 5,608 25,000 45,000 69,376 1.23
Panadura - No. 375, Galle Road, Panadura 12 6,168 19,735 18,450 37,200 0.66
Chilaw - No. 44, Colombo Road, Chilaw 35 10,000 68,200 61,750 128,227 2.27
Narammala - No. 55, Negombo Road, Narammala 43 5,760 15,450 44,550 59,614 1.06
Ja–Ela - No. 140, Negombo Road, Ja–Ela 13 7,755 16,813 23,187 39,580 0.70
Pettah - Main Street - No. 280, Main Street, Pettah, Colombo 11 30 22,760 67,748 169,371 236,458 4.19
Total 2,209,630 3,502,740 5,644,648 100.00
Notes to the Financial Statements

Commercial Bank of Ceylon PLCCommercial Bank of Ceylon PLC
Annual Report 2012Annual Report 2012
This is Commercial BankOperating HighlightsFinancial Highlights
Letter from the ChairmanManaging Director’s ReviewManagement Discussion and AnalysisStewardshipFinancial ReportsAnnexes
386
30.5 Information on the Feehold Land and Buildings of the Bank
As required by Rule No. 7.6 (viii) of the Continuing Listing Requirements of the Colombo Stock Exchange.
Year of Valuation 2011
Net Book Value before Revaluation
Revalued Amount of
Revaluation Gain/(Loss) Recognised on
Location Address Professional Valuer Method of Valuation Buildings Land Buildings Land Buildings Land
Rs. ‘000 Rs. ‘000 Rs. ‘000 Rs. ‘000 Rs. ‘000 Rs. ‘000
Wellawatte No. 343, Galle Road, Colombo 6 K.C.B. Condegama Investment Method 33,444 187,375 35,900 204,100 2,456 16,725
Kollupitiya No. 285, Galle Road, Colombo 3 P.B. Kalugalagedara Investment Method 56,842 82,000 63,000 100,000 6,158 18,000
Kotahena No. 198, George R. De Silva Mawatha, Kotahena, Colombo 13
P.B. Kalugalagedara Investment Method 374,928 85,000 208,984 110,000 (165,944) 25,000
Mutwal No. 160, St. James Street, Colombo 15
P.B. Kalugalagedara Direct Capital Comparison Method
– 20,592 – 22,300 – 1,708
Minuwangoda No. 42, Siriwardena Mawatha, Minuwangoda
P.B. Kalugalagedara Direct Capital Comparison Method
4,348 8,575 32,500 37,500 28,152 28,925
Keyzer Street No. 32, Keyzer Street, Colombo 11
P.B. Kalugalagedara Investment Method 6,401 14,940 25,000 45,000 18,599 30,060
Chilaw No. 44, Colombo Road, Chilaw P.B. Kalugalagedara Direct Capital Comparison Method
65,673 25,850 67,000 61,750 1,327 35,900
Maharagama No. 154, Highlevel Road, Maharagama
Ranjan J. Samarakone
Contractor’s Method 13,518 5,238 43,200 62,125 29,682 56,887
Borella No. 92, D.S. Senanayake Mawatha, Colombo 8
Ranjan J. Samarakone
Contractor’s Method 30,000 23,000 62,202 70,335 32,202 47,335
Nugegoda No. 100, Stanley Thilakaratne Mawatha, Nugegoda
Ranjan J. Samarakone
Contractor’s Method 15,876 39,000 44,552 195,000 28,676 156,000
Panadura No. 375, Galle Road, Panadura Ranjan J. Samarakone
Contractor’s Method 11,592 8,930 19,735 18,450 8,143 9,520
Galle Fort No. 22, Church Street, Fort, Galle S.A.S. Fernando Comparison Method 17,500 90,000 50,000 100,000 32,500 10,000
Matara No. 18, Station Road, Matara S.A.S. Fernando Comparison Method 7,116 16,893 23,595 28,155 16,479 11,262
Hikkaduwa No. 217, Galle Road, Hikkaduwa S.A.S. Fernando Comparison Method 4,293 1,303 21,260 16,740 16,967 15,437
Galle City No. 130, Main Street, Galle S.A.S. Fernando Comparison Method 4,445 5,064 7,250 33,750 2,805 28,687
Trincomalee No. 474, Power House Road, Trincomalee
S.A.S. Fernando Comparison Method – 27,500 – 75,000 – 47,500
Jaffna No. 474, Hospital Road, Jaffna S.T. Sanmuganathan Depreciated Replacement Cost Method/Investment Method
6,432 137,135 12,865 272,135 6,433 135,000
Kandy No. 120, Kotugodella Veediya, Kandy
Sarath G. Fernando Comparative Method/Income Method
181,078 333,832 231,000 342,000 49,922 8,168
Matale No. 70, King Street, Matale Sarath G. Fernando Comparative Method/Income Method
36,203 8,000 62,000 60,000 25,797 52,000
Kegalle No. 186, Main Street, Kegalle Sarath G. Fernando Comparative Method/Income Method
– 100,000 – 122,000 – 22,000
Nuwara Eliya No. 36/3, Buddha Jayanthi Mawatha, Nuwara Eliya
Sarath G. Fernando Comparative Method/Income Method
61,492 61,800 69,000 72,000 7,508 10,200
Holiday Bungalow - Haputale
No. 23, Lily Avenue, Welimada Road, Haputale
Sarath G. Fernando Comparative Method 945 5,189 15,300 25,700 14,355 20,512
Notes to the Financial Statements

Commercial Bank of Ceylon PLCCommercial Bank of Ceylon PLC
Annual Report 2012Annual Report 2012
This is Commercial BankOperating HighlightsFinancial Highlights
Letter from the ChairmanManaging Director’s Review
Management Discussion and AnalysisStewardship
Financial ReportsAnnexes
387
Net Book Value before Revaluation
Revalued Amount of
Revaluation Gain/(Loss) Recognised on
Location Address Professional Valuer Method of Valuation Buildings Land Buildings Land Buildings Land
Rs. ‘000 Rs. ‘000 Rs. ‘000 Rs. ‘000 Rs. ‘000 Rs. ‘000
Holiday Bungalow - Bandarawela
Ambatenne Estate, Bandarawela Sarath G. Fernando Comparative Method 2,347 8,468 11,400 51,400 9,053 42,932
Narahenpita No. 201, Kirula Road, Narahenpita, Colombo 5
Siri Nissanka Income Method/Depreciated Replacement Cost Method
59,593 88,200 70,775 99,225 11,182 11,025
Battaramulla No. 213, Kaduwela Road, Battaramula
Siri Nissanka Income Method/Depreciated Replacement Cost Method
31,453 11,208 61,483 24,517 30,030 13,309
Union Place No. 1, Union Place, Colombo 2 Siri Nissanka Income Method/Depreciated Replacement Cost Method
554,464 300,000 640,000 360,000 85,536 60,000
CEO’s Bungalow
No. 27, Queens Road, Colombo 3 Siri Nissanka Depreciated Replacement Cost Method
4,967 352,550 8,350 416,650 3,383 64,100
Negombo No. 24, 26, Fernando Avenue, Negombo
W.D.P. Rupananda Contractor’s Test Method
16,929 16,000 25,516 49,500 8,587 33,500
Pettah People‘s Park Shopping Complex, Colombo 11
W.D.P. Rupananda Investment Method 11,288 – 54,000 – 42,712 –
Wennappuwa No. 262, 264, Colombo Road, Wennappuwa
W.D.P. Rupananda Contractor’s Test Method
14,710 8,665 22,500 37,500 7,790 28,835
Ja–Ela No. 140, Negombo Road, Ja–Ela
W.D.P. Rupananda Contractor’s Test Method
15,382 11,021 16,812 23,187 1,430 12,163
Galewela No. 49/57, Matale Road, Galewela
W.S. Pemaratne Contractor’s Method/Comparison Method
1,936 10,455 13,200 19,800 11,264 9,346
Kurunegala No. 4, Suratissa Mawatha, Kurunegala
W.S. Pemaratne Investment Method 10,542 39,481 85,000 140,000 74,458 100,519
Narammala No. 55, Negombo Road, Narammala
W.S. Pemaratne Investment Method 4,360 11,510 15,450 44,550 11,090 33,040
Total 1,660,097 2,144,774 2,118,829 3,340,369 458,732 1,195,595
30.6 Title Restriction on Property, Plant & Equipment
There were no restrictions existed on the title of the property, plant & equipment of the Group as at the Balance Sheet date.
30.7 Property, Plant & Equipment Pledged as Security for Liabilities
There were no items of property, plant & equipment pledged as securities for liabilities.
30.8 Compensation from Third Parties for Items of Property, Plant & Equipment
There were no compensation received/receivable from third parties for items of property, plant & equipment that were impaired, lost or given up.
Notes to the Financial Statements

Commercial Bank of Ceylon PLCCommercial Bank of Ceylon PLC
Annual Report 2012Annual Report 2012
This is Commercial BankOperating HighlightsFinancial Highlights
Letter from the ChairmanManaging Director’s ReviewManagement Discussion and AnalysisStewardshipFinancial ReportsAnnexes
388
30.9 Fully Depreciated Property, Plant & Equipment
The cost of fully-depreciated property, plant & equipment of the Bank which are still in use as at the Balance Sheet date is as follows:
2012 2011 January 1, 2011Rs. ’000 Rs. ’000 Rs. ’000
Computer equipment 1,463,312 1,317,053 1,436,314
Equipment, furniture and fixtures 986,218 880,674 746,719
Motor vehicles 36,494 34,255 22,176
30.10 Temporarily Idle Property, Plant & Equipment
Following property, plant & equipment of the Bank were temporarily idle as at the Balance Sheet date:
2012 2011 January 1, 2011Rs. ’000 Rs. ’000 Rs. ’000
Computer equipment 46,637 278,143 98,714
Equipment, furniture and fixtures 66,594 117,503 45,651
30.11 Property, Plant & Equipment Retired from Active Use
Following property, plant & equipment of the Bank were retired from active use as at the Balance Sheet date.
2012 2011 January 1, 2011Rs. ’000 Rs. ’000 Rs. ’000
Computer equipment 67,773 41,917 41,917
Equipment, furniture and fixtures 9,309 9,293 9,293
31. Intangible Assets
31.1 Computer Software
GROUP BANK
2012 2011 January 1, 2011 2012 2011 January 1, 2011Rs. ’000 Rs. ’000 Rs. ’000 Rs. ’000 Rs. ’000 Rs. ’000
Cost/Valuation
At the beginning of the year 1,121,243 956,478 796,289 1,120,917 956,152 796,243
Additions during the year 139,161 167,193 162,195 139,161 167,193 161,915
Disposals during the year – – (1,973) – – (1,973)
Exchange rate variance 2,944 (2,428) (33) 2,944 (2,428) (33)
Transfers/adjustments (741) – – (741) – –
At the end of the year 1,262,607 1,121,243 956,478 1,262,281 1,120,917 956,152
Accumulated Amortisation
At the beginning of the year 731,326 633,880 551,042 731,216 633,824 551,041
Amortisation for the year 174,104 98,172 84,260 174,055 98,118 84,238
Disposals during the year – – (1,290) – – (1,290)
Exchange rate variance 1,298 (726) (281) 1,298 (726) (281)
Transfers/adjustments (142) – 149 (142) – 116
At the end of the year 906,586 731,326 633,880 906,427 731,216 633,824
Net book value 356,021 389,917 322,598 355,854 389,701 322,328
Notes to the Financial Statements
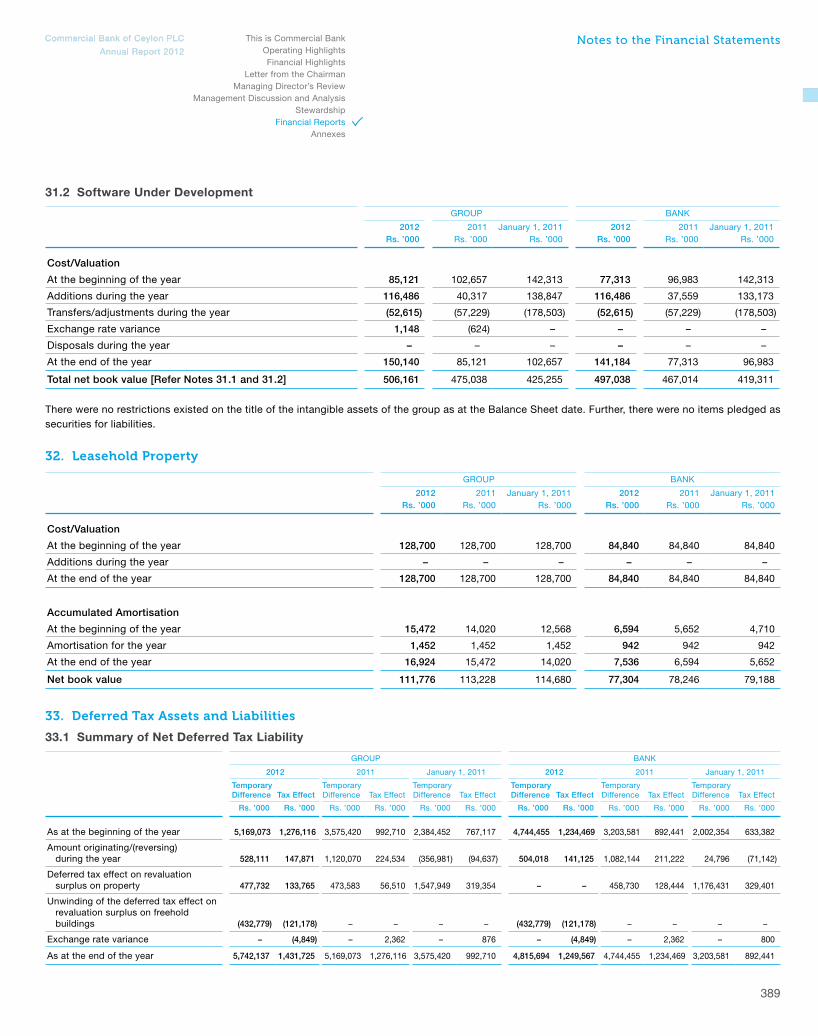
Commercial Bank of Ceylon PLCCommercial Bank of Ceylon PLC
Annual Report 2012Annual Report 2012
This is Commercial BankOperating HighlightsFinancial Highlights
Letter from the ChairmanManaging Director’s Review
Management Discussion and AnalysisStewardship
Financial ReportsAnnexes
389
31.2 Software Under Development
GROUP BANK
2012 2011 January 1, 2011 2012 2011 January 1, 2011Rs. ’000 Rs. ’000 Rs. ’000 Rs. ’000 Rs. ’000 Rs. ’000
Cost/Valuation
At the beginning of the year 85,121 102,657 142,313 77,313 96,983 142,313
Additions during the year 116,486 40,317 138,847 116,486 37,559 133,173
Transfers/adjustments during the year (52,615) (57,229) (178,503) (52,615) (57,229) (178,503)
Exchange rate variance 1,148 (624) – – – –
Disposals during the year – – – – – –
At the end of the year 150,140 85,121 102,657 141,184 77,313 96,983
Total net book value [Refer Notes 31.1 and 31.2] 506,161 475,038 425,255 497,038 467,014 419,311
There were no restrictions existed on the title of the intangible assets of the group as at the Balance Sheet date. Further, there were no items pledged as securities for liabilities.
32. Leasehold Property
GROUP BANK
2012 2011 January 1, 2011 2012 2011 January 1, 2011Rs. ’000 Rs. ’000 Rs. ’000 Rs. ’000 Rs. ’000 Rs. ’000
Cost/Valuation
At the beginning of the year 128,700 128,700 128,700 84,840 84,840 84,840
Additions during the year – – – – – –
At the end of the year 128,700 128,700 128,700 84,840 84,840 84,840
Accumulated Amortisation
At the beginning of the year 15,472 14,020 12,568 6,594 5,652 4,710
Amortisation for the year 1,452 1,452 1,452 942 942 942
At the end of the year 16,924 15,472 14,020 7,536 6,594 5,652
Net book value 111,776 113,228 114,680 77,304 78,246 79,188
33. Deferred Tax Assets and Liabilities
33.1 Summary of Net Deferred Tax Liability
GROUP BANK
2012 2011 January 1, 2011 2012 2011 January 1, 2011
Temporary Difference Tax Effect
Temporary Difference Tax Effect
Temporary Difference Tax Effect
Temporary Difference Tax Effect
Temporary Difference Tax Effect
Temporary Difference Tax Effect
Rs. ’000 Rs. ’000 Rs. ’000 Rs. ’000 Rs. ’000 Rs. ’000 Rs. ’000 Rs. ’000 Rs. ’000 Rs. ’000 Rs. ’000 Rs. ’000
As at the beginning of the year 5,169,073 1,276,116 3,575,420 992,710 2,384,452 767,117 4,744,455 1,234,469 3,203,581 892,441 2,002,354 633,382
Amount originating/(reversing) during the year 528,111 147,871 1,120,070 224,534 (356,981) (94,637) 504,018 141,125 1,082,144 211,222 24,796 (71,142)
Deferred tax effect on revaluation surplus on property 477,732 133,765 473,583 56,510 1,547,949 319,354 – – 458,730 128,444 1,176,431 329,401
Unwinding of the deferred tax effect on revaluation surplus on freehold buildings (432,779) (121,178) – – – – (432,779) (121,178) – – – –
Exchange rate variance – (4,849) – 2,362 – 876 – (4,849) – 2,362 – 800
As at the end of the year 5,742,137 1,431,725 5,169,073 1,276,116 3,575,420 992,710 4,815,694 1,249,567 4,744,455 1,234,469 3,203,581 892,441
Notes to the Financial Statements

Commercial Bank of Ceylon PLCCommercial Bank of Ceylon PLC
Annual Report 2012Annual Report 2012
This is Commercial BankOperating HighlightsFinancial Highlights
Letter from the ChairmanManaging Director’s ReviewManagement Discussion and AnalysisStewardshipFinancial ReportsAnnexes
390
33.2 Reconciliation of Net Deferred Tax Liability
GROUP BANK
Balance Sheet Income Statement Balance Sheet Income Statement
2012 2011January 1,
2011 2012 2011 2012 2011January 1,
2011 2012 2011Rs. ’000 Rs. ’000 Rs. ’000 Rs. ’000 Rs. ’000 Rs. ’000 Rs. ’000 Rs. ’000 Rs. ’000 Rs. ’000
Deferred Tax Liabilities on:
Accelerated depreciation for tax purposes - Own assets 342,038 341,626 257,840 (412) (83,805) 312,132 324,130 246,310 11,998 (77,820)
Accelerated depreciation for tax purposes - Leased assets 1,049,259 812,102 433,777 (237,157) (378,325) 1,049,259 812,102 433,777 (237,157) (378,325)
Revaluation surplus on freehold buildings 619,855 486,090 429,580 – – 457,845 457,845 329,401 – –
Unwinding of the deferred tax effect on revaluation surplus on freehold buildings (121,178) – – – – (121,178) – – – –
Effect of exchange rate variance 9 9 9 (4,849) 2,362 9 9 9 (4,849) 2,362
1,889,983 1,639,827 1,121,206 (242,418) (459,768) 1,698,067 1,594,086 1,009,497 (230,008) (453,783)
Deferred Tax Assets on:
Finance leases 5,090 2,208 9,152 2,882 (6,944) – – – – –
Defined benefit plans 203,903 134,150 110,446 69,753 23,704 199,234 132,264 108,158 66,970 24,106
General provision on loans and advances 18,567 14,706 8,898 3,861 5,808 18,568 14,706 8,898 3,862 5,808
Specific provision on lease receivable 119,536 119,536 – – 119,536 119,536 119,536 – – 119,536
Leave encashment 111,162 93,111 – 18,051 93,111 111,162 93,111 – 18,051 93,111
458,258 363,711 128,496 94,547 235,215 448,500 359,617 117,056 88,883 242,561
Deferred income tax on income/ (expenses) – – – (147,871) (224,553) – – (141,125) (211,222)
Net deferred tax liability 1,431,725 1,276,116 992,710 1,249,567 1,234,469 892,441
34. Other Assets
GROUP BANK
2012 2011 January 1, 2011 2012 2011 January 1, 2011Rs. ’000 Rs. ’000 Rs. ’000 Rs. ’000 Rs. ’000 Rs. ’000
Receivable 34,999 20,091 13,291 34,999 20,091 13,291
Deposits and prepayments 1,365,559 586,296 507,343 1,358,727 547,037 510,925
Clearing account balance 4,126,806 3,581,426 2,599,857 4,126,806 3,581,426 2,599,857
Unamortised staff cost 2,106,871 1,792,580 1,591,862 2,106,768 1,792,551 1,591,817
Other accounts 1,544,909 1,309,905 1,045,017 1,560,906 1,349,409 1,053,736
Total 9,179,144 7,290,298 5,757,370 9,188,206 7,290,514 5,769,626
35. Due to BanksBorrowings 4,763,565 11,574,105 6,118,915 4,763,565 11,574,105 6,118,915
Local Currency borrowings 65,018 2,754,484 3,390,933 65,018 2,754,484 3,390,933
Foreign Currency borrowings 4,698,547 8,819,621 2,727,982 4,698,547 8,819,621 2,727,982
Total 4,763,565 11,574,105 6,118,915 4,763,565 11,574,105 6,118,915
Notes to the Financial Statements

Commercial Bank of Ceylon PLCCommercial Bank of Ceylon PLC
Annual Report 2012Annual Report 2012
This is Commercial BankOperating HighlightsFinancial Highlights
Letter from the ChairmanManaging Director’s Review
Management Discussion and AnalysisStewardship
Financial ReportsAnnexes
391
GROUP BANK
2012 2011 January 1, 2011 2012 2011 January 1, 2011Rs. ’000 Rs. ’000 Rs. ’000 Rs. ’000 Rs. ’000 Rs. ’000
36. Derivative Financial InstrumentsInterest rate derivatives
Interest rate swaps – – 806 – – 806
Foreign currency derivatives
Forward foreign exchange contracts 84,291 435,171 26,274 84,291 435,171 26,274
Total 84,291 435,171 27,080 84,291 435,171 27,080
37. Due to Other Customers
At amortised cost
Local currency deposits 291,139,626 248,864,952 193,969,595 291,168,788 248,874,072 194,003,940
Foreign currency deposits 99,429,056 74,832,676 69,662,107 99,442,760 74,880,676 69,662,107
Sub total 390,568,682 323,697,628 263,631,702 390,611,548 323,754,748 263,666,047
37.1 An Analysis of Due to Customers(a) By product
Current account deposits 32,076,534 30,919,255 28,529,532 32,076,534 30,919,280 28,560,442
Savings deposits 141,810,844 136,040,261 117,894,801 141,840,006 136,049,356 117,898,236
Time deposits 208,095,610 150,182,539 112,309,751 208,109,314 150,230,539 112,309,751
Certificates of deposits 8,585,694 6,555,573 4,897,618 8,585,694 6,555,573 4,897,618
Sub total 390,568,682 323,697,628 263,631,702 390,611,548 323,754,748 263,666,047
(b) By currency
Sri Lanka rupee 291,139,626 248,864,952 193,969,595 291,168,788 248,874,072 194,003,940
United State dollar 52,783,593 38,384,040 31,451,361 52,797,297 38,432,040 31,451,361
Bangladesh taka 24,964,651 16,777,348 19,457,975 24,964,651 16,777,348 19,457,975
Great Britain pound 6,476,478 6,024,260 6,279,427 6,476,478 6,024,260 6,279,427
Australian dollar 8,322,024 7,423,510 6,133,964 8,322,024 7,423,510 6,133,964
Euro currency 5,591,752 5,244,070 5,526,169 5,591,752 5,244,070 5,526,169
Other currencies 1,290,558 979,448 813,211 1,290,558 979,448 813,211
Sub total 390,568,682 323,697,628 263,631,702 390,611,548 323,754,748 263,666,047
(c) By institutes/customers
Deposits from Banks 2,957,256 1,280,547 59,659 2,957,256 1,280,547 59,659
Deposits from Finance Companies 3,004,452 2,302,574 2,538,869 3,004,452 2,302,574 2,538,869
Deposits from other Customers 384,606,974 320,114,507 261,033,174 384,649,840 320,171,627 261,067,519
Sub total 390,568,682 323,697,628 263,631,702 390,611,548 323,754,748 263,666,047
The maturity analysis of Deposits is given in Note 50.
Notes to the Financial Statements

Commercial Bank of Ceylon PLCCommercial Bank of Ceylon PLC
Annual Report 2012Annual Report 2012
This is Commercial BankOperating HighlightsFinancial Highlights
Letter from the ChairmanManaging Director’s ReviewManagement Discussion and AnalysisStewardshipFinancial ReportsAnnexes
392
GROUP BANK
2012 2011 January 1, 2011 2012 2011 January 1, 2011Rs. ’000 Rs. ’000 Rs. ’000 Rs. ’000 Rs. ’000 Rs. ’000
38. Other BorrowingsRefinance Borrowings 7,633,595 8,367,697 8,258,309 7,633,595 8,367,697 8,258,309
Securities sold under repurchase (repo) agreements 31,612,350 41,087,308 45,655,604 31,759,604 41,235,445 45,774,453
IFC Borrowings 8,320,000 – – 8,320,000 – –
Total 47,565,945 49,455,005 53,913,913 47,713,199 49,603,142 54,032,762
39. Other ProvisionsProvision for contingencies 2,409 535 2,369 2,409 535 2,369
Total 2,409 535 2,369 2,409 535 2,369
40. Other LiabilitiesAccrued expenditure 1,856,614 1,264,265 1,358,556 1,850,635 1,251,500 1,347,203
Cheques sent on clearing 4,150,799 3,528,970 2,490,740 4,150,799 3,528,970 2,490,740
Provision for gratuity payable [Refer Note 40.1] 494,507 317,114 242,841 478,506 303,773 232,441
Provision for Un-funded pension scheme [Refer Note 40.2] 227,637 141,072 129,309 227,637 141,072 129,309
Payable on oil hedging transactions 794,108 707,252 689,881 794,108 707,252 689,881
Impairment charges in respect of off-balance sheet credit exposure – – – – – –
Other payable 2,893,548 2,255,326 2,473,263 2,861,123 2,229,815 2,450,215
Total 10,417,213 8,213,999 7,384,590 10,362,808 8,162,382 7,339,789
40.1 Provision for Gratuity PayableAt the beginning of the year 317,115 242,841 176,201 303,774 232,441 167,463
Expense recognised in the income statement [Refer Note 40.1 (a)] 179,083 89,691 79,287 174,680 86,750 77,625
Exchange difference 9,509 (6,016) (2,766) 9,509 (6,016) (2,766)
Paid during the year (11,200) (9,401) (9,881) (9,457) (9,401) (9,881)
At the end of the year 494,507 317,115 242,841 478,506 303,774 232,441
40.1 (a) Gratuity Expense Recognised in the Income Statement
Interest cost 26,090 19,325 14,446 25,062 18,508 13,640
Current service cost 63,547 41,765 34,360 62,142 40,672 33,397
Provision made during the year 56,594 15,296 12,999 55,758 14,461 12,184
Actuarial loss 32,852 13,305 17,482 31,718 13,109 18,404
Total 179,083 89,691 79,287 174,680 86,750 77,625
Notes to the Financial Statements

Commercial Bank of Ceylon PLCCommercial Bank of Ceylon PLC
Annual Report 2012Annual Report 2012
This is Commercial BankOperating HighlightsFinancial Highlights
Letter from the ChairmanManaging Director’s Review
Management Discussion and AnalysisStewardship
Financial ReportsAnnexes
393
GROUP BANK
2012 2011 January 1, 2011 2012 2011 January 1, 2011Rs. ’000 Rs. ’000 Rs. ’000 Rs. ’000 Rs. ’000 Rs. ’000
40.2 Provision for Un-funded Pension SchemeAt the beginning of the year 141,072 129,309 119,072 141,072 129,309 119,072
Expense recognised in the income statement 49,710 31,719 29,382 49,710 31,719 29,382
Paid during the year (23,388) (19,956) (19,145) (23,388) (19,956) (19,145)
At the end of the year 167,394 141,072 129,309 167,394 141,072 129,309
40.2 (a) Pension Expense for Un-funded scheme Recognised in the Income Statement
Interest cost 14,107 12,931 13,098 14,107 12,931 13,098
Current service cost – – 12,394 – – 12,394
Provision made during the year – – – – – –
Actuarial loss 35,603 18,788 3,890 35,603 18,788 3,890
Total 49,710 31,719 29,382 49,710 31,719 29,382
41. Due to SubsidiariesLocal Subsidiaries
Commercial Development Company PLC – – – 7,823 14,735 26,146
ONEzero Company Ltd. – – – 14,441 14,999 15,302
Sub Total – – – 22,264 29,734 41,448
Foreign Subsidiaries
Commex Sri Lanka S.R.L. - Italy – – – – – –
Sub Total – – – – – –
Total – – – 22,264 29,734 41,448
42. Subordinated Term Debts
As at beginning of the year 973,210 2,127,030 3,436,030 973,210 2,127,030 3,436,030
Redemptions during the year – (1,153,820) (1,309,000) – (1,153,820) (1,309,000)
Balance before adjusting for amortised interest [Refer Note 42.1] 973,210 973,210 2,127,030 973,210 973,210 2,127,030
Net effect on amortised interest payable 132,806 132,429 232,215 132,806 132,429 232,215
As at end of the year 1,106,016 1,105,639 2,359,245 1,106,016 1,105,639 2,359,245
Notes to the Financial Statements

Commercial Bank of Ceylon PLCCommercial Bank of Ceylon PLC
Annual Report 2012Annual Report 2012
This is Commercial BankOperating HighlightsFinancial Highlights
Letter from the ChairmanManaging Director’s ReviewManagement Discussion and AnalysisStewardshipFinancial ReportsAnnexes
394
Outstanding debentures as at December 31, 2011, consisted of 973,210 Unsecured Subordinated Redeemable debentures of Rs. 1,000/- each issued by the Bank in 2006, details of which is given below:
42.1 Debenture Categories
BANK
Debenture CategoriesColombo
StockExchange
Listing
InterestPayable
FrequencyAllotment
DateMaturity
Date
Effective Annual Yield Value as at 2012 01.01.2011 31.12.2012 31.12.2011 01.01.2011
% % Rs. ’000 Rs. ’000 Rs. ’000
Fixed Rate Debentures2006/2016 - 13.25% p.a. Not listed Annually 16.05.2006 16.05.2016 13.25 13.25 505,000 505,000 505,000
2006/2013 - 13.75% p.a. Listed Annually 18.12.2006 18.12.2013 13.75 13.75 250 250 250
2006/2016 - 14.00% p.a. Listed Annually 18.12.2006 18.12.2016 14.00 14.00 467,260 467,260 467,260
Debenture Redeemed During the Year2006/2011 - 12.00% p.a. Not listed Annually 16.05.2006 16.05.2011 – 12.00 – – 15,000
2006/2011 - 13.50% p.a. Listed Annually 18.12.2006 18.12.2011 – 13.50 – – 527,800
972,510 972,510 1,515,310
Floating Rate Debentures2006/2013 - 12 months TB rate (Gross) + 1% p.a. Listed Annually 18.12.2006 18.12.2013 9.15 9.40 300 300 300
2006/2016 - 12 months TB rate (Gross) + 1% p.a. Listed Annually 18.12.2006 18.12.2016 9.15 9.40 400 400 400
Debenture Redeemed During the Year2006/2011 - 3 months TB rate (Net) + 2% p.a. Not listed Quarterly 16.05.2006 16.05.2011 – 9.25 – – 15,000
2006/2011 - 3 months TB rate (Gross) + 1% p.a. Not listed Quarterly 16.05.2006 16.05.2011 – 9.05 – – 465,000
2006/2011 - 12 months TB rate (Gross) + 1% p.a. Listed Annually 18.12.2006 18.12.2011 – 9.40 – – 131,020
700 700 611,720
Total debentures 973,210 973,210 2,127,030
12 Months Treasury Bill Rate (Gross) - Twelve months Treasury Bill rate before deducting 10% Withholding Tax as published by the Central Bank of Sri Lanka immediately prior to the commencement of each interest period.
Notes to the Financial Statements

Commercial Bank of Ceylon PLCCommercial Bank of Ceylon PLC
Annual Report 2012Annual Report 2012
This is Commercial BankOperating HighlightsFinancial Highlights
Letter from the ChairmanManaging Director’s Review
Management Discussion and AnalysisStewardship
Financial ReportsAnnexes
395
42.2 Debentures by Maturity
GROUP BANK
2012 2011 January 1, 2011 2012 2011 January 1, 2011Rs. ’000 Rs. ’000 Rs. ’000 Rs. ’000 Rs. ’000 Rs. ’000
Due within 1 year 550 – 1,153,820 550 – 1,153,820
Due after 1 year 972,660 973,210 973,210 972,660 973,210 973,210
Total 973,210 973,210 2,127,030 973,210 973,210 2,127,030
43. Stated Capital
GROUP BANK
As at December 31, 2012 2011 January 1, 2011 2012 2011 January 1, 2011Rs. ’000 Rs. ’000 Rs. ’000 Rs. ’000 Rs. ’000 Rs. ’000
Opening balance 16,473,861 10,811,193 10,607,792 16,473,861 10,811,193 10,607,792
Issue of Ordinary Voting Shares under Employee Share Option Plans 62,942 121,869 203,401 62,942 121,869 203,401
Issue of Ordinary Shares as part of the final dividend satisfied in the form of issue and allotment of new shares 1,471,993 681,141 – 1,471,993 681,141 –
Rights Issue of ordinary voting shares – 4,632,517 – – 4,632,517 –
Rights Issue of ordinary non-voting shares – 227,141 – – 227,141 –
Closing balance 18,008,796 16,473,861 10,811,193 18,008,796 16,473,861 10,811,193
43.1 Movement in Number of Ordinary Shares
No. of Ordinary Voting Shares No. of Ordinary Non-Voting Shares
2012 2011 January 1, 2011 2012 2011 January 1, 2011
Opening balance 765,085,320 353,305,387 233,821,271 52,364,846 24,181,195 16,120,797
Issue of ordinary shares under Employee Share Option Plans 1,341,768 1,457,645 2,081,508 – – –
Issue of ordinary shares as part of the final dividend satisfied in the form of issue and allotment of new shares 13,587,144 2,277,195 – 1,108,902 255,734 –
Rights Issue of ordinary shares – 25,502,433 – – 1,745,494 –
Shares created due to the share split – 382,542,660 117,402,608 – 26,182,423 8,060,398
Closing balance 780,014,232 765,085,320 353,305,387 53,473,748 52,364,846 24,181,195
The shares of Commercial Bank of Ceylon PLC are quoted in the Colombo Stock Exchange. The Non-Voting ordinary shares of the Bank, rank pari passu in respect of all rights with the ordinary voting shares of the Bank except voting rights on resolutions passed at general meetings.
The Bank made a Rights Issue of ordinary shares (both voting & non-voting) on the basis of one new ordinary share for every fourteen shares held in August 2011. The Bank also made a subdivision of shares on the basis of 1:1 immediately after conclusion of the aforesaid Rights Issue of shares. The objective of the rights issue of shares was to increase the Tier-I capital of the Bank in order to facilitate future business growth.
Notes to the Financial Statements

Commercial Bank of Ceylon PLCCommercial Bank of Ceylon PLC
Annual Report 2012Annual Report 2012
This is Commercial BankOperating HighlightsFinancial Highlights
Letter from the ChairmanManaging Director’s ReviewManagement Discussion and AnalysisStewardshipFinancial ReportsAnnexes
396
43.2 Employee Share Option Plan - 2008
The Bank obtained the approval of the shareholders at an Extraordinary General Meeting held on April 16, 2008, to introduce an Employee Share Option Plan for the benefit of all the Executive Officers in Grade III and above by creating up to 3% of the ordinary voting shares at the rate of 1% shares each year over a period of three to five years, upon the Bank achieving specified performance targets.
1/3 of the options offered under each tranche is vested to eligible employees after one year from the date of offer, second 1/3 of the options after two years from the date of offer and final 1/3 after three years from the date of offer as detail below:
Tranche I Total
Date granted April 30, 2008 April 30, 2008 April 30, 2008
Price (Rs.) - (*) & (**) 46.91 46.91 46.91
1/3 of Options 1/3 of Options 1/3 of Options
Exercisable between April 30, 2009 April 30, 2010 April 30, 2011 to April 29, 2013 to April 29, 2014 to April 29, 2015
Original number of options - (***) 777,308 777,308 777,308 2,331,924
Additions consequent to scrip issues 660,824 768,924 1,049,861 2,479,609
Options cancelled due to resignations, retirements and deaths (63,613) (63,613) (63,613) (190,839)
Options vested/to be vested 1,374,519 1,482,619 1,763,556 4,620,694
Options cancelled due to non-acceptance and resignations (4,514) (4,514) (40,011) (49,039)
Number of options exercised up to December 31, 2012 (950,040) (941,060) (942,539) (2,833,639)
Number of options outstanding as at December 31, 2012 419,965 537,045 781,006 1,738,016
(*) Determined on the basis of the weighted average market price of Bank’s voting shares, during the period of ten market days immediately prior to each option offer date.
(**) Adjusted for dividend, paid in the form of shares right issue of shares and sub-division of shares.
(***) Options offered under each Tranche is based on the overall performance of the Bank and the individual performance of the eligible employees in the preceding year. In the event of a right issue of shares, capitalisation of reserves, stock splits or stock dividends by the Bank during the vesting period, the number of options offered and the prices are suitably adjusted as per the applicable rules of ESOP - 2008 which have been drafted in line with the accepted market practices.
Tranche II Total
Date granted April 30, 2011 April 30, 2011 April 30, 2011
Price (Rs.) – (*) 132.33 132.33 132.33
1/3 of Options 1/3 of Options 1/3 of Options
Exercisable between April 30, 2012 April 30, 2013 April 30, 2014 to April 29, 2016 to April 29, 2017 to April 29, 2018
Original number of options - (**) 1,213,384 1,213,384 1,213,384 3,640,152
Additions consequent to share split 1,213,384 1,213,384 1,213,384 3,640,152
Options to be vested as at December 31, 2012 2,426,768 2,426,768 2,426,768 7,280,304
(*) Determined on the basis of the weighted average market price of Bank’s voting shares, during the period of ten market days immediately prior to each option offer date.
(**) Options offered under each tranche is based on the overall performance of the Bank and the individual performance of the eligible employees in the preceding year. In the event of a right issue of shares, capitalisation of reserves, stock splits or stock dividends by the Bank during the vesting period, the number of options offered and the prices are suitably adjusted as per the applicable rules of ESOP - 2008 which are in line with the accepted market practices.
Notes to the Financial Statements

Commercial Bank of Ceylon PLCCommercial Bank of Ceylon PLC
Annual Report 2012Annual Report 2012
This is Commercial BankOperating HighlightsFinancial Highlights
Letter from the ChairmanManaging Director’s Review
Management Discussion and AnalysisStewardship
Financial ReportsAnnexes
397
43.3 Employee Share Option Plan - 2002
The Bank obtained the approval of the shareholders at an Extraordinary General Meeting held in September 2002, to introduce an Employee Share Option Plan for the benefit of all the Executive Officers in Grade III and above by creating up to 5% of the ordinary voting shares at the rate of 1.25% of shares each year over a period of four years, upon the Bank achieving specified performance targets.
The details relating to the four Tranches of the Employee Share Option Plan - 2002 are given below:
Tranche I Tranche II Tranche III Tranche IV Total
Date granted March 31, 2003 March 31, 2004 March 31, 2005 March 31, 2006
Price (Rs.) - (*) 36.00 57.85 56.13 74.25
Exercisable between April 01, 2004 April 01, 2005 April 01, 2006 April 01, 2007to March 31,
2008 to March 31,
2009to March 31,
2010to March 31,
2011
Original number of options - (**) 650,000 812,500 1,637,947 1,659,756 4,760,203
Additions consequent to scrip issues – 17,922 241,051 1,193,196 1,452,169
Options cancelled due to non-acceptance and resignations (25,057) (28,293) (42,327) (161,882) (257,559)
Number of options exercised up to December 31, 2011 (624,943) (802,129) (1,836,671) (2,691,070) (5,954,813)
Number of options outstanding as at December 31, 2012 – – – – –
(*) Determined on the basis of the weighted average price of the voting shares of the Bank between October 1, and December 31, of each year.
(**) Options under each Tranche is based on the overall performance of the Bank and the individual performance of the eligible employees in the preceding year. In the event of a bonus, share split or/and rights issue of shares during the vesting period, the number of options offered and the prices are suitably amended in line with the accepted market practices.
44. Statutory Reserves
44.1 Statutory Reserve Fund
GROUP BANK
2012 2011 January 1, 2011 2012 2011 January 1, 2011Rs. ’000 Rs. ’000 Rs. ’000 Rs. ’000 Rs. ’000 Rs. ’000
Opening balance 2,740,901 2,338,510 2,062,346 2,740,901 2,338,510 2,062,346
Transfers during the year 504,917 402,391 276,164 504,917 402,391 276,164
Closing balance 3,245,818 2,740,901 2,338,510 3,245,818 2,740,901 2,338,510
The balance in the Statutory Reserve Fund will be used only for the purposes specified in the Section 20 (2) of the Banking Act No. 30 of 1988.
44.2 Primary Dealer Special Risk Reserve
GROUP BANK
2012 2011 January 1, 2011 2012 2011 January 1, 2011Rs. ’000 Rs. ’000 Rs. ’000 Rs. ’000 Rs. ’000 Rs. ’000
Opening balance 149,404 133,320 101,791 149,404 133,320 101,791
Transfers during the year 38,173 16,084 31,529 38,173 16,084 31,529
Closing balance 187,577 149,404 133,320 187,577 149,404 133,320
Total Statutory Reserves 3,433,395 2,890,305 2,471,830 3,433,395 2,890,305 2,471,830
As per the Direction issued by the Public Debt Department of Central Bank of Sri Lanka on April 18, 2005, with effect from July 1, 2005 Primary Dealers who maintain a capital above Rs. 300 Mn. are required to allocate 25% of post–tax profits of the Primary Dealer Unit to a special risk reserve annually.
Notes to the Financial Statements

Commercial Bank of Ceylon PLCCommercial Bank of Ceylon PLC
Annual Report 2012Annual Report 2012
This is Commercial BankOperating HighlightsFinancial Highlights
Letter from the ChairmanManaging Director’s ReviewManagement Discussion and AnalysisStewardshipFinancial ReportsAnnexes
398
45. Retained Earnings
GROUP BANK
2012 2011 2012 2011Rs. ’000 Rs. ’000 Rs. ’000 Rs. ’000
Opening balance 2,588,194 1,348,994 2,547,336 1,515,928
Effect of transitional provision – – – (153,134)
Adjusted opening balance 2,588,194 1,348,994 2,547,336 1,362,794
Total comprehensive Income 10,050,862 7,937,527 10,098,329 7,882,869
Profit for the year 10,079,829 7,932,062 10,098,329 7,882,869
Other comprehensive Income (28,967) 5,465 – –
Transfer to other reserves (4,355,215) (3,141,056) (4,355,215) (3,141,056)
Dividends (4,112,370) (3,557,271) (4,112,370) (3,557,271)
Write-back of dividend payable 1,343 – – –
Closing Balance 4,172,814 2,588,194 4,178,080 2,547,336
46. Other Reserves
a. Current Year - 2012
GROUP BANK
OpeningBalance
Movement/Transfers
Closing Balance
OpeningBalance
Movement/Transfers
Closing Balance
Rs. ’000 Rs. ’000 Rs. ’000 Rs. ’000 Rs. ’000 Rs. ’000
Revaluation Reserve (Refer Note 46.1) 4,550,836 186,289 4,737,125 4,222,054 121,178 4,343,232
General Reserve (Refer Note 46.2) 17,889,471 2,159,518 20,048,989 17,889,471 2,159,518 20,048,989
Available-for-sale reserve (Refer Note 46.3) (143,969) 619,436 475,467 (143,969) 619,436 475,467
Foreign Currency Translation Reserve (Refer Note 46.4) (1,303,646) 548,545 (755,101) (1,308,721) 550,827 (757,894)
Investment Fund Reserve (Refer Note 46.5) 1,194,328 1,652,607 2,846,935 1,194,328 1,652,607 2,846,935
Total 22,187,020 5,166,395 27,353,415 21,853,163 5,103,566 26,956,729
b. Previous Year - 2011
GROUP BANK
OpeningBalance
Movement/Transfers
Closing Balance
OpeningBalance
Movement/Transfers
Closing Balance
Rs. ’000 Rs. ’000 Rs. ’000 Rs. ’000 Rs. ’000 Rs. ’000
Revaluation Reserve (Refer Note 46.1) 2,943,222 1,607,614 4,550,836 2,696,171 1,525,883 4,222,054
General Reserve (Refer Note 46.2) 16,361,218 1,528,253 17,889,471 16,361,218 1,528,253 17,889,471
Available-for-sale reserve (Refer Note 46.3) 815,950 (959,919) (143,969) 815,950 (959,919) (143,969)
Foreign Currency Translation Reserve (Refer Note 46.4) (549,738) (753,908) (1,303,646) (554,288) (754,433) (1,308,721)
Investment Fund Reserve (Refer Note 46.5) – 1,194,328 1,194,328 – 1,194,328 1,194,328
Total 19,570,652 2,616,368 22,187,020 19,319,051 2,534,112 21,853,163
Notes to the Financial Statements
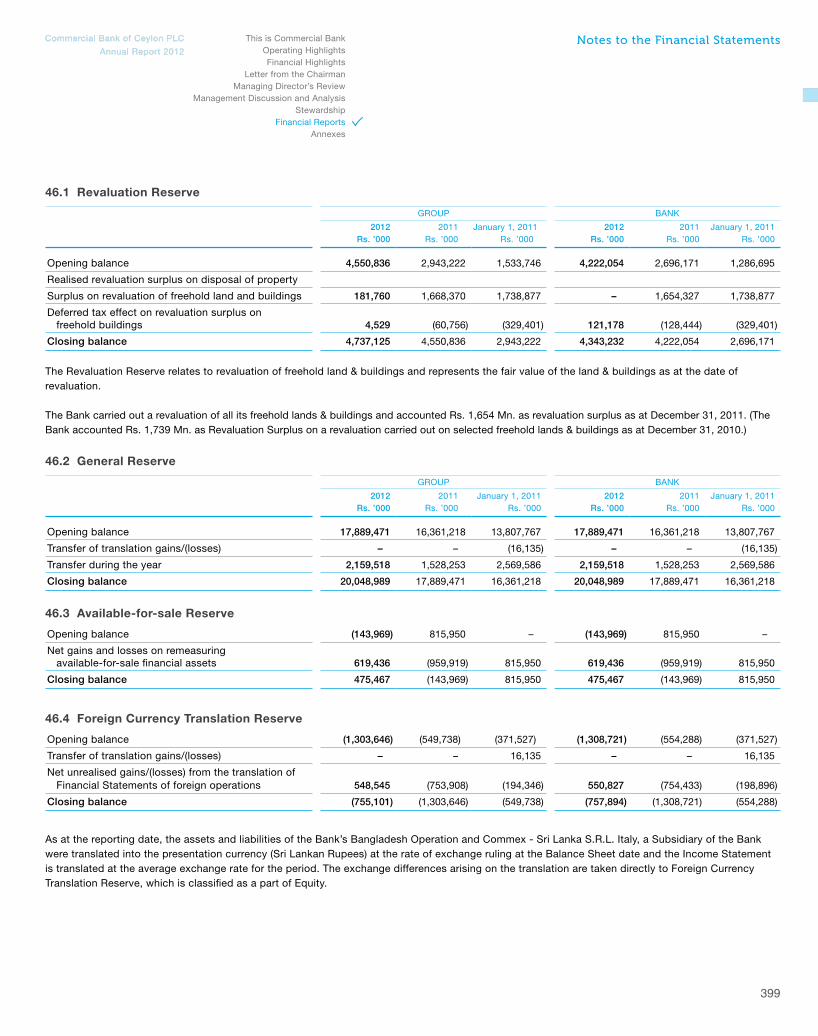
Commercial Bank of Ceylon PLCCommercial Bank of Ceylon PLC
Annual Report 2012Annual Report 2012
This is Commercial BankOperating HighlightsFinancial Highlights
Letter from the ChairmanManaging Director’s Review
Management Discussion and AnalysisStewardship
Financial ReportsAnnexes
399
46.1 Revaluation Reserve
GROUP BANK
2012 2011 January 1, 2011 2012 2011 January 1, 2011Rs. ’000 Rs. ’000 Rs. ’000 Rs. ’000 Rs. ’000 Rs. ’000
Opening balance 4,550,836 2,943,222 1,533,746 4,222,054 2,696,171 1,286,695
Realised revaluation surplus on disposal of property
Surplus on revaluation of freehold land and buildings 181,760 1,668,370 1,738,877 – 1,654,327 1,738,877
Deferred tax effect on revaluation surplus on freehold buildings 4,529 (60,756) (329,401) 121,178 (128,444) (329,401)
Closing balance 4,737,125 4,550,836 2,943,222 4,343,232 4,222,054 2,696,171
The Revaluation Reserve relates to revaluation of freehold land & buildings and represents the fair value of the land & buildings as at the date of revaluation.
The Bank carried out a revaluation of all its freehold lands & buildings and accounted Rs. 1,654 Mn. as revaluation surplus as at December 31, 2011. (The Bank accounted Rs. 1,739 Mn. as Revaluation Surplus on a revaluation carried out on selected freehold lands & buildings as at December 31, 2010.)
46.2 General Reserve
GROUP BANK
2012 2011 January 1, 2011 2012 2011 January 1, 2011Rs. ’000 Rs. ’000 Rs. ’000 Rs. ’000 Rs. ’000 Rs. ’000
Opening balance 17,889,471 16,361,218 13,807,767 17,889,471 16,361,218 13,807,767
Transfer of translation gains/(losses) – – (16,135) – – (16,135)
Transfer during the year 2,159,518 1,528,253 2,569,586 2,159,518 1,528,253 2,569,586
Closing balance 20,048,989 17,889,471 16,361,218 20,048,989 17,889,471 16,361,218
46.3 Available-for-sale Reserve
Opening balance (143,969) 815,950 – (143,969) 815,950 –
Net gains and losses on remeasuring available-for-sale financial assets 619,436 (959,919) 815,950 619,436 (959,919) 815,950
Closing balance 475,467 (143,969) 815,950 475,467 (143,969) 815,950
46.4 Foreign Currency Translation Reserve
Opening balance (1,303,646) (549,738) (371,527) (1,308,721) (554,288) (371,527)
Transfer of translation gains/(losses) – – 16,135 – – 16,135
Net unrealised gains/(losses) from the translation of Financial Statements of foreign operations 548,545 (753,908) (194,346) 550,827 (754,433) (198,896)
Closing balance (755,101) (1,303,646) (549,738) (757,894) (1,308,721) (554,288)
As at the reporting date, the assets and liabilities of the Bank’s Bangladesh Operation and Commex - Sri Lanka S.R.L. Italy, a Subsidiary of the Bank were translated into the presentation currency (Sri Lankan Rupees) at the rate of exchange ruling at the Balance Sheet date and the Income Statement is translated at the average exchange rate for the period. The exchange differences arising on the translation are taken directly to Foreign Currency Translation Reserve, which is classified as a part of Equity.
Notes to the Financial Statements

Commercial Bank of Ceylon PLCCommercial Bank of Ceylon PLC
Annual Report 2012Annual Report 2012
This is Commercial BankOperating HighlightsFinancial Highlights
Letter from the ChairmanManaging Director’s ReviewManagement Discussion and AnalysisStewardshipFinancial ReportsAnnexes
400
46.5 Investment Fund Reserve
GROUP BANK
2012 2011 January 1, 2011 2012 2011 January 1, 2011Rs. ’000 Rs. ’000 Rs. ’000 Rs. ’000 Rs. ’000 Rs. ’000
Opening balance 1,194,328 – – 1,194,328 – –
Transfer during the year 1,652,607 1,194,328 – 1,652,607 1,194,328 –
Closing balance 2,846,935 1,194,328 – 2,846,935 1,194,328 –
Banks are required to transfer 8% of the profits calculated for the payment of Value Added Tax (VAT) on financial services and 5% of the profits before tax calculated for the payments of income tax to a fund identified as a ‘Investment Fund Account’ (IFA) as per a proposal made in the Government Budget 2011. The guidelines has also been issued by the Central Bank of Sri Lanka on utilisation of funds in this account.
The Bank provided funds for several projects utilising funds available in the IFA. The details of loans granted under IFA are as follows:
SectorAmount Granted
(Rs. Mn.)Rate of Interest
(%)Tenure of
Loan
Infrastructure development 1,475.540 9.00 - 14.03 14 - 14 1/2 Years
Factory/mills modernisation 167.309 15.62 - 16.05 5 - 5 1/2 Years
Construction of hotels and for related purposes 122.417 16.05 - 16.30 7 - 8 Years
Agriculture 43.495 14.65 5 1/2 Years
1,808.761
47. Non-Controlling Interest
GROUP BANK
2012 2011 January 1, 2011 2012 2011 January 1, 2011Rs. ’000 Rs. ’000 Rs. ’000 Rs. ’000 Rs. ’000 Rs. ’000
Commercial Development Company PLC 32,141 29,589 26,601 – – –
Total 32,141 29,589 26,601 – – –
48. Contingent Liabilities and Commitments
In the normal course of business the Bank makes various irrevocable commitments and incurs certain contingent liabilities with legal recourse to its customers. Even though these obligations may not be recognised on the Balance Sheet, they do contain credit risk and are therefore form part of the overall risk profile of the Bank.
48.1 Contingencies
GROUP BANK
2012 2011 January 1, 2011 2012 2011 January 1, 2011Rs. ’000 Rs. ’000 Rs. ’000 Rs. ’000 Rs. ’000 Rs. ’000
Contingent Liabilities:
Guarantees 23,997,143 22,749,683 28,282,590 23,997,143 22,749,683 28,282,590
Performance bonds 7,698,090 7,698,090 6,127,722 7,698,090 7,698,090 6,127,722
Documentary credits 19,566,782 22,100,971 20,427,159 19,566,782 22,100,971 20,427,159
Other contingent liabilities [Refer Note 48.1(a)] 29,273,645 29,817,113 23,015,415 29,273,645 29,817,113 23,015,415
Total contingent liabilities 80,535,660 82,365,857 77,852,886 80,535,660 82,365,857 77,852,886
Notes to the Financial Statements
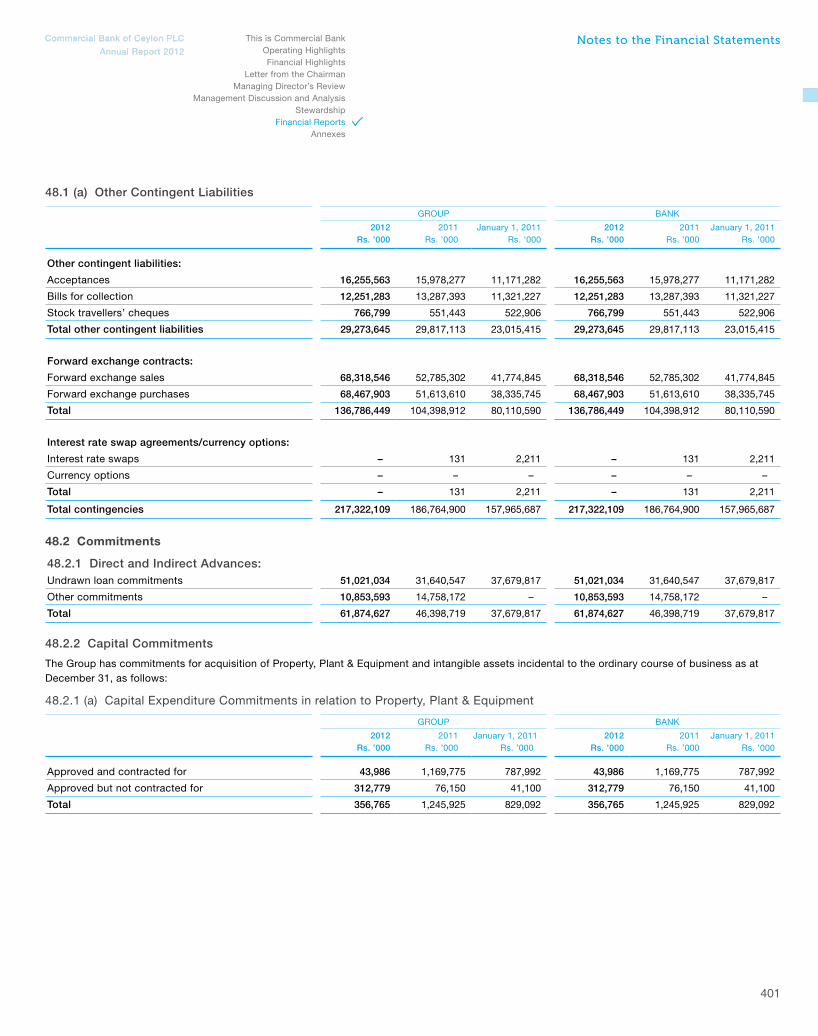
Commercial Bank of Ceylon PLCCommercial Bank of Ceylon PLC
Annual Report 2012Annual Report 2012
This is Commercial BankOperating HighlightsFinancial Highlights
Letter from the ChairmanManaging Director’s Review
Management Discussion and AnalysisStewardship
Financial ReportsAnnexes
401
48.1 (a) Other Contingent Liabilities
GROUP BANK
2012 2011 January 1, 2011 2012 2011 January 1, 2011Rs. ’000 Rs. ’000 Rs. ’000 Rs. ’000 Rs. ’000 Rs. ’000
Other contingent liabilities:
Acceptances 16,255,563 15,978,277 11,171,282 16,255,563 15,978,277 11,171,282
Bills for collection 12,251,283 13,287,393 11,321,227 12,251,283 13,287,393 11,321,227
Stock travellers’ cheques 766,799 551,443 522,906 766,799 551,443 522,906
Total other contingent liabilities 29,273,645 29,817,113 23,015,415 29,273,645 29,817,113 23,015,415
Forward exchange contracts:
Forward exchange sales 68,318,546 52,785,302 41,774,845 68,318,546 52,785,302 41,774,845
Forward exchange purchases 68,467,903 51,613,610 38,335,745 68,467,903 51,613,610 38,335,745
Total 136,786,449 104,398,912 80,110,590 136,786,449 104,398,912 80,110,590
Interest rate swap agreements/currency options:
Interest rate swaps – 131 2,211 – 131 2,211
Currency options – – – – – –
Total – 131 2,211 – 131 2,211
Total contingencies 217,322,109 186,764,900 157,965,687 217,322,109 186,764,900 157,965,687
48.2 Commitments
48.2.1 Direct and Indirect Advances:Undrawn loan commitments 51,021,034 31,640,547 37,679,817 51,021,034 31,640,547 37,679,817
Other commitments 10,853,593 14,758,172 – 10,853,593 14,758,172 –
Total 61,874,627 46,398,719 37,679,817 61,874,627 46,398,719 37,679,817
48.2.2 Capital Commitments
The Group has commitments for acquisition of Property, Plant & Equipment and intangible assets incidental to the ordinary course of business as at December 31, as follows:
48.2.1 (a) Capital Expenditure Commitments in relation to Property, Plant & Equipment
GROUP BANK
2012 2011 January 1, 2011 2012 2011 January 1, 2011Rs. ’000 Rs. ’000 Rs. ’000 Rs. ’000 Rs. ’000 Rs. ’000
Approved and contracted for 43,986 1,169,775 787,992 43,986 1,169,775 787,992
Approved but not contracted for 312,779 76,150 41,100 312,779 76,150 41,100
Total 356,765 1,245,925 829,092 356,765 1,245,925 829,092
Notes to the Financial Statements

Commercial Bank of Ceylon PLCCommercial Bank of Ceylon PLC
Annual Report 2012Annual Report 2012
This is Commercial BankOperating HighlightsFinancial Highlights
Letter from the ChairmanManaging Director’s ReviewManagement Discussion and AnalysisStewardshipFinancial ReportsAnnexes
402
48.2.1 (b) Capital Expenditure Commitments in relation to Intangible Assets
GROUP BANK
2012 2011 January 1, 2011 2012 2011 January 1, 2011Rs. ’000 Rs. ’000 Rs. ’000 Rs. ’000 Rs. ’000 Rs. ’000
Approved and contracted for 39,611 141,625 142,570 39,611 141,625 142,570
Approved but not contracted for – – – – – –
Total 39,611 141,625 142,570 39,611 141,625 142,570
Total of capital commitments 396,376 1,387,550 971,662 396,376 1,387,550 971,662
Total commitments 62,271,003 47,786,269 38,651,479 62,271,003 47,786,269 38,651,479
Total contingent liabilities and commitments 279,593,112 234,551,169 196,617,166 279,593,112 234,551,169 196,617,166
48.3 Commitments of Subsidiaries and Associates
(a) Contingencies of Subsidiaries
The Subsidiaries of the Group do not have any contingencies as at the year end.
(b) Contingencies of Associates
The Associates of the Group do not have any contingencies as at the year end.
49. Litigation Against the Bank
Litigation is a common occurrence in the banking industry due to the nature of the business. The Bank has an established protocol for dealing with such legal claims. Once professional advice has been obtained on the certainty of the outcome and the amount of damages reasonably estimated, the Bank makes adjustments to account for any adverse effects which the claims may have on its financial standing. Set out below are unresolved legal claims against the Bank as at the year end for which adjustments to the Financial Statements have not been made due to the uncertainty of its outcome.
(i) Court action has been initiated by a customer in proceedings No. 25085/MR to recover a sum of US $ 27,500 alleged to have been paid by the Bank in pursuance of a guarantee issued, by debiting the customer’s account without the authority of the customer. Judgment was delivered dismissing the Plaintiff’s action. plaintiff has lodged an appeal against the judgment. Argument is fixed for March 04, 2013.
(ii) Court action has been initiated by two customers in proceedings No. 174/2008/MR to claim Rs. 33.000 Mn. and a further sum of 0.688 Mn. as damages for alleged un-authorised transactions which had not been sanctioned by the Plaintiffs. One of the Plaintiffs has taken up the position that he did not receive the proceeds of the housing loan which had been obtained from the Bank. Further trial is fixed for May 28, 2013.
(iii) Court action has been initiated by a third party in proceedings No. 0122/2009/DLM to claim the title of a property which has been mortgaged to the Bank by the present owner for several facilities granted. The value of action is Rs. 85.000 Mn. Written submissions of all parties are due on March 21, 2013.
(iv) Court action has been initiated by a third party in proceedings No. DMR 02827-11 to claim a sum of Rs. 5.660 Mn. together with interest as damages from the Bank and another party with regard to encashing of a cheque. Trial is fixed for May 09, 2013.
(v) Court action has been initiated by a customer in proceedings No. 236/2011/MR challenging the Bank for transferring a vehicle in the name of a relation of the plaintiff upon settlement of full amount due in respect of a lease facility obtained from the Bank. The Bank has executed the transfer on the strength of a letter issued by the plaintiff who is challenging the letter. The value of the action is Rs. 3.500 Mn. Settlement of admissions and issues are due on March 27, 2013.
(vi) Court action has been initiated by a third party in proceedings No. 112/2005(1) to claim Rs. 5.584 Mn. plus Rs. 10.000 Mn. as damages for disposing of the shares owned by her which were held under lien to the Bank. Plaintiff alleges that the transaction has taken place without obtaining her consent. Judgment was delivered in favour of the Plaintiff. Bank has appealed against the judgment delivered. The plaintiff has filed an application for the issue of Writ Pending Appeal. Next hearing of the case is fixed for April 04, 2013.
Notes to the Financial Statements

Commercial Bank of Ceylon PLCCommercial Bank of Ceylon PLC
Annual Report 2012Annual Report 2012
This is Commercial BankOperating HighlightsFinancial Highlights
Letter from the ChairmanManaging Director’s Review
Management Discussion and AnalysisStewardship
Financial ReportsAnnexes
403
(vii) Court action has been initiated by a customer in proceedings No. 36/96 (1) to claim a sum of Rs. 183.050 Mn. on account of a forward exchange contract. Judgment was delivered in favour of the Bank dismissing the plaintiff’s action but the plaintiff has appealed against the judgment in Supreme Court. The appeal case is fixed to be mentioned on March 22, 2013.
(viii) Court action has been initiated by a third party in proceedings No. 571/2008/MR to prevent the Bank from exercising the right of lien and set off a deposit of the plaintiff amounting to US $ 15.000 Mn. against a claim made by the Bank in terms of a hedging Agreement. Court dismissed plaintiff’s application for an interim injunction. The parties have filed their initial pleadings and the 1st witness was called to give evidence. The case was postponed to June 26, 2013 and July 03, 2013 for the cross examination.
(ix) Court action has been initiated for BDT 9.153 Mn. (approx. Rs. 14.682 Mn.) in proceedings No. 149/05 against the Credit Agricole Indusuez and the Bank for the breach of contract due to improper termination of a contract between Credit Agricole Indusuez and the plaintiff on network facility provided for Electronic Fund Transfer (EFT). As the Bank was not a party to the contract, the Bank has filed a Statement to the court requesting for a dismissal. Next date of the case has been fixed for March 12, 2013.
(x) Court action has been initiated by a third party in proceedings No. 52/10 to claim a sum of BDT 35.328 Mn. (approx. Rs.56.669 Mn.) from the Bank for illegal withdrawal of money from their account with forged signatures. The Bank is of the view that the Bank is not responsible for any losses occurring due to inadequacy of the security of cheque books. Hence, the Bank decided to submit a written Statement to the court in this regard. Next date of the case is fixed for March 18, 2013 for Service Return.
(xi) Court action has been initiated by an ex customer in proceedings No. DMR 00695/12 to claim Rs. 50.000 Mn. as damages for returning a cheque issued by him to the 2nd defendant of Rs. 1.000 Mn., with the remark ‘A/C Closed’ instead of ‘Stale Cheque’. However, when the cheque was presented to the Bank, the customer had already closed his account and at the same time the cheque was stale. Call to be fixed for trial on March 08, 2013.
50. Maturity Analysis
(a) Group
(i) Maturity analysis of assets of the Group as at December 31, 2012 based on the remaining period at the reporting date to the respective contractual maturity dates is given below:
Up to 3 3 to 12 1 to 3 3 to 5 More than Total as at Total as atMonths Months Years Years 5 Years 31.12.2012 31.12.2011
Rs. ’000 Rs. ’000 Rs. ’000 Rs. ’000 Rs. ’000 Rs. ’000 Rs. ’000
Interest-Earning Assets:
Cash and cash equivalents 5,188,750 126,486 – – – 5,315,236 2,290,527
Balances with Central Banks 3,425 373 – – – 3,798 589,419
Placements with banks 16,162,970 – – – – 16,162,970 11,674,363
Derivative financial instruments – – – – – – –
Other financial assets held for trading 5,718,232 – – – – 5,718,232 6,193,392
Loans and receivables to banks – 95,000 – – – 95,000 104,778
Loans and receivables to other customers 156,613,317 67,572,018 98,572,720 33,821,496 16,277,786 372,857,337 314,326,998
Financial investments - Available-for-sale 23,233,313 20,980,372 9,965,095 2,417,398 1,327,596 57,923,774 61,385,224
As at 31.12.2012 206,920,007 88,774,249 108,537,815 36,238,894 17,605,382 458,076,347
As at 31.12.2011 165,306,542 89,884,906 85,477,858 41,129,150 14,766,244 396,564,701
Notes to the Financial Statements

Commercial Bank of Ceylon PLCCommercial Bank of Ceylon PLC
Annual Report 2012Annual Report 2012
This is Commercial BankOperating HighlightsFinancial Highlights
Letter from the ChairmanManaging Director’s ReviewManagement Discussion and AnalysisStewardshipFinancial ReportsAnnexes
404
Up to 3 3 to 12 1 to 3 3 to 5 More than Total as at Total as atMonths Months Years Years 5 Years 31.12.2012 31.12.2011
Rs. ’000 Rs. ’000 Rs. ’000 Rs. ’000 Rs. ’000 Rs. ’000 Rs. ’000
Non-Interest Earning Assets:
Cash and cash equivalents 14,436,969 – – – – 14,436,969 10,644,468
Balances with Central Banks 12,545,598 4,674,968 289,955 317,678 336,042 18,164,241 16,753,540
Derivative financial instruments 739,406 611,689 – – – 1,351,095 39,612
Other financial assets held for trading 322,878 – – – – 322,878 224,618
Loans and receivables to banks 533,760 – – – – 533,760 475,380
Financial investments - Available-for-sale – – – 15,106 24,312 39,418 30,171
Investments in associates – – – – 93,712 93,712 119,981
Property, plant & equipment – – – – 8,946,881 8,946,881 8,503,211
Intangible assets – – – – 506,161 506,161 475,038
Leasehold property – – – – 111,776 111,776 113,228
Deferred tax assets – – – 458,258 – 458,258 363,711
Other assets 6,038,365 71,001 161,000 148,492 2,760,286 9,179,144 7,290,298
As at 31.12.2012 34,616,976 5,357,658 450,955 939,534 12,779,170 54,144,293
As at 31.12.2011 27,807,311 4,138,598 526,399 797,986 11,762,962 45,033,256
Total Assets - As at 31.12.2012 241,536,983 94,131,907 108,988,770 37,178,428 30,384,552 512,220,640
Total Assets - As at 31.12.2011 193,113,853 94,023,504 86,004,257 41,927,137 26,529,206 441,597,957
Percentage - As at 31.12.2012 47.15 18.38 21.28 7.26 5.93 100.00
Percentage - As at 31.12.2011 43.73 21.29 19.48 9.49 6.01 100.00
(ii) An analysis of the total liabilities and share holders’ funds of the Group as at December 31, 2012 based on the remaining period at the reporting date to the respective contractual maturity dates is given below:
Up to 3 3 to 12 1 to 3 3 to 5 More than Total as at Total as atMonths Months Years Years 5 Years 31.12.2012 31.12.2011
Rs. ’000 Rs. ’000 Rs. ’000 Rs. ’000 Rs. ’000 Rs. ’000 Rs. ’000
Interest-Bearing Liabilities:
Due to banks 1,354,651 – – – – 1,354,651 10,363,416
Due to other customers 240,370,577 99,307,742 5,906,406 5,837,521 7,083,119 358,505,365 292,840,945
Other borrowings 24,066,467 9,206,335 4,393,556 4,585,341 5,314,246 47,565,945 49,455,005
Subordinated term debts 132,806 550 – 972,660 – 1,106,016 1,105,639
As at 31.12.2012 265,924,501 108,514,627 10,299,962 11,395,522 12,397,365 408,531,977
As at 31.12.2011 239,490,979 88,112,294 10,080,422 7,476,211 8,605,099 353,765,005
Notes to the Financial Statements

Commercial Bank of Ceylon PLCCommercial Bank of Ceylon PLC
Annual Report 2012Annual Report 2012
This is Commercial BankOperating HighlightsFinancial Highlights
Letter from the ChairmanManaging Director’s Review
Management Discussion and AnalysisStewardship
Financial ReportsAnnexes
405
Up to 3 3 to 12 1 to 3 3 to 5 More than Total as at Total as atMonths Months Years Years 5 Years 31.12.2012 31.12.2011
Rs. ’000 Rs. ’000 Rs. ’000 Rs. ’000 Rs. ’000 Rs. ’000 Rs. ’000
Non-Interest Bearing Liabilities:
Due to Banks 3,405,679 3,235 – – – 3,408,914 1,210,689
Derivative financial instruments 83,123 1,168 – – – 84,291 435,171
Due to other customers 32,063,317 – – – – 32,063,317 30,856,683
Current tax liabilities 1,147,300 1,674,675 – – – 2,821,975 1,307,079
Deferred tax liabilities – – – 1,889,983 – 1,889,983 1,639,827
Other provisions 2,409 – – – – 2,409 535
Other liabilities 8,675,092 1,190,503 187,803 313,035 50,780 10,417,213 8,213,999
Stated capital – – – – 18,008,796 18,008,796 16,473,861
Statutory reserves – – – – 3,433,395 3,433,395 2,890,305
Retained earnings – – – – 4,172,814 4,172,814 2,588,194
Other reserves – – – – 27,353,415 27,353,415 22,187,020
Non-controlling interest – – – – 32,141 32,141 29,589
As at 31.12.2012 45,376,920 2,869,581 187,803 2,203,018 53,051,341 103,688,663
As at 31.12.2011 36,104,740 4,267,385 1,199,314 2,079,017 44,182,496 87,832,952
Total Liabilities and Equity - As at 31.12.2012 311,301,421 111,384,208 10,487,765 13,598,540 65,448,706 512,220,640
Total Liabilities and Equity - As at 31.12.2011 275,595,719 92,379,679 11,279,736 9,555,228 52,787,595 441,597,957
Percentage - As at 31.12.2012 60.77 21.75 2.05 2.65 12.78 100.00
Percentage - As at 31.12.2011 62.42 20.92 2.55 2.16 11.95 100.00
(b) Bank
(i) An analysis of the total assets employed of the Bank as at December 31, 2012, based on the remaining period at the reporting date to the respective contractual maturity dates is given below:
Up to 3 3 to 12 1 to 3 3 to 5 More than Total as at Total as atMonths Months Years Years 5 Years 31.12.2012 31.12.2011
Rs. ’000 Rs. ’000 Rs. ’000 Rs. ’000 Rs. ’000 Rs. ’000 Rs. ’000
Interest-Earning Assets:
Cash and cash equivalents 5,169,379 126,486 – – – 5,295,865 2,266,521
Balances with Central Banks 3,425 373 – – – 3,798 589,419
Placements with banks 16,162,970 – – – – 16,162,970 11,674,363
Other financial assets held for trading 5,718,232 – – – – 5,718,232 6,193,392
Loans and receivables to banks – 95,000 – – – 95,000 104,778
Loans and receivables to other customers 156,622,403 67,596,689 98,596,707 33,821,496 16,277,786 372,915,081 314,485,967
Financial investments - Available-for-sale 23,233,313 20,980,372 9,965,095 2,417,398 1,327,596 57,923,774 61,385,224
As at 31.12.2012 206,909,722 88,798,920 108,561,802 36,238,894 17,605,382 458,114,720
As at 31.12.2011 165,300,411 89,930,315 85,569,711 41,132,983 14,766,244 396,699,664
Notes to the Financial Statements

Commercial Bank of Ceylon PLCCommercial Bank of Ceylon PLC
Annual Report 2012Annual Report 2012
This is Commercial BankOperating HighlightsFinancial Highlights
Letter from the ChairmanManaging Director’s ReviewManagement Discussion and AnalysisStewardshipFinancial ReportsAnnexes
406
Up to 3 3 to 12 1 to 3 3 to 5 More than Total as at Total as atMonths Months Years Years 5 Years 31.12.2012 31.12.2011
Rs. ’000 Rs. ’000 Rs. ’000 Rs. ’000 Rs. ’000 Rs. ’000 Rs. ’000
Non–Interest Earning Assets:
Cash and Cash Equivalents 14,436,969 – – – – 14,436,969 10,644,468
Balances with Central Banks 12,545,598 4,674,968 289,955 317,678 336,042 18,164,241 16,753,540
Derivative financial instruments 739,406 611,689 – – – 1,351,095 39,612
Other financial assets held for trading 322,878 – – – – 322,878 224,618
Loans and receivables to banks 533,760 – – – – 533,760 475,380
Financial investments - Available-for-sale – – – 15,106 24,312 39,418 30,171
Investments in subsidiaries – – – – 303,130 303,130 315,444
Investments in associates – – – – 44,331 44,331 44,331
Property, plant & equipment – – – – 8,221,118 8,221,118 7,907,030
Intangible assets – – – – 497,038 497,038 467,014
Leasehold property – – – – 77,304 77,304 78,246
Deferred tax assets – – – 448,500 – 448,500 359,617
Other assets 6,038,365 71,001 161,000 148,492 2,769,348 9,188,206 7,290,514
As at 31.12.2012 34,616,976 5,357,658 450,955 929,776 12,272,623 53,627,988
As at 31.12.2011 27,807,527 4,138,598 522,305 797,986 11,363,569 44,629,985
Total Assets - As at 31.12.2012 241,526,698 94,156,578 109,012,757 37,168,670 29,878,005 511,742,708
Total Assets - As at 31.12.2011 193,107,938 94,068,913 86,092,016 41,930,969 26,129,813 441,329,649
Percentage - As at 31.12.2012 47.20 18.40 21.30 7.26 5.84 100.00
Percentage - As at 31.12.2011 43.76 21.31 19.51 9.50 5.92 100.00
(ii) An analysis of the total liabilities and shareholders’ funds of the Bank as at December 31, 2012 based on the remaining period at the reporting date to the respective contractual maturity dates is given below:
Up to 3 3 to 12 1 to 3 3 to 5 More than Total as at Total as atMonths Months Years Years 5 Years 31.12.2012 31.12.2011
Rs. ’000 Rs. ’000 Rs. ’000 Rs. ’000 Rs. ’000 Rs. ’000 Rs. ’000
Interest-Bearing Liabilities:
Due to banks 1,354,651 – – – – 1,354,651 10,363,416
Due to other customers 240,404,347 99,316,446 5,906,406 5,837,521 7,083,119 358,547,839 292,897,852
Other borrowings 24,213,721 9,206,335 4,393,556 4,585,341 5,314,246 47,713,199 49,603,142
Subordinated term debts 132,806 550 – 972,660 – 1,106,016 1,105,639
As at 31.12.2012 266,105,525 108,523,331 10,299,962 11,395,522 12,397,365 408,721,705
As at 31.12.2011 239,648,023 88,160,294 10,080,422 7,476,211 8,605,099 353,970,049
Notes to the Financial Statements

Commercial Bank of Ceylon PLCCommercial Bank of Ceylon PLC
Annual Report 2012Annual Report 2012
This is Commercial BankOperating HighlightsFinancial Highlights
Letter from the ChairmanManaging Director’s Review
Management Discussion and AnalysisStewardship
Financial ReportsAnnexes
407
Up to 3 3 to 12 1 to 3 3 to 5 More than Total as at Total as atMonths Months Years Years 5 Years 31.12.2012 31.12.2011
Rs. ’000 Rs. ’000 Rs. ’000 Rs. ’000 Rs. ’000 Rs. ’000 Rs. ’000
Non-Interest Bearing Liabilities:
Due to Banks 3,405,679 3,235 – – – 3,408,914 1,210,689
Derivative financial instruments 83,123 1,168 – – – 84,291 435,171
Due to other customers 32,063,709 – – – – 32,063,709 30,856,896
Current tax liabilities 1,126,866 1,674,675 – – – 2,801,541 1,305,442
Deferred tax liabilities – – – 1,698,067 – 1,698,067 1,594,086
Other provisions 2,409 – – – – 2,409 535
Other liabilities 8,620,687 1,190,503 187,803 313,035 50,780 10,362,808 8,162,382
Due to subsidiaries 22,264 – – – – 22,264 29,734
Stated capital – – – – 18,008,796 18,008,796 16,473,861
Statutory reserves – – – – 3,433,395 3,433,395 2,890,305
Retained earnings – – – – 4,178,080 4,178,080 2,547,336
Other reserves – – – – 26,956,729 26,956,729 21,853,163
As at 31.12.2012 45,324,737 2,869,581 187,803 2,011,102 52,627,780 103,021,003
As at 31.12.2011 36,081,433 4,267,385 1,199,314 2,033,276 43,778,192 87,359,600
Total Liabilities and Equity - As at 31.12.2012 311,430,262 111,392,912 10,487,765 13,406,624 65,025,145 511,742,708
Total Liabilities and Equity - As at 31.12.2011 275,729,456 92,427,679 11,279,736 9,509,487 52,383,291 441,329,649
Percentage - As at 31.12.2012 60.85 21.77 2.05 2.62 12.71 100.00
Percentage - As at 31.12.2011 62.48 20.94 2.56 2.15 11.87 100.00
51. Employee Retirement Benefits
51.1 Pension Fund - Defined Benefit Plan
An actuarial valuation of the retirement Pension Fund was carried out as at December 31, 2012, by Mr. M Poopalanathan, AIA, Messers Actuarial & Management Consultants (Pvt) Ltd., a firm of professional actuaries. The valuation method used by the actuaries to value the fund is the ‘Projected Unit Credit Method (PUC)‘, the method recommended by the Sri Lanka Accounting Standard LKAS 19 on ‘Employee Benefits’.
The assets of the fund, which are independently administered by the Trustees as per the provision of the Trust Deed are held separately from those of the Bank.
51.1 (a) Actuarial Assumptions - Demographic
Mortality
In service A 67/70 Mortality Table issued by the Institute of Actuaries, LondonAfter retirement A (90) Annuities Table (Males & Females) issued by the Institute of Actuaries, London
Withdrawal
The withdrawal rate at an age represents the probability of an active employee leaving within one year of that age due to reasons other than death, ill health and normal retirement. The same withdrawal rates which were used in the last valuation (December 31, 2011) to determine the liabilities of the active employees in the funded scheme, were used in the actuarial valuation as at December 31, 2012.
Notes to the Financial Statements
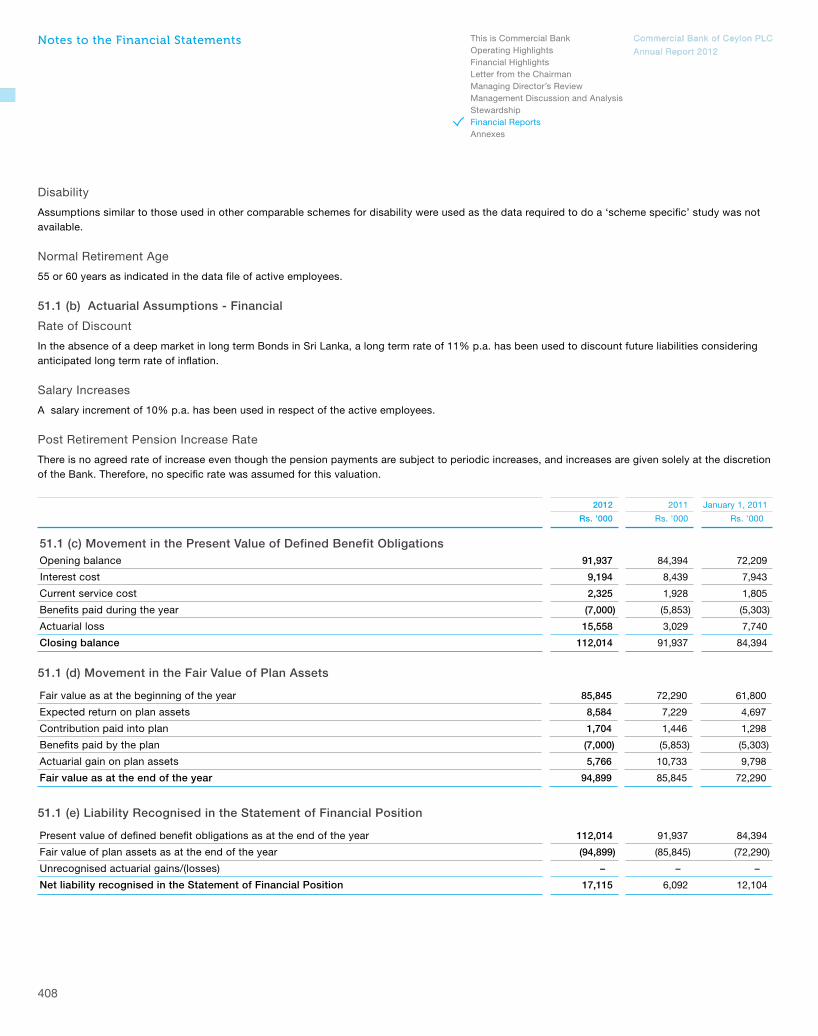
Commercial Bank of Ceylon PLCCommercial Bank of Ceylon PLC
Annual Report 2012Annual Report 2012
This is Commercial BankOperating HighlightsFinancial Highlights
Letter from the ChairmanManaging Director’s ReviewManagement Discussion and AnalysisStewardshipFinancial ReportsAnnexes
408
Disability
Assumptions similar to those used in other comparable schemes for disability were used as the data required to do a ‘scheme specific’ study was not available.
Normal Retirement Age
55 or 60 years as indicated in the data file of active employees.
51.1 (b) Actuarial Assumptions - Financial
Rate of Discount
In the absence of a deep market in long term Bonds in Sri Lanka, a long term rate of 11% p.a. has been used to discount future liabilities considering anticipated long term rate of inflation.
Salary Increases
A salary increment of 10% p.a. has been used in respect of the active employees.
Post Retirement Pension Increase Rate
There is no agreed rate of increase even though the pension payments are subject to periodic increases, and increases are given solely at the discretion of the Bank. Therefore, no specific rate was assumed for this valuation.
2012 2011 January 1, 2011
Rs. ’000 Rs. ’000 Rs. ’000
51.1 (c) Movement in the Present Value of Defined Benefit ObligationsOpening balance 91,937 84,394 72,209
Interest cost 9,194 8,439 7,943
Current service cost 2,325 1,928 1,805
Benefits paid during the year (7,000) (5,853) (5,303)
Actuarial loss 15,558 3,029 7,740
Closing balance 112,014 91,937 84,394
51.1 (d) Movement in the Fair Value of Plan Assets
Fair value as at the beginning of the year 85,845 72,290 61,800
Expected return on plan assets 8,584 7,229 4,697
Contribution paid into plan 1,704 1,446 1,298
Benefits paid by the plan (7,000) (5,853) (5,303)
Actuarial gain on plan assets 5,766 10,733 9,798
Fair value as at the end of the year 94,899 85,845 72,290
51.1 (e) Liability Recognised in the Statement of Financial Position
Present value of defined benefit obligations as at the end of the year 112,014 91,937 84,394
Fair value of plan assets as at the end of the year (94,899) (85,845) (72,290)
Unrecognised actuarial gains/(losses) – – –
Net liability recognised in the Statement of Financial Position 17,115 6,092 12,104
Notes to the Financial Statements

Commercial Bank of Ceylon PLCCommercial Bank of Ceylon PLC
Annual Report 2012Annual Report 2012
This is Commercial BankOperating HighlightsFinancial Highlights
Letter from the ChairmanManaging Director’s Review
Management Discussion and AnalysisStewardship
Financial ReportsAnnexes
409
2012 2011 January 1, 2011
Rs. ’000 Rs. ’000 Rs. ’000
51.1 (f) Plan Assets Consist of the Following:
Government Treasury Bills 38,632 29,804 16,258
Deposits held with the Bank 56,267 56,041 56,032
Total 94,899 85,845 72,290
52. Financial Reporting by Segment as per the Provisions of Sri Lanka Financial Reporting Standard (SLFRS) No. 08
The primary segment reporting format is determined to be business segments as the Group’s risks and return are affected predominantly by differences in the products and services produced. Secondary information is reported geographically.
The operating businesses are organised and managed separately according to the nature of the products and services provided, with each segment representing a strategic business unit that offers different products and serves different markets.
52.1 Primary Segment Information - Business Segments (Group)
The following table presents the income, profit and certain asset and liability information on the Group’s business segments for the year ended December 31, 2012 and comparative figures for the year ended December 31, 2011.
Banking Leasing Dealing/Treasury Investments Total/ Consolidated
For the year ended December 31, 2012 2011 2012 2011 2012 2011 2012 2011 2012 2011
Rs. ’000 Rs. ’000 Rs. ’000 Rs. ’000 Rs. ’000 Rs. ’000 Rs. ’000 Rs. ’000 Rs. ’000 Rs. ’000
External Operating Income:
Net interest income 21,385,560 15,844,749 911,261 643,550 111,621 1,881,951 443,217 308,150 22,851,659 18,678,400
Foreign exchange profit 2,091,074 1,749,266 – – 2,595,937 572,357 – – 4,687,011 2,321,623
Fees and commission income 3,590,315 3,319,440 – – 8,003 5,810 – – 3,598,318 3,325,250
Other income 110,871 501,420 1,308,323 778,372 131,168 (139,950) 60,369 15,835 1,610,731 1,155,677
Eliminations/unallocated – – – – – – – – 266,169 282,821
Total operating income 27,177,820 21,414,875 2,219,584 1,421,922 2,846,729 2,320,168 503,586 323,985 33,013,888 25,763,771
Credit loss expenses (3,083,820) (1,398,292) (74,471) (348,453) – – – – (3,158,291) (1,746,745)
Net operating income 24,094,000 20,016,583 2,145,113 1,073,469 2,846,729 2,320,168 503,586 323,985 29,855,597 24,017,026
Segment result 14,453,263 11,168,069 2,145,113 1,073,469 1,617,091 2,062,778 449,652 289,287 18,665,119 14,593,603
Unallocated operating expenses (4,364,565) (3,624,262)
Profit from operations 14,300,554 10,969,341
Share of profit of Associates – (before tax) 12,360 10,878
Income tax expense (4,231,747) (3,047,918)
Non-controlling interest (1,338) (239)
Net profit for the year, attributable to equity holders of the Parent 10,079,829 7,932,062
Notes to the Financial Statements

Commercial Bank of Ceylon PLCCommercial Bank of Ceylon PLC
Annual Report 2012Annual Report 2012
This is Commercial BankOperating HighlightsFinancial Highlights
Letter from the ChairmanManaging Director’s ReviewManagement Discussion and AnalysisStewardshipFinancial ReportsAnnexes
410
Banking Leasing Dealing/Treasury Investments Total/ Consolidated
As at December 31, 2012 2011 2012 2011 2012 2011 2012 2011 2012 2011Rs. ’000 Rs. ’000 Rs. ’000 Rs. ’000 Rs. ’000 Rs. ’000 Rs. ’000 Rs. ’000 Rs. ’000 Rs. ’000
Other Information
Segment assets 291,972,329 251,280,611 25,043,149 21,382,490 132,898,416 118,356,825 3,836,916 3,798,318 453,750,810 394,818,244
Investments in associates – – – – – – 93,712 119,981 93,712 119,981
Unallocated assets – – – – – – – – 58,376,118 46,659,732
Total assets – – – – – – – – 512,220,640 441,597,957
Segment liabilities 292,636,055 250,824,124 25,043,149 21,382,490 132,898,416 118,356,825 3,930,628 3,918,299 454,508,248 394,481,738
Unallocated liabilities – – – – – – – – 4,711,831 2,947,250
Total liabilities – – – – – – – – 459,220,079 397,428,988
Banking Leasing Dealing/Treasury Investments Total/ Consolidated
For the year ended December 31, 2012 2011 2012 2011 2012 2011 2012 2011 2012 2011
Rs. ’000 Rs. ’000 Rs. ’000 Rs. ’000 Rs. ’000 Rs. ’000 Rs. ’000 Rs. ’000 Rs. ’000 Rs. ’000
Information on cash flows
Cash flows from operating activities 9,863,648 492,975 (3,660,659) (9,825,905) (301,398) (2,781,499) 4,448,539 17,938,271 10,350,130 5,823,842
Cash flows from investing activities 619,260 (711,225) – – – – – – 619,260 (711,225)
Cash flows from financing activities – – – – (132,929) (1,482,153) – – (132,429) (1,482,153)
Capital expenditure
Property, Plant & Equipment – – – – – – – – (1,234,473) (967,997)
Intangible assets – – – – – – – – (205,227) (147,955)
Eliminations/unallocated (2,580,051) 2,103,435
Net cash flow generated during the year 6,817,210 4,617,947
Notes to the Financial Statements

Commercial Bank of Ceylon PLCCommercial Bank of Ceylon PLC
Annual Report 2012Annual Report 2012
This is Commercial BankOperating HighlightsFinancial Highlights
Letter from the ChairmanManaging Director’s Review
Management Discussion and AnalysisStewardship
Financial ReportsAnnexes
411
52.2 Secondary Segment Information – Geographical Segments
The following table presents the distribution of total assets, income, profit before tax and profit after tax of the Group/Bank by geographical segment, allocated based on the location in which the transaction assets and liabilities are recorded for the year ended December 31, 2012 together with comparative figures for the year ended December 31, 2011.
GROUP BANK
2012 2011 2012 2011Rs. ’000 % Rs. ’000 % Rs. ’000 % Rs. ’000 %
Assets
Sri Lanka operations 471,153,270 91.98 412,640,009 93.44 470,726,049 91.98 412,371,701 93.44
International operations 41,067,370 8.02 28,957,948 6.56 41,016,659 8.02 28,957,948 6.56
Total 512,220,640 100.00 441,597,957 100.00 511,742,708 100.00 441,329,649 100.00
Income
Sri Lanka operations 58,574,030 92.43 42,344,382 92.38 58,595,750 92.43 42,364,694 92.38
International operations 4,799,723 7.57 3,494,562 7.62 4,799,297 7.57 3,494,523 7.62
Total 63,373,753 100.00 45,838,944 100.00 63,395,047 100.00 45,859,217 100.00
Profit before tax
Sri Lanka operations 12,416,243 86.75 9,584,433 87.29 12,358,802 86.45 9,467,053 86.88
International operations 1,896,671 13.25 1,395,786 12.71 1,936,531 13.55 1,430,177 13.12
Total 14,312,914 100.00 10,980,219 100.00 14,295,333 100.00 10,897,230 100.00
Profit after tax
Sri Lanka operations 9,061,030 89.88 7,116,706 89.72 9,038,332 89.50 7,032,883 89.22
International operations 1,020,137 10.12 815,595 10.28 1,059,997 10.50 849,986 10.78
Total 10,081,167 100.00 7,932,301 100.00 10,098,329 100.00 7,882,869 100.00
53. Related Party Disclosures
The Bank carried out transactions in the ordinary course of business on an arm’s length basis at commercial rates with parties who are defined as Related Parties as per the Sri Lanka Accounting Standard - LKAS 24 ‘Related Party Disclosures’, except for the transactions that Key Management Personnel (KMPs) have availed under schemes uniformly applicable to all staff at concessionary rates.
53.1 Parent and Ultimate Controlling Party
The Bank does not have an identifiable parent of its own.
53.2 Transactions with Key Management Personnel (KMPs)
Key Management Personnel are those persons having authority and responsibility for planning, directing and controlling the activities of the Bank directly or indirectly.
Accordingly the Bank’s KMPs include the Board of Directors (including Executive and Non-Executive Directors) and selected key employees who meet the criteria above.
Close Family Members (CFM) of a KMP are those family members who may be expected to influence, or be influenced by, that KMP in their dealings with the Bank. They may include KMPs domestic partner and children, children of the KMPs domestic partner and dependants of the KMP or the KMPs domestic partner.
Notes to the Financial Statements

Commercial Bank of Ceylon PLCCommercial Bank of Ceylon PLC
Annual Report 2012Annual Report 2012
This is Commercial BankOperating HighlightsFinancial Highlights
Letter from the ChairmanManaging Director’s ReviewManagement Discussion and AnalysisStewardshipFinancial ReportsAnnexes
412
As the Bank is the ultimate parent of the Subsidiaries that are listed out on page 316, the Board of Directors of the Bank have the authority and responsibility for planning, directing and controlling the activities of the Group directly or indirectly. Accordingly the Board of Directors of the Bank (Including Executive and Non-Executive) are KMPs of the Group.
53.2.1.1 Compensation of Directors - Bank
2012 2011Rs. ’000 Rs. ’000
Short term employment benefits 92,869 96,101
Post employment benefits 6,459 6,798
Total 99,328 102,899
53.2.1.2 Compensation of other KMPs - Bank
2012 2011Rs. ’000 Rs. ’000
Short term employment benefits 161,328 162,002
Post employment benefits 16,960 15,046
Total 178,288 177,048
53.2.1.3 Compensation of KMPs - Group
2012 2011Rs. ’000 Rs. ’000
Short term employment benefits 93,169 96,263
Post employment benefits 6,459 6,798
Total 99,628 103,061
In addition to the above the Bank/Group provide non-cash benefit to the KMPs.
53.2.2 Transactions, Arrangements and Agreements Involving KMPs, and their Close Family Members (CFMs)
CFMs of a KMP are those family members who may be expected to influence, or be influenced by, that KMP in their dealings with the entity. They may include KMPs domestic partner and children, children of the KMPs domestic partner and dependents of the KMP or the KMPs domestic partner.
53.2.2.1 Statement of Financial Position - Bank
Year-end Balance Average Balance
2012 2011 2012 2011Rs. ’000 Rs. ’000 Rs. ’000 Rs. ’000
Assets
Loans and advances 87,789 93,134 86,625 72,616
Credit cards 1,774 1,651 194 154
Total 89,563 94,785 86,819 72,770
Liabilities
Deposits 154,173 229,848 175,844 204,864
Securities sold under re-purchase agreements 34,014 264,063 118,872 330,217
Debentures 200 200 200 300
Total 188,387 494,111 294,916 535,381
Notes to the Financial Statements

Commercial Bank of Ceylon PLCCommercial Bank of Ceylon PLC
Annual Report 2012Annual Report 2012
This is Commercial BankOperating HighlightsFinancial Highlights
Letter from the ChairmanManaging Director’s Review
Management Discussion and AnalysisStewardship
Financial ReportsAnnexes
413
53.2.2.2 Commitments and Contingencies - Bank
Year-end Balance Average Balance
2012 2011 2012 2011Rs. ’000 Rs. ’000 Rs. ’000 Rs. ’000
Letters of credit – – 359 550
Undrawn facilities 26,488 32,538 28,757 31,616
Total 26,488 32,538 29,116 32,166
53.2.2.3 Direct and Indirect Accommodation - Bank
Direct and indirect accommodation as a % of the Bank’s Regulatory Capital 0.24% 0.30%
53.2.2.4 Income StatementDuring the Year
2012 2011Rs. ’000 Rs. ’000
Interest income 8,186 6,615
Interest expenses 26,175 40,286
Other income 111 43
Compensation to KMPs (Refer Note 53.2.1 and 53.2.2) 277,616 279,947
53.2.2.5 Share-Based Benefits to KMPs
As at the Year End2012 2011
Number of ordinary shares held 4,030,871 9,902,168
Dividends paid (In Rs. ’000) 34,158 42,834
Number of cumulative exercisable options under the Employee Share Option Plan (ESOP) 2008 - Tranche I 817,581 817,581
Tranche II 387,828 –
53.3 Transactions with Group Entities
The Group entities include the Subsidiaries and Associates of the Bank.
53.3.1 Transactions with Subsidiaries
53.3.1.1 Balance Sheet
Year–end Balance Average Balance2012 2011 2012 2011
Rs. ’000 Rs. ’000 Rs. ’000 Rs. ’000
Assets
Loans and advances 343 2,955 1,503 2,161
Lease receivables 57,401 156,494 89,051 183,884
Other 37,859 66,380 52,120 59,977
Total 95,603 225,829 142,674 246,022
Liabilities
Deposits 42,866 57,120 61,786 62,171
Securities sold under re–purchase agreements 142,721 143,944 113,053 125,733
Other 22,264 14,999 18,632 15,150
Total 207,851 216,063 193,471 203,054
Notes to the Financial Statements

Commercial Bank of Ceylon PLCCommercial Bank of Ceylon PLC
Annual Report 2012Annual Report 2012
This is Commercial BankOperating HighlightsFinancial Highlights
Letter from the ChairmanManaging Director’s ReviewManagement Discussion and AnalysisStewardshipFinancial ReportsAnnexes
414
53.3.1.2 Commitments and Contingencies
Year–end Balance Average Balance
2012 2011 2012 2011Rs. ’000 Rs. ’000 Rs. ’000 Rs. ’000
Letters of credit – 419 – 457
Guarantees – 110 – 78
Undrawn facilities 25,000 50,000 20,833 20,897
Total 25,000 50,529 20,833 21,432
53.3.1.3 Direct and Indirect Accommodation
Direct and indirect accommodation as a % of the Bank’s Regulatory Capital 0.17% 0.50%
53.3.1.4 Income Statement
During the Year
2012 2011
Rs. ’000 Rs. ’000
Interest income 20,189 39,591
Interest expenses 19,092 14,996
Other income 70,437 35,609
Expenses paid 246,574 287,187
53.3.1.5 Other Transactions
Payments made to OneZero Company Ltd. in relation to purchase of computer hardware, software and maintenance agreements 168,691 114,290
53.3.2 Transactions with Associates
53.3.2.1 Statement of Financial Position
Year–end Balance Average Balance
2012 2011 2012 2011Rs. ’000 Rs. ’000 Rs. ’000 Rs. ’000
Assets
Loans and advances 11,570 19,645 12,232 23,177
Lease receivables 2,600 4,465 4,962 4,962
Total 14,170 24,110 17,194 28,139
Liabilities
Deposits 52,707 25,521 83,048 22,659
Securities sold under re-purchase agreements 4,096 23,236 17,393 24,395
Total 56,803 48,757 100,441 47,054
53.3.2.2 Direct and Indirect Accommodation
Direct and indirect accommodation as a % of the Bank’s Regulatory Capital 0.03% 0.06%
Notes to the Financial Statements

Commercial Bank of Ceylon PLCCommercial Bank of Ceylon PLC
Annual Report 2012Annual Report 2012
This is Commercial BankOperating HighlightsFinancial Highlights
Letter from the ChairmanManaging Director’s Review
Management Discussion and AnalysisStewardship
Financial ReportsAnnexes
415
53.3.2.3 Income Statement
During the Year
2012 2011Rs. ’000 Rs. ’000
Interest income 2,773 4,239
Interest expenses 11,507 2,252
Other income 55,971 26,087
53.3.2.4 Other Transactions
During the Year
2012 2011
Number of ordinary shares held as at the year end 4,246 4,246
Dividend paid (Rs. ’000) 21 18
53.4 Transactions with Other Related Entities
Other related entities include significant investors (either entities or individuals) that have control, joint control or significant influence, post-employment benefit plans for the Bank’s employees.
53.4.1 Transactions with the Post-Employment Benefit Plans for the Employees of the Bank
53.4.1.1 Statement of Financial Position
Year–end Balance Average Balance
2012 2011 2012 2011
Rs. ’000 Rs. ’000 Rs. ’000 Rs. ’000
Assets
Loans and Advances – – – –
Credit Cards – – – –
Other – – – –
Total – – – –
Liabilities
Deposits 1,592,507 1,818,097 1,198,568 894,385
Securities sold under repurchase agreements 141,160 123,937 75,644 1,046,281
Total 1,733,667 1,942,034 1,274,212 1,940,666
53.4.1.2 Income Statement
During the Year
2012 2011Rs. ’000 Rs. ’000
Interest expenses 136,174 174,195
Contribution made/taxes paid by the Bank 782,339 683,904
Notes to the Financial Statements
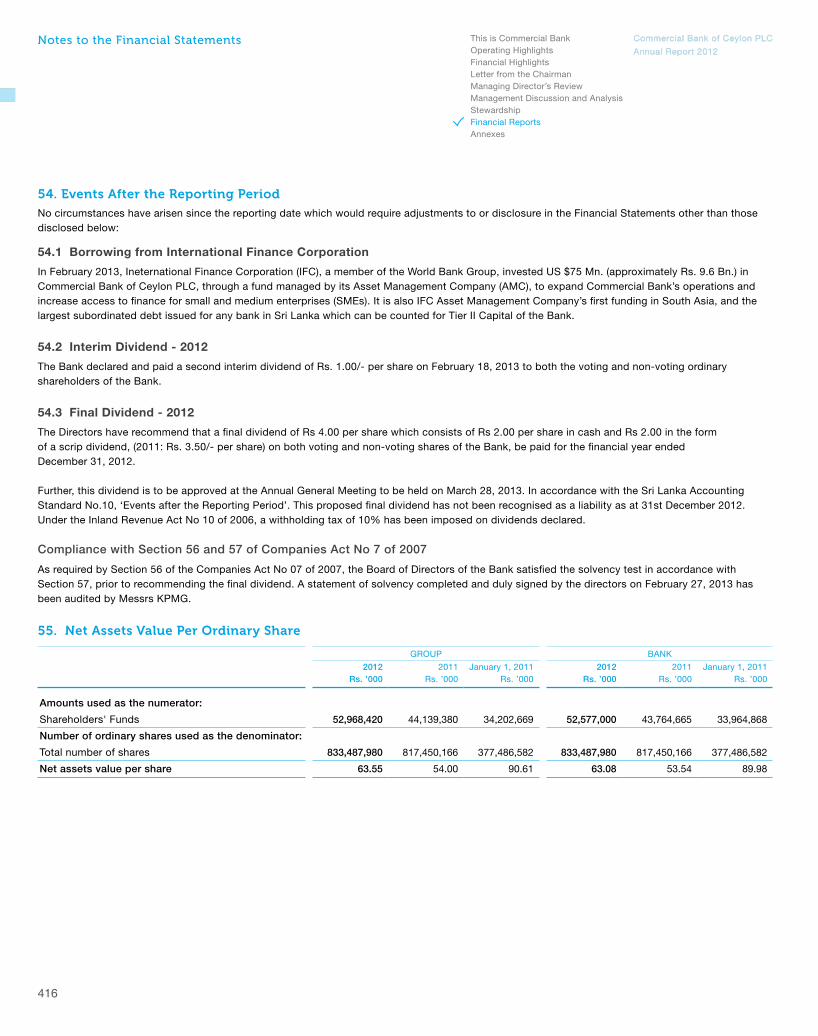
Commercial Bank of Ceylon PLCCommercial Bank of Ceylon PLC
Annual Report 2012Annual Report 2012
This is Commercial BankOperating HighlightsFinancial Highlights
Letter from the ChairmanManaging Director’s ReviewManagement Discussion and AnalysisStewardshipFinancial ReportsAnnexes
416
54. Events After the Reporting Period
No circumstances have arisen since the reporting date which would require adjustments to or disclosure in the Financial Statements other than those disclosed below:
54.1 Borrowing from International Finance Corporation
In February 2013, Ineternational Finance Corporation (IFC), a member of the World Bank Group, invested US $75 Mn. (approximately Rs. 9.6 Bn.) in Commercial Bank of Ceylon PLC, through a fund managed by its Asset Management Company (AMC), to expand Commercial Bank’s operations and increase access to finance for small and medium enterprises (SMEs). It is also IFC Asset Management Company’s first funding in South Asia, and the largest subordinated debt issued for any bank in Sri Lanka which can be counted for Tier II Capital of the Bank.
54.2 Interim Dividend - 2012
The Bank declared and paid a second interim dividend of Rs. 1.00/- per share on February 18, 2013 to both the voting and non-voting ordinary shareholders of the Bank.
54.3 Final Dividend - 2012
The Directors have recommend that a final dividend of Rs 4.00 per share which consists of Rs 2.00 per share in cash and Rs 2.00 in the form of a scrip dividend, (2011: Rs. 3.50/- per share) on both voting and non-voting shares of the Bank, be paid for the financial year ended December 31, 2012.
Further, this dividend is to be approved at the Annual General Meeting to be held on March 28, 2013. In accordance with the Sri Lanka Accounting Standard No.10, ‘Events after the Reporting Period’. This proposed final dividend has not been recognised as a liability as at 31st December 2012. Under the Inland Revenue Act No 10 of 2006, a withholding tax of 10% has been imposed on dividends declared.
Compliance with Section 56 and 57 of Companies Act No 7 of 2007
As required by Section 56 of the Companies Act No 07 of 2007, the Board of Directors of the Bank satisfied the solvency test in accordance with Section 57, prior to recommending the final dividend. A statement of solvency completed and duly signed by the directors on February 27, 2013 has been audited by Messrs KPMG.
55. Net Assets Value Per Ordinary Share
GROUP BANK
2012 2011 January 1, 2011 2012 2011 January 1, 2011Rs. ’000 Rs. ’000 Rs. ’000 Rs. ’000 Rs. ’000 Rs. ’000
Amounts used as the numerator:
Shareholders' Funds 52,968,420 44,139,380 34,202,669 52,577,000 43,764,665 33,964,868
Number of ordinary shares used as the denominator:
Total number of shares 833,487,980 817,450,166 377,486,582 833,487,980 817,450,166 377,486,582
Net assets value per share 63.55 54.00 90.61 63.08 53.54 89.98
Notes to the Financial Statements

Commercial Bank of Ceylon PLCCommercial Bank of Ceylon PLC
Annual Report 2012Annual Report 2012
This is Commercial BankOperating HighlightsFinancial Highlights
Letter from the ChairmanManaging Director’s Review
Management Discussion and AnalysisStewardship
Financial ReportsAnnexes
417
56. Non-Cash Items Included In Profit Before Tax
GROUP BANK
2012 2011 2012 2011Rs. ’000 Rs. ’000 Rs. ’000 Rs. ’000
Depreciation of property, plant & equipment 942,765 734,115 859,675 648,543
Amortistion of leasehold property 1,452 1,452 942 942
Amortisation of intangible assets 174,104 98,172 174,055 98,118
Impairment losses on loans and advances 3,158,291 1,746,745 3,158,291 1,746,745
Other impairment – – 38,469 61,154
Share based payment expense – – – –
Others – – – –
Total 4,276,612 2,580,484 4,231,432 2,555,502
57. Change In Operating Assets
GROUP BANK
2012 2011 2012 2011Rs. ’000 Rs. ’000 Rs. ’000 Rs. ’000
Change in derivative financial instruments 1,311,483 (130,304) 1,311,483 (130,304)
Net increase in debt securities, treasury bills and bonds and equity shares held at fair value through profit or loss – – – –
Net increase in balances with Central Banks 825,080 5,154,125 825,080 5,154,125
Net increase in placements with banks 4,488,607 9,839,103 4,488,607 9,839,103
Net increase/(decrease) in other financial assets held for trading (376,900) (3,958,931) (376,900) (3,958,931)
Net increase in loans and receivables to banks 48,602 11,454 48,602 11,454
Net increase in loans and receivables to customers 61,688,630 67,763,696 61,587,405 67,699,765
Net increase/(decrease) in financial investments available for sale (4,071,639) (13,979,340) (4,071,639) (13,979,340)
Change in other assets 1,908,901 1,555,580 1,871,093 1,566,240
Total 65,822,764 66,255,383 65,683,731 66,202,112
58. Change In Operating Liabilities
GROUP BANK
2012 2011 2012 2011Rs. ’000 Rs. ’000 Rs. ’000 Rs. ’000
Change in due to banks (6,810,540) 5,455,190 (6,810,540) 5,455,190
Change in derivative financial instruments (350,880) 408,091 (350,880) 408,091
Change in deposits from banks, customers and debt securities issued 66,871,054 60,065,926 66,856,800 60,088,701
Change in other borrowings (1,889,060) (4,458,908) (1,889,943) (4,429,620)
Change in other provisions 1,874 (1,834) 1,874 (1,834)
Change in other liabilities 2,205,681 830,119 2,200,427 822,591
Change in due to subsidiaries – – (7,470) (11,714)
Total 60,028,129 62,298,584 60,000,268 62,331,405
Notes to the Financial Statements

Commercial Bank of Ceylon PLCCommercial Bank of Ceylon PLC
Annual Report 2012Annual Report 2012
This is Commercial BankOperating HighlightsFinancial Highlights
Letter from the ChairmanManaging Director’s ReviewManagement Discussion and AnalysisStewardshipFinancial ReportsAnnexes
418
59. Explanation of Transition to New Sri Lanka Accounting Standards (SLASs)
As stated in Note 2 (i), these are the Bank’s first Financial Statements prepared in accordance with new Sri Lanka Accounting Standards prefixed both SLFRS (corresponding to IFRS) and LKAS (corresponding to IAS), promulgated by The Institute of Chartered Accountants of Sri Lanka (ICASL).
The Accounting Policies set out in Note 3 to 6 have been applied in preparing the Financial Statements for the year ended December 31, 2012, the comparative information presented in these Financial Statements for the year ended December 31, 2011 and in the preparation of an opening Statement of Financial Position as at January 1, 2011 (the Bank’s date of transition).
In preparing its opening new SLAS Statement of Financial Position, the Bank has adjusted amounts reported previously in Financial Statements prepared in accordance with previous SLAS. An explanation of how the transition from previous SLASs has affected the Bank’s financial position and financial performance is set out in the following tables and notes that accompany the tables.
59.1 Reconciliation of Equity - Group
January 01, 2011 December 31, 2011
PreviousEffect of
Transition to New PreviousEffect of
Transition to NewSLASs SLASs SLASs SLASs SLASs SLASs
Note Rs.’000 Rs.’000 Rs.’000 Rs.’000 Rs.’000 Rs.’000
ASSETS
Cash and cash equivalents a 8,316,822 226 8,317,048 12,906,524 28,471 12,934,995
Balances with central banks 12,188,834 – 12,188,834 17,342,959 – 17,342,959
Placements with banks b 2,287,384 (452,124) 1,835,260 12,128,793 (454,430) 11,674,363
Derivative financial instruments c – 169,916 169,916 – 39,612 39,612
Other financial assets held for trading d 15,037,113 (4,660,172) 10,376,941 11,983,361 (5,565,351) 6,418,010
Loans and receivables to banks e – 568,704 568,704 – 580,158 580,158
Loans and receivables to other customers f 243,497,792 4,812,255 248,310,047 308,177,705 6,149,293 314,326,998
Financial investments - Available for sale g 75,538,705 815,949 76,354,654 61,559,365 (143,970) 61,415,395
Financial investments - Held-to-maturity – – – – – –
Investments in subsidiaries – – – – – –
Investments in associates h 79,581 27,278 106,859 85,107 34,874 119,981
Property, plant & equipment 6,589,228 – 6,589,228 8,503,211 – 8,503,211
Intangible assets 425,255 – 425,255 475,038 – 475,038
Leasehold property 114,680 – 114,680 113,228 – 113,228
Deferred tax assets i – 128,496 128,496 – 363,711 363,711
Other assets j 6,182,546 (425,176) 5,757,370 8,058,614 (768,316) 7,290,298
Total Assets 370,257,940 985,352 371,243,292 441,333,907 264,052 441,597,959
LIABILITIES
Due to banks k 6,116,521 2,394 6,118,915 11,539,755 34,350 11,574,105
Derivative financial instruments l – 27,080 27,080 – 435,171 435,171
Other financial liabilities held for trading – – – – – –
Due to other customers m 259,744,568 3,887,134 263,631,702 318,404,310 5,293,318 323,697,628
Other borrowings n 53,913,344 569 53,913,913 49,448,835 6,170 49,455,005
Debt securities issued – – – – – –
Current tax liabilities o 2,455,002 – 2,455,002 1,139,174 167,905 1,307,079
Deferred tax liabilities p 992,710 128,496 1,121,206 1,369,570 270,257 1,639,827
Other provisions 2,369 – 2,369 535 – 535
Other liabilities q 11,367,219 (3,892,629) 7,384,590 13,861,245 (5,647,246) 8,213,999
Due to subsidiaries – – – – – –
Subordinated term debts r 2,127,030 232,215 2,359,245 973,210 132,429 1,105,639
Total liabilities 336,718,763 295,259 337,014,022 396,736,634 692,356 397,428,988
Notes to the Financial Statements

Commercial Bank of Ceylon PLCCommercial Bank of Ceylon PLC
Annual Report 2012Annual Report 2012
This is Commercial BankOperating HighlightsFinancial Highlights
Letter from the ChairmanManaging Director’s Review
Management Discussion and AnalysisStewardship
Financial ReportsAnnexes
419
January 01, 2011 December 31, 2011
PreviousEffect of
Transition to New PreviousEffect of
Transition to NewSLASs SLASs SLASs SLASs SLASs SLASs
Note Rs.’000 Rs.’000 Rs.’000 Rs.’000 Rs.’000 Rs.’000
EQUITY
Stated capital 10,811,193 – 10,811,193 16,473,861 – 16,473,861
Statutory reserves 2,471,830 – 2,471,830 2,890,305 – 2,890,305
Retained earnings s 1,474,851 (125,857) 1,348,994 2,871,412 (283,218) 2,588,194
Other reserves t 18,754,702 815,950 19,570,652 22,332,080 (145,060) 22,187,020
Total equity to equity owners of the bank 33,512,576 690,093 34,202,669 44,567,658 (428,278) 44,139,380
Non-controlling Interest x 26,601 – 26,601 29,615 (26) 29,589
Total equity 33,539,177 690,093 34,229,270 44,597,273 (428,304) 44,168,969
Total liabilities and equity 370,257,940 985,352 371,243,292 441,333,907 264,052 441,597,959
Contingent liabilities and commitments 196,617,166 – 196,617,166 234,551,169 – 234,551,169
59.2 Reconciliation of Equity - Bank
January 01, 2011 December 31, 2011
PreviousEffect of
transition to New PreviousEffect of
transition to New
SLASs SLASs SLASs SLASs SLASs SLASs Note Rs.’000 Rs.’000 Rs.’000 Rs.’000 Rs.’000 Rs.’000
ASSETS
Cash and cash equivalents a 8,269,606 226 8,269,832 12,882,518 28,471 12,910,989
Balances with central banks 12,188,834 – 12,188,834 17,342,959 – 17,342,959
Placements with banks b 2,287,384 (452,124) 1,835,260 12,128,793 (454,430) 11,674,363
Derivative financial instruments c – 169,916 169,916 – 39,612 39,612
Other financial assets held for trading d 15,037,113 (4,660,172) 10,376,941 11,983,361 (5,565,351) 6,418,010
Loans and receivables to banks e – 568,704 568,704 – 580,158 580,158
Loans and receivables to other customers f 243,720,692 4,812,255 248,532,947 308,336,674 6,149,293 314,485,967
Financial investments - Available for sale g 75,538,705 815,949 76,354,654 61,559,365 (143,970) 61,415,395
Financial investments - Held-to-maturity – – – – – –
Investments in subsidiaries h 353,898 – 353,898 315,444 – 315,444
Investments in associates 44,331 – 44,331 44,331 – 44,331
Property, plant & equipment 5,929,561 – 5,929,561 7,907,030 – 7,907,030
Intangible assets 419,311 – 419,311 467,014 – 467,014
Leasehold property 79,188 – 79,188 78,246 – 78,246
Deferred tax assets i – 117,056 117,056 – 359,617 359,617
Other assets j 6,191,519 (421,893) 5,769,626 8,053,551 (763,037) 7,290,514
Total Assets 370,060,142 949,917 371,010,059 441,099,286 230,363 441,329,649
Notes to the Financial Statements

Commercial Bank of Ceylon PLCCommercial Bank of Ceylon PLC
Annual Report 2012Annual Report 2012
This is Commercial BankOperating HighlightsFinancial Highlights
Letter from the ChairmanManaging Director’s ReviewManagement Discussion and AnalysisStewardshipFinancial ReportsAnnexes
420
January 01, 2011 December 31, 2011
PreviousEffect of
transition to New PreviousEffect of
transition to New
SLASs SLASs SLASs SLASs SLASs SLASs Note Rs.’000 Rs.’000 Rs.’000 Rs.’000 Rs.’000 Rs.’000
LIABILITIES
Due to Banks k 6,116,521 2,394 6,118,915 11,539,755 34,350 11,574,105
Derivative financial instruments l – 27,080 27,080 – 435,171 435,171
Other financial liabilities held for trading – – – – – –
Due to other customers m 259,778,911 3,887,136 263,666,047 318,461,431 5,293,317 323,754,748
Other borrowings n 54,028,907 3,855 54,032,762 49,592,779 10,363 49,603,142
Debt securities issued – – – – – –
Current tax liabilities o 2,448,039 – 2,448,039 1,137,537 167,905 1,305,442
Deferred tax liabilities p 892,441 117,056 1,009,497 1,327,580 266,506 1,594,086
Other provisions 2,369 – 2,369 535 – 535
Other liabilities q 11,322,424 (3,982,635) 7,339,789 13,829,997 (5,647,615) 8,162,382
Due to subsidiaries 41,448 – 41,448 29,734 – 29,734
Subordinated term debts r 2,127,030 232,215 2,359,245 973,210 132,429 1,105,639
Total liabilities 336,758,090 287,101 337,045,191 396,872,558 692,426 397,564,984
EQUITY
Stated capital 10,811,193 – 10,811,193 16,473,861 – 16,473,861
Statutory reserves 2,471,830 – 2,471,830 2,890,305 – 2,890,305
Retained earnings s 1,515,928 (153,134) 1,362,794 2,865,430 (318,094) 2,547,336
Other reserves t 18,503,101 (815,950) 19,319,051 21,997,132 (143,969) 21,853,163
Total equity to equity owners of the bank 33,302,052 662,816 33,964,868 44,226,728 (462,063) 43,764,665
Non-controlling interest – – – – – –
Total equity 33,302,052 662,816 33,964,868 44,226,728 (462,063) 43,764,665
Total liabilities and equity 370,060,142 949,917 371,010,059 441,099,286 230,363 441,329,649
Contingent liabilities and commitments 196,617,166 – 196,617,166 234,551,169 – 234,551,169
Notes to the Financial Statements

Commercial Bank of Ceylon PLCCommercial Bank of Ceylon PLC
Annual Report 2012Annual Report 2012
This is Commercial BankOperating HighlightsFinancial Highlights
Letter from the ChairmanManaging Director’s Review
Management Discussion and AnalysisStewardship
Financial ReportsAnnexes
421
59.3 Reconciliation of Comprehensive Income for the year ended December 31, 2011
For the year ended December 31, 2011 - Group 2011 - Bank
PreviousEffect of
transition to New PreviousEffect of
transition to NewSLASs SLASs SLASs SLASs SLASs SLASs
Note Rs.’000 Rs.’000 Rs.’000 Rs.’000 Rs.’000 Rs.’000
Gross income 45,465,380 373,564 45,838,944 45,483,391 375,826 45,859,217
Interest income f,a,u 37,907,740 406,008 38,313,748 37,947,239 408,304 38,355,543
Less: Interest expenses m,c 19,627,957 7,391 19,635,348 19,642,938 7,391 19,650,329
Net interest income 18,279,783 398,617 18,678,400 18,304,301 400,913 18,705,214
Fees and commission income q 3,799,503 (34,428) 3,765,075 3,799,616 (34,428) 3,765,188
Less: Fees and commission expenses 439,825 – 439,825 439,825 – 439,825
Net fees and commission income 3,359,678 (34,428) 3,325,250 3,359,791 (34,428) 3,325,363
Net gain/(loss) from trading f (463,588) 1,950 (461,638) (463,588) 1,950 (461,638)
Net gain/(loss) from financial instruments designated at fair value through profit or loss – – – –
Net gain/(loss) from financial investments 38,030 – 38,030 38,030 – 38,030
Other operating income (net) u 4,183,695 34 4,183,729 4,162,094 – 4,162,094
Total operating income 25,397,598 366,173 25,763,771 25,400,628 368,435 25,769,063
Impairment charges for loans and other losses f 1,503,227 243,518 1,746,745 1,564,381 243,518 1,807,899
Net operating income 23,894,371 122,655 24,017,026 23,836,247 124,917 23,961,164
Less: Expenses
Personnel expenses q,v 6,133,599 212,822 6,346,421 6,076,906 212,787 6,289,693
Other expenses w 5,178,292 – 5,178,292 5,248,973 2,296 5,251,269
Operating profit before value added tax (VAT) 12,582,480 (90,167) 12,492,313 12,510,368 (90,166) 12,420,202
Less: Value added tax (VAT) on financial services 1,522,972 – 1,522,972 1,522,972 – 1,522,972
Operating profit after value added tax (VAT) 11,059,508 (90,167) 10,969,341 10,987,396 (90,166) 10,897,230
Share of profits/(losses) of associates h 9,113 1,765 10,878 – – –
Profit before income tax 11,068,621 (88,402) 10,980,219 10,987,396 (90,166) 10,897,230
Less: Income tax expense o 2,973,468 74,450 3,047,918 2,939,567 74,794 3,014,361
Profit for the year 8,095,153 (162,852) 7,932,301 8,047,829 (164,960) 7,882,869
Profit attributable to:
Equity owners of the bank 8,094,888 (162,826) 7,932,062 8,047,829 (164,960) 7,882,869
Non-controlling interest x 265 (26) 239 – – –
Profit for the year 8,095,153 (162,852) 7,932,301 8,047,829 (164,960) 7,882,869
Notes to the Financial Statements

Commercial Bank of Ceylon PLCCommercial Bank of Ceylon PLC
Annual Report 2012Annual Report 2012
This is Commercial BankOperating HighlightsFinancial Highlights
Letter from the ChairmanManaging Director’s ReviewManagement Discussion and AnalysisStewardshipFinancial ReportsAnnexes
422
Explanation of Transition to SLFRS
Notes to the Reconciliations
(a) Cash and Cash Equivalents
The difference in Cash and Cash Equivalents is mainly due to interest receivable on Nostro accounts being recognised as part of the Cash and Cash Equivalents at the end every year as part of the amortised balance according to new SLASs requirement. The respective interest receivable balance was previously classified under other assets.
The impact arising from the change is summarised as follows:
Group Bank
January 1, 2011
December 31, 2011
January 1, 2011
December 31, 2011
Rs.’000 Rs.’000 Rs.’000 Rs.’000
Consolidated Statement of Financial Position
Reclassification
Interest receivable on call placement 226 28,471 226 28,471
226 28,471 226 28,471
(b) Placements with Banks
The interest receivable on time placements was recognised as part of the Placements with Banks at the year end as part of the amortised cost according to new SLASs requirement. The respective interest receivable balance was previously classified under other assets.
A non-interest earning placement which is subject to litigation with another bank hither to recorded under ‘Placements with Banks’ has now been categorised under ‘Loans Receivable to Banks’.
The impact arising from the change is summarised as follows:
Group BankJanuary 1,
2011December 31,
2011January 1,
2011December 31,
2011Rs.’000 Rs.’000 Rs.’000 Rs.’000
Consolidated Statement of Financial Position
Reclassification
Placement transferred to loans and receivable to Bank (463,704) (475,380) (463,704) (475,380)
Interest receivable on other placement 11,580 20,950 11,580 20,950
(452,124) (454,430) (452,124) (454,430)
Notes to the Financial Statements

Commercial Bank of Ceylon PLCCommercial Bank of Ceylon PLC
Annual Report 2012Annual Report 2012
This is Commercial BankOperating HighlightsFinancial Highlights
Letter from the ChairmanManaging Director’s Review
Management Discussion and AnalysisStewardship
Financial ReportsAnnexes
423
(c) Derivative Financial Instruments
Forward transactions with the customers were recorded in the Forward Equalisation account and the net balances of those transactions were reported under Other Assets or Other Liabilities. Profits on forward transactions on the assets side of the equalisation account is now reported as a separate line item in the Statement of Financial Position under the above caption.
The impact arising from the change is summarised as follows:
Group Bank
January 1, 2011
December 31, 2011
January 1, 2011
December 31, 2011
Rs.’000 Rs.’000 Rs.’000 Rs.’000
Consolidated Statement of Comprehensive Income
Reversal of interest on SWAPs – (59) – (59)
– (59) – (59)
Consolidated Statement of Financial Position
Reclassification
Recognition of profits on forward transactions 169,916 39,612 169,916 39,612
169,916 39,612 169,916 39,612
(d) Other Financial Assets Held for Trading
The Bank in its ordinary course of business is engaged in speculative activities and investments made on this basis were recorded under various asset categories as per previous SLAS. Eg. Dealing Securities, Government Treasury Bills and Bonds etc. All such items that the Bank purchased with the intention of selling in the short term is now classified as ‘Held for Trading’ as per new SLAS. Further certain investments previously classified under trading portfolio now have been reclassified to Loans and Receivables on the assumption that they do not have an active market to determine the fair-value of the instrument.
The impact arising from the change is summarised as follows:
Group Bank
January 1, 2011
December 31, 2011
January 1, 2011
December 31, 2011
Rs.’000 Rs.’000 Rs.’000 Rs.’000
Consolidated Statement of Financial Position
Reclassification
Government US$ Bonds transferred to loans and receivable (4,604,673) (5,482,391) (4,604,673) (5,482,391)
Treasury Bills portfolio transferred to loans and receivable (55,499) (82,960) (55,499) (82,960)
(4,660,172) (5,565,351) (4,660,172) (5,565,351)
Notes to the Financial Statements

Commercial Bank of Ceylon PLCCommercial Bank of Ceylon PLC
Annual Report 2012Annual Report 2012
This is Commercial BankOperating HighlightsFinancial Highlights
Letter from the ChairmanManaging Director’s ReviewManagement Discussion and AnalysisStewardshipFinancial ReportsAnnexes
424
(e) Loans and Receivables to Banks
A non-interest earning placement which is subject to litigation with another bank hither to recorded under ‘Placements with Banks’ now classified under ‘Loans receivable to Banks’.
Further investments made on debentures of the banks has now have been reclassified under this category.
The impact arising from the change is summarised as follows:
Group Bank
January 1, 2011
December 31, 2011
January 1, 2011
December 31, 2011
Rs.’000 Rs.’000 Rs.’000 Rs.’000
Consolidated Statement of Financial Position
Reclassification
Placement transferred from placements with banks 463,704 475,380 463,704 475,380
Debentures transferred from loans and receivable from other customers 105,000 95,000 105,000 95,000
Interest receivable on debentures – 9,778 – 9,778
568,704 580,158 568,704 580,158
(f) Loans and Receivables to Other Customers
Interest receivable on ‘Loans and Receivable’ hither to recorded under Other Assets is now categorised under ‘Loans and Receivable to Other customers’.
Regulatory time based provisioning replaced with the impairment provisioning methodology based on the incurred loss model as per new SLAS requirement.
According to Sri Lanka Accounting Standard - LKAS 39 on ‘Financial Instrument Recognition and Measurement’, the amortised cost of the financial Asset includes the cumulative amortisation using the Effective Interest Rate (EIR) method. Accordingly, the interest receivable has been added to the unwinding value of the Financial Assets.
The un-amortised staff costs arising from the Staff Loans being deducted from loans and receivables and classified under other assets.
The impact arising from the change is summarised as follows:
Group Bank
January 1, 2011
December 31, 2011
January 1, 2011
December 31, 2011
Rs.’000 Rs.’000 Rs.’000 Rs.’000
Consolidated Statement of Comprehensive Income
Reversal of interest in suspense – 113,426 – 113,426
Unwinding interest - Reversal of IIS already accrued – (174,353) – (174,353)
Unwinding interest - Reversal of cash collected (in good funds) – (1,028) – (1,028)
Accrual of interest on impaired loans – 285,139 – 285,139
Reversal of MTM loss on UDA Debenture due to reclassification as L&R – 1,951 – 1,951
Impairment charge for loans and other losses – 243,517 – 243,517
– 468,653 – 468,653
Notes to the Financial Statements

Commercial Bank of Ceylon PLCCommercial Bank of Ceylon PLC
Annual Report 2012Annual Report 2012
This is Commercial BankOperating HighlightsFinancial Highlights
Letter from the ChairmanManaging Director’s Review
Management Discussion and AnalysisStewardship
Financial ReportsAnnexes
425
Group Bank
January 1, 2011
December 31, 2011
January 1, 2011
December 31, 2011
Rs.’000 Rs.’000 Rs.’000 Rs.’000
Consolidated Statement of Financial Position
Reclassification
Government US$ Bonds transferred from financial assets held for trading 4,604,673 5,482,393 4,604,673 5,482,393
Treasury Bills portfolio transferred from financial assets held for trading 55,499 82,960 55,499 82,960
Interest receivable on loans and advances 1,525,801 2,087,148 1,525,801 2,087,148
Interest receivable on investments 334,729 416,305 334,729 416,305
Debentures transferred to loans and receivable to Bank (105,000) (95,000) (105,000) (95,000)
New SLAS Adjustments
Reversal of provision for credit losses as per CBSL 4,899,632 5,020,659 4,899,632 5,020,659
Reversal of interest in suspense 6,434,845 6,548,272 6,434,845 6,548,272
Allowance for impairment (11,346,106) (11,600,892) (11,346,106) (11,600,892)
Unamortised staff cost (1,591,817) (1,792,552) (1,591,817) (1,792,552)
4,812,255 6,149,293 4,812,255 6,149,293
(g) Financial Investments - Available-for-Sale
The Bank invests on certain assets with the intention of holding them to maturity. These assets are now categorised under ‘Financial Investments Available-for-Sale’ and recorded in the Statement of Financial Position at market value. These assets previously carried at cost. The difference between the cost and the fair value is accounted in the Statement of Change in Equity through ‘Other Comprehensive Income’.
The impact arising from the change is summarised as follows:
Group BankJanuary 1,
2011December 31,
2011January 1,
2011December 31,
2011Rs.’000 Rs.’000 Rs.’000 Rs.’000
Consolidated Statement of Comprehensive Income
Mark to market valuation on Government Securities (957,776) (957,776)
Mark to market valuation on quoted shares – (2,143) – (2,143)
– (959,919) – (959,919)
Consolidated Statement of Financial Position
New SLAS Adjustments
Mark to market valuation on Government Securities 810,887 (146,889) 810,887 (146,889)
Mark to market valuation on quoted shares 5,062 2,919 5,062 2,919
815,949 (143,970) 815,949 (143,970)
Notes to the Financial Statements

Commercial Bank of Ceylon PLCCommercial Bank of Ceylon PLC
Annual Report 2012Annual Report 2012
This is Commercial BankOperating HighlightsFinancial Highlights
Letter from the ChairmanManaging Director’s ReviewManagement Discussion and AnalysisStewardshipFinancial ReportsAnnexes
426
(h) Investments in Associates
This represents the mark to market gain on the investments made in an Associate Company due to reclassification of the investment as ‘Financial Assets Available-for-Sale’.
The impact arising from the change is summarised as follows:
Group Bank
January 1, 2011
December 31, 2011
January 1, 2011
December 31, 2011
Rs.’000 Rs.’000 Rs.’000 Rs.’000
Consolidated Statement of Comprehensive Income
Share of profits - Income Statement 1,765
Share of other comprehensive income 5,465
– 7,230 – –
Consolidated Statement of Financial Position
New SLAS Adjustments
Mark to market valuation of shares by associate company 27,278 34,874
27,278 34,874 – –
(i) Deferred Tax Assets
The ‘Deferred Tax Assets’ were netted off against the ‘Deferred Tax Liabilities’ which has been brought as a separate line item under Deferred Tax Assets per the New SLAS.
The impact arising from the change is summarised as follows:
Group BankJanuary 1,
2011December 31,
2011January 1,
2011December 31,
2011Rs.’000 Rs.’000 Rs.’000 Rs.’000
Consolidated Statement of Financial Position
Reclassification
Reclassified from deferred tax liability 128,496 363,711 117,056 359,617
128,496 363,711 117,056 359,617
(j) Other Assets
Resulting changes due to the classification as per new SLAS.
The impact arising from the change is summarised as follows:
Group BankJanuary 1,
2011December 31,
2011January 1,
2011December 31,
2011Rs.’000 Rs.’000 Rs.’000 Rs.’000
Consolidated Statement of Financial Position
Reclassification
Interest and fees receivable on loans and other investments (1,874,357) (2,560,868) (1,871,074) (2,559,417)
Reversal of net forward transaction profit (142,636) – (142,636) –
New SLAS Adjustments
Unamortised staff cost (Refer Note f) 1,591,817 1,792,552 1,591,817 1,792,552
Prepayments 3,826
(425,176) (768,316) (421,893) (763,039)
Notes to the Financial Statements

Commercial Bank of Ceylon PLCCommercial Bank of Ceylon PLC
Annual Report 2012Annual Report 2012
This is Commercial BankOperating HighlightsFinancial Highlights
Letter from the ChairmanManaging Director’s Review
Management Discussion and AnalysisStewardship
Financial ReportsAnnexes
427
(k) Due to Banks
Interest payable to banks hitherto classified under ‘Other Liabilities’ has now been added back to ‘Due to Banks Balance’ as part of amortised cost.
The impact arising from the change is summarised as follows:
Group BankJanuary 1,
2011December 31,
2011January 1,
2011December 31,
2011Rs.’000 Rs.’000 Rs.’000 Rs.’000
Consolidated Statement of Financial Position
Reclassification
Interest payable on borrowings 2,394 34,350 2,394 34,350
2,394 34,350 2,394 34,350
(l) Derivative Financial Instruments
Forward transactions with the customers were recorded in the Forward Equalisation account and the net balances arrising from of those transactions were reported under Other Assets. Loss on forward transactions which was on the assets side of the equalisation account is now reported as a separate line item in the Statement of Financial Position.
The impact arising from the change is summarised as follows:
Group BankJanuary 1,
2011December 31,
2011January 1,
2011December 31,
2011Rs.’000 Rs.’000 Rs.’000 Rs.’000
Consolidated Statement of Financial Position
Reclassification
Recognition of forward transaction loss 27,080 435,171 27,080 435,171
27,080 435,171 27,080 435,171
(m) Due to Other Customers
Interest payable to customers hitherto classified under ‘Other Liabilities’ has now been added back to ‘Due to Other Customers’ as part of amortised cost. Further, interest on deposits being recorded using EIR.
The impact arising from the change is summarised as follows:
Group BankJanuary 1,
2011December 31,
2011January 1,
2011December 31,
2011Rs.’000 Rs.’000 Rs.’000 Rs.’000
Consolidated Statement of Comprehensive Income
EIR adjustment on Deposits – 7,332 – 7,332
– 7,332 – 7,332
Consolidated Statement of Financial Position
Reclassification
Interest payable on deposits 4,173,991 5,572,839 4,173,991 5,572,839
New SLAS Adjustments
EIR adjustment (286,855) (279,522) (286,855) (279,522)
3,887,136 5,293,317 3,887,136 5,293,317
Notes to the Financial Statements

Commercial Bank of Ceylon PLCCommercial Bank of Ceylon PLC
Annual Report 2012Annual Report 2012
This is Commercial BankOperating HighlightsFinancial Highlights
Letter from the ChairmanManaging Director’s ReviewManagement Discussion and AnalysisStewardshipFinancial ReportsAnnexes
428
(n) Other Borrowings
Interest of refinance borrowings hitherto categorised under ‘Other Liabilities’ has now been added back to ‘Other Borrowings’.
The impact arising from the change is summarised as follows:
Group BankJanuary 1,
2011December 31,
2011January 1,
2011December 31,
2011Rs.’000 Rs.’000 Rs.’000 Rs.’000
Consolidated Statement of Financial Position
Reclassification
Interest payable on borrowings 569 6,170 3,855 10,363
569 6,170 3,855 10,363
(o) Current Tax Liabilities
The impact arising due to SLFRS adjustments is summarised as follows:
Group BankJanuary 1,
2011December 31,
2011January 1,
2011December 31,
2011Rs.’000 Rs.’000 Rs.’000 Rs.’000
Consolidated Statement of Comprehensive Income
Income tax expense – 74,450 – 74,450
– 74,450 – 74,450
Consolidated Statement of Financial Position
New SLAS Adjustment
Current tax liability – 167,905 – 167,905
– 167,905 – 167,905
(p) Deferred Tax Liabilities
The ‘Deferred Tax Assets’ which was previously netted off against ‘Deferred Tax Liabilities’ now being disclosed separately. Further, deferred tax impact due to New SLAS adjustments has been recorded under Deferred Tax liabilities.
The impact arising from the change is summarised as follows:
Group BankJanuary 1,
2011December 31,
2011January 1,
2011December 31,
2011Rs.’000 Rs.’000 Rs.’000 Rs.’000
Consolidated Statement of Financial Position
Reclassification
Deferred tax asset reclassified 128,496 363,711 117,056 359,617
New SLAS Adjustment
Deferred Tax Impact – (93,454) – (93,111)
128,496 270,257 117,056 266,506
Notes to the Financial Statements

Commercial Bank of Ceylon PLCCommercial Bank of Ceylon PLC
Annual Report 2012Annual Report 2012
This is Commercial BankOperating HighlightsFinancial Highlights
Letter from the ChairmanManaging Director’s Review
Management Discussion and AnalysisStewardship
Financial ReportsAnnexes
429
(q) Other Liabilities
Interest payable on Deposits and Other borrowings hitherto recognised under ‘Other Liabilities’ has now been reclassified under the relevant borrowings. Forward Equalisation balances previously recorded under other liabilities, disclosed separately as ‘Derivative Financial Instruments’.
Commission income which hither recognised on the cash basis being adjusted to recognise the income over the period of the underlying instrument.
Further, provision has been made for amounts payable o/a leave encashment and recorded under other liabilities.
The impact arising from the change is summarised as follows:
Group BankJanuary 1,
2011December 31,
2011January 1,
2011December 31,
2011Rs.’000 Rs.’000 Rs.’000 Rs.’000
Consolidated Statement of Comprehensive Income
Derecognition of commission income – (34,428) – (34,428)
Provision for leave encashment – 29,965 – 29,965
– (4,463) – (4,463)
Consolidated Statement of Financial Position
Reclassification
Interest payable on Deposits and other borrowings (4,412,447) (5,745,789) (4,412,453) (5,749,984)
Forward equalisation – (395,668) – (395,668)
New SLAS Adjustments
Provision for leave encashment 302,574 332,539 302,574 332,539
Related party payable – – – 3,826
Deferment of commission income 127,244 161,672 127,244 161,672
(3,982,629) (5,647,246) (3,982,635) (5,647,615)
(r) Subordinated Term Debts
Under new SLAS interest receivable on borrowings being added back to respective line item in order reflect amortised cost in the statement of financial position.
The impact arising from the change is summarised as follows:
Group BankJanuary 1,
2011December 31,
2011January 1,
2011December 31,
2011Rs.’000 Rs.’000 Rs.’000 Rs.’000
Consolidated Statement of Financial Position
Reclassification
Interest payable on Debentures 232,215 132,429 232,215 132,429
232,215 132,429 232,215 132,429
Notes to the Financial Statements

Commercial Bank of Ceylon PLCCommercial Bank of Ceylon PLC
Annual Report 2012Annual Report 2012
This is Commercial BankOperating HighlightsFinancial Highlights
Letter from the ChairmanManaging Director’s ReviewManagement Discussion and AnalysisStewardshipFinancial ReportsAnnexes
430
(s) Retained Earnings
The impact arising due to new SLAS adjustments is summarised as follows:
Group BankJanuary 1,
2011December 31,
2011January 1,
2011December 31,
2011Rs. Rs. Rs. Rs.
Consolidated Statement of Financial Position
New SLAS Adjustments
Reversal of interest in suspense 6,434,845 113,426 6,434,845 113,426
Reversal of provisions 4,899,631 1,479,754 4,899,631 1,479,753
Allowance for impairment (11,346,106) (1,613,512) (11,346,106) (1,613,512)
EIR adjustment on deposits 286,855 (7,332) 286,855 (7,332)
UDA MTM Provision Reversal due to reclassified as L&R 1,400 1,951 1,400 1,951
Leave encashment (302,574) (29,965) (302,574) (29,965)
Derecognision of commission income (127,244) (34,428) (127,244) (34,428)
Interest rate SWAPs 59 (59) 59 (59)
Change in the income tax – (167,562) – (167,905)
Change in the deferred tax – 93,110 – 93,111
Share of profit/(loss) from associates 27,277 7,230 – –
Change in non-controlling interest – 26 – –
(125,857) (157,361) (153,134) (164,960)
(t) Other Reserves
The Bank invests on certain assets with the intention of holding it to maturity. However, these assets are categorised under ‘Financial investments available-for-sale’ and are recorded in the Statement of Financial Position at fair value. The difference between the cost and the fair value is accounted in the Statement of Change in Equity through ‘Other Comprehensive Income’.
The impact arising from the change is summarised as follows:
Group BankJanuary 1,
2011December 31,
2011January 1,
2011December 31,
2011Rs. Rs. Rs. Rs.
Consolidated Statement of Financial Position
New SLAS Adjustments
Mark to market valuation on Government Securities 810,887 (146,889) 810,887 (146,889)
Mark to market valuation on Quoted shares 5,062 2,919 5,062 2,919
Other movements – (1,090)
815,950 (145,060) 815,949 (143,970)
Notes to the Financial Statements

Commercial Bank of Ceylon PLCCommercial Bank of Ceylon PLC
Annual Report 2012Annual Report 2012
This is Commercial BankOperating HighlightsFinancial Highlights
Letter from the ChairmanManaging Director’s Review
Management Discussion and AnalysisStewardship
Financial ReportsAnnexes
431
(u) Interest Income
Arising due to amortisation of day one difference on Staff loans granted at concessionary rates and due to recording of interest income on prepaid deposits as follows:
Group BankJanuary 1,
2011December 31,
2011January 1,
2011December 31,
2011Rs. Rs. Rs. Rs.
Consolidated Statement of Comprehensive Income
Amortised staff cost - Interest income – 182,857 – 182,823
Interest on pre-paid Deposits – – – 2,296
– 182,857 – 185,119
(v) Personnel Expenses
There was a difference as a result of amortisation of day one difference on Staff loans granted at concessionary rates and was duly accounted.
The impact arising from the change is summarised as follows:
Group BankJanuary 1,
2011December 31,
2011January 1,
2011December 31,
2011Rs. Rs. Rs. Rs.
Consolidated Statement of Comprehensive Income
Amortised staff cost - Personnel expenses – 182,857 – 182,823
– 182,857 – 182,823
(w) Other Expenses
Arising due to adjustment on prepaid interest free deposit for rent.
The impact arising from the change is summarised as follows:
Group BankJanuary 1,
2011December 31,
2011January 1,
2011December 31,
2011Rs. Rs. Rs. Rs.
Consolidated Statement of Comprehensive Income
Rent expense – – – 2,296
– – – 2,296
(x) Non-Controlling Interest (NCI)
Change in the net assets of the subsidiaries due to the SLFRS related adjustmnets.
Group BankJanuary 1,
2011December 31,
2011January 1,
2011December 31,
2011Rs. Rs. Rs. Rs.
Consolidated Statement of Comprehensive Income
Change in non-controlling income – (26) – -
(26)
Consolidated Statement of Financial Position
New SLAS Adjustments
Change in net asset in the Group subsidiary (26)
(26)
Notes to the Financial Statements

Commercial Bank of Ceylon PLCCommercial Bank of Ceylon PLC
Annual Report 2012Annual Report 2012
This is Commercial BankOperating HighlightsFinancial Highlights
Letter from the ChairmanManaging Director’s ReviewManagement Discussion and AnalysisStewardshipFinancial ReportsAnnexes
432
60. Financial Risk Management
The Bank’s Risk Strategy focuses on managing principal risks assumed by the Bank while striking a fair balance between the risk return trade-off and the efficient capital allocation across the risk exposures. The Bank’s Risk strategy reinforces and supports the organisation in achieving its overall strategic objective within a pre-defined risk environment in alignment with the Bank’s overall risk profile.
Integrity and the effectiveness of the Risk Management Organisational Structure is well supported by the Bank’s robust Risk Governance Framework which consist of Board and Senior Management oversight, independent risk management function, supporting policy framework, risk related committees etc. The Bank actively encourages the business managers as “risk owners” to assume calculated risk within the stipulated risk appetite and tolerance levels.
The Bank is a major participant in the banking and financial services industry. The financial risks associated with these activities are a significant component of the Bank’s overall risk exposure. The key financial risks faced by the Bank are:
Credit risk
Market risk
Liquidity risk
Operational risk
Financial risks are managed and overseen as part of the Bank’s broader risk management framework and governance processes.
Based on the exemption granted by The Institute of Chartered Accountants of Sri Lanka on first time adoption of the new Sri Lanka Accounting Standards, the comparative details of quantitative disclosures relating to the key risks faced by the Bank, have not been disclosed in this Note.
Credit Risk
Credit risk is the risk of loss resulting from the failure of borrowers or counterparties to meet their debt or contractual obligations as a result of deterioration in the credit quality of the borrower or counterparty. Exposure to credit risk arises basically from lending and trading activities.
The Bank always considers that credit risk management should be a value enhancing activity that goes beyond regulatory compliance, encompassing:
I. An appropriate credit risk environment which seeks risk optimisation.
II. Operating under a sound credit approval and granting process.
III. Maintaining of an appropriate credit administration, measurement and monitoring process and
IV. Ensuring of adequate controls over credit risk on a continuous basis.
Following the convergence of Sri Lanka Accounting Standards with the International Financial Reporting Standards (IFRSs), the classification criteria of loans and advances as NPA (impaired) has been changed and a comprehensive explanation of the Bank’s policy is given under Note 3.3.10 - Impairment of Financial Assets in the Notes to the Financial Statements].
With the automation of the credit evaluation process during the year 2012, the Bank is working towards its risk grading system with the potential capability of predicting the Probability of Default (PD), Loss Given Default (LGD) and the Exposure at Default (EAD) of a borrower. These indicators would help the Lending Officers to measure the risk profile of the credit portfolios in an objective manner.
Notes to the Financial Statements

Commercial Bank of Ceylon PLCCommercial Bank of Ceylon PLC
Annual Report 2012Annual Report 2012
This is Commercial BankOperating HighlightsFinancial Highlights
Letter from the ChairmanManaging Director’s Review
Management Discussion and AnalysisStewardship
Financial ReportsAnnexes
433
Segmentation of NPA Portfolio as at December 31, 2012 by Geographic Area
Rs. ’000
Province/Geographic Area Total NPA
SpecificProvisions for
Bad Debts General
Provision
Central 611,314 186,755 68,186
Eastern 163,835 69,763 13,605
North Central 216,714 129,363 20,674
Northern 673,105 205,841 26,724
North Western 737,208 238,537 68,390
Sabaragamuwa 326,928 160,600 25,914
Southern 1,377,643 694,726 62,728
Uva 127,520 56,520 15,514
Western 8,412,005 3,245,594 1,067,816
Bangladesh 205,778 90,048 66,342
Maldives – – –
Other Foreign Geographies – – –
Total 12,852,050 5,077,747 1,435,893
Note: The above figures have been prepared as per SLAS and may differ from SLFRS figures.
Notes to the Financial Statements

Commercial Bank of Ceylon PLCCommercial Bank of Ceylon PLC
Annual Report 2012Annual Report 2012
This is Commercial BankOperating HighlightsFinancial Highlights
Letter from the ChairmanManaging Director’s ReviewManagement Discussion and AnalysisStewardshipFinancial ReportsAnnexes
434
Notes to the Financial Statements

Commercial Bank of Ceylon PLCCommercial Bank of Ceylon PLC
Annual Report 2012Annual Report 2012
This is Commercial BankOperating HighlightsFinancial Highlights
Letter from the ChairmanManaging Director’s Review
Management Discussion and AnalysisStewardship
Financial ReportsAnnexes
435
Liquidity Risk
Liquidity risk is the potential vulnerability of a financial institution for not being able to fund increases in assets and meet contractual and contingent financial obligations, on-or off-Balance Sheet, as they come due without incurring unacceptable losses.
Banks in the business of financial intermediation are by nature vulnerable to liquidity and solvency problems resulting from asset and liability mismatches. Thus, the Bank’s primary objective in liquidity risk management is to ensure adequate funding for its businesses throughout market cycles, including periods of financial stress. To achieve this objective, the Bank continuously analyse and monitor liquidity risk, maintain an adequate margin of safety in liquid resources and access diverse funding sources to meet liquidity requirements.
The Bank’s liquidity risk governance process is designed to ensure that its liquidity position remains strong while efficiency of resources is not compromised. Accordingly, the management of funding and liquidity risk is centralised at the Treasury Asset and Liability Management (ALM) desk which approach maximises liquidity access, minimises funding costs and enhances identification and coordination of liquidity risk and involves frequent communication with the business segments, comprehensive market-based pricing of all financial assets and liabilities, continuous Balance Sheet monitoring, frequent stress testing of liquidity sources, and frequent reporting and communication provided to senior management and the Board of Directors regarding the Bank’s liquidity position.
Treasury is entrusted with the task of monitoring daily liquidity requirement of the Bank. This process ensures maintenance of sufficient liquidity to meet daily liquidity obligations and ability to withstand a period of Bank specific/market specific liquidity stress and reports through Head of Treasury to Asset and Liability Management Committee (ALCO). ALCO meets at least fortnightly and is responsible for managing and controlling the overall liquidity of the Bank and reviews the impact of strategic decisions on Bank liquidity.
Note 50 (b) to the Financial Statements discloses the maturity analysis of the Bank’s assets and liabilities
Market Risk
Market risk is the likelihood of the Bank incurring losses as a result of values of assets and liabilities or revenues being adversely affected by changes in financial market conditions such as movements in interest rates, exchange rates, equity prices, or commodity prices. The Banks’ exposure to market risk arises as a result of dealing in financial products including loans, deposits, securities, short term borrowings, long term debt etc., to facilitate both customer-driven and proprietary transactions.
Market Risk Management Unit (MRMU) of the Integrated Risk Management Department (IRMD) works in close relationship with various business units and control/monitoring units of the Bank in order to identify, measure, monitor, and report market risk related exposures thereby providing transparency into Banks’ market risk profile. Treasury Middle Office, an integral part of MRMU, independently evaluates and monitors transactions carried out by the Banks’ Treasury from a risk perspective.
Based on the exemptions granted on First-time Adoption in SLFRS 7 - Financial Instruments Disclosures, quantitative disclosures of market risk have not been provided in this Note.
Operational Risk
Operational risk is the risk of losses resulting from inadequate or failed internal processes, people, and systems or from external events. This definition includes legal risk, but excludes strategic and reputational risk. The legal risk includes, but is not limited to, exposure to fines, penalties, or punitive damages resulting from supervisory actions, as well as private settlements.
The Bank recognises that operational risk is inherent in all business activities and can bring unprecedented losses or damages to its business through direct or indirect financial loss, brand or reputational damage, customer dissatisfaction, or legal or regulatory penalties if such risks are not objectively managed.
Notes to the Financial Statements

Commercial Bank of Ceylon PLCCommercial Bank of Ceylon PLC
Annual Report 2012Annual Report 2012
This is Commercial BankOperating HighlightsFinancial Highlights
Letter from the ChairmanManaging Director’s ReviewManagement Discussion and AnalysisStewardshipFinancial ReportsAnnexes
436
The management of operational risk is therefore, an important priority of the Bank. The Bank has a comprehensive operational risk programme that enables the identification, measurement, monitoring, controlling and reporting of inherent and emerging operational risks.
The Bank’s operational risk governance structure includes the Board Integrated Risk Management Committee (BIRMC) which is overseeing the operational risk management programme maintains by the Executive Integrated Risk Management Committee (EIRMC). The business units of the Bank are responsible for implementing the framework as well as the day-to-day management of operational risk, creating a partnership that ensures close monitoring and increasing awareness for operational risk.
Capital Management
The Regulatory Capital requirements are set by the Central Bank of Sri Lanka are based on Basel II framework. The details of the computation of capital and the ratios of the Group as at December 31, 2012 are given below:
2012 2011Rs. ’000 Rs. ’000
Computation of Capital
Tier I: Core Capital
Paid-up ordinary shares 18,008,797 17,945,271
Statutory reserve fund 3,245,819 2,740,902
Published retained profits/(accumulated losses)(+/-) 1,557 43,865
General and other reserves 24,307,575 17,856,434
Minority interests (consistent with the above capital constituents) 32,141 29,615
Less:
Other intangible assets (506,160) (475,038)
Advances granted to employees of the Bank for the purchase of shares of the Bank (ESOP) (1,548) (2,105)
50% Investments in the capital of other banks and financial institutions (402) (402)
Total eligible core capital (Tier I capital) 45,087,778 38,138,542
Tier II : Supplementary Capital
Revaluation reserves (as approved by Central Bank of Sri Lanka) 2,034,231 651,037
General provisions 1,500,098 1,201,991
Approved subordinated term debt 778,238 972,880
Less:
50% Investments in the capital of other banks and financial institutions (402) (402)
Total Eligible Supplementary Capital (Tier II capital) 4,312,165 2,825,506
Total capital base 49,399,944 40,964,048
Computation of Ratios
Total risk-weighted assets (RWA)
Total risk-weighted assets for credit risk 319,302,207 280,074,154
Total risk-weighted assets market risk 3,082,784 3,635,371
Total risk-weighted assets operational risk 34,562,622 31,262,271
Sub total 356,947,613 314,971,795
Notes to the Financial Statements
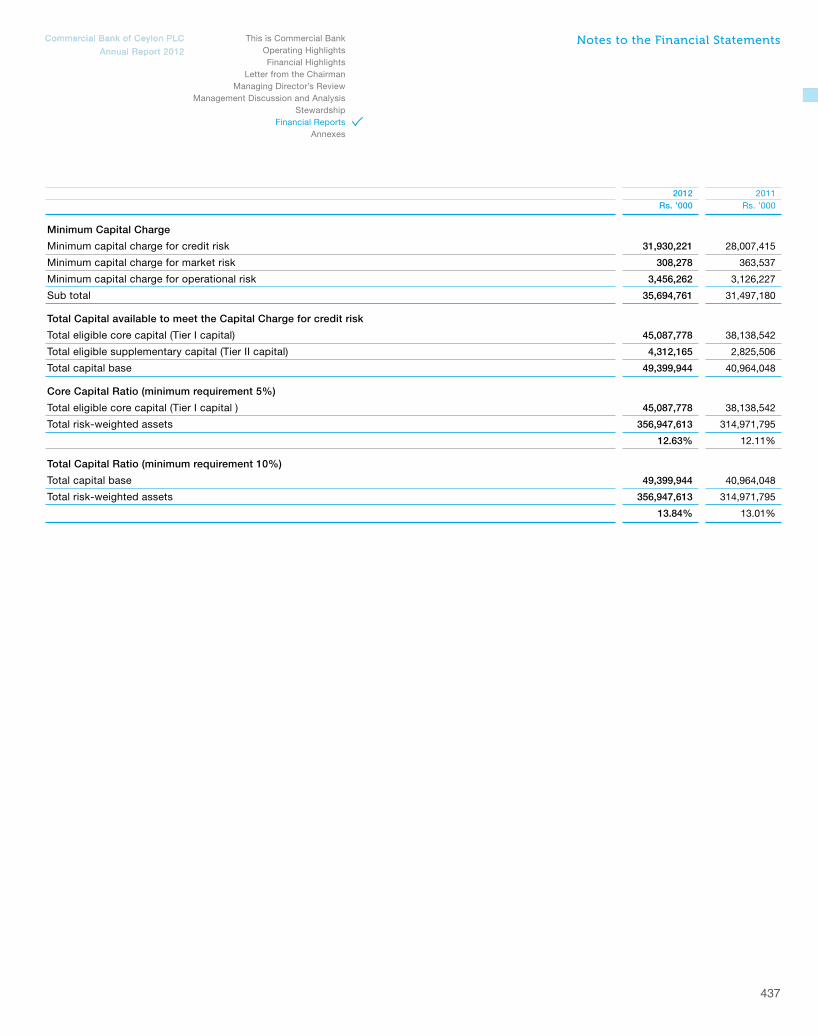
Commercial Bank of Ceylon PLCCommercial Bank of Ceylon PLC
Annual Report 2012Annual Report 2012
This is Commercial BankOperating HighlightsFinancial Highlights
Letter from the ChairmanManaging Director’s Review
Management Discussion and AnalysisStewardship
Financial ReportsAnnexes
437
2012 2011Rs. ’000 Rs. ’000
Minimum Capital Charge
Minimum capital charge for credit risk 31,930,221 28,007,415
Minimum capital charge for market risk 308,278 363,537
Minimum capital charge for operational risk 3,456,262 3,126,227
Sub total 35,694,761 31,497,180
Total Capital available to meet the Capital Charge for credit risk
Total eligible core capital (Tier I capital) 45,087,778 38,138,542
Total eligible supplementary capital (Tier II capital) 4,312,165 2,825,506
Total capital base 49,399,944 40,964,048
Core Capital Ratio (minimum requirement 5%)
Total eligible core capital (Tier I capital ) 45,087,778 38,138,542
Total risk-weighted assets 356,947,613 314,971,795
12.63% 12.11%
Total Capital Ratio (minimum requirement 10%)
Total capital base 49,399,944 40,964,048
Total risk-weighted assets 356,947,613 314,971,795
13.84% 13.01%
Notes to the Financial Statements

Commercial Bank of Ceylon PLCCommercial Bank of Ceylon PLC
Annual Report 2012Annual Report 2012
This is Commercial BankOperating HighlightsFinancial Highlights
Letter from the ChairmanManaging Director’s ReviewManagement Discussion and AnalysisStewardshipFinancial ReportsAnnexes
438
Other Disclosure Requirements Under the Prescribed Format Issued by the Central Bank of Sri Lanka for Preparation of Annual Financial Statements of Licensed Commercial Banks
Disclosure Requirements Description Page No.
1. Information about the Significance of Financial Instruments for Financial Position and Performance
1.1 Statement of Financial Position
1.1.1 Disclosures on categories of financial assets and financial liabilities.
Note 19 to the Financial Statements - Measurement of Financial Instruments.
Page 349
1.1.2 Other Disclosures
(i) Special disclosures about financial assets and financial liabilities designated to be measured at fair value through profit or loss, including disclosures about credit risk and market risk, changes in fair values attributable to these risks and the methods of measurement.
Significant Accounting Policies:
Note 3.3.3.1.2 - Financial assets designated at fair value through profit or lossNote 3.3.4.1 - Financial liabilities at fair value through profit or loss
Page 324
Page 326
(ii) Reclassifications of financial instruments from one category to another.
Significant Accounting Policies:Note 3.3.5 - Reclassification of Financial Instruments Page 327
(iii) Information about financial assets pledged as collateral and about financial or non-financial assets held as collateral.
Not disclosed.
(iv) Reconciliation of the allowance account for credit losses by class of financial assets.
Notes to the Financial Statements:Note 26 (2) - Movement in Allowance for Individual and Collective Impairment Page 365
(v) Information about compound financial instruments with multiple embedded derivatives.
The Bank does not have compound financial instruments with multiple embedded derivatives.
–
(vi) Breaches of terms of loan agreements. None –
1.2 Statement of Comprehensive Income
1.2.1 Disclosures on items of income, expense, gains and losses. Notes 07 - 14 to the Financial Statements: Pages 341 to 344
1.2.2 Other Disclosures
(i) Total interest income and total interest expense for those financial instruments that are not measured at fair value through profit and loss.
Notes to the Financial Statements: Note 7 - Interest income Page 341
(ii) Fee income and expense. Note 08 to the Financial Statements:Net fees and commission income Page 342
(iii) Amount of impairment losses by class of financial assets. Note 12 to the Financial Statements:Impairment for loans and others losses Page 343
(iv) Interest income on impaired financial assets. Notes to the Financial Statements:Note 7.3 - Interest income on impaired financial assets Page 341

Commercial Bank of Ceylon PLCCommercial Bank of Ceylon PLC
Annual Report 2012Annual Report 2012
This is Commercial BankOperating HighlightsFinancial Highlights
Letter from the ChairmanManaging Director’s Review
Management Discussion and AnalysisStewardship
Financial ReportsAnnexes
439
Disclosure Requirements Description Page No.
1.3 Other Disclosures
1.3.1 Accounting policies for financial instruments. Significant Accounting Policies: Note 3.3 - Financial instruments - initial recognition, classification and subsequent measurement. Page 323
1.3.2 Information on hedge accounting The Bank does not have hedging instruments. –
1.3.3 Information about the fair values of each class of financial asset and financial liability, along with:
(i) Comparable carrying amounts. Notes to the Financial Statements:Note 23 - Derivative financial InstrumentsNote 24 - Other financial assets held for tradingNote 27 - Financial investments - for saleNote 36 - Derivative financial instruments
Page 352Page 353Page 371Page 391
(ii) Description of how fair value was determined. Significant Accounting Policies:Note 3.3.9 - Determination of fair value Page 328
(iii) The level of inputs used in determining fair value. Significant Accounting Policies:Note 3.3.9 - Determination of fair value Page 328
(iv) (a) Reconciliations of movements between levels of fair value measurement hierarchy.
(b) Additional disclosures for financial instruments that fair value is determined using level 3 inputs.
There were No movements between levels of fair value hierarchy during the period under review.
Significant Accounting Policies:Note 3.3.2.1 - ‘Day 1’ profit or loss Page 323
(v) Information if fair value cannot be reliably measured. Note 27 to the Financial Statements: Financial Investments - Available-for-Sale Page 371
2. Information about the Nature and Extent of Risks Arising from Financial Instruments
2.1 Qualitative Disclosures
2.1.1 Risk exposures for each type of financial instrument. Loans and advances portfolio of the Bank generates the highest risk exposure whilst FX and equity assets bring comparatively low risk. The Bank does not have a commodity risk exposure at present.
–
2.1.2 Management’s objectives, policies, and processes for managing those risks.
Please refer the section relating to ‘Managing Risk at Commercial Bank’ for comprehensive disclosure of Management’s objectives, policies and processes.
Pages 229 to 268
2.1.3 Changes from the prior period. There was no major policy change during the period under review.

Commercial Bank of Ceylon PLCCommercial Bank of Ceylon PLC
Annual Report 2012Annual Report 2012
This is Commercial BankOperating HighlightsFinancial Highlights
Letter from the ChairmanManaging Director’s ReviewManagement Discussion and AnalysisStewardshipFinancial ReportsAnnexes
440
Disclosure Requirements Description Page No.
2.2 Quantitative Disclosures
2.2.1 Summary of quantitative data about exposure to each risk at the reporting date.
Please refer the computation on ‘Capital Adequacy’ given in the section on ‘Managing Risk at Commercial Bank’. Pages 229
to 268
2.2.2 Disclosures about credit risk, liquidity risk, market risk, operational risk, interest rate risk and how these risks are managed.
Please refer the section relating to ‘Managing Risk at Commercial Bank’.
Pages 229 to 268
(i) Credit Risk
(a) Maximum amount of exposure (before deducting the value of collateral), description of collateral, information about credit quality of financial assets that are neither past due nor impaired and information about credit quality of financial assets.
The gross credit risk exposure on performing advances as at December 31, 2012, broken down by the credit quality is as follows:
Risk Grade Description Value (Rs. Mn.)
A0 Cash & Gold 27,820.16
A1-A2 Very Good 10,077.55
A3-A5 Good 245,554.06
A6 Average 30,915.02
The above exposures are adequately collateralised by way of cash, gold, letters of credit/guarantees, real estate, receivables, inventories, other non-financial assets as comprehensively discussed in the section relating to ‘Managing Risk at Commercial Bank’.
Pages 229 to 268
(b) For financial assets that are past due or impaired, disclosures on age, factors considered in determining as impaired and the description of collateral on each class of financial asset.
The gross credit risk exposure on non-performing advances as at December 31, 2012, broken down by the credit quality is as follows:
Risk Grade Description Value (Rs. Mn.)
B6-B9 Non-performing 13,342.78
Factors considered in determining as impaired are discussed under Note 3.3.10 - Impairment of Financial Assets.
Page 328
(c) Information about collateral or other credit enhancements obtained or called.
Not disclosed. –
(d) For other disclosures, please refer Banking Act Direction No. 7 of 2011 on Integrated Risk Management Framework for Licensed Banks (Section H).
Please refer the section relating to ‘Managing Risk at Commercial Bank’.
Pages 229 to 268
(ii) Liquidity Risk
(a) A maturity analysis of financial liabilities. Note 50 to the Financial Statements - Maturity Analysis Page 403
(b) Description of approach to risk management. Please refer the section relating to ‘Managing Risk at Commercial Bank’.
Pages 229 to 268
(c) For other disclosures, please refer Banking Act Direction No. 7 of 2011 on Integrated Risk Management Framework for Licensed Banks (Section H).
Please refer the section relating to ‘Managing Risk at Commercial Bank’.
Pages 229 to 268

Commercial Bank of Ceylon PLCCommercial Bank of Ceylon PLC
Annual Report 2012Annual Report 2012
This is Commercial BankOperating HighlightsFinancial Highlights
Letter from the ChairmanManaging Director’s Review
Management Discussion and AnalysisStewardship
Financial ReportsAnnexes
441
Disclosure Requirements Description Page No.
(iii) Market Risk
(a) A sensitivity analysis of each type of market risk to which the entity is exposed.
Please refer the section relating to ‘Managing Risk at Commercial Bank’.
Pages 229 to 268
(b) Additional information, if the sensitivity analysis is not representative of the entity’s risk exposure.
None –
(c) For other disclosures, please refer Banking Act Direction No. 7 of 2011 on Integrated Risk Management Framework for Licensed Banks (Section H).
Please refer the section relating to ‘Managing Risk at Commercial Bank’.
Pages 229 to 268
(iv) Operational Risk
Please refer Banking Act Direction No. 7 of 2011 on Integrated Risk Management Framework for Licensed Banks (Section H).
Please refer the section relating to ‘Managing Risk at Commercial Bank’.
Pages 229 to 268
(v) Equity Risk in the Banking Book
(a) Qualitative Disclosures
Differentiation between holdings on which capital gains are expected and those taken under other objectives including for relationship and strategic reasons.
Significant Accounting Policies:Note 3.3.3.4 - Held to maturity financial investments Note 3.3.3.5 - Available for sale financial investments
Page 325Page 325
Discussion of important policies covering the valuation and accounting of equity holdings in the banking book.
(b) Quantitative Disclosures
Value disclosed in the statement of financial position of investments, as well as the fair value of those investments; for quoted securities, a comparison to publicly quoted share values where the share price is materially different from fair value.
The types and nature of investments.
The cumulative realised gains/(losses) arising from sales and liquidations in the reporting period.
Notes to the Financial Statements:Note 27 - Financial investments - Available-for-saleNote 28 - Investments in SubsidiariesNote 29 - Investments in AssociatesNote 10 - Net gain/loss from Financial Investments
Page 371Page 376Page 378Page 343
(vi) Interest Rate Risk in the Banking Book
(a) Qualitative Disclosures
Nature of interest rate risk in the banking book (IRRBB) and key assumptions.
Please refer the section relating to ‘Managing Risk at Commercial Bank’.
Pages 229 to 268
(b) Quantitative Disclosures
The increase/(decline) in earnings or economic value (or relevant measure used by management) for upward and downward rate shocks according to management’s method for measuring IRRBB, broken down by currency (as relevant).
Please refer the section relating to ‘Managing Risk at Commercial Bank’.
Pages 229 to 268
2.2.3 Information on concentrations of risk. Please refer the section relating to ‘Managing Risk at Commercial Bank’.
Pages 229 to 268

Commercial Bank of Ceylon PLCCommercial Bank of Ceylon PLC
Annual Report 2012Annual Report 2012
This is Commercial BankOperating HighlightsFinancial Highlights
Letter from the ChairmanManaging Director’s ReviewManagement Discussion and AnalysisStewardshipFinancial ReportsAnnexes
442
Disclosure Requirements Description Page No.
3. Other Disclosures
3.1 Capital
3.1.1 Capital Structure
(i) Qualitative Disclosures
Summary information on the terms and conditions of the main features of all capital instruments, especially in the case of innovative, complex or hybrid capital instruments.
‘Managing Risk at Commercial Bank’ section in the Annual Report.
Pages 229 to 268
(ii) Quantitative Disclosure
(a) The amount of Tier 1 capital, with separate disclosure of:
Paid-up share capital/common stock
Reserves
Non-controlling interests in the equity of subsidiaries
Innovative instruments
Other capital instruments
Deductions from Tier 1 capital
(b) The total amount of Tier 2 and Tier 3 capital
(c) Other deductions from capital
(d) Total eligible capital
Notes to the Financial Statements:Note 60 - Financial Risk Managemnent Page 432
3.1.2 Capital adequacy
(i) Qualitative Disclosures
A summary discussion of the Bank’s approach to assessing the adequacy of its capital to support current and future activities.
‘Managing Risk at Commercial Bank’ section in the Annual Report.
Pages 229 to 268
(ii) Quantitative Disclosures
(a) Capital requirements for credit risk, market risk and operational risk
Notes to the Financial Statements:Note 60 - Financial Risk Managemnent
Page 432
(b) Total and Tier 1 capital ratio