Embed Size (px)
Citation preview

RESEARCH ARTICLE Open Access
1-Pyrroline-5-carboxylate released byprostate Cancer cell inhibit T cellproliferation and function by targetingSHP1/cytochrome c oxidoreductase/ROSAxisYutao Yan2,3,4†, Lei Chang1*†, Hongzhe Tian5, Lu Wang2,3,4, Yawei Zhang1,6, Tao Yang7, Guohao Li1, Weifeng Hu1,Kavita Shah8, Gang Chen2,3,4* and Yonglian Guo1*
Abstract
Background: Tumor cell mediated immune-suppression remains a question of interest in tumor biology. In this study,we focused on the metabolites that are released by prostate cancer cells (PCC), which could potentially attenuate T cellimmunity.
Methods: Prostate cancer cells (PCC) media (PCM) was used to treat T cells, and its impact on T cell signaling wasevaluated. The molecular mechanism was further verified in vivo using mouse models. The clinical significance wasdetermined using IHC in human clinical specimens. Liquid chromatography mass spectroscopy (LC/MS-MS) wasused to identify the metabolites that are released by PCC, which trigger T cells inactivation.
Results: PCM inhibits T cells proliferation and impairs their ability to produce inflammatory cytokines. PCM decreasesATP production and increases ROS production in T cells by inhibiting complex III of the electron transport chain. Wefurther show that SHP1 as the key molecule that is upregulated in T cells in response to PCM, inhibition of whichreverses the phenotype induced by PCM. Using metabolomics analysis, we identified 1-pyrroline-5-carboxylate(P5C) as a vital molecule that is released by PCC. P5C is responsible for suppressing T cells signaling by increasing ROSand SHP1, and decreasing cytokines and ATP production. We confirmed these findings in vivo, which revealedchanged proline dehydrogenase (PRODH) expression in tumor tissues, which in turn influences tumor growthand T cell infiltration.
Conclusions: Our study uncovered a key immunosuppressive axis, which is triggered by PRODH upregulation inPCa tissues, P5C secretion in media and subsequent SHP1-mediated impairment of T cell signaling and infiltrationin PCa.
Keywords: 1-Pyrroline-5-carboxylate, T cell, Prostate cancer, SHP1, ROS
* Correspondence: [email protected]; [email protected];[email protected]†Yutao Yan and Lei Chang contributed equally to this work.1Department of Urology, Central Hospital of Wuhan, Tongji Medical College,Huazhong University of Science and Technology, Wuhan, China2Institute of Organ Transplantation, Tongji Hospital, Tongji Medical College,Huazhong University of Science and Technology, Wuhan, ChinaFull list of author information is available at the end of the article
© The Author(s). 2018 Open Access This article is distributed under the terms of the Creative Commons Attribution 4.0International License (http://creativecommons.org/licenses/by/4.0/), which permits unrestricted use, distribution, andreproduction in any medium, provided you give appropriate credit to the original author(s) and the source, provide a link tothe Creative Commons license, and indicate if changes were made. The Creative Commons Public Domain Dedication waiver(http://creativecommons.org/publicdomain/zero/1.0/) applies to the data made available in this article, unless otherwise stated.
Yan et al. Journal for ImmunoTherapy of Cancer (2018) 6:148 https://doi.org/10.1186/s40425-018-0466-z
on July 31, 2020 by guest. Protected by copyright.
http://jitc.bmj.com
/J Im
munother C
ancer: first published as 10.1186/s40425-018-0466-z on 13 Decem
ber 2018. Dow
nloaded from

BackgroundThe original paradigm that tumors are a mass of prolifer-ating cancer cells has now shifted to an in-depth under-standing of tumors as complex entities. In addition tocancer cells, tumors harbor a variety of other cell types,including vascular endothelial cells, cancer-associatedfibroblasts and various resident or migratory immune cells[1]. The dynamic interaction between cancer cells and im-mune cells including macrophages, mast cells, neutro-phils, T and B cells of the tumor microenvironmentcritically influences the behavior of tumors [2–4].The im-portance of T cells in antitumor immunity has been dem-onstrated in many types of cancer [5, 6]. However, tumorscan escape immune attack by various mechanisms of im-munosuppression [7, 8].A small number of genes, such asprogrammed cell death 1 ligand 1 (PD-L1), that enabletumors to evade the immune system have been the focusof intense clinical development efforts [9–11].Reactivatingthe antitumor responses of T cells by checkpoint blockadehas recently been demonstrated to have notable effects ontreating cancer, but its response rate needs to be furtherimproved [12, 13].The past decade has seen a revival of interest to better
understand cell metabolism and its association with hu-man tumor. Oncogenes promote, whereas tumor suppres-sor genes inhibit oncogenesis, however, both influencemetabolism [14]. The recent findings in glycolysis, gluta-minolysis, serine/glycine metabolism, amino acid metabol-ism, lipid and membrane lipid metabolism, and TCA cycleenzymes mutations in cancer cells have led to a renewedinterest in the field of cancer metabolism [15].T cells survival and activation also relies on repro-
gramming of key metabolic pathways and sufficientavailability of nutrients like glucose and amino acids[16]. Intratumoral T cells display signs of glucosedeprivation and diminished anti-tumor effector func-tions in glucose-poor tumor microenvironment[17].Similarly intracellular L-arginine concentrations dir-ectly impact the metabolic fitness and survival capacityof T cells [18]. Secretion of lactate by tumor cells re-duces the activation of T and NK cells, and their produc-tion of anti-tumor cytokines such as IFN-γ likelypromotes tumor immune evasion and growth [19].In this study, we focused on the link between the pros-
tate cancer cells (PCC) metabolites with T cell prolifera-tion and functions. We observed that PCC media (PCM)inhibits T cells proliferation and function by increasingthe levels of reactive oxygen species (ROS) and decreas-ing the production of ATP. To uncover the molecularmechanism, we conducted a metabolomics study usingliquid chromatography mass spectroscopy (LC/MS-MS)and determined the levels of metabolites in the condi-tioned media of PCC and normal cells. Our data showsthat the levels of1-Pyrroline-5-carboxylate (P5C) was
remarkably enhanced in PCM compared to normal cells.Proline dehydrogenase (PRODH) catalyzes the conversionof proline into P5C [20]. PRODH has been identified asone of a few genes that is rapidly and robustly induced byp53. PRODH plays a key role in apoptotic cell death, andautophagy in cancer cells [20]. PRODH is also identifiedas promising drug target against breast cancer-derivedmetastasis formation [21]. Importantly, by decreasing thelevels of P5C via PRODH knockdown, the proliferationand functions of T cells were recovered. We further un-covered SHP1 as a key regulator of T cell signaling usingRNA Seq. These data collectively suggest that decreasingthe levels of P5C or inhibiting SHP1 independently or incombination may be a potent way to reactivate T cells sig-naling for treating prostate cancer (PCa).
MethodsCell preparation and cultureHuman primary CD3+T cells were isolated from healthypeople blood using a CD3εMicroBead kit (Miltenyi BiotecInc. CA, USA), according to the manufacturer’s instruc-tions. The purity of the CD3+ T-cell preparation wasassessed by flow cytometry (FACS Calibur, Becton, Dickin-son and Company, Franklin Lakes, NJ, USA) using PE-anti-mouse CD3monoclonal antibody (mAb) (eBioscience, Inc.,San Diego, CA, USA).Jurkat cells (human T cell line), HK-2 (human renal
tubular epithelial cell line), LNCaP and PC-3 (humanprostate cancer cell lines), EL-4 (murine T cell line), andRM-1 (murine prostate cancer cell line), TCMK-1 (mur-ine renal tubular epithelial cell line) were cultured inRPMI1640 (GE Healthcare Life Sciences Hyclone La-boratories, Logan, UT, USA) supplemented with 10%fetal bovine serum (FBS; GE Healthcare Life SciencesHyclone Laboratores), 10 μg/ml penicillin and 10 μg/mlstreptomycin (Beijing Solarbio Science & TechnologyCo., Ltd. Beijng, China). RWPE-1 cells were cultured inserum free SFM media. The cell culture was maintainedin an incubator at 37 °C with 5% CO2.
PCM treatmentConditioned medium from cultures of PCC cells or non-tumorigenic human renal tubular epithelial and prostatecells was isolated after 48 h. It was centrifuged and thesupernatant was harvested.Primary T cells, Jurkat and EL-4 cells were pretreated
with prostate cancer medium (25% final volume in freshmedia). T cells were then stimulated with anti-humanCD3/CD28 beads in round-bottom 96-well plates.
Cell proliferation assayPrimary T-cell proliferation was determined by a carbo-xyfluorescein succinimidyl ester (CFSE) (Life Technolo-gies, Carlsbad, CA, USA) proliferation assay according
Yan et al. Journal for ImmunoTherapy of Cancer (2018) 6:148 Page 2 of 14
on July 31, 2020 by guest. Protected by copyright.
http://jitc.bmj.com
/J Im
munother C
ancer: first published as 10.1186/s40425-018-0466-z on 13 Decem
ber 2018. Dow
nloaded from

to the manufacturer’s instructions. In brief, CD3+T cellswere resuspended in CFSE (5 μM) buffer, incubated at 37 °C with 5% CO2 for 20min, and washed twice in completemedium. The stained T cells, at 2 × 10⁵ cells per well of a96-well round-bottom plate were then stimulated withanti-human CD3/CD28 beads (2.5 μl/1 × 105 cells) for theindicated times. The cells were then collected and de-tected with CFSE by flow cytometry (BD FACS Calibur).Proliferation of the Jurkat and EL-4 cell line was mea-
sured using cell counting kit-8 (CCK-8, Dojindo Labora-tories, Japan) according to the manufacturer’s protocol.
Human tissuesAll tissue specimens were obtained between June 2016and July 2017 from 40 patients who underwent surgeryfor therapeutic treatment at Central Hospital of Wuhanand were without androgen deprivation therapy. Therewere 25 PC and 15 BPH tissues in all of the specimens.The clinical information on the patients are shown insupplemental table. This study was approved by the eth-ics committee of Huazhong University of Science andTechnology. All patients provided informed consent.
Flow cytometryTo check the influence of PCM on T cells activation, theexpression of CD25 and CD69 was measured by flowcytometry. Samples were stained at 4 °C using CD69-phycoerythrin (PE) or CD25-fluorescein isothiocyanate(FITC) antibodies (BD Biosciences) in FACS buffer (1%BSA in PBS) in the dark for 30 min.The cells werewashed twice with cold PBS, resuspended in 200 μl PBSand analyzed using a flow cytometer (BD FACS Calibur).As negative controls, cells were treated with eitherisotype-matched control antibodies or with no primaryantibody. The expression of FOXP3 was detected byFOXP3 Trial Staining Kit, as per manufacturer’s instruc-tions (BD Biosciences).
Activities of mitochondrial complex I, II and IIIThe individual activities of mitochondrial complexes I/II/III were measured using the Complex I/II/III EnzymeActivity Kit (GENMED SCIENTIFICS Inc. DE, USA) ac-cording to the manufacturer’s instructions.Complex I activity was measured by following the oxi-
dation of reduced NADH to oxidized NAD+, which wasassessed by the absorbance at 340 nm. The results wereexpressed as nmol NADH/min after being normalized tothe protein content. Complex II activity was measuredby following the conversion of oxidized dichlorophenal-indophenol (DCPIP) to reduced DCPIPH2, which wasassessed by the absorbance at 600 nm. The results wereexpressed as nmol DCPIP/min after being normalized tothe protein content. Complex III activity was measuredby following the conversion of oxidized cytochrome C to
reduced cytochrome C, which was assessed by the ab-sorbance at 550 nm. The results were expressed asnmol CoQH2/min after being normalized to the pro-tein content.
TransfectionCells were transfected either with PRODH siRNA (100nM) or non-targeting pool (control siRNA) using lipofec-tamine 2000 according to the manufacturer’s instructions(Ribo Bio Co., Ltd). After 48 h, the media was collectedand then used for the indicated assays. PRODH (desig-nated as siPRODH, target sequences were GATGCAGCGGAAGTTCAAT), and StealthTM RNAi negative controls(designated as siNEG) were purchased from RiboBio.pcDNA 3.1 expression vectors encoding mouse PRODH
were transfected into RM-1 using lipofectamine 2000 re-agent according to the manufacturer’s instructions.The efficiency of the transfection was determined by
RT–PCR assay. After 48 h, the media was collected andthen used for the indicated assays.
RNA sequencingAfter treatment with PCM for 24 h, CD3+T cells werecollected to prepare for RNA sequencing.Total RNA was extracted and purified using an miR-
NeasyMini Kit (Qiagen) andchecked for an RNA integritynumber to inspect RNA integration by an Agilent Bioana-lyzer 2100 (Agilent Technologies) The samples were clus-tered and sequenced by an Illumina HiSeq 2500 fromMega Genomics Company Limited (Beijing, China).Prior to analyses, the clean reads were obtained from
raw reads which removed low-quality, adaptor-linked,and high content of unknown base (N > 1%) reads. Andthen, the clean reads were mapped on the referencehuman genome (ftp://ftp.ensembl.org/pub/release-88/fasta/homo_sapiens/dna/Homo_sapiens.GRCh38.dna.toplevel.fa.gz) by using TopHat2. Enrichment of GO (geneontology) terms was measured. Further, KEGG (KyotoEncyclopedia of Genes and Genomes) database was usedto annotate genes in the metabolic pathway.Gene expression levels were calculated using Cufflinks
version 0.8.0 based on the FPKM. Differential expressionwas determined using a significance level of FDR (FalseDiscovery Rate) < 0.01under a fold change > 2 or < 0.5.
Metabolomics analysisThe cultured media of LNCaP, PC-3 and HK-2 cells(1 × 10⁵ per well of a 6 well plate) were harvested after48 h of culture and stored at − 80 °C. Each group had10 duplications. Untargeted metabolite profiling wasperformed using liquid chromatography mass spectros-copy (LC/MS-MS) as previously described [22]. The rawLC-MS data for test set and validation set were loaded inPeak View (ABSciex). Each sample file (including reverse
Yan et al. Journal for ImmunoTherapy of Cancer (2018) 6:148 Page 3 of 14
on July 31, 2020 by guest. Protected by copyright.
http://jitc.bmj.com
/J Im
munother C
ancer: first published as 10.1186/s40425-018-0466-z on 13 Decem
ber 2018. Dow
nloaded from

phase and HILIC) was searched against the human me-tabolome database (HMDB) library loaded in Peak View(ABSciex) and the METLIN database. The robustnessof the identification was confirmed by matching themasses of the fragments from the MS-MS spectra foreach of the metabolites.The clean data was obtained by the molecular feature
extraction (MFE) tool in the Agilent Masshunter Qualita-tive Analysis B.04.00 software (Agilent Technologies,USA), then was analyzed by PCA (Principal ComponentAnalysis), PLS-DA (Partial least square-discriminantanalysis) and OPLS-DA (Orthogonal Partial least square-discriminant analysis) methods.Difference between experimental groups was evaluated
by unpaired t test (equal or unequal variance) with VIP(Variable Importance in the Projection) > 1 in PLS-DAmodel. The levels of statistical significant were set at95% level (P < 0.05).
Animal modelAll animal procedures were carried out with the ap-proval of the Animal Ethics Committee of the HuazhongUniversity of Science and Technology. 6-week old maleC57BL/6 mice and athymic nude mice were inoculatedsubcutaneously with 1 × 10⁶ RM-1 cells. After 7 days,100% of mice grew visible tumors. The two kinds ofmice were randomized and assigned to the control,PRODH and PRODH siRNA groups. The tumorvolumes were calculated every 3 days using the followingequation: tumor volume (mm3) = 1/2× (tumor length) ×(tumor width)2. The weight of the mice was also re-corded every 3 days. PRODH cDNA and PRODHsiRNA with in vivo-jetPEI Delivery Reagent (Polyplus,France) were intratumorally injected every 3 days for atotal of 18 days when the tumor diameter reached 5–7mm. At the end of experiment, tumors were excised,measured, and then each tumor was fixed in 4% ofparaformaldehyde for determining T cells infiltration.
Statistical analysisAll experiments were performed at least three separatetimes with data obtained from triplicate wells in each ex-periment. Data are expressed as means ± SD. The statisticaldifferences between two groups were analyzed by an un-paired Student’s t-test (two-tailed); multiple groups werecompared using one-way analysis of variance (GraphPadPrism5.0; GraphPad Software; GraphPad, Bethesda, MD). Avalue of P < 0.05 was considered significant.
ResultsPCC-conditioned media (PCM) inhibits T cell proliferationand impairs cytokine productionTo investigate the effect of the metabolites of PCC on Tcells, we treated primary human T cells and Jurkat cells
with PCM. CD3+ T cells were sorted up to > 96% purityfrom blood of healthy donors (Additional file 1: FigureS1A) and activated using human anti-CD3/CD28 beads.Meanwhile, the T cells were treated with the culturedmedia of PCC (LNCaP and PC-3) and two normal cells(RWPE1 and HK-2). CFSE labeling cell proliferationassay showed thatCD3+ T cells proliferation decreasedabout 50% in the PCM, whereas the culture media oftwo normal cells showed little inhibition (Fig. 1a). Thesame phenomenon was observed in Jurkat cells (Fig. 1b).Meanwhile, we treated Jurkat cells for 6 days to checkthe duration of PCM, and found that the effect of PCMon Jurkat cells weakened after 3 days (Additional file 1:Figure S1B). Furthermore, when we washed out thePCM and replaced it with fresh media after 24 h, theproliferation of Jurkat cells could be restored (Additionalfile 1: Figure S1C).To detect the changes in T cell function in this system,
we examined several representative cytokines, whichhave important roles in tumor and inflammation. To thisend, we investigated the levels of IL-2, TNF-α, IL-4,IL-6, IL-10, IL-17a, sCD40L in T cells exposed to eitherPCM or normal cells media. All of these secreted cyto-kines were inhibited in T cells exposed to PCM (Fig.1c-i). To further support the notion that PCC metabo-lites could affect T cells activation, we measured the ex-pression of CD69 and CD25. However, PCM did notaffect the expression of CD69 and CD25 on CD3+ Tcells, suggesting that T cell activation was not influencedin this system (Additional file 1: Figure S1D, E). We alsoexamined the expression of FOXP3 to check the statusof regulatory T cells. As expected, the regulatory T cellsalso were not affected by PCM (Additional file 1: FigureS1F). Collectively, these data showed that PCM could in-hibit the proliferation and function of T cells, but playsno role in T cell activation and regulatory T cells.We next examined the infiltration of T cells in human
PCa tissues and BPH tissues by IF. Our data show thatthe number of T cells in BPH tissue were significantlyhigher as compared to PCa tissues, suggesting that T cellinfiltration in vivo is inhibited as the cancer progresses(Fig. 1j, k). As our data showed, we postulated that PCatissues suppress T cells invasion by releasing metabolitesin the microenvironment.
PCC-conditioned medium increases ROS production butdecreases ATP production in T cellsROS and ATP play an importance role in the process ofcells growth and proliferation and death. In order to findout whether PCM have effect on ROS and ATP, weinspected their levels in T cells.We observed that PCM could substantially increase ei-
ther intracellular total ROS or mitochondrial ROS accu-mulation both in human CD3+ T cells and Jurkat cells
Yan et al. Journal for ImmunoTherapy of Cancer (2018) 6:148 Page 4 of 14
on July 31, 2020 by guest. Protected by copyright.
http://jitc.bmj.com
/J Im
munother C
ancer: first published as 10.1186/s40425-018-0466-z on 13 Decem
ber 2018. Dow
nloaded from

(Fig. 2a-d). Importantly, the culture media of two normalcells had no effect on ROS generation. Strikingly, theATP production in Jurkat cells also could be inhibitedby about 15% when cells treated by PCM (Fig. 2e). Ashigh ROS level is toxic to cells, increased ROS and de-creased ATP maybe key mechanisms that suppress Tcells functions.
PCC-conditioned medium inhibits complex III of theelectron transport chain (ETC)To discern the main sites of ROS generation in Jurkatcells exposed to PCM, we next analyzed the activities of
mitochondria respiratory complexes I, II and III and theexpression of catalytic gp91 phox (NOX2). Our datashowed that the activities of complexes I (CI) and II(CII) remain unchanged, but the activity of complexesIII (CIII) was markedly inhibited by about 70% (Fig.2f-h). On the other hand, we observed that PCM had noeffect on both mRNA and protein expression of NOX2(Fig. 2i-k). These data suggested that CIII may be themain contributor to ROS production.To confirm this hypothesis, we initially utilized ROS
scavenger N-acetyl cysteine (NAC). With the protec-tion of glutathione precursor NAC, which eliminates
Fig. 1 PCM Inhibit T Cell Proliferation, Function and T Cell Infiltration in PC and BPH Tissue. (a) CFSE-labeled human primary CD3+ T cells werepretreated with PCM or two normal cells media then stimulated for 3 days with anti-CD3/CD28 beads. T-cell proliferation was evaluated by FACSanalysis. The right side of bar graph is the representative result of CD3+ T cells proliferation. (b) Jurkat cells were treated with PCM or two normalcells media for 24 h. Shown is the percentage of cell proliferation by CCK-8 assay. One representative experiment out of three performed. (c-i)Human primary CD3+ T cells were pretreated with PCM or two normal cells media then stimulated for 3 days with anti-CD3/CD28 beads. Supernatantsfrom cell cultures were analyzed for seven cytokines levels using commercially available ELISA kits. One representative experiment out of three performed.(j) Columns showed the quantitative statistics of the infiltration of T cells. (k) The infiltration of T cells in PCa (n= 25) and BPH (n= 15) tissue detected by IF.The red light marked T cells. The representative pictures of IF. Error bars are SEM of biological replicates and ***p< 0.01
Yan et al. Journal for ImmunoTherapy of Cancer (2018) 6:148 Page 5 of 14
on July 31, 2020 by guest. Protected by copyright.
http://jitc.bmj.com
/J Im
munother C
ancer: first published as 10.1186/s40425-018-0466-z on 13 Decem
ber 2018. Dow
nloaded from
intracellular ROS, we observed that the effect of PCMcould be weakened. As the levels of ROS were reduced byNAC (Additional file 1: Figure S2A, G), the proliferationof human T cells and Jurkat cells inhibited by PCM werealso reversed (Additional file 1: Figure S2D, J). This datasuggested that ROS is highly toxic in this system.We next utilized NOX2 inhibitor apocynin (APO) to
find out the effect on the levels of ROS which was in-creased by PCM and T cells proliferation which wasdecreased by PCM. As expected, APO had no impact on
the levels of ROS (Additional file 1: Figure S2B, H).Accordingly, the inhibition of proliferation of human Tcells and Jurkat cells by PCM also remained unchanged(Additional file 1: Figure S2E, K).To gain insight into the role of mitochondrial respira-
tory complexes, we investigated the impact of electrontransport chain inhibitors on T cells exposed to PCM.Inhibitors of CI and CII, rotenone and thenoyltrifluoroa-cetone (TTFA), respectively, did not show any effect onROS levels or cell viability. However, the inhibitor of
Fig. 2 PCM Inhibit T cell ROS and ATP Production and Inhibit Activity of CIII. (a) Human primary CD3+ T cells were pretreated with PCM or twonormal cells media then stimulated for 3 days with or without anti-CD3/CD28 beads. Intracellular total ROS levels were measured by FACS afterincubation with the ROS-reactive fluorochorome DCFH. The geometric mean of DCF fluorescence intensity was used to determine the rate ofROS generation. The right side of bar graph is the representative result by flow cytometry. (b) Jurkat cells were treated with PCM or two normalcells media for 24 h. Shown is the levels of ROS by flow cytometry. The right side of bar graph is the representative result by flow cytometry. (c)Human primary CD3+ T cells were pretreated with PCM then stimulated for 3 days with or without anti-CD3/CD28 beads. Shown is the levels ofmitochondria ROS by flow cytometry. The right side of bar graph is the representative result by flow cytometry. (d) Jurkat cells were treated withPCM or two normal cells media for 24 h. Shown is the levels of mitochondria ROS by flow cytometry. The right side of bar graph is the representativeresult by flow cytometry. (e) Jurkat cells were treated with PCM or two normal cells media for 24 h. Shown is the ATP concentration by microplatereader. (f) Jurkat cells were treated with PCM or two normal cells media for 24 h. Shown is the relative activity of CI by microplate reader (g) Jurkat cellswere treated with PCM or two normal cells media for 24 h. Shown is the relative activity of CII by microplate reader. (h) Jurkat cells were treated withPCM or two normal cells media for 24 h. Shown is the relative activity of CIII by microplate reader. (i, j) The mRNA expression of NOX2 in CD3+ T cellsand Jurkat cells after treatment with PCM or two normal cells media by qPCR. (k) Western bolt showing the protein expression of NOX2 in CD3+ Tcells and Jurkat cells. An antibody to β-actin was used as a loading control. All experiments were repeated at least three times. Error bars are SEM ofbiological replicates and *p < 0.05, ***p < 0.01
Yan et al. Journal for ImmunoTherapy of Cancer (2018) 6:148 Page 6 of 14
on July 31, 2020 by guest. Protected by copyright.
http://jitc.bmj.com
/J Im
munother C
ancer: first published as 10.1186/s40425-018-0466-z on 13 Decem
ber 2018. Dow
nloaded from

CIII, antimycin A, enhanced the effect of PCM notablyon ROS levels (Additional file 1: Figure S2C, I) and Tcells proliferation (Additional file 1: Figure S2F, L). Col-lectively, these data confirmed that the inactivation ofCIII is crucial for increase in ROS production, which ishighly toxic to T cells. We also analyzed T cell functionin the presence of NAC and antimycin A by ELISA.Strikingly, NAC reverses the influence of PCM on T cellscytokines secretion which was further enhanced by anti-mycin A (Additional file 1: Figure S3).
RNA-Seq revealed PCM triggers SHP1 upregulation in T cellsTo elucidate the mechanism by which PCM inhibit Tcell survival, we first examined T cells total mRNA levelsby RNAseq. Our data showed that following treatmentwith PCM, the levels of 1564 genes changes, includingdownregulation of 709 genes and upregulation of 855genes (Additional file 1: Figure S4B). Then we analyzedthe expression of all the genes involved in the TCR sig-naling (Additional file 1: Figure S4C). We focused onSHP1, a negative regulator of TCR-mediated signaling in
T cells, which was upregulated in T cells exposed toPCM. We verified this phenomenon by qPCR and west-ern blotting. After treatment with PCM, we observedthat both mRNA (Fig. 3a-b) and protein (Fig. 3d-e) levelsof SHP1 were upregulated in human T cells and Jurkatcells which accorded with RNAseq result.
SHP1 levels are increased in T cells which are infiltratedin PCa clinical specimens compared to T cells in BPHclinical tissuesFurthermore, using laser capture microdissection, we ac-quired the T cells in human prostate tissues. Comparedwith BPH tissue, the mRNA levels of SHP1 in T cells inPCa tissue were significantly higher (Fig. 3c). Previousstudies have shown that endogenous SHP1 in Jurkatcells and primary T cells is cytoplasmic both before andafter TCR stimulation [23]. In order to identify theexpression of SHP1 in different subcellular locations, wefirst detected the levels of SHP1 in untreated controlcells, which showed cytoplasmic, mitochondrial andnuclear localization. However, PCM treatment remark-ably increased the levels of SHP1 in the cytoplasm and
Fig. 3 The Effect of PCM on Expression and Translocation of SHP1 in T cells. (a-b) The mRNA expression of SHP1 in CD3+ T cells and Jurkat cellsafter treatment with PCM by qPCR. (c) Obtained T cells from human prostate tissue by laser capture microdissection, and checked SHP1expression in T cells of BPH and PCa tissue by qPCR. (d-e) Western bolt showing the protein expression of SHP1 in CD3+ T cells andJurkat cells after treatment with PCM. An antibody to β-actin was used as a loading control. (f) Western bolt showing the cytoplasmprotein expression of SHP1 in Jurkat cells after treatment with PCM. An antibody to β-actin was used as a loading control. (g) Westernbolt showing the nuclear protein expression of SHP1 in Jurkat cells after treatment with PCM. An antibody to Lamin B1 was used as aloading control. (h) Western bolt showing the mitochondria protein expression of SHP1 in Jurkat cells after treatment with PCM. Anantibody to COX IV was used as a loading control. (i) The localization of SHP-1 in Jurkat cells after treatment with PCM by immunofluorescence. DAPI wasused for marking nuclear. (j) The localization of SHP-1 in T cells of PCa and BPH tissue by confocal microscopy. DAPI was used for marking nuclear, andCD3 for marking T cells Error bars are SEM of biological replicates and *p< 0.05
Yan et al. Journal for ImmunoTherapy of Cancer (2018) 6:148 Page 7 of 14
on July 31, 2020 by guest. Protected by copyright.
http://jitc.bmj.com
/J Im
munother C
ancer: first published as 10.1186/s40425-018-0466-z on 13 Decem
ber 2018. Dow
nloaded from
the mitochondria while SHP1levels in the nucleus in-creased to a smaller extent (Fig. 3f-h).Next, we analyzed the subcellular localization of SHP1 by
confocal microscopy, which revealed that intranuclearlocalization of SHP1 in Jurkat cells is decreased significantlyby PCM (Fig. 3i). We then verified this phenomenon in-human tissue specimens. Compared to BPH tissue, theSHP1 intranuclear localization in T cells of PCa tissues wasmuch lower (Fig. 3j). Together, these results indicate thatSHP1 is upregulated by PCM mainly in the cytoplasm andthe mitochondria.
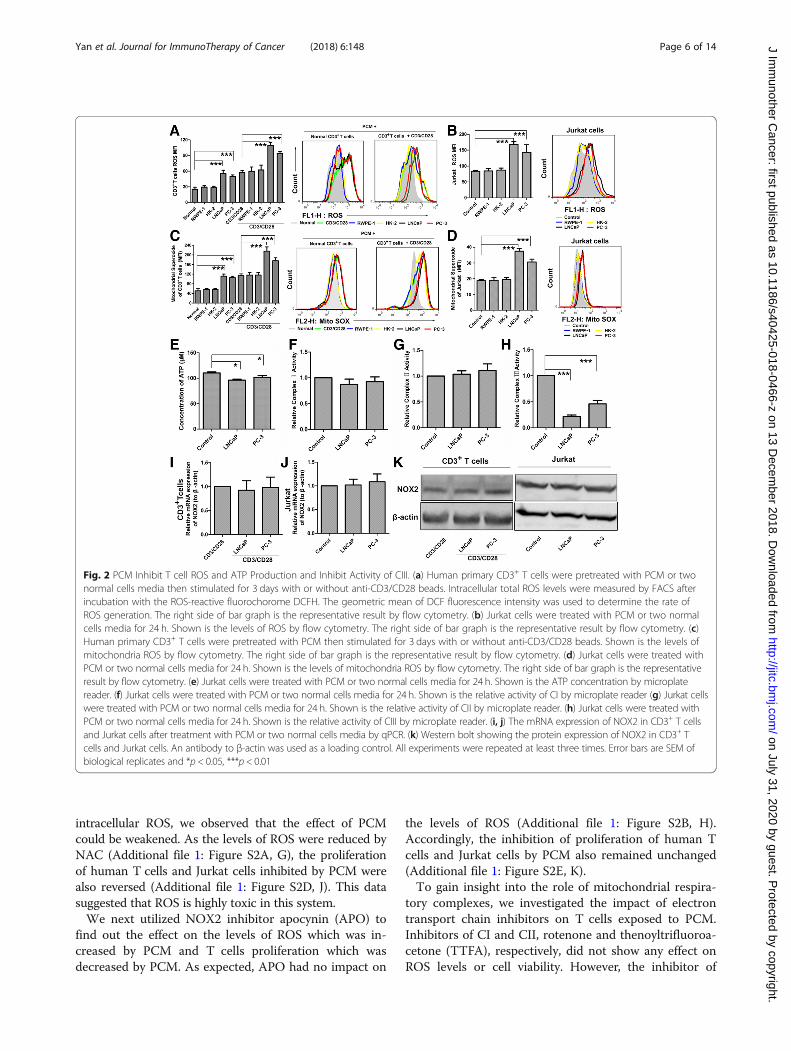
SHP1 inhibition restores complex III activity, whichweakens the effect of PCC metabolites on T cellsTo address whether SHP1 plays a key role in T cellinhibition, we utilized NSC87877, an inhibitor ofSHP1. Using a dose-dependent study, we initially de-termined the optimal concentration of NSC87877,
which does not inhibit T cells proliferation. Condi-tioned media which contained SHP1 inhibiter, restoredT cell proliferation to a large extent, and reduced ROSin human T cells and Jurkat cells compared to controlconditioned media (Fig. 4a-f ). Likewise, the functionof T cells secreted cytokines were also restored due toSHP1inhibition (Fig. 4g-j). In order to analyze the re-lationship of SHP1 and CIII, we also detected the ac-tivity of CIII in NSC87877-treated PCM. Through theinhibition of SHP1, the inactivation of CIII induced byPCM could be reversed (Fig. 4k). Collectively, thesedata demonstrate that SHP1 is vital for the process ofPCM-induced suppression of T cells.We next utilized wild type (WT) and SHP1 knockout
(SHP+/−) C57 mice, and isolated CD3+ T cells fromspleens. We treated T cells with the media of murine pros-tate cancer cells (RM-1). Importantly, the proliferation ofWT T cells was inhibited and the production of ROS wasincreased, but the media of RM-1 have little effect on
Fig. 4 SHP1 Inhibition Weaken the Effect of PCC Metabolites on T Cells. (a) Human primary CD3+ T cells were pretreated with PCM and the inhibitorof SHP1 NSC87877 (12.5 μM) then stimulated for 3 days with anti-CD3/CD28 beads. Shown is the percentage of cell proliferation by flow cytometry.The right side of bar graph is the representative result by flow cytometry. (b, c) Human primary CD3+ T cells were pretreated with PCM andthe inhibitor of SHP1 NSC87877 (12.5 μM) then stimulated for 3 days with anti-CD3/CD28 beads. Shown is the levels of total and mitochondriaROS by flow cytometry. The right side of bar graph is the representative result by flow cytometry. (d) Jurkat cells treated with PCM and theinhibitor of SHP1 NSC87877 for 24 h. Shown is the percentage of cell proliferation by CCK-8 assay. (e, f) Jurkat cells treated with PCM and theinhibitor of SHP1 NSC87877 for 24 h. Shown is the percentage of cell proliferation by CCK-8 assay. The right side of bar graph is the representativeresult by flow cytometry. (g-j) Human primary CD3+ T cells were pretreated with PCM and the inhibitor of SHP1 NSC87877 (12.5 μM) then stimulatedfor 3 days with anti-CD3/CD28 beads.. Supernatants from cell cultures were analyzed for cytokines levels using commercially available ELISAkits, including IL-2, TNF-α, IL-6, IL-17A. (k) Jurkat cells treated with PCM and the inhibitor of SHP1 NSC87877 for 24 h. Shown is the relativeactivity of CIII by microplate reader. All experiments were repeated at least three times. Error bars are SEM of biological replicates and **p< 0.01; ***p<0.001
Yan et al. Journal for ImmunoTherapy of Cancer (2018) 6:148 Page 8 of 14
on July 31, 2020 by guest. Protected by copyright.
http://jitc.bmj.com
/J Im
munother C
ancer: first published as 10.1186/s40425-018-0466-z on 13 Decem
ber 2018. Dow
nloaded from

SHP+/−T cells (Additional file 1: Figure S5), thereby under-scoring a central role of SHP1 in T cell suppression.
LC-MS/MS revealed high levels of 1-Pyrroline-5-carboxylate (P5C) in PCC conditioned media compared tonormal cellsTo elucidate the mechanism by which PCC metabolitessuppress T cell survival and upregulates SHP1, we firstexamined the diversity of metabolites between PCC andnormal cell through LC-MS/MS. Because of the mediaof RWPE1 is different with PCC cells, which may resultin false positives, we only analyzed the metabolites inLNCaP, PC-3 and HK-2 cells. As shown in Fig. 5a, wefirst compared the differences between LNCaP andHK-2, and identified 21 metabolites, which exhibited dif-ferent levels. Especially, the content of P5C (red marked)in LNCaP culture media exceeded the content in HK-2.Similarly, there were 26 variant molecules between PC-3and HK-2, and the most remarkable molecule was againP5C (Fig. 5b). Therefore, we speculated that P5C may bethe most important metabolite, which causes T cells in-hibition and dysfunction.
PRODH is overexpressed in PCa clinical specimens andcorrelates with disease progressionProline dehydrogenase (PRODH) converts proline intoP5C [20]. In the subsequent step, P5C dehydrogenase(P5CDH) converts P5C into glutamate. We thus investi-gated the expression of PRODH indifferent cell lines,and found that both the mRNA and protein levels ofPRODH were significantly higher in LNCaP and PC-3compared to RWPE1 and HK-2 cells (Fig. 5c, d).In order to further validate our inferences, we also
examined the expression of PRODH in human prostatecancer (PCa) and benign prostatic hyperplasia (BPH) tis-sues. 25 tumor tissues samples and corresponding 15 BPHtissues samples were analyzed by IHC. Compared withcorresponding non-neoplastic tissue, the expression ofPRODH was up-regulated in all of the tumor tissues (Fig.5f). Then we compared the expression of PRODH indifferent stages of PCa. We found that the PRODH ex-pression were significantly higher in the advanced tumors(Fig. 5e). But there was no statistical significance betweenT4 and T3, even when the expression in T4 was higher.Collectively, these data provided us a hypothesis that P5C,
Fig. 5 Difference in Metabolites and PRODH Expression Between PCC and Normal Cell. (a) All identified and analyzed different metabolites betweenLNCaP and HK-2 cell. The content of P5C (red marked) in LNCaP cultured media obviously exceeded the content in HK-2. (b) All identified andanalyzed different metabolites between PC3 and HK-2 cell. The content of P5C (red marked) in PC3 cultured media obviously exceeded the content inHK-2. (c-d) The mRNA and protein expression of PRODH in four cell lines. (e) The expression of PRODH in PCa and BPH tissue. Columns are expressedas mean ± SD. ** P < 0.05; ***P < 0.01. (f) The expression of PRODH in PCa and BPH tissues by immunohistochemical
Yan et al. Journal for ImmunoTherapy of Cancer (2018) 6:148 Page 9 of 14
on July 31, 2020 by guest. Protected by copyright.
http://jitc.bmj.com
/J Im
munother C
ancer: first published as 10.1186/s40425-018-0466-z on 13 Decem
ber 2018. Dow
nloaded from

as a metabolite of PCC, may be a key hazardous substancefor T cells.
PRODH knockdown of PCC weakens the effect on T cellsTo elucidate the effect of P5C on T cells, we knockeddown PRODH using siRNA to decrease the content ofP5C in PCM. With the transfection of PRODH siRNA,the PRODH expression in LNCaP cells was down-regulated significantly (Additional file 1: Figure S7A).We then examined the proliferation of LNCaP byCCK-8 assay, and found that cell growth was notaffected by PRODH knockdown, which excluded the de-crease of P5C in PCM caused by cell number (Additionalfile 1: Figure S7B). Moreover, we also checked the produc-tion of P5C in PRODH knockdown cell lines, and wefound that PRODH knockdown decreased the productionof P5C (Additional file 1: Figure S7C). Subsequently, weused the PCM after PRODH knockdown to treat T cells,and discovered that the effect of PCM on T cells could beweakened. With PRODH knockdown, the influence onthe inhibition of cell growth and the production of ROS inboth human CD3+T cells and Jurkat cells were weakerthan the PCM with non-targeting siRNA (Fig. 6a-f). Simi-larly, the function of T cells in secreting cytokines werealso recovered by PRODH knockdown in PCC (Fig. 6g-i).Similarly, the effect on the inhibition of ATP generation(Fig. 6j) and CIII activity (Fig. 6k) showed the same trend.We also evaluated SHP1expression and translocation in Tcells treated with PRODH siRNA. We found that the ex-pression of SHP1 in T cells treated with PRODH knock-down was much lower. Further, PRODH knockdowninhibited the translocation of SHP1 to the mitochondriaand the cytoplasm (Fig. 6m-p). Next, we also verified thatSHP1 intranuclear localization was enhanced uponPRODH knockdown, compared to non-targeting siRNAPCM (Fig. 6q). Collectively, these data verified the hypoth-esis that P5C elimination could weaken the effect of PCMon T cells.In order to show P5C is sufficient to cause the afore-
mentioned phenotype, we directly added P5C into themedia of CD3+ T cells. Because the solvent of P5C shouldbe HCL, we used HCL as the control. We found that P5Ccould inhibit the proliferation by about 25%, and alsocould increase the generation of ROS (Additional file 1:Figure S7D, E).
The change of PRODH expression effect the growth oftumor and T cells infiltration on animal modelBecause the defectiveness of T cells in nude mice, wecould not use human prostate cancer cells to constructxenograft model to verify our findings in vivo. So wechose murine prostate cancer cells RM-1 to constructanimal model. Primarily, we treated murine T cells EL-4with RM-1 cultured media, and we observed the same
phenomenon that the proliferation of EL-4 was inhibitedby about 50% and the production of ROS increased bytwo times (Fig. 7a, b). We also upregulated and down-regulated PRODH in RM-1 cells, and found that thechange of PRODH expression did not affect cancer cellsgrowth (Fig. 7d). In the meantime, we detected that thecontent of P5C in RM-1 was higher than the murinenormal cells (TCMK-1). With the changes of PRODHexpression in RM-1, the content of P5C in RM-1 mediaalso altered (Additional file 1: Figure S8A).Strikingly, the changes in PRODH expression influ-
enced tumor growth in animal model (Fig. 7g). Theupregulation of PRODH increased tumor growth, andPRODH knockdown reversed it. Furthermore, thechanges in PRODH expression also impacted CD3+ Tcells infiltration in tumors (Fig. 7h, i). The upregula-tion of PRODH decreased T cells infiltration, andPRODH knockdown accelerated T cells infiltration.Not only in CD3+ T cells, we also observed the samephenomenon in CD4+ and CD8+ T cells (Additionalfile 1: Figure S8 B-E).We also constructed xenograft model in nude mice,
where the change in PRODH expression in RM-1 haveno effect on tumor growth (Additional file 1: FigureS8 F-H), suggesting that the effect is mediated throughT cells.
DiscussionIt is well accepted that tumor microenvironment impairimmune cell functions both directly and indirectly [24].In order to directly suppress immunity through regula-tory ligands, tumor cells create a microenvironment thatis metabolically hostile to effector lymphocytes [25]. Tu-mors deplete nutrients and accumulate waste products,such as lactate or kynurenine that directly inhibit T cells[17, 19]. Nevertheless, how the metabolites of cancercells released in the extracellular milieu affect T cells isstill incompletely understood.Our study shows that the metabolites of PCC inhibits
the proliferation and function of T cells by increasedROS accumulation and decreased ATP generation. ROSplay significant role as important innate effector bycontrolling infection and tumorigenesis as well as bymodulating T-cell reactivity and autoimmunity [26]. Thecurrent consensus is that low levels of ROS are benefi-cial, facilitating adaptation to stress via signaling,whereas high levels of ROS are deleterious because theytrigger oxidative stress [27]. Thus, we hypothesized thatROS may be the culprit that triggers the dysfunction ofT cells when exposed to metabolites of PCC. ROS canbe generated by both enzymatic and nonenzymatic sys-tems, including mitochondria and NADPH oxidases(NOX) complexes, in the intracellular as well as in theextracellular space [28, 29]. The NOX family of enzymes
Yan et al. Journal for ImmunoTherapy of Cancer (2018) 6:148 Page 10 of 14
on July 31, 2020 by guest. Protected by copyright.
http://jitc.bmj.com
/J Im
munother C
ancer: first published as 10.1186/s40425-018-0466-z on 13 Decem
ber 2018. Dow
nloaded from

consists of seven members (NOX 1–5 and two dual oxi-dases, DUOX 1 and 2). NOX2 is an important source ofROS in T cells as NOX2-deficient T cells display stronglyreduced ROS production [30]. In mitochondria, the mainsites of ROS generation are respiratory complexes I (akaNADH: ubiquinone oxidoreductase, CI), II (aka succinate-coenzyme Q reductase, CII) and III (aka ubiquinol: cyto-chromec oxidoreductase, CIII) [31]. Our findings showedthat NOX2, CI and CII have no role in ROS generation,while CIII inactivity increases ROS production. BlockingCIII could generate conditions for reverse electron trans-fer (RET) which is associated with the generation of highlevels of ROS [27]. Therefore, CIII is the main source ofROS production in T cells in PCC microenvironment.In order to elucidate the mechanism by which PCM
inhibits T cell survival, we detected human T cells total
mRNA levels by RNAseq. A striking finding is that aftertreatment of the metabolites of PCC the levels of 1564genes changed, out of which 709 genes were down-regulated and 855 genes were up-regulated. Some keygenes involved in TCR signaling were also altered, suchas PD-1, CTLA-4, SHP1, LCK and ZAP70. As the nega-tive regulator of TCR-mediated signaling in T cells, theexpression of PD-1 and SHP1 was upregulated, butCTLA-4 showed opposite result. SHP1 is a negativeregulator, acting, at least in part, directly or indirectlythrough the inactivation of src-family kinases [32]. c-Srcis also present in the mitochondria and its inhibitiondirectly inhibits mitochondrial electron transport andpromotes ROS production with pathological conse-quences [33]. Furthermore, in addition to inactivatingSrc, it is possible that SHP1 might also dephosphorylate
Fig. 6 PRODH Knockdown of PCC Weaken the Effect on T Cells. (a) Human primary CD3+ T cells were pretreated with PCM or PRODH knockdown-PCM then stimulated for 3 days with anti-CD3/CD28 beads. Shown is the percentage of cell proliferation by flow cytometry. (b) Human primary CD3+
T cells were pretreated with PCM or PRODH knockdown-PCM then stimulated for 3 days with anti-CD3/CD28 beads.. Shown is the levels of ROS byflow cytometry. (c) Human primary CD3+ T cells were pretreated with PCM or PRODH knockdown-PCM then stimulated for 3 days with anti-CD3/CD28beads. Shown is the levels of mitochondria ROS by flow cytometry. (d) Jurkat cells treated with PCM or PRODH knockdown-PCM for 24 h. Shown is thepercentage of cell proliferation by CCK-8 assay. (e-f) Jurkat cells treated with PCM or PRODH knockdown-PCM for 24 h. Shown is the levels of total andmitochondria ROS by flow cytometry.(g-i) Human primary CD3+ T cells were pretreated with PCM or PRODH knockdown-PCM then stimulated for 3days with anti-CD3/CD28 beads. Supernatants from cell cultures were analyzed for cytokines levels using commercially available ELISA kits, includingIL-2, TNF-α, IL-17A. (j-k) Jurkat cells treated with PCM or PRODH knockdown-PCM for 24 h. Shown is the ATP concentration and activity of CIII (l) ThemRNA expression of SHP1 in Jurkat cells by qPCR after treatment with PCM or PRODH knockdown-PCM. (m) Western bolt showing the proteinexpression of SHP1 in Jurkat cells after treatment with PCM or PRODH knockdown-PCM. (n-p) Western bolt showing the cytoplasm, mitochondria andnuclear protein expression of SHP1 in Jurkat cells after treatment with PCM or PRODH knockdown-PCM. (q) The localization of SHP-1 in Jurkat cellsafter treatment with PCM or PRODH knockdown-PCM by immunofluorescence. DAPI was used for marking nuclear. All experiments were repeated atleast three times. Error bars are SEM of biological replicates and *p < 0.05; **p < 0.01; ***p < 0.001
Yan et al. Journal for ImmunoTherapy of Cancer (2018) 6:148 Page 11 of 14
on July 31, 2020 by guest. Protected by copyright.
http://jitc.bmj.com
/J Im
munother C
ancer: first published as 10.1186/s40425-018-0466-z on 13 Decem
ber 2018. Dow
nloaded from

respiratory chain phosphotyrosines after transfer to themitochondrial innermembrane [34]. Thus, we hypothe-sized that SHP1 may be responsible for the high levelsof ROS. Interestingly, we observed that the mRNA andprotein levels of SHP1 in T cells are up-regulated afterthe treatment of the metabolites of PCC. Meanwhile, thenuclear localization of SHP1 in T cells is decreased byPCM, but it is increased in the mitochondria and cyto-plasm. In this study, to determine whether SHP1 is re-quired for CIII inhibition and ROS generation, whichare induced by the metabolites of PCC, we used SHP1inhibitor NSC87877. SHP1 inhibition reverses the effectof PCM. Therefore, our finding supports the hypothesisthat SHP1 plays a key role in the dysfunction of T cellswhen they are exposed to metabolites of PCC.Using mass spectrometry, we further analyzed the
differences in the metabolites between PCC and nor-mal cells. Because of the media of RWPE1 cell line isdifferent compared to PCC, which may result in false
positives, we chose PC-3, LNCaP and HK-2 cells.Interestingly, the levels of P5C in the metabolites ofPC-3 and LNCaP was remarkably high compared toHK-2 cells. P5C, an N-substituted imino acid, is anintermediate not only in proline biosynthesis but alsoin its catabolism [35]. PRODH catalyzes the conver-sion of proline to P5C, which is then converted toglutamate by pyrroline-5-carboxylate dehydrogenase(P5CDH) in mitochondria. It was reported that accu-mulation of P5C is responsible for mitochondrial ROSproduction and hence cell death in yeast [36]. Hence,we assumed the P5C may be the key hazardoussubstance for T cells. Thus, we decreased the contentof P5C by down-regulating the expression levels ofPRODH. PRODH, as a mitochondrial inner membraneenzyme is involved in the first step of proline catabol-ism and has been identified as double-edged sword,which functions either as tumor suppressor to initiateROS-mediated apoptosis, or as tumor survival factor
Fig. 7 The Change of PRODH Expression Affect the Growth of Tumor and T cells Infiltration in vivo. (a) EL-4 cells were treated with RM-1 culturedmedia for 24 h. Shown is the percentage of cell proliferation by CCK-8 assay. One representative experiment out of three performed. (b) EL-4 cellswere treated with RM-1 cultured media for 24 h. Shown is the levels of ROS by flow cytometry. (c) The expression of PRODH in RM-1 after transfectionby qPCR. (d) The cell number of RM-1 after transfection by CCK-8 assay. (e) Mean of tumor volume measured at the indicated number of days aftermice were treated. (f) Mean of body weight of mice measured at the indicated number of days after mice were treated. (g) The picture of tumors afterharvesting. (h) The infiltration of CD3+ T cells in tumor tissue detected by IF. The red light marked T cells. (i) Columns showed the quantitative statisticsof the infiltration of T cells. Error bars are SEM of biological replicates and *p < 0.05; **p < 0.01; ***p < 0.001
Yan et al. Journal for ImmunoTherapy of Cancer (2018) 6:148 Page 12 of 14
on July 31, 2020 by guest. Protected by copyright.
http://jitc.bmj.com
/J Im
munother C
ancer: first published as 10.1186/s40425-018-0466-z on 13 Decem
ber 2018. Dow
nloaded from
through ATP production or ROS-induced autophagy de-pending on the tumor microenvironment [20, 37–39]. Itwas reported that targeting PRODH activity could havethe potential to be effective against cancer cells andmicrometastases [21]. PRODH are identified as a directtranscriptional targets of p53 [40], which is a tumor sup-pressor and express low activity in cancer. We found thatthe expression of PRODH was increased in PCa tissuescompared to human BPH tissues. Similar results were ob-tained in normal and PC cell lines. Thus, we speculatethat PRODH may also be regulated by other factors,which will be explored in future.In our study, PRODH knockdown did not inhibit the
proliferation of PCC, but it reversed the harmful effectof P5C on T cells, including proliferation, function andROS production. Meanwhile, the expression and trans-location of SHP1 in T cells was also restored. We alsoverified our findings in animal model, where PRODHover-expression enhanced tumor growth and decreasedT cells infiltration in tumors, and PRODH knockdownshowed opposite phenomenon.
ConclusionIn conclusion, P5C released into tumor environment byPCC inhibits the proliferation and function of T cells, byup-regulating SHP1. SHP1 inhibits CIII and promotes thegeneration of ROS. The harmful effect of P5C on T cellsurvival and anti-tumor functionality may be exploitedtherapeutically to improve adaptive T cell therapies. Add-itionally, our study on the interplay between tumor me-tabolism and T cells of the tumor microenvironmentprovides a new perspective for immunosuppression and anew standpoint for tumor immunotherapy.
Additional file
Additional file 1: Figure S1. The Effect of PCM on T Cells and Jurkat cells,Related to Fig. 1. Figure S2. ROS Scavenger and Inhibitor of CIII CouldWeaken the Effect of PCM on T cells. Figure S3. ROS Scavenger andInhibitor of CIII Could Weaken the Effect of PCM on T cells. Figure S4.The Media of RM-1 Have No Effect on SHP1 Knockdown T Cells. FigureS5. Quality Control of the RNAseq, Rlated to Fig. 3. Figure S6. QualityControl of the Metabonomics, Rlated to Fig. 5. Figure S7. The Efficiencyof PRODH Knockdown and the Effect to Cell Number, and the Effect ofAdditional P5C on Human CD3+ T Cells, Related to Fig. 6. Figure S8.The Change of PRODH Expression Affect CD4+ and CD8+ T cellsInfiltration in vivo Which Have no Influence on Nude Mice Xenograft.Table S1. The clinical information on the patients. (DOCX 3226 kb)
AcknowledgmentsThe authors thank Prof. Li Zeng (Department of Organ Transplantation,Changhai Hospital, Second Military Medical University) for providing SHP1knockout mice.
FundingThis work was supported by the National Natural Science Foundation of China(81771719, 81270830, 81770744) and Foundation of Health and Family PlanningCommission of Wuhan Municipality (WX18B14).
Availability of data and materialsAll data generated and analyzed during this study are included within thispublished article and its supplementary information files.
Authors’ contributionsL.C. conceived the project, designed and performed experiments, analyzed thedata, and wrote the manuscript. Y.Y. designed and performed experiments andanalyzed the data. H.T. and L.W. helped implement immune profilingexperiments. Y.Z., T.Y., G.L. and W.H. assisted with gene expression, tissuestudies. K.S. and G.C. wrote the manuscript. Y.G. and G.C. designed andoversaw the study. All authors read and approved the final manuscript.
Ethics approval and consent to participateHuman tissue study was approved by the ethics committee of HuazhongUniversity of Science and Technology. All patients provided informed consent.All animal procedures were carried out with the approval of the Animal EthicsCommittee of the Huazhong University of Science and Technology.
Consent for publicationNot applicable.
Competing interestsThe authors declare no competing interests.
Publisher’s NoteSpringer Nature remains neutral with regard to jurisdictional claims in publishedmaps and institutional affiliations.
Author details1Department of Urology, Central Hospital of Wuhan, Tongji Medical College,Huazhong University of Science and Technology, Wuhan, China. 2Institute ofOrgan Transplantation, Tongji Hospital, Tongji Medical College, HuazhongUniversity of Science and Technology, Wuhan, China. 3Key Laboratory ofOrgan Transplantation, Ministry of Health, Wuhan, China. 4Key Laboratory ofOrgan Transplantation, Ministry of Education, Wuhan, China. 5Department ofOrgan Transplantation, Changhai Hospital, Second Military Medical University,Shanghai, China. 6Department of Urology, Wuhan Children’s Hospital (WuhanMaternal and Child Healthcare Hospital), Tongji Medical College, HuazhongUniversity of Science and Technology, Wuhan, China. 7Department ofUrology, Jingzhou Central Hospital, the Second Clinical Medical College,Yangtze University, Jingzhou, China. 8Department of Chemistry and PurdueUniversity Center for Cancer Research, Purdue University, West Lafayette, IN,USA.
Received: 20 July 2018 Accepted: 28 November 2018
References1. Hanahan D, Coussens LM. Accessories to the crime: functions of cells
recruited to the tumor microenvironment. Cancer Cell. 2012;21(3):309–22.2. Galon J, Costes A, Sanchez-Cabo F, Kirilovsky A, Mlecnik B, Lagorce-Pages C,
Tosolini M, Camus M, Berger A, Wind P, et al. Type, density, and location ofimmune cells within human colorectal tumors predict clinical outcome.Science. 2006;313(5795):1960–4.
3. Johansson M, Denardo DG, Coussens LM. Polarized immune responsesdifferentially regulate cancer development. Immunol Rev. 2008;222:145–54.
4. Murdoch C, Muthana M, Coffelt SB, Lewis CE. The role of myeloid cells inthe promotion of tumour angiogenesis. Nat Rev Cancer. 2008;8(8):618–31.
5. Tumeh PC, Harview CL, Yearley JH, Shintaku IP, Taylor EJ, Robert L,Chmielowski B, Spasic M, Henry G, Ciobanu V, et al. PD-1 blockade inducesresponses by inhibiting adaptive immune resistance. Nature. 2014;515(7528):568–71.
6. Fridman WH, Pages F, Sautes-Fridman C, Galon J. The immune contexturein human tumours: impact on clinical outcome. Nat Rev Cancer. 2012;12(4):298–306.
7. Mellman I, Coukos G, Dranoff G. Cancer immunotherapy comes of age.Nature. 2011;480(7378):480–9.
8. Joyce JA, Fearon DT. T cell exclusion, immune privilege, and the tumormicroenvironment. Science. 2015;348(6230):74–80.
9. Tseng D, Volkmer JP, Willingham SB, Contreras-Trujillo H, Fathman JW,Fernhoff NB, Seita J, Inlay MA, Weiskopf K, Miyanishi M, et al. Anti-CD47
Yan et al. Journal for ImmunoTherapy of Cancer (2018) 6:148 Page 13 of 14
on July 31, 2020 by guest. Protected by copyright.
http://jitc.bmj.com
/J Im
munother C
ancer: first published as 10.1186/s40425-018-0466-z on 13 Decem
ber 2018. Dow
nloaded from

antibody-mediated phagocytosis of cancer by macrophages primes aneffective antitumor T-cell response. Proc Natl Acad Sci U S A. 2013;110(27):11103–8.
10. Sica GL, Choi IH, Zhu G, Tamada K, Wang SD, Tamura H, Chapoval AI, FliesDB, Bajorath J, Chen L. B7-H4, a molecule of the B7 family, negativelyregulates T cell immunity. Immunity. 2003;18(6):849–61.
11. Holmgaard RB, Zamarin D, Munn DH, Wolchok JD, Allison JP. Indoleamine2,3-dioxygenase is a critical resistance mechanism in antitumor T cellimmunotherapy targeting CTLA-4. J Exp Med. 2013;210(7):1389–402.
12. Yao S, Zhu Y, Chen L. Advances in targeting cell surface signallingmolecules for immune modulation. Nat Rev Drug Discov. 2013;12(2):130–46.
13. Sharma P, Allison JP. The future of immune checkpoint therapy. Science.2015;348(6230):56–61.
14. Dang CV. Links between metabolism and cancer. Genes Dev. 2012;26(9):877–90.
15. Basetti M. Special Issue: Cancer Metabolism. Metabolites. 2017;7(3):E41.16. Buck MD, O'Sullivan D, Pearce EL. T cell metabolism drives immunity. J Exp
Med. 2015;212(9):1345–60.17. Ho PC, Bihuniak JD, Macintyre AN, Staron M, Liu X, Amezquita R, Tsui YC,
Cui G, Micevic G, Perales JC, et al. Phosphoenolpyruvate is a metaboliccheckpoint of anti-tumor T cell responses. Cell. 2015;162(6):1217–28.
18. Geiger R, Rieckmann JC, Wolf T, Basso C, Feng Y, Fuhrer T, Kogadeeva M,Picotti P, Meissner F, Mann M, et al. L-arginine modulates T cell metabolismand enhances survival and anti-tumor activity. Cell. 2016;167(3):829–42 e813.
19. Brand A, Singer K, Koehl GE, Kolitzus M, Schoenhammer G, Thiel A, Matos C,Bruss C, Klobuch S, Peter K, et al. LDHA-associated lactic acid productionblunts tumor Immunosurveillance by T and NK cells. Cell Metab. 2016;24(5):657–71.
20. Liu W, Glunde K, Bhujwalla ZM, Raman V, Sharma A, Phang JM. Prolineoxidase promotes tumor cell survival in hypoxic tumor microenvironments.Cancer Res. 2012;72(14):3677–86.
21. Elia I, Broekaert D, Christen S, Boon R, Radaelli E, Orth MF, Verfaillie C,Grunewald TGP, Fendt SM. Proline metabolism supports metastasisformation and could be inhibited to selectively target metastasizing cancercells. Nat Commun. 2017;8:15267.
22. Cho IT, Adelmant G, Lim Y, Marto JA, Cho G, Golden JA. Ascorbateperoxidase proximity labeling coupled with biochemical fractionationidentifies promoters of endoplasmic reticulum-mitochondrial contacts. J BiolChem. 2017;292(39):16382–92.
23. Liu Y, Kruhlak MJ, Hao JJ, Shaw S. Rapid T cell receptor-mediated SHP-1S591 phosphorylation regulates SHP-1 cellular localization and phosphataseactivity. J Leukoc Biol. 2007;82(3):742–51.
24. Galon J, Angell HK, Bedognetti D, Marincola FM. The continuum of cancerimmunosurveillance: prognostic, predictive, and mechanistic signatures.Immunity. 2013;39(1):11–26.
25. Topalian SL, Hodi FS, Brahmer JR, Gettinger SN, Smith DC, McDermott DF,Powderly JD, Carvajal RD, Sosman JA, Atkins MB, et al. Safety, activity, andimmune correlates of anti-PD-1 antibody in cancer. N Engl J Med. 2012;366(26):2443–54.
26. Kesarwani P, Murali AK, Al-Khami AA, Mehrotra S. Redox regulation of T-cellfunction: from molecular mechanisms to significance in human health anddisease. Antioxid Redox Signal. 2013;18(12):1497–534.
27. Scialo F, Fernandez-Ayala DJ, Sanz A. Role of mitochondrial reverse Electrontransport in ROS signaling: potential roles in health and disease. FrontPhysiol. 2017;8:428.
28. Zorov DB, Juhaszova M, Sollott SJ. Mitochondrial reactive oxygen species(ROS) and ROS-induced ROS release. Physiol Rev. 2014;94(3):909–50.
29. Bogeski I, Kappl R, Kummerow C, Gulaboski R, Hoth M, Niemeyer BA. Redoxregulation of calcium ion channels: chemical and physiological aspects. CellCalcium. 2011;50(5):407–23.
30. Belikov AV, Schraven B, Simeoni L. TCR-triggered extracellular superoxideproduction is not required for T-cell activation. Cell Commun Signal. 2014;12:50.
31. Goncalves RL, Quinlan CL, Perevoshchikova IV, Hey-Mogensen M, Brand MD.Sites of superoxide and hydrogen peroxide production by musclemitochondria assessed ex vivo under conditions mimicking rest andexercise. J Biol Chem. 2015;290(1):209–27.
32. Lorenz U. SHP-1 and SHP-2 in T cells: two phosphatases functioning atmany levels. Immunol Rev. 2009;228(1):342–59.
33. Ogura M, Yamaki J, Homma MK, Homma Y. Mitochondrial c-Src regulatescell survival through phosphorylation of respiratory chain components.Biochem J. 2012;447(2):281–9.
34. Frank C, Burkhardt C, Imhof D, Ringel J, Zschornig O, Wieligmann K,Zacharias M, Bohmer FD. Effective dephosphorylation of Src substrates bySHP-1. J Biol Chem. 2004;279(12):11375–83.
35. Qamar A, Mysore KS, Senthil-Kumar M. Role of proline and pyrroline-5-carboxylate metabolism in plant defense against invading pathogens. FrontPlant Sci. 2015;6:503.
36. Nishimura A, Nasuno R, Takagi H. The proline metabolism intermediateDelta1-pyrroline-5-carboxylate directly inhibits the mitochondrial respirationin budding yeast. FEBS Lett. 2012;586(16):2411–6.
37. Liu Y, Borchert GL, Donald SP, Diwan BA, Anver M, Phang JM. Prolineoxidase functions as a mitochondrial tumor suppressor in human cancers.Cancer Res. 2009;69(16):6414–22.
38. Liu W, Le A, Hancock C, Lane AN, Dang CV, Fan TW, Phang JM.Reprogramming of proline and glutamine metabolism contributes to theproliferative and metabolic responses regulated by oncogenic transcriptionfactor c-MYC. Proc Natl Acad Sci U S A. 2012;109(23):8983–8.
39. Liu W, Zabirnyk O, Wang H, Shiao YH, Nickerson ML, Khalil S, Anderson LM,Perantoni AO, Phang JM. miR-23b targets proline oxidase, a novel tumorsuppressor protein in renal cancer. Oncogene. 2010;29(35):4914–24.
40. Nagano T, Nakano M, Nakashima A, Onishi K, Yamao S, Enari M, Kikkawa U,Kamada S. Identification of cellular senescence-specific genes bycomparative transcriptomics. Sci Rep. 2016;6:31758.
Yan et al. Journal for ImmunoTherapy of Cancer (2018) 6:148 Page 14 of 14
on July 31, 2020 by guest. Protected by copyright.
http://jitc.bmj.com
/J Im
munother C
ancer: first published as 10.1186/s40425-018-0466-z on 13 Decem
ber 2018. Dow
nloaded from


![Synthetic Catalysts that Hydrolyze Phosphate and Carboxylate … · 2011-05-14 · T- H ] Synthetic Catalysts that Hydrolyze OHIO Phosphate and Carboxylate Esters SlA UNIVERSITY Anthony](https://img.dokumen.tips/doc/110x75/5fadd5faca620003d90ae693/synthetic-catalysts-that-hydrolyze-phosphate-and-carboxylate-2011-05-14-t-h-.jpg)