Embed Size (px)
Citation preview
1
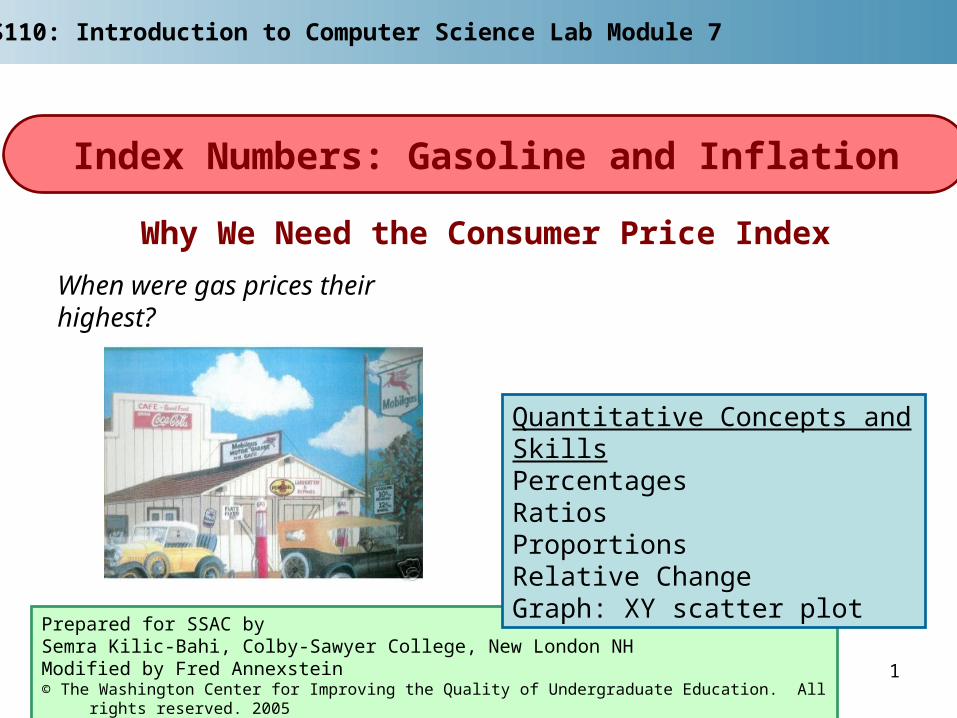
Prepared for SSAC bySemra Kilic-Bahi, Colby-Sawyer College, New London NHModified by Fred Annexstein© The Washington Center for Improving the Quality of Undergraduate Education. All rights reserved. 2005
Quantitative Concepts and SkillsPercentagesRatiosProportionsRelative ChangeGraph: XY scatter plot
Why We Need the Consumer Price Index
When were gas prices their highest?
Index Numbers: Gasoline and Inflation
CS110: Introduction to Computer Science Lab Module 7

2
Making comparisons with Index Numbers: The main purpose of index numbers is to make comparisons. One can compare the prices in one particular year to the prices in the reference year for a particular product or service.
Comparisons can also be made when neither value is the reference value:
Index numbers are used to standardize measurements made at different times or different places so they can be directly compared. This modulefocuses on the use and meaning of index numbers. In particular, it examines the gasoline price index and consumer price index.
The index number is defined as a value relative to a reference value
The reference value is the value, chosen at one particular time or place,to which values at other times and/or other places will be compared. The equation assigns an index number of 100 to the reference time or location.
100 ValueReference
ValueNumberIndex
Background
yearB
yearA
yearB
yearA
Index
Index
Cost
Cost

3
Overview
The Consumer Price Index (CPI) applies to a wide variety of consumer goods and services. The Bureau of Labor Statistics (BLS) measures two consumer price indices. The Urban Consumers Price Index (CPI-U) covers all urban consumers, about 80% of the U.S. population. The Wage Earners Consumer Index (CPI-W) is based on the purchasing habits of only wage earners. This module will use the CPI-U. Because the CPI is used as an economic indicator and a means of adjusting dollar values, it affects many aspects our lives.
The relative change in the CPI from one year to the next is referred as the rate of inflation.
If we want to compare prices fairly we must take inflation into account: we must adjust prices for inflation. To adjust for inflation, we find the equivalent price in a later year.
Slide 4 poses the problem: Was gasoline really more expensive in 2005 than it was in 1980?
Slides 5-7 explore the problem by building and using a Gas Price Index.
Slides 8-13 uses the Consumer Price Index to compare the cost of gasoline with the inflation of costs in general, and Slides 14 and 15 chart the cost of gasoline in 2005 dollars for 1978-2005.
Slides 16-17 give the end-of-module assignments.
Year1
Year2
Year1
Year2
CPI
CPI
Price Actual
Price Equivalent
Year1
Year1Year221 CPI
CPICPI Year tofromYear RateInflation

4
The Cost of Gasoline
Resource: Bureau of Labor Stat. http://data.bls.gov/cgi-bin/surveymost?ap. The value for 2005 is estimated.
= Cell with a number in it
= Cell with a formula in it
Recreate this spreadsheet and graph that show the cost of a gallon of gasoline year by year from 1978 through 2005.
Color convention throughout this module
Problem: Is gasoline more expensive now (2005) than it has been in the past?
It certainly looks like it, doesn’t it? But what about inflation?
B C
2 Year Price ($)34 1978 0.655 1979 0.886 1980 1.227 1981 1.358 1982 1.289 1983 1.23
10 1984 1.2011 1985 1.2012 1986 0.9313 1987 0.9614 1988 0.9615 1989 1.0616 1990 1.2217 1991 1.2018 1992 1.1919 1993 1.1720 1994 1.1721 1995 1.2122 1996 1.2923 1997 1.2924 1998 1.1225 1999 1.2226 2000 1.5627 2001 1.5328 2002 1.4429 2003 1.6430 2004 1.9231 2005 2.32
The Price of Gasoline
$0.00
$0.50
$1.00
$1.50
$2.00
$2.50
1975 1980 1985 1990 1995 2000 2005
Year
Co
st p
er G
allo
n
5
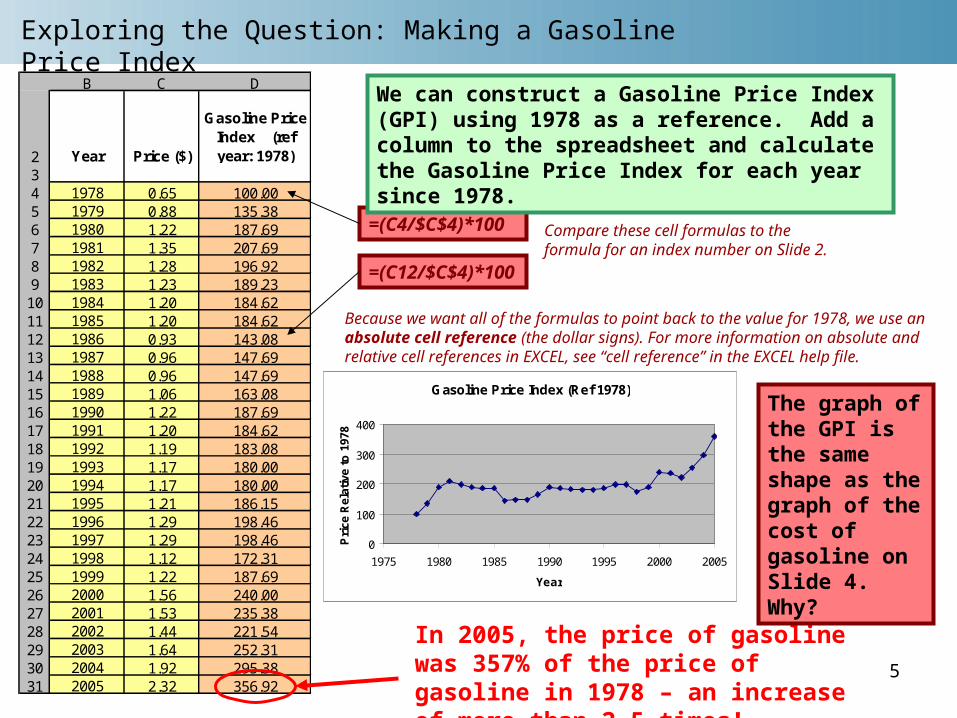
We can construct a Gasoline Price Index (GPI) using 1978 as a reference. Add a column to the spreadsheet and calculate the Gasoline Price Index for each year since 1978.
=(C4/$C$4)*100
=(C12/$C$4)*100
Exploring the Question: Making a Gasoline Price Index
Because we want all of the formulas to point back to the value for 1978, we use an absolute cell reference (the dollar signs). For more information on absolute and relative cell references in EXCEL, see “cell reference” in the EXCEL help file.
Compare these cell formulas to the formula for an index number on Slide 2.
Gasoline Price Index (Ref 1978)
0
100
200
300
400
1975 1980 1985 1990 1995 2000 2005
Year
Pri
ce R
elat
ive
to 1
978
B C D
2 Year Price ($)
Gasoline Price Index (ref year: 1978)
34 1978 0.65 100.005 1979 0.88 135.386 1980 1.22 187.697 1981 1.35 207.698 1982 1.28 196.929 1983 1.23 189.23
10 1984 1.20 184.6211 1985 1.20 184.6212 1986 0.93 143.0813 1987 0.96 147.6914 1988 0.96 147.6915 1989 1.06 163.0816 1990 1.22 187.6917 1991 1.20 184.6218 1992 1.19 183.0819 1993 1.17 180.0020 1994 1.17 180.0021 1995 1.21 186.1522 1996 1.29 198.4623 1997 1.29 198.4624 1998 1.12 172.3125 1999 1.22 187.6926 2000 1.56 240.0027 2001 1.53 235.3828 2002 1.44 221.5429 2003 1.64 252.3130 2004 1.92 295.3831 2005 2.32 356.92
In 2005, the price of gasoline was 357% of the price of gasoline in 1978 – an increase of more than 2.5 times!
The graph of the GPI is the same shape as the graph of the cost of gasoline on Slide 4. Why?

6
Using the GPI to Make Comparisons
We can answer the question by using the GPI (Gasoline Price Index) that we developed in Slide 5. First we divide the GPI for year 2005 by the GPI for 1980 to find a comparison factor (it will be a multiplier) that will express the cost of gasoline in 2005 relative to the cost of gasoline in 1980:.
Thus the 2005 price is almost twice the 1980 price.
Next you multiply what you would have paid for gas in 1980 by the comparison factor to find what you would have paid in 2005.
Thus, if you had filled your gas tank for $12 in 1980, you would have paid $12.00 × 1.91 = $22.92 to fill your gas tank in 2005
Suppose it cost $12 dollars to fill a gas tank in 1980. How much would it have cost to fill the same tank in 2005?
1.91187.27
356.92
GPI
GPI
1980
2005
91.112$GPI
GPIGasGas
1980
200519802005
Be prepared to discuss this calculation using the words ratio and proportion

7
If we can answer the question for 2005, we can answer it too for any year that we know the GPI. So, if it cost $12 dollars to fill a gas tank in 1980, how much would it have cost to fill the same tank for each year from 1978 to 2005?
Making More Comparisons
Compare this cell formula to the formula for the price of gas in 2005 on slide 6.
Add another column in the spreadsheet to show the price for each year.
B C D E
2 Year Price ($)
Gasoline Price Index (ref year: 1978)
Equivalent of a $12 tank of gas in 1980 ($)
34 1978 0.65 100.00 6.395 1979 0.88 135.38 8.666 1980 1.22 187.69 12.007 1981 1.35 207.69 13.288 1982 1.28 196.92 12.599 1983 1.23 189.23 12.10
10 1984 1.20 184.62 11.8011 1985 1.20 184.62 11.8012 1986 0.93 143.08 9.1513 1987 0.96 147.69 9.4414 1988 0.96 147.69 9.4415 1989 1.06 163.08 10.4316 1990 1.22 187.69 12.0017 1991 1.20 184.62 11.8018 1992 1.19 183.08 11.7019 1993 1.17 180.00 11.5120 1994 1.17 180.00 11.5121 1995 1.21 186.15 11.9022 1996 1.29 198.46 12.6923 1997 1.29 198.46 12.6924 1998 1.12 172.31 11.0225 1999 1.22 187.69 12.0026 2000 1.56 240.00 15.3427 2001 1.53 235.38 15.0528 2002 1.44 221.54 14.1629 2003 1.64 252.31 16.1330 2004 1.92 295.38 18.8931 2005 2.32 356.92 22.82
1980
2005
GPI
GPI12
We are not showing a graph of the $12 tank of gas vs. time, because it would be yet another rescaled version of the graph of GPI. But now we can come to the point: How would these graphs of gasoline prices differ from graphs of consumer prices in general over those years? What about inflation?

8
We have observed that the price of gasoline has increased over time. But the price of consumer goods in general may have increased even more. If so, the cost of gas in 2005 might actually cost less relative to everything else in 2005 than it did earlier. The way to find out is to look at the Consumer Price Index.
Consumer Price Index
B C2 Year Annual CPI-U3 1978 65.24 1979 72.65 1980 82.46 1981 90.97 1982 96.58 1983 99.69 1984 103.9
10 1985 107.611 1986 109.612 1987 113.613 1988 118.314 1989 124.015 1990 130.716 1991 136.217 1992 140.318 1993 144.519 1994 148.220 1995 152.421 1996 156.922 1997 160.523 1998 163.024 1999 166.625 2000 172.226 2001 177.127 2002 179.928 2003 184.029 2004 188.930 2005 194.9
0
5
10
15
-995 5 1005 2005
Year
Infl
atio
n R
ate
(%)
Click on the object to create this spreadsheet. Now graph the Consumer Price Index vs. Time.
Consumer Price Index
0
50
100
150
200
1975 1980 1985 1990 1995 2000 2005
Year
CP
I
Certainly there has been an inexorable rise in prices in general from 1978 to 2005. How do the across-the-board prices in 2005 compare specifically to those in 1980?
Microsoft Excel Worksheet

9
In general, costs in 2005 were how many times the costs in 1980?
2.3682.4
194.9
CPI
CPI
1980
2005
Recall (Slide 4) a gallon of gas cost $1.22 in 1980. In general, things that cost $1.22 in 1980 (“in 1980 dollars”) cost $1.22 × 2.36 = $2.89 in 2005 (“in “2005 dollars”). But a gallon of gas cost $2.32 in 2005. So gasoline was not relatively more expensive in 2005 than it was in 1980.
We wish to compare the cost of goods and services in 1980 to the cost of goods and services in 2005. According to these tabulated values of the CPI-U, what would have cost $82.40 in 1980 would have cost $194.90 in 2005.
Using the CPI to Make Comparisons
B C2 Year Annual CPI-U3 1978 65.24 1979 72.65 1980 82.46 1981 90.97 1982 96.58 1983 99.69 1984 103.9
10 1985 107.611 1986 109.612 1987 113.613 1988 118.314 1989 124.015 1990 130.716 1991 136.217 1992 140.318 1993 144.519 1994 148.220 1995 152.421 1996 156.922 1997 160.523 1998 163.024 1999 166.625 2000 172.226 2001 177.127 2002 179.928 2003 184.029 2004 188.930 2005 194.9
0
5
10
15
-995 5 1005 2005
Year
Infl
atio
n R
ate
(%)
We can have Excel make this kind of comparison for every year since 1980 from our data on CPI and GPI.

10
Comparing the GPI and the CPI
Add the four columns of cell equations to recreate this spreadsheet.
Columns E and F are the indexes relative to the 1980 value. Columns G and H are the percentage increases of the indexes since 1980.
B C D E F G H
2 Year Annual CPI-U
Gasoline Price Index (ref year:
1978)CPI(Year) / CPI(1980)
GPI(Year) / GPI(1980)
CPI Increase
(%)
GPI Increase
(%)3 1978 65.2 100.004 1979 72.6 135.385 1980 82.4 187.69 1.00 1.00 0% 0%6 1981 90.9 207.69 1.10 1.11 10% 11%7 1982 96.5 196.92 1.17 1.05 17% 5%8 1983 99.6 189.23 1.21 1.01 21% 1%9 1984 103.9 184.62 1.26 0.98 26% -2%
10 1985 107.6 184.62 1.31 0.98 31% -2%11 1986 109.6 143.08 1.33 0.76 33% -24%12 1987 113.6 147.69 1.38 0.79 38% -21%13 1988 118.3 147.69 1.44 0.79 44% -21%14 1989 124.0 163.08 1.50 0.87 50% -13%15 1990 130.7 187.69 1.59 1.00 59% 0%16 1991 136.2 184.62 1.65 0.98 65% -2%17 1992 140.3 183.08 1.70 0.98 70% -2%18 1993 144.5 180.00 1.75 0.96 75% -4%19 1994 148.2 180.00 1.80 0.96 80% -4%20 1995 152.4 186.15 1.85 0.99 85% -1%21 1996 156.9 198.46 1.90 1.06 90% 6%22 1997 160.5 198.46 1.95 1.06 95% 6%23 1998 163.0 172.31 1.98 0.92 98% -8%24 1999 166.6 187.69 2.02 1.00 102% 0%25 2000 172.2 240.00 2.09 1.28 109% 28%26 2001 177.1 235.38 2.15 1.25 115% 25%27 2002 179.9 221.54 2.18 1.18 118% 18%28 2003 184.0 252.31 2.23 1.34 123% 34%29 2004 188.9 295.38 2.29 1.57 129% 57%30 2005 194.9 356.92 2.37 1.90 137% 90%
0
5
10
15
-995 5 1005 2005
Year
Infl
atio
n R
ate
(%)
For comments on this table, see next slide.

11
Comparing the changing GPI to inflation: Table
B C D E F G H
2 Year Annual CPI-U
Gasoline Price Index (ref year:
1978)CPI(Year) / CPI(1980)
GPI(Year) / GPI(1980)
CPI Increase
(%)
GPI Increase
(%)3 1978 65.2 100.004 1979 72.6 135.385 1980 82.4 187.69 1.00 1.00 0% 0%6 1981 90.9 207.69 1.10 1.11 10% 11%7 1982 96.5 196.92 1.17 1.05 17% 5%8 1983 99.6 189.23 1.21 1.01 21% 1%9 1984 103.9 184.62 1.26 0.98 26% -2%
10 1985 107.6 184.62 1.31 0.98 31% -2%11 1986 109.6 143.08 1.33 0.76 33% -24%12 1987 113.6 147.69 1.38 0.79 38% -21%13 1988 118.3 147.69 1.44 0.79 44% -21%14 1989 124.0 163.08 1.50 0.87 50% -13%15 1990 130.7 187.69 1.59 1.00 59% 0%16 1991 136.2 184.62 1.65 0.98 65% -2%17 1992 140.3 183.08 1.70 0.98 70% -2%18 1993 144.5 180.00 1.75 0.96 75% -4%19 1994 148.2 180.00 1.80 0.96 80% -4%20 1995 152.4 186.15 1.85 0.99 85% -1%21 1996 156.9 198.46 1.90 1.06 90% 6%22 1997 160.5 198.46 1.95 1.06 95% 6%23 1998 163.0 172.31 1.98 0.92 98% -8%24 1999 166.6 187.69 2.02 1.00 102% 0%25 2000 172.2 240.00 2.09 1.28 109% 28%26 2001 177.1 235.38 2.15 1.25 115% 25%27 2002 179.9 221.54 2.18 1.18 118% 18%28 2003 184.0 252.31 2.23 1.34 123% 34%29 2004 188.9 295.38 2.29 1.57 129% 57%30 2005 194.9 356.92 2.37 1.90 137% 90%
0
5
10
15
-995 5 1005 2005
Year
Infl
atio
n R
ate
(%)
This says costs in 1989 were 1.5x the costs in 1980.
This says there was 50% inflation between 1980 and 1989.
This says gas actually decreased 13% over the same period.
Now graph Columns E and F vs. year to see the change in CPI and GPI relative to their values in 1980.

12
Comparing the changing GPI to inflation: Graph
GPI compared to CPI
0.00
0.50
1.00
1.50
2.00
2.50
1980 1985 1990 1995 2000 2005
Year
Ind
ex r
elat
ive
to 1
980
valu
e
CPI relative to CPI(1980) GPI relative to GPI(1980)
Over the 1980-2005 period, gas prices started out tracking the CPI, but then they fell far behind as the CPI rose but the GPI did not – until recently, that is, when the GPI has been rising faster than the CPI.
This graph of the rising CPI shows the amount of inflation since 1980. When speaking of “graphs of inflation,” however, one generally is referring to the annual inflation (“inflation rates”). Inflations rates are different – they are the relative change over a one-year period (for example, a 10% change over a 10-year period is vastly different than a 10% change over a one-year period). To draw a graph of the annual inflation rate from 1980 to 2005, we need to go back to the data of Slide 8.

13
Inflation Rate
Note: the CPI of 1979 (72.6) is 11.35% higher than the CPI of 1978 (65.2), so we are saying that the inflation rate during 1978 was 11.35%.
B C D E2 Year Annual CPI-U Year Inflation Rate3 1978 65.2 %4 1979 72.6 1978 11.355 1980 82.4 1979 13.506 1981 90.9 1980 10.327 1982 96.5 1981 6.168 1983 99.6 1982 3.219 1984 103.9 1983 4.32
10 1985 107.6 1984 3.5611 1986 109.6 1985 1.8612 1987 113.6 1986 3.6513 1988 118.3 1987 4.1414 1989 124.0 1988 4.8215 1990 130.7 1989 5.4016 1991 136.2 1990 4.2117 1992 140.3 1991 3.0118 1993 144.5 1992 2.9919 1994 148.2 1993 2.5620 1995 152.4 1994 2.8321 1996 156.9 1995 2.9522 1997 160.5 1996 2.2923 1998 163.0 1997 1.5624 1999 166.6 1998 2.2125 2000 172.2 1999 3.3626 2001 177.1 2000 2.8527 2002 179.9 2001 1.5828 2003 184.0 2002 2.2829 2004 188.9 2003 2.6630 2005 194.9 2004 3.18
Retrieve your data from the spreadsheet of Slide 8, add two columns of cell equations to track the year-to-year inflation rate, and graph inflation rate vs. time.
0
5
10
15
1975 1980 1985 1990 1995 2000 2005
Year
Infl
atio
n R
ate
(%)

14
B C F G
2 Year Annual CPI-UGas Price
($)
Adjusted Gas Price (2005$)
3 1978 65.2 0.65 1.944 1979 72.6 0.88 2.365 1980 82.4 1.22 2.896 1981 90.9 1.35 2.897 1982 96.5 1.28 2.598 1983 99.6 1.23 2.419 1984 103.9 1.20 2.25
10 1985 107.6 1.20 2.1711 1986 109.6 0.93 1.6512 1987 113.6 0.96 1.6513 1988 118.3 0.96 1.5814 1989 124.0 1.06 1.6715 1990 130.7 1.22 1.8216 1991 136.2 1.20 1.7217 1992 140.3 1.19 1.6518 1993 144.5 1.17 1.5819 1994 148.2 1.17 1.5420 1995 152.4 1.21 1.5521 1996 156.9 1.29 1.6022 1997 160.5 1.29 1.5723 1998 163.0 1.12 1.3424 1999 166.6 1.22 1.4325 2000 172.2 1.56 1.7726 2001 177.1 1.53 1.6827 2002 179.9 1.44 1.5628 2003 184.0 1.64 1.7429 2004 188.9 1.92 1.9830 2005 194.9 2.32 2.32
Adjusting Gasoline Prices for Inflation
We can make the comparison a different way. We can ask how much a gallon of gasoline back then “was worth” in the dollars of 2005.
For example, in 2005 you would have had to pay 194.9/82.4 = 2.37 times what you would have paid for the same goods in 1980. So the $1.22 you would have paid for a gallon of gas in 1980 would buy 2.37×$1.22 = $2.89 worth of goods in 2005 (whereas gas cost “only” $2.32 a gallon).
Retrieve your data for the CPI (Slide 8) and the Price of a Gallon of Gas (Slide 5), and add a column of cell equations to calculate how much a gallon of gas was worth year by year in 2005 dollars.
Now graph the gas price and the adjusted gas price vs. time

15
B C F G
2 Year Annual CPI-UGas Price
($)
Adjusted Gas Price (2005$)
3 1978 65.2 0.65 1.944 1979 72.6 0.88 2.365 1980 82.4 1.22 2.896 1981 90.9 1.35 2.897 1982 96.5 1.28 2.598 1983 99.6 1.23 2.419 1984 103.9 1.20 2.25
10 1985 107.6 1.20 2.1711 1986 109.6 0.93 1.6512 1987 113.6 0.96 1.6513 1988 118.3 0.96 1.5814 1989 124.0 1.06 1.6715 1990 130.7 1.22 1.8216 1991 136.2 1.20 1.7217 1992 140.3 1.19 1.6518 1993 144.5 1.17 1.5819 1994 148.2 1.17 1.5420 1995 152.4 1.21 1.5521 1996 156.9 1.29 1.6022 1997 160.5 1.29 1.5723 1998 163.0 1.12 1.3424 1999 166.6 1.22 1.4325 2000 172.2 1.56 1.7726 2001 177.1 1.53 1.6827 2002 179.9 1.44 1.5628 2003 184.0 1.64 1.7429 2004 188.9 1.92 1.9830 2005 194.9 2.32 2.32
0.00
0.50
1.00
1.50
2.00
2.50
3.00
1975 1980 1985 1990 1995 2000 2005 2010
Year
Co
st o
fGal
lon
of
Gas
($)
Gasoline in dollars of the time Gasoline in 2005 dollars
Adjusting Gasoline Prices for Inflation
Here is the answer to our question. The graph shows the cost of a gallon of gasoline in 2005 dollars from 1978 through 2005. Gas was more expensive in 1979-1982 than in was in 2005 according to these data.

16
1. Expand the table in Slide 5 to give the gasoline price index over the period 1978 to present (use $2.20 for 2006 and $2.79 for 2007). Also, use 1988 as the reference year. Multiplot the GPI with the 1988 reference year with the GPI with the 1978 reference year (Slide 5). What do you observe? How do the graphs differ? Explain what you observe.
2. Redo the calculations in Slide7 to find the equivalent of gasoline which cost $12 in 1980 for each year over the period 1978 to present using 1988 as the reference year and compare it to the results from using 1978 as a reference year. What do you observe? Does the result make sense? Explain!
3. Expand the table in Slide 8 and create a scatter plot of the CPI from 1913 to present (See ftp://ftp.bls.gov/pub/special.requests/cpi/cpiai.txt)
4. Redo the calculations in Slide 15 by evaluating the equivalent price of an item which cost $1 in 1988 for each year since 1913. In what year was the purchasing power of 1988’s $1 the highest?
5. Use your table from assignment 3 to calculate and graph (scatter plot) the rate of inflation since 1913. What do you observe? Write a paragraph discussing the behavior of the rate of inflation in terms of major national and world events during this period. Compare your graph with the CPI graph of assignment #4.
End of Module Assignments

17
7. Find the average price of an item or a service from 1970’s and adjust its price to today’s dollars.
8. Find out about the Housing Price Index and write a brief summary about how it is used. Compare the price of a house in another town to a house in your own town.
9. Find out about the Consumer Confidence Index and write a brief summary describing it. Describe any recent trends in the Consumer Confidence Index.
End of Module Assignments
References
Using and Understanding Mathematics: A Quantitative Approach, by Jeffrey Bennett and William Briggs
Contemporary College Algebra, by Don Small
For All Practical Purposes, Mathematical Literacy in Today’s World, by COMAPBureau of Labor Statistics Website http://data.bls.gov/
Gas station picture:http://cgi.ebay.com/ws/eBayISAPI.dll?ViewItem&item=7113368463&category=834