Embed Size (px)
Citation preview

1
Predictors of customer perceived software quality
Paul Luo Li (ISRI – CMU)
Audris Mockus (Avaya Research)
Ping Zhang (Avaya Research)

2
Need to View Quality from the Customer’s Perspective
… We translate these advanced technologies into value for our customers …
-IBM (#9 on the Fortune 500)
… Our strategy is to offer products, services and solutions that are high tech, low cost and deliver the
best customer experience. -HP (#11 on the Fortune 500)
… We deliver unparalleled value to our customers. Only by serving our customers well do we justify our existence as a business
-Avaya (#401 on the Fortune 500)
3
What Would be Ideal
Predict customer perceived qualityUsing customer characteristicsFor each customer
Key idea: Focus on the customer

4
Possible Applications of Predictions
How do I plan deployment to meet the quality expectations of the customer?
How do I target improvement efforts?
How do I allocate the right resources to deal with customer problems
Predict customer experience for each customer
Identify possible causes of problems
Predict customer interactions

5
Solutions for Software Producers
How do I plan deployment to meet the quality expectations of the customer?
How do I target improvement efforts?
How do I allocate the right resources to deal with customer problems
Predict customer experience for each customer
Identify possible causes of problems
Predict customer interactions
6
To Improve Customer Perceived Quality
How do I plan deployment to meet the quality expectations of the customer?
How do I target improvement efforts?
How do I allocate the right resources to deal with customer problems
Predict customer experience for each customer
Identify possible causes of problems
Predict customer interactions

7
Gaps in Current Research
Prior work examined: Software defect prediction for a single
customer (Musa et al. 1987, Lyu et al. 1996)
Software defect prediction for modules or features (Jones et al. 1999, Khoshgoftaar et al. 1996)
Is not scalable
8
Not Focused on Customers
Prior work examined: Software defect prediction for a single
customer (Musa et al. 1987, Lyu et al. 1996)
Software defect prediction for modules or features (Jones et al. 1999, Khoshgoftaar et al. 1996)
Tell us nothing about a specific customer

9
Does not Capture other Aspects of Customer Perceived Quality Prior work examined:
Software defect prediction for a single customer (Musa et al. 1987, Lyu et al. 1996)
Software defect prediction for modules or features (Jones et al. 1999, Khoshgoftaar et al. 1996)
Does not predict other aspects of customer perceived quality that are not code related.

10
Research Contributions
Predict software defects for each customer in a cost effective manner
Predict other aspects of customer perceived quality for each customer
Empirically validate deployment, usage, software, and hardware predictors

11
Rest of This Talk
The setting Customer interactions (outputs) Customer characteristics (inputs) Results Conclusion

12
Empirical Results from a Real World Software System
Avaya telephone call processing software system7 million+ lines of C/C++Fixed release schedule
Process improvement efforts Tens of thousands of customers
90% of Fortune 500 companies use it Professional support organization

13
Data Used are Commonly Available
Customer issue tracking system Trouble ticket database
The equipment database Change management
Sablime database
Data collected as a part of everyday operations
Data sources available at other organizations e.g.
IBM and HP

14
Data collected as a part of everyday operations
Data sources available at other organizations e.g.
IBM and HP
At Other Organizations
Customer issue tracking system Trouble ticket database
The equipment database Change management
Sablime database

15
Customer Interactions (Outputs) We assume customer interaction == customer
perceived quality Five customer interaction (Chulani et al. 2001,
Buckley and Chillarege 1995) within 3 month of deployment Software defects: high impact problem System outages: high impact problem Technician dispatches Calls Automated alarms
Important for Avaya and likely for other organizations as well

16
Examine Customer Installations
Months after general availability
Num
ber
of d
eplo
ymen
ts
1
5

17
Capture Characteristics of Each Installation
Months after general availability
Num
ber
of d
eplo
ymen
ts
1
5
Customer 1: Deployed first month, a Large system, Linux…Customer 2: Deployed first month, a Small system, Windows…Customer 3: Deployed first month, a Large system, Proprietary Os…Customer 4: Deployed first month, a Small system, Linux…Customer 5: Deployed first month, a Large system, Linux…

18
Analyze Using Statistical Analysis
Months after general availability
Num
ber
of d
eplo
ymen
ts
1
5
Customer 1: Deployed first month, a Large system, Linux…Customer 2: Deployed first month, a Small system, Windows…Customer 3: Deployed first month, a Large system, Proprietary Os…Customer 4: Deployed first month, a Small system, Linux…Customer 5: Deployed first month, a Large system, Linux…
Similarities Differences
19
Category of Predictors (Kinds of Inputs) We examine:
Deployment issues Usage patterns Software platform Hardware configurations
Prior work examines: Software product Development process
Common sense issues, but lack empirical validation
20
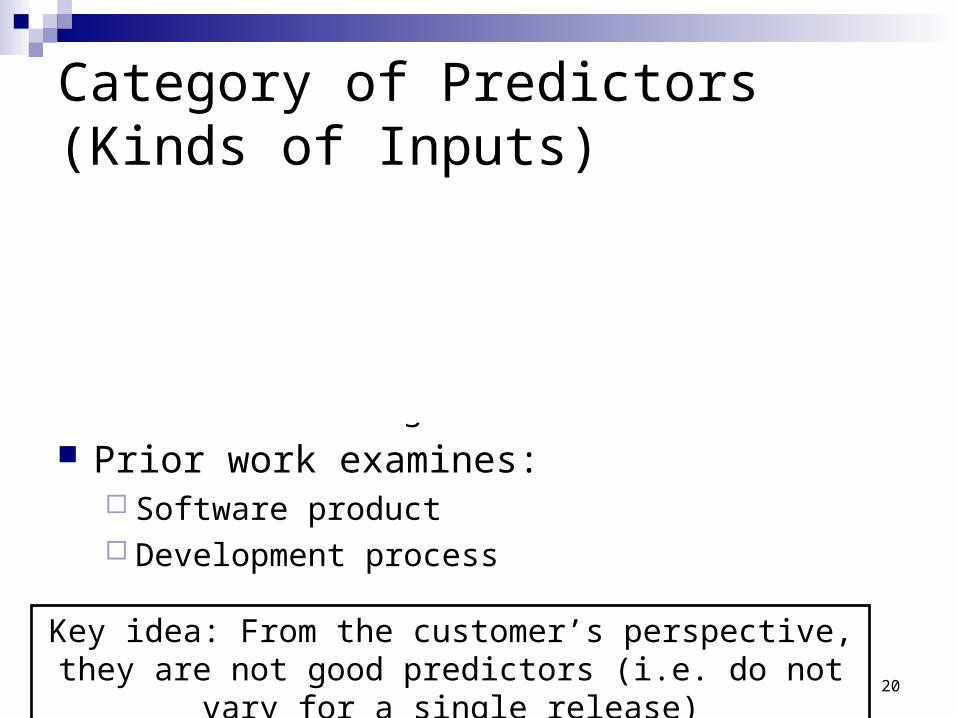
Category of Predictors (Kinds of Inputs) We examine:
Deployment issues Usage patterns Software platform Hardware configurations
Prior work examines: Software product Development process
Key idea: From the customer’s perspective, they are not good predictors (i.e. do not vary for a single release)

21
Specific Predictors (Inputs)
Total deployment time deployment issues
Operating system software platform, hardware configurations
System size hardware configurations, software platform, usage
patterns Ports
usage pattern, hardware configurations Software upgrades
deployment issue

22
Recap
Predict for each customer (outputs): Software defects System outages Technician dispatches Calls Automated alarms
Using Logistic regression and Linear regression
Using predictors (inputs): Total deployment time Operating system System size Ports Software upgrades
For a real world software system

23
Example: Field Defect Predictions

24
Predictors
25
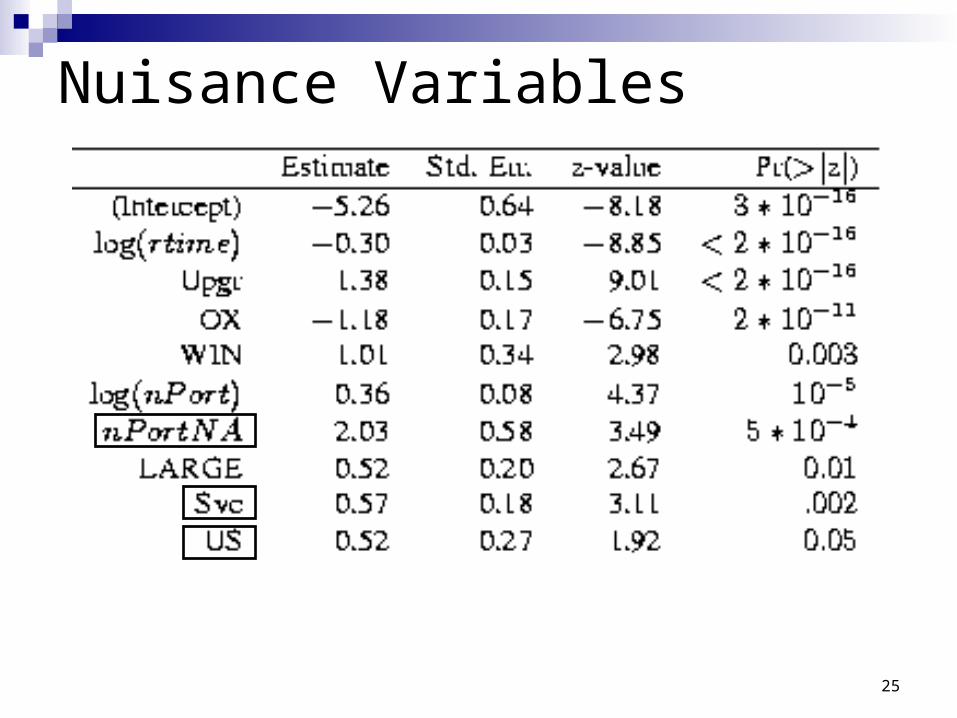
Nuisance Variables

26
All Predictors are Important

27
The Most Important Predictor
Total deployment time (deployment issue) Systems deployed half way into our observational
period are 13 to 25 times less likely to experience a software defect
28
May Enable Deployment Adjustments
Total deployment time (deployment issue) Systems deployed half way into our observational
period are 13 to 25 times less likely to experience a software defect
May be due to software patching, better tools, more experienced technicians
29
Another Important Predictor
Total deployment time (deployment issue) Operating system (software platform, hardware
configurations) Systems running on the proprietary OS are 3 times
less likely to experience a software defect compared with systems on running the open OS (Linux)
Systems running on the commercial OS (Windows) are 3 times more likely to experience a software defect compared with systems running on the open OS (Linux)

30
May Allow for Targeted Improvement or Improved Testing
Total deployment time (deployment issue) Operating system (software platform, hardware
configurations) May be due to familiarity with the operating system May be due to operating system complexity
31
More Results in Paper
The complete results and analyses for field defects
Predictions for other customer interactions

32
Validation of Results and Method
We accounted for data reporting differences Included indicator variables in the models to identify
populations (e.g. US or international customers) We independently validated the data collection
process Independently extracted data and performed analyses
We interviewed personnel to validate findings Programmers Field technicians

33
Summary: Identified Predictors of Customer Perceived Quality
We identified and quantified characteristics, like time of deployment, that can affect customer perceived quality by more than an order of magnitude
34
Summary: Modeled Customer Interactions
We identified and quantified characteristics , like time of deployment, that can affect customer perceived quality by more than an order of magnitude
We created models that can predict various customer interactions and found that predictors have consistent effect across interactions

35
Summary: Deployment is Important for High Reliability
We identified and quantified characteristics , like time of deployment, that can affect customer perceived quality by more than an order of magnitude
We created models that can predict various customer interactions and found that predictors have consistent effect across interactions
We learned that controlled deployment may be the key for high reliability systems

36
Improve Customer’s Experiences
You can target improvement efforts You can allocate the right resources to deal
with customer reported problems You can adjust deployment to meet the quality
expectations of your customers

37
Predictors of customer perceived software quality
Paul Luo Li ([email protected])
Audris Mockus (Avaya Research)
Ping Zhang (Avaya Research)
38
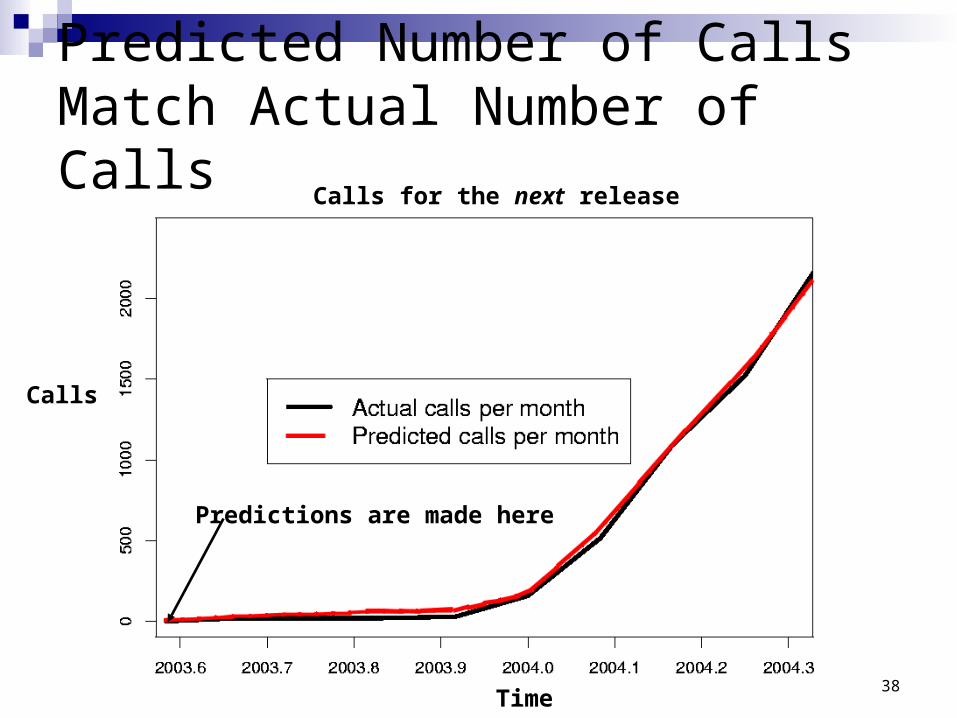
Predicted Number of Calls Match Actual Number of Calls
Calls for the next release
Calls
Time
Predictions are made here