Embed Size (px)
Citation preview
1
Philanthropy and Voluntarism

2
Outline
• Individual giving• Giving innovations and
institutional philanthropy
3
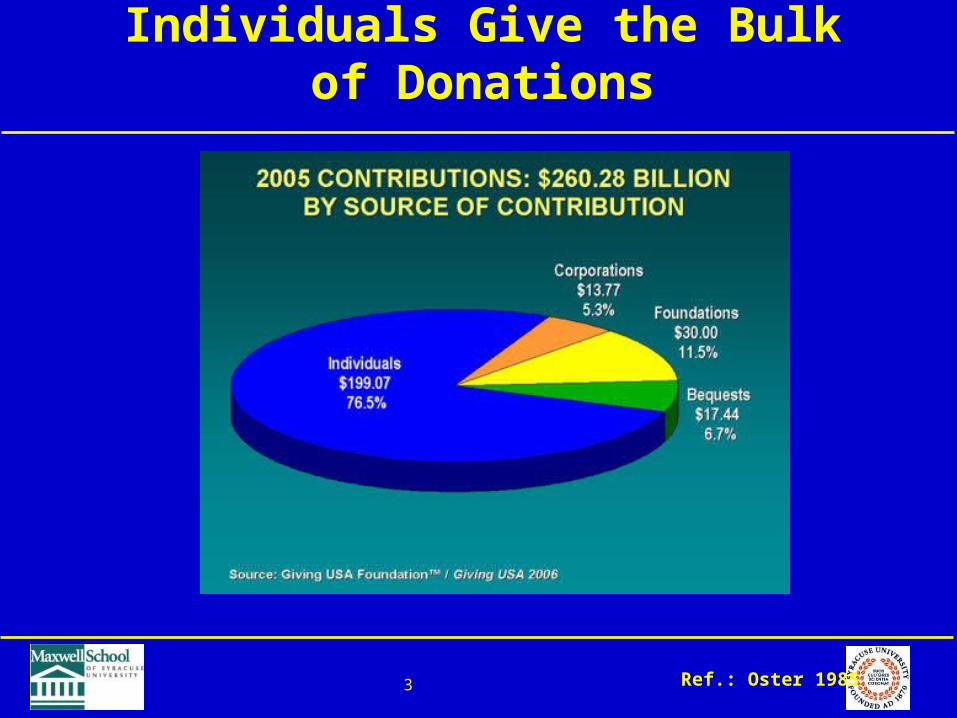
Individuals Give the Bulk of Donations
Ref.: Oster 1985
4
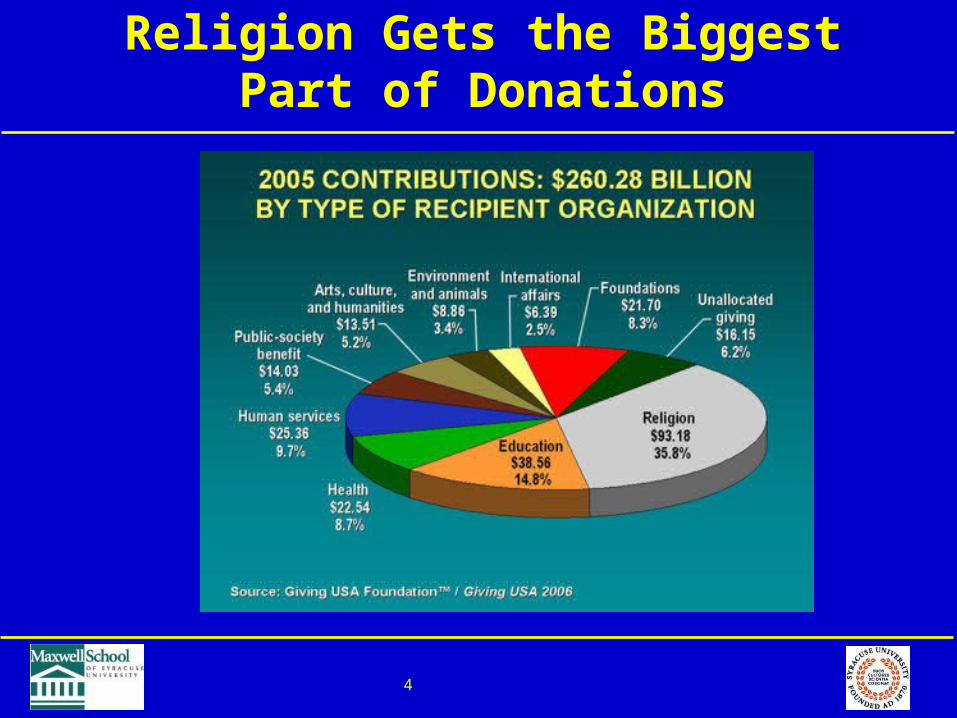
Religion Gets the Biggest Part of Donations
5
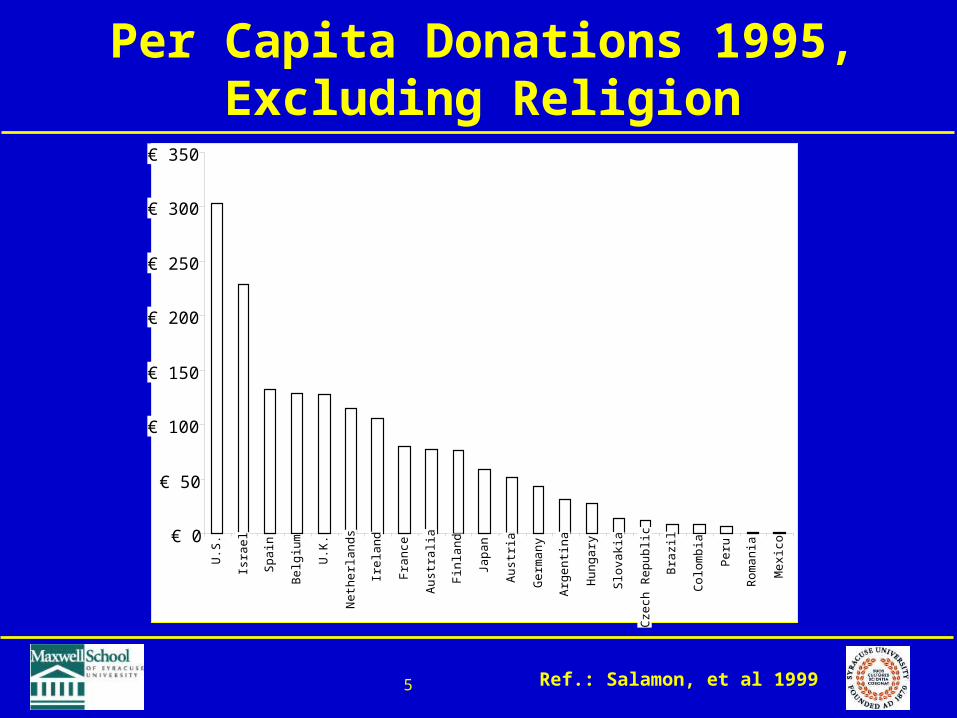
Per Capita Donations 1995,Excluding Religion
€ 0
€ 50
€ 100
€ 150
€ 200
€ 250
€ 300
€ 350
U.S
.
Isra
el
Spa
in
Bel
giu
m
U.K
.
Net
he
rla
nds
Ire
lan
d
Fra
nce
Aus
tra
lia
Fin
lan
d
Japa
n
Aus
tria
Ger
man
y
Arg
en
tina
Hun
ga
ry
Slo
vaki
a
Cze
ch R
ep
ub
lic
Bra
zil
Col
om
bia
Per
u
Rom
ani
a
Me
xico
Ref.: Salamon, et al 1999

6
Private Contributions, Corrected for Income
Country Non-religious charitable donations per capita
Ranking Ranking, correcting for purchasing power*
United States $278.04 1 2 Israel $210.54 2 1 Spain $121.92 3 3 Belgium $118.60 4 8 UK $117.44 5 4 Sweden $109.30 6 6 Ireland $97.31 7 5 Netherlands $93.77 8 20 Norway $89.28 9 28 France $73.90 10 25 Finland $70.02 11 24 Australia $68.89 12 27 Japan $53.74 13 29 Austria $47.48 14 31 Germany $39.33 15 30 Argentina $28.69 16 13 Hungary $25.56 17 9 Italy $19.25 18 32 South Korea $19.24 19 7 South Africa $13.94 20 16 Slovak Republic $12.60 21 22 Czech Republic $11.66 22 26 Poland $10.52 23 18 Brazil $7.48 24 17 Colombia $7.06 25 15 Peru $6.31 26 10 Kenya $2.08 27 11 Tanzania $1.67 28 12 Romania $1.52 29 21 Mexico $1.06 30 23 Pakistan $1.05 31 14 Philippines $0.48 32 19
7
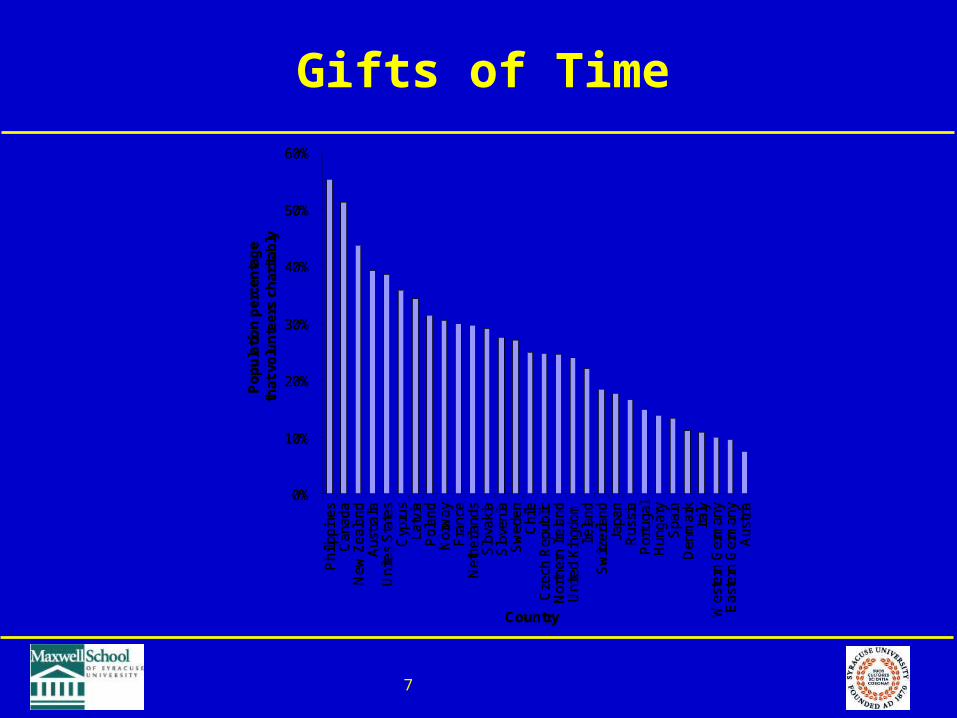
Gifts of Time
0%
10%
20%
30%
40%
50%
60%
Phi
lippi
nes
Can
ada
New
Zea
land
Aus
tral
iaU
nite
s S
tate
sC
ypru
sLa
tvia
Pol
and
Nor
wa
yF
ranc
eN
ethe
rland
sS
lova
kia
Slo
veni
aS
wed
enC
hile
Cze
ch R
epub
licN
orth
ern
Irel
and
Uni
ted
Kin
gdom
Irel
and
Sw
itze
rland
Japa
nR
ussi
aP
ortu
gal
Hun
gary
Spa
inD
enm
ark
Italy
Wes
tern
Ger
man
yE
aste
rn G
erm
any
Aus
tria
Country
Po
pu
lati
on
per
cen
tag
eth
at v
olu
nte
ers
char
itab
ly
8
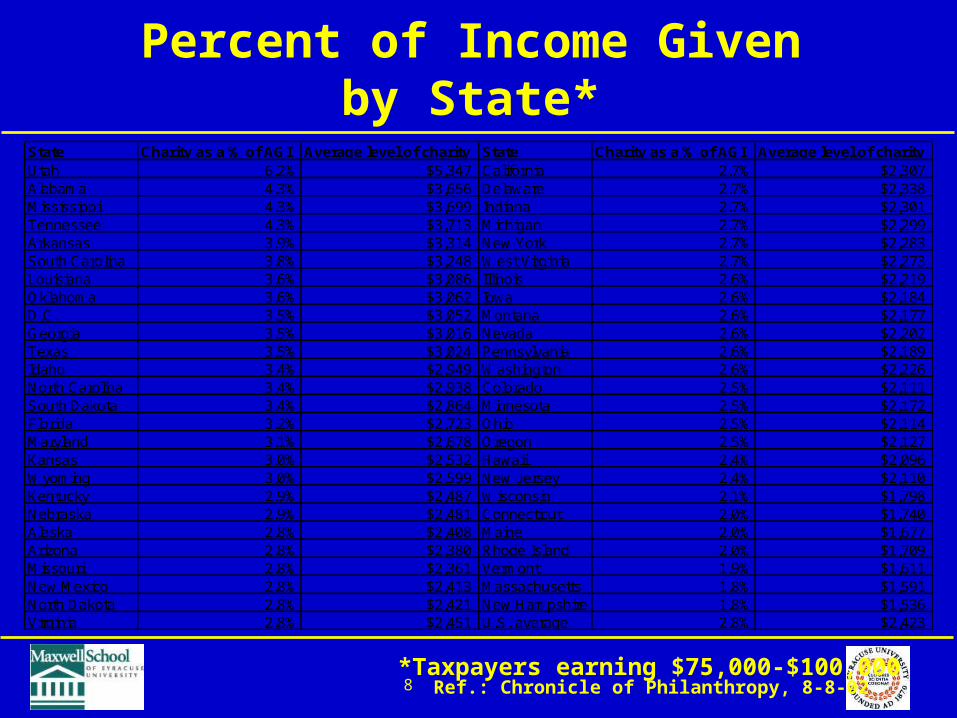
Percent of Income Givenby State*
State Charity as a % of AGI Average level of charity State Charity as a % of AGI Average level of charityUtah 6.2% $5,347 California 2.7% $2,307Alabama 4.3% $3,656 Delaware 2.7% $2,338Mississippi 4.3% $3,699 Indiana 2.7% $2,301Tennessee 4.3% $3,713 Michigan 2.7% $2,299Arkansas 3.9% $3,314 New York 2.7% $2,283South Carolina 3.8% $3,248 West Virginia 2.7% $2,273Louisiana 3.6% $3,086 Illinois 2.6% $2,219Oklahoma 3.6% $3,062 Iowa 2.6% $2,184D.C. 3.5% $3,052 Montana 2.6% $2,177Georgia 3.5% $3,016 Nevada 2.6% $2,202Texas 3.5% $3,024 Pennsylvania 2.6% $2,189Idaho 3.4% $2,949 Washington 2.6% $2,226North Carolina 3.4% $2,938 Colorado 2.5% $2,111South Dakota 3.4% $2,864 Minnesota 2.5% $2,172Florida 3.2% $2,723 Ohio 2.5% $2,114Maryland 3.1% $2,678 Oregon 2.5% $2,127Kansas 3.0% $2,532 Hawaii 2.4% $2,096Wyoming 3.0% $2,599 New Jersey 2.4% $2,110Kentucky 2.9% $2,487 Wisconsin 2.1% $1,798Nebraska 2.9% $2,481 Connecticut 2.0% $1,740Alaska 2.8% $2,408 Maine 2.0% $1,677Arizona 2.8% $2,380 Rhode Island 2.0% $1,709Missouri 2.8% $2,361 Vermont 1.9% $1,611New Mexico 2.8% $2,413 Massachusetts 1.8% $1,591North Dakota 2.8% $2,421 New Hampshire 1.8% $1,536Virginia 2.8% $2,451 U.S. average 2.8% $2,423
*Taxpayers earning $75,000-$100,000 Ref.: Chronicle of Philanthropy, 8-8-02
9
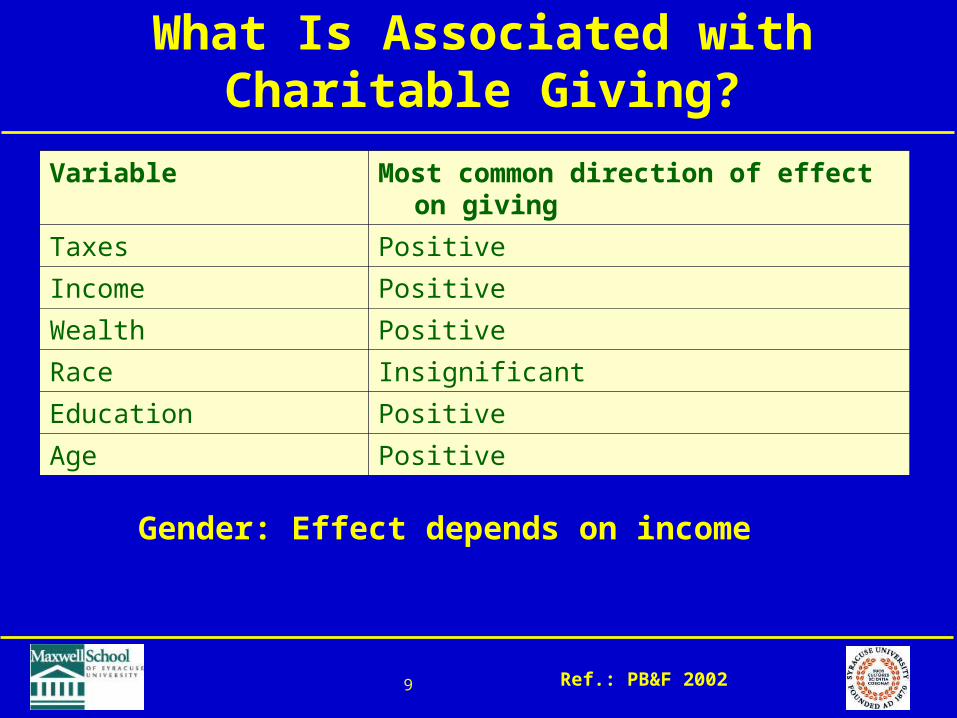
What Is Associated with Charitable Giving?
Ref.: PB&F 2002
Gender: Effect depends on income
Variable Most common direction of effect on giving
Taxes Positive
Income Positive
Wealth Positive
Race Insignificant
Education Positive
Age Positive
10
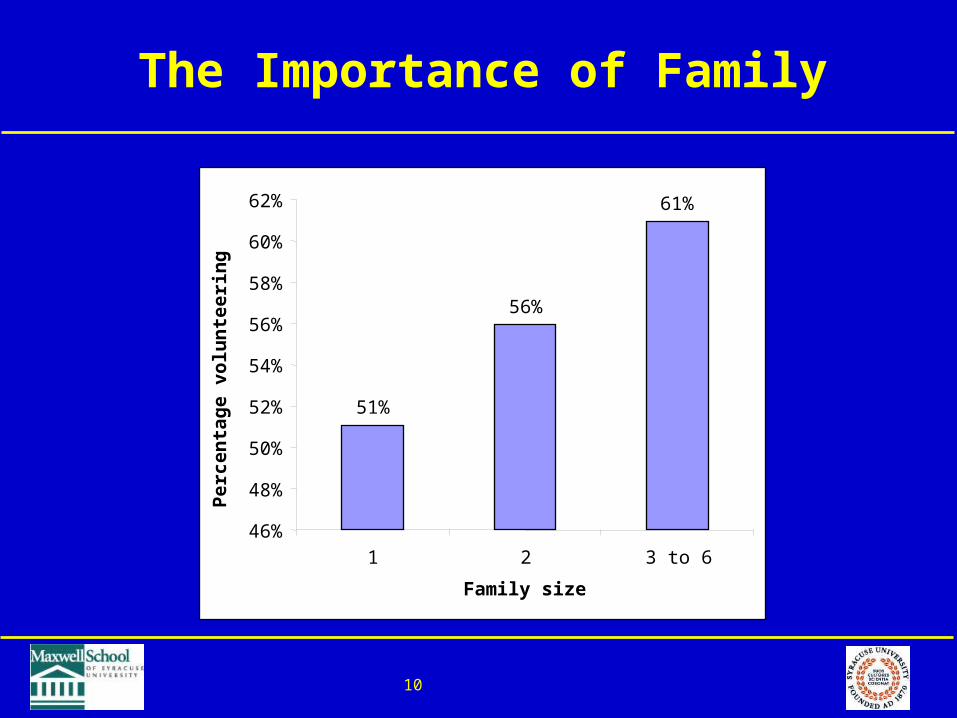
The Importance of Family
51%
56%
61%
46%
48%
50%
52%
54%
56%
58%
60%
62%
1 2 3 to 6
Family size
Per
cen
tag
e vo
lun
teer
ing
11
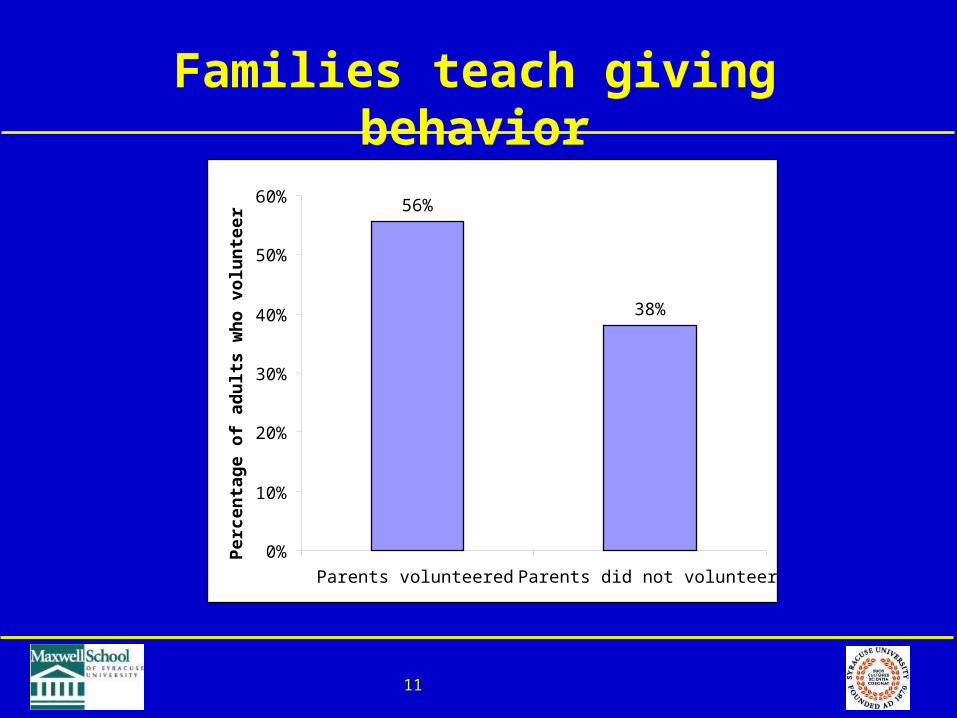
Families teach giving behavior
56%
38%
0%
10%
20%
30%
40%
50%
60%
Parents volunteered Parents did not volunteer
Per
cen
tag
e o
f ad
ult
s w
ho
vo
lun
teer
12
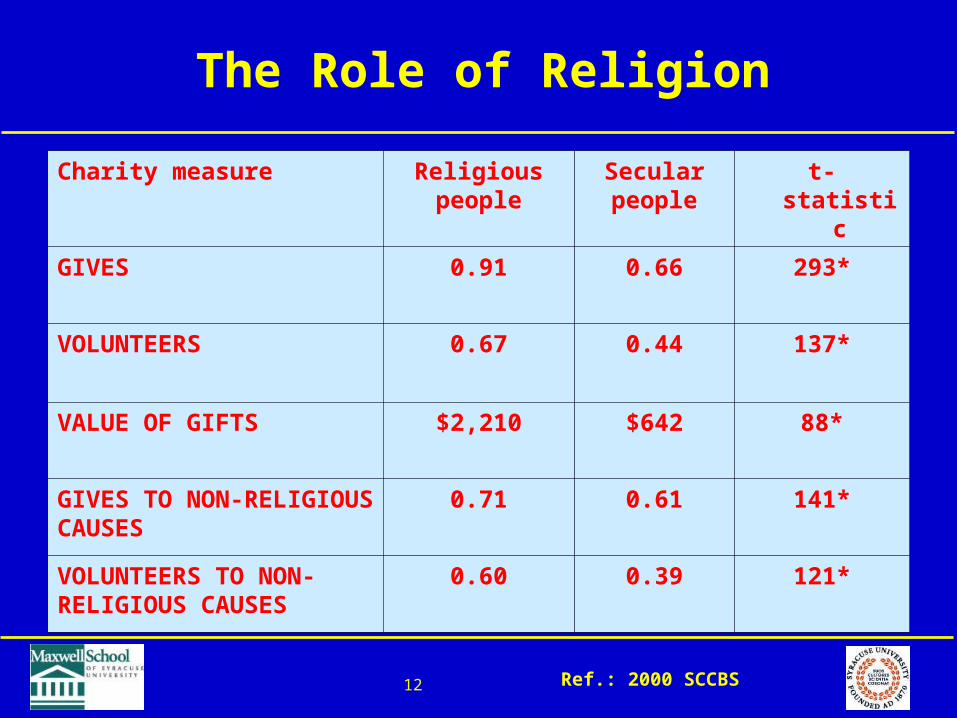
The Role of Religion
Charity measure Religious people
Secular people
t-statistic
GIVES 0.91 0.66 293*
VOLUNTEERS 0.67 0.44 137*
VALUE OF GIFTS $2,210 $642 88*
GIVES TO NON-RELIGIOUS CAUSES
0.71 0.61 141*
VOLUNTEERS TO NON-RELIGIOUS CAUSES
0.60 0.39 121*
Ref.: 2000 SCCBS
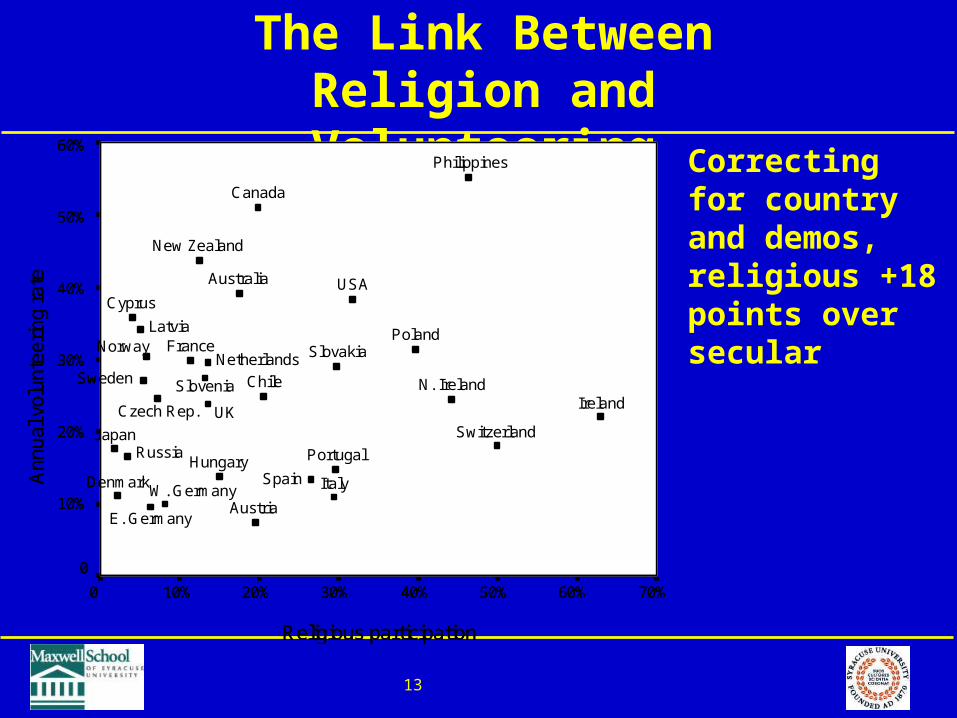
13
The Link BetweenReligion and Volunteering Correcting for
country and demos, religious +18 points over secular
Religious participation
70%60%50%40%30%20%10%0
Ann
ual v
olu
nte
erin
g ra
te
60%
50%
40%
30%
20%
10%
0
Switzerland
Denmark
Chile
Portugal
Cyprus
France Slovakia
Latvia
Spain
Japan
Philippines
Canada
New Zealand
Russia
Poland
Slovenia
Czech Rep.
Sweden
NorwayNetherlands
Ireland
ItalyHungary
Austria
USA
N. Ireland
UK
E. Germany
W. Germany
Australia
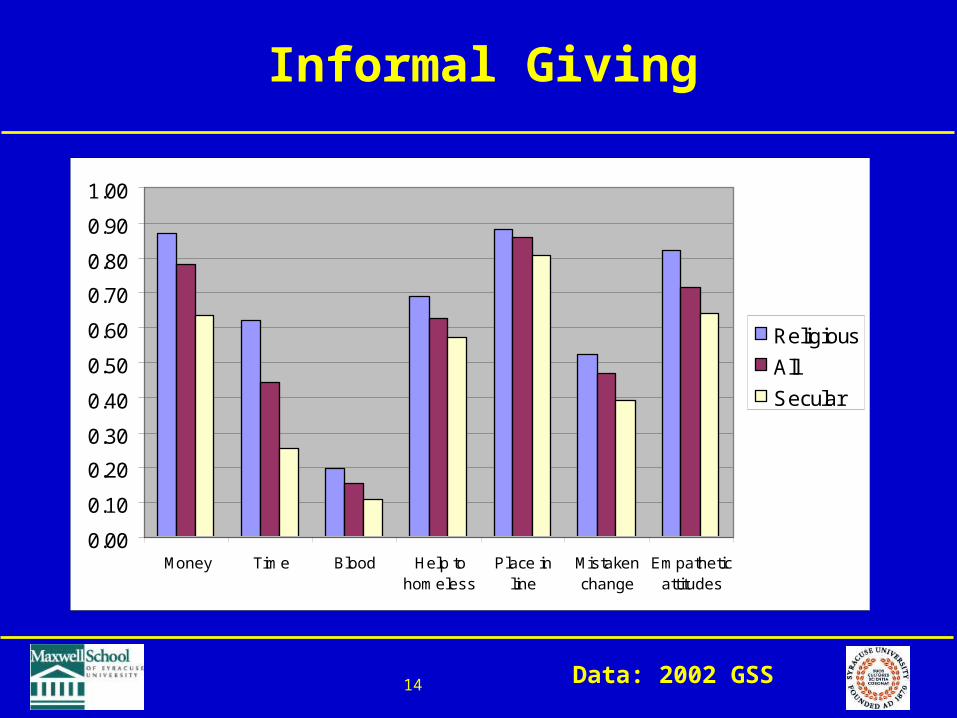
14
Informal Giving
0.00
0.10
0.20
0.30
0.40
0.50
0.60
0.70
0.80
0.90
1.00
Money Time Blood Help tohomeless
Place inline
Mistakenchange
Empatheticattitudes
Religious
All
Secular
Data: 2002 GSS
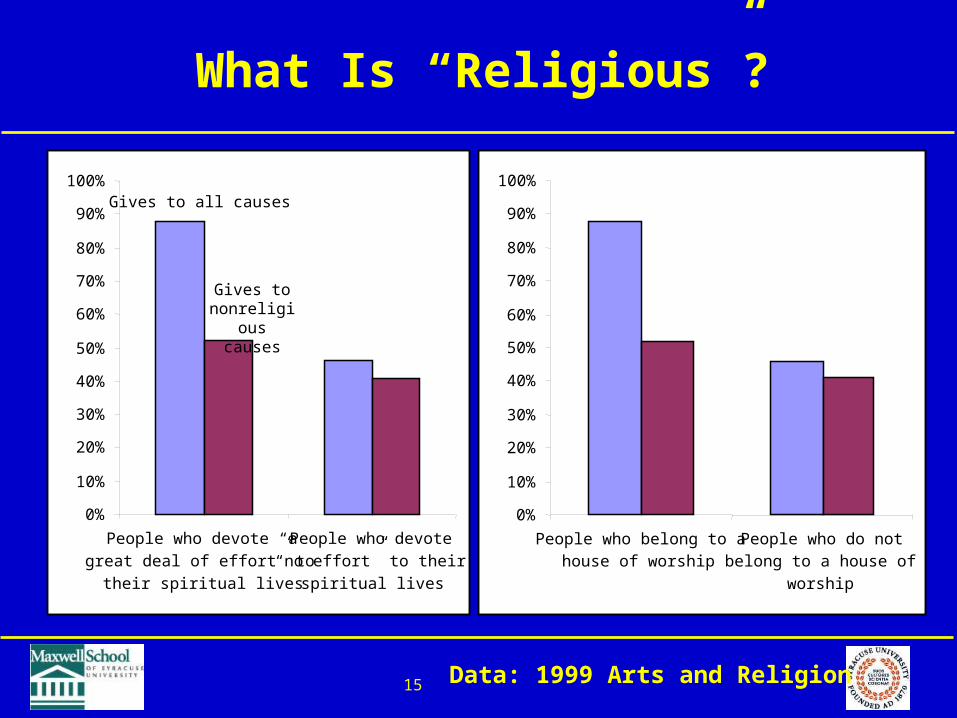
15
What Is “Religious”?
0%
10%
20%
30%
40%
50%
60%
70%
80%
90%
100%
People who devote “a
great deal of effort” to
their spiritual lives
People who devote
“no effort” to their
spiritual lives
Gives to all causes
Gives to nonreligious
causes
0%
10%
20%
30%
40%
50%
60%
70%
80%
90%
100%
People who belong to ahouse of worship
People who do notbelong to a house of
worship
Data: 1999 Arts and Religion
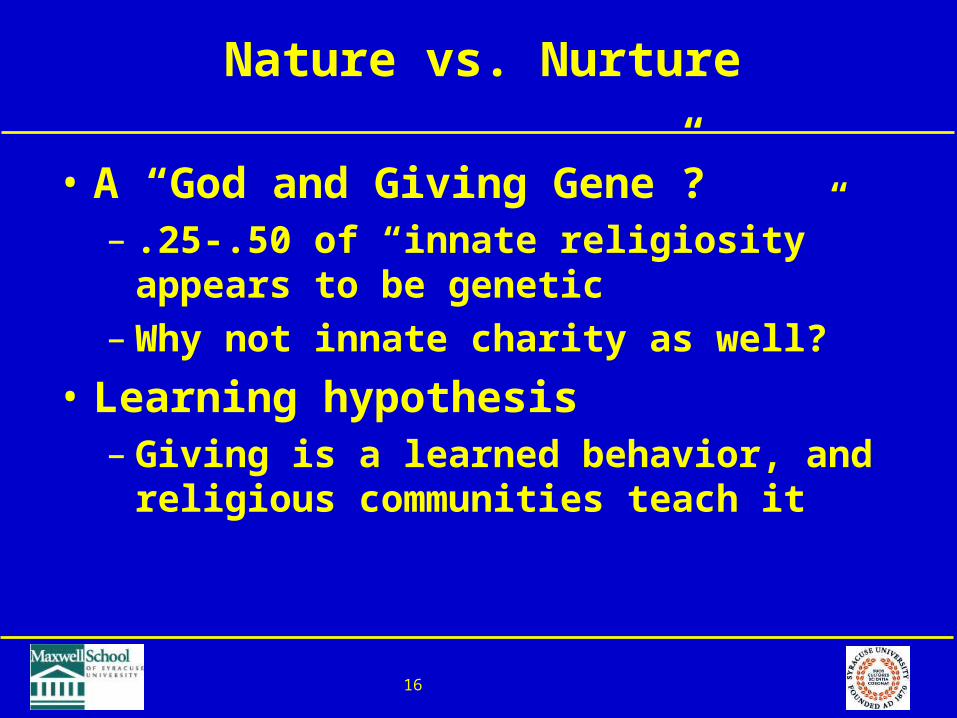
16
Nature vs. Nurture
• A “God and Giving Gene”?– .25-.50 of “innate religiosity”
appears to be genetic– Why not innate charity as well?
• Learning hypothesis– Giving is a learned behavior, and
religious communities teach it

17
Evidence in Favor of Learning
Frequency of church attendance as a child
Percentage of secularist adults who donate to
charitySecular charities
only
Every week 47% 40%
Almost every week 41% 37%
A few times a year 35% 32%
Never 26% 29%
Data: 1999 Arts and Religion
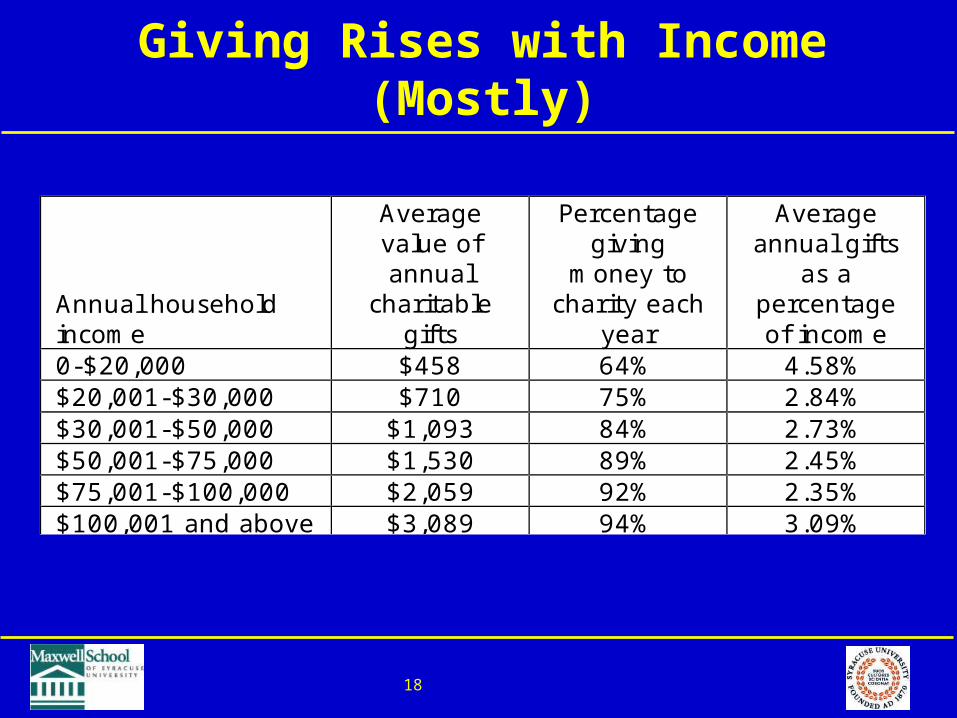
18
Giving Rises with Income (Mostly)
Annual household income
Average value of annual
charitable gifts
Percentage giving
money to charity each
year
Average annual gifts
as a percentage of income
0-$20,000 $458 64% 4.58% $20,001-$30,000 $710 75% 2.84% $30,001-$50,000 $1,093 84% 2.73% $50,001-$75,000 $1,530 89% 2.45% $75,001-$100,000 $2,059 92% 2.35% $100,001 and above $3,089 94% 3.09%
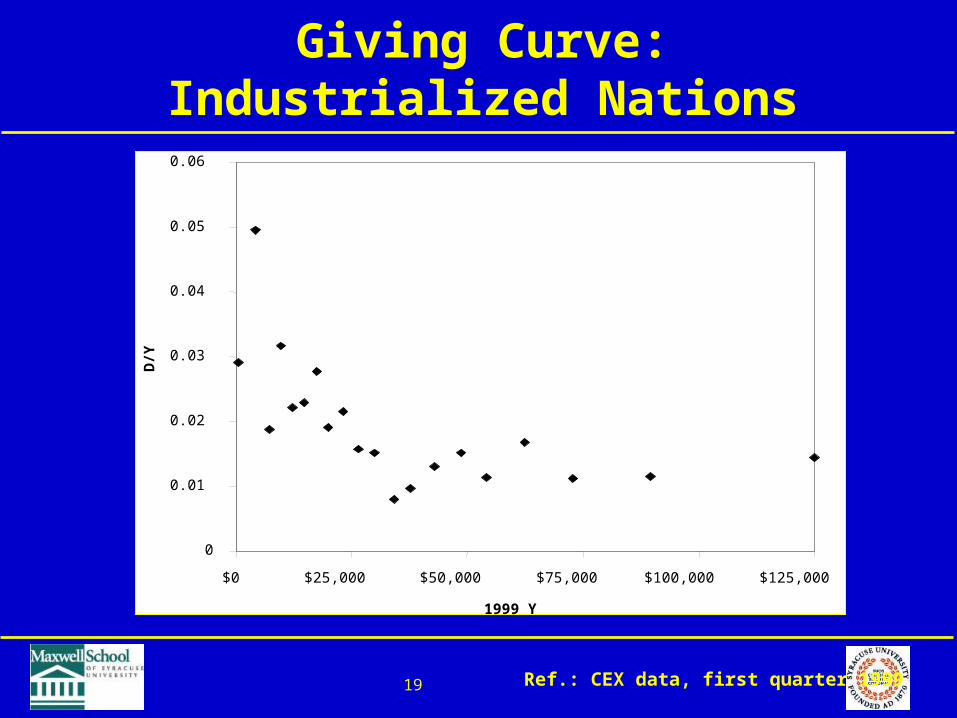
19
Giving Curve:Industrialized Nations
0
0.01
0.02
0.03
0.04
0.05
0.06
$0 $25,000 $50,000 $75,000 $100,000 $125,000
1999 Y
D/Y
Ref.: CEX data, first quarter 1999
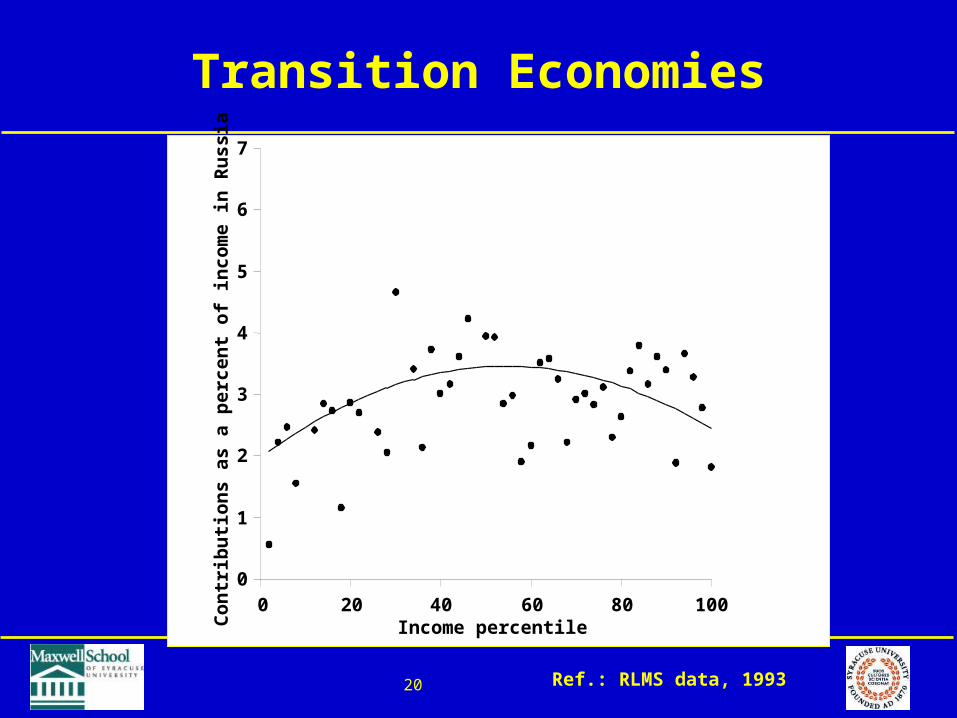
20
Transition Economies
Income percentile
Con
trib
uti
on
s a
s a
perc
en
t of
incom
e in
Ru
ssia
0
1
2
3
4
5
6
7
0 20 40 60 80 100
Ref.: RLMS data, 1993
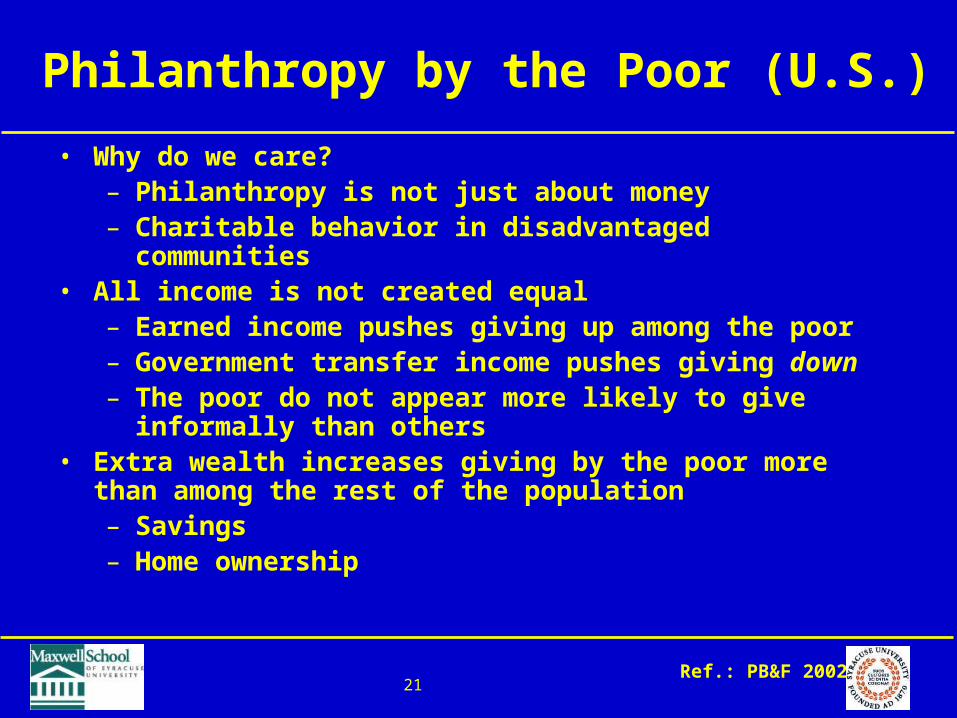
21
Philanthropy by the Poor (U.S.)
• Why do we care?– Philanthropy is not just about money– Charitable behavior in disadvantaged
communities• All income is not created equal
– Earned income pushes giving up among the poor– Government transfer income pushes giving down– The poor do not appear more likely to give
informally than others• Extra wealth increases giving by the poor more than
among the rest of the population– Savings– Home ownership
Ref.: PB&F 2002
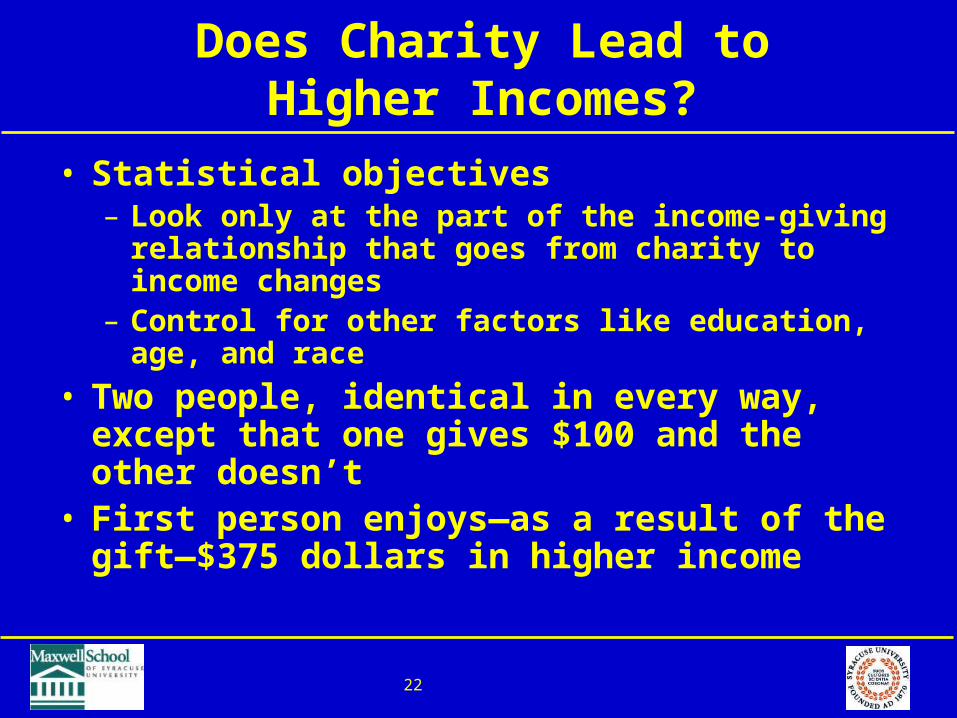
22
Does Charity Lead to Higher Incomes?
• Statistical objectives– Look only at the part of the income-giving
relationship that goes from charity to income changes
– Control for other factors like education, age, and race
• Two people, identical in every way, except that one gives $100 and the other doesn’t
• First person enjoys—as a result of the gift—$375 dollars in higher income
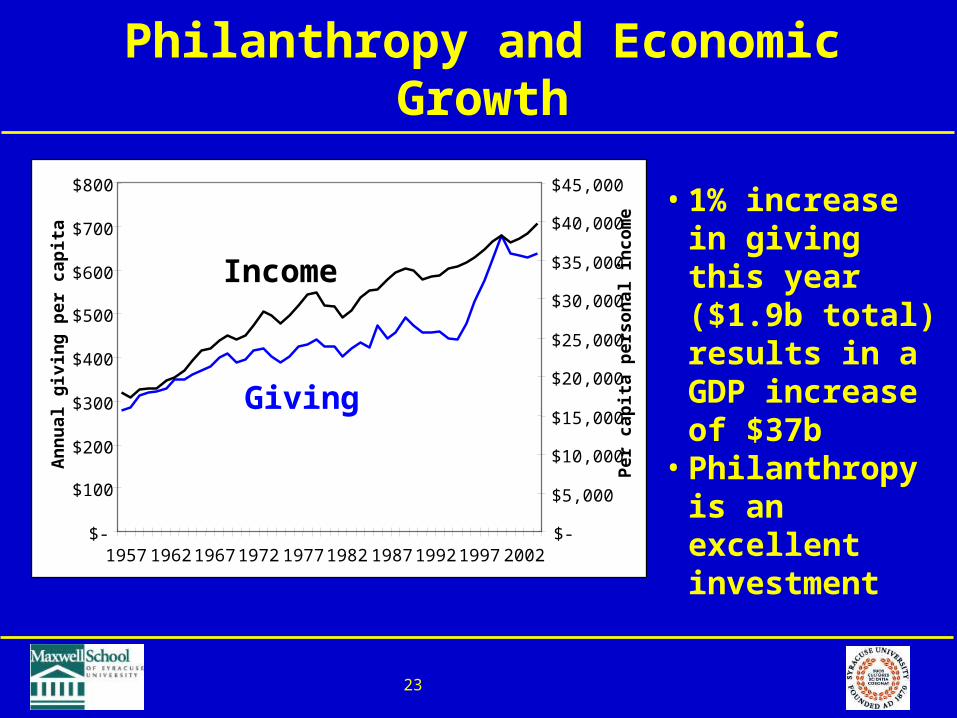
23
Philanthropy and Economic Growth
$-
$100
$200
$300
$400
$500
$600
$700
$800
1957 1962 1967 1972 1977 1982 1987 1992 1997 2002
An
nu
al g
ivin
g p
er c
apit
a
$-
$5,000
$10,000
$15,000
$20,000
$25,000
$30,000
$35,000
$40,000
$45,000
Per
cap
ita
per
son
al in
com
e
Giving
Income
• 1% increase in giving this year ($1.9b total) results in a GDP increase of $37b
• Philanthropy is an excellent investment

24
Givers are much happier than nongivers
• Why?– Our brains are wired to serve– Approval of our peers– Improved control– Better health– Better citizenship
25
Outline
• Individual giving• Giving innovations and
institutional philanthropy

26
“New Philanthropy”
• New philanthropists appear different from their predecessors– Younger wealthy give less than older wealthy, on
average– New wealth comes from new sources– New philanthropy tends to be more “hands-on” and
entrepreneurial– Relatively little geographical bounding
Ref.: Brown 2000
U.S. Silicon Valley, CA (1998) Belongs to a work-related organization 16% 52% Belongs to a religious organization 70% 26% Gives to religious organizations 48% 37% Gives to education organizations 20% 36% Gives to human-service organizations 25% 18%
27
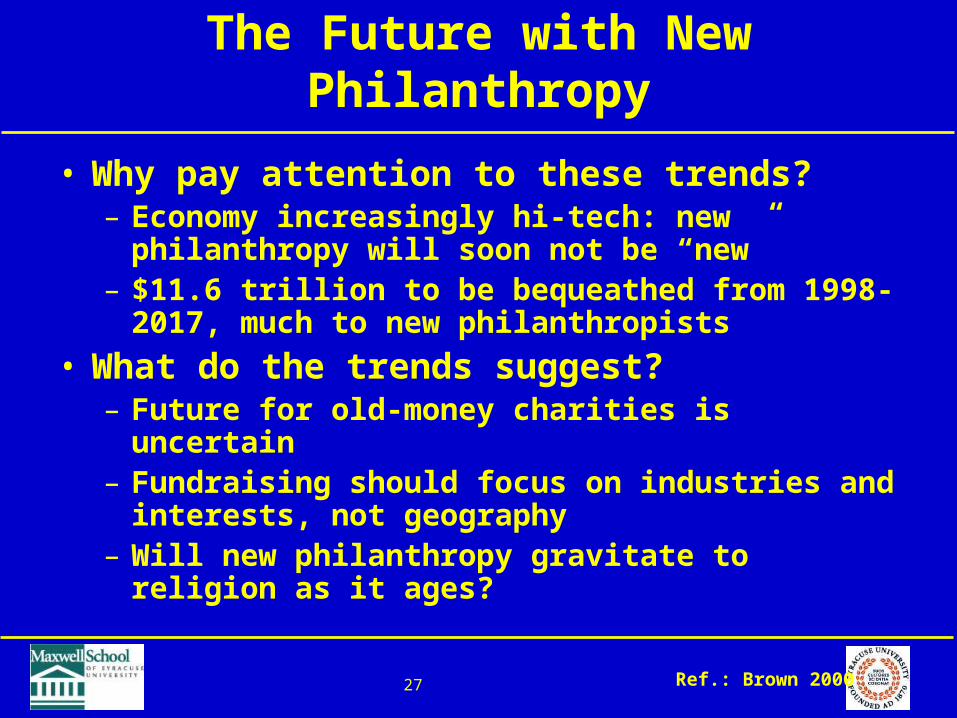
The Future with New Philanthropy
• Why pay attention to these trends?– Economy increasingly hi-tech: new
philanthropy will soon not be “new”– $11.6 trillion to be bequeathed from 1998-
2017, much to new philanthropists
• What do the trends suggest?– Future for old-money charities is uncertain– Fundraising should focus on industries and
interests, not geography– Will new philanthropy gravitate to religion
as it ages?
Ref.: Brown 2000
28
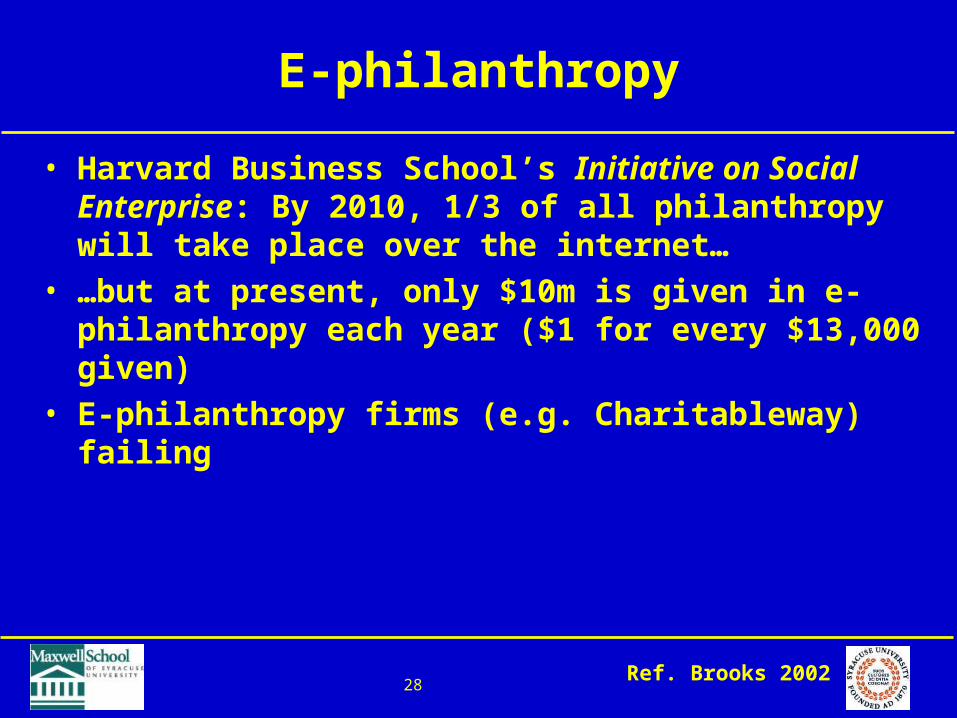
E-philanthropy
• Harvard Business School’s Initiative on Social Enterprise: By 2010, 1/3 of all philanthropy will take place over the internet…
• …but at present, only $10m is given in e-philanthropy each year ($1 for every $13,000 given)
• E-philanthropy firms (e.g. Charitableway) failing
Ref. Brooks 2002
29
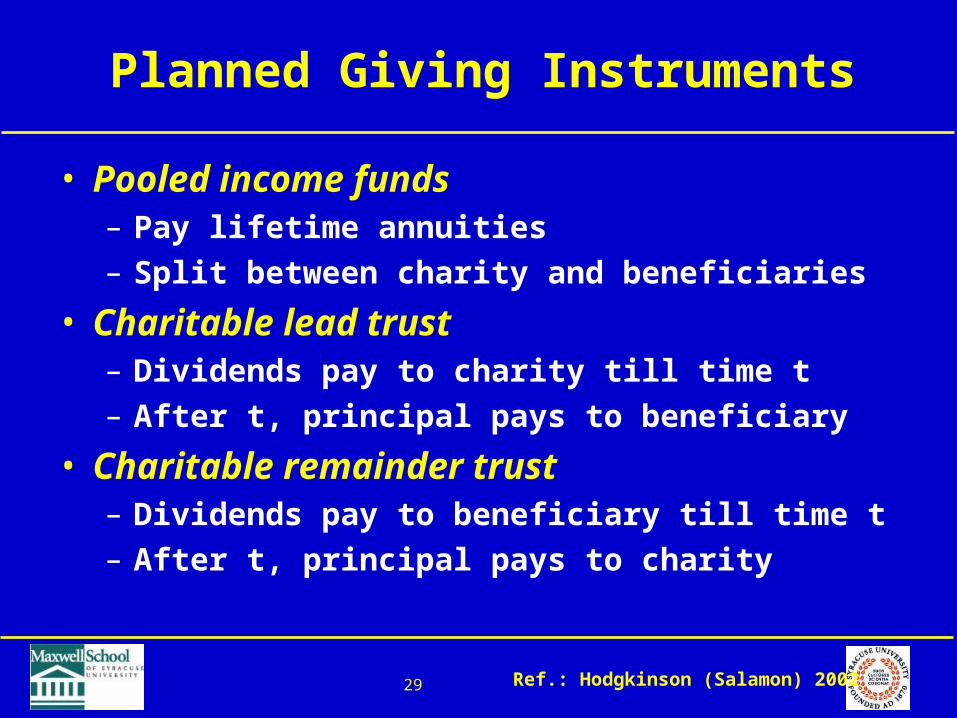
Planned Giving Instruments
• Pooled income funds– Pay lifetime annuities– Split between charity and beneficiaries
• Charitable lead trust– Dividends pay to charity till time t– After t, principal pays to beneficiary
• Charitable remainder trust– Dividends pay to beneficiary till time t– After t, principal pays to charity
Ref.: Hodgkinson (Salamon) 2002
30
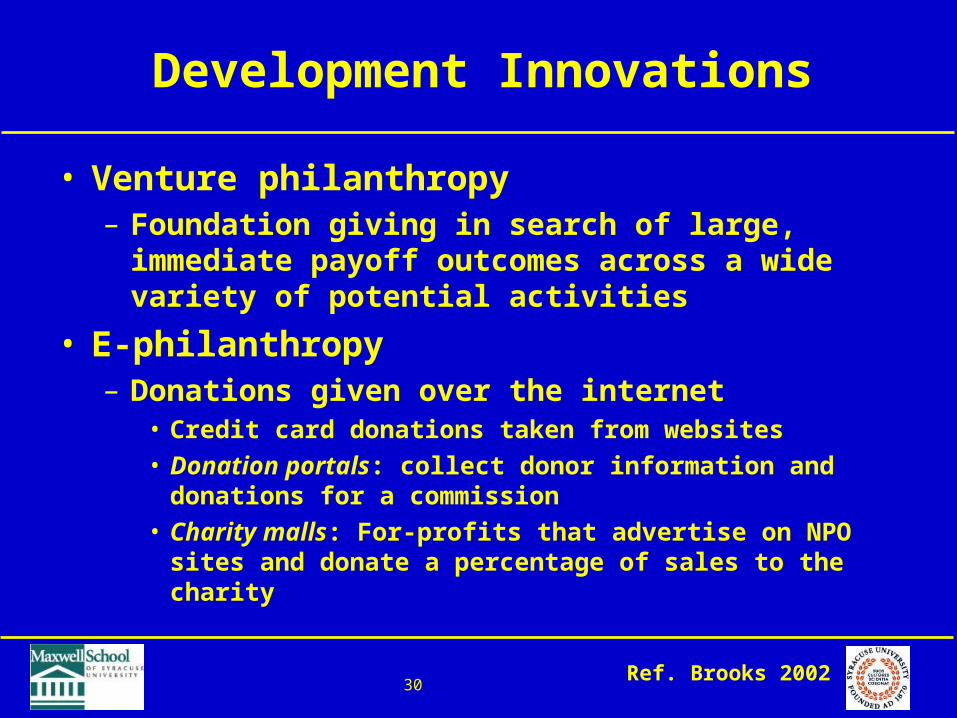
Development Innovations
• Venture philanthropy– Foundation giving in search of large,
immediate payoff outcomes across a wide variety of potential activities
• E-philanthropy– Donations given over the internet
• Credit card donations taken from websites• Donation portals: collect donor information and
donations for a commission• Charity malls: For-profits that advertise on NPO
sites and donate a percentage of sales to the charity
Ref. Brooks 2002
31
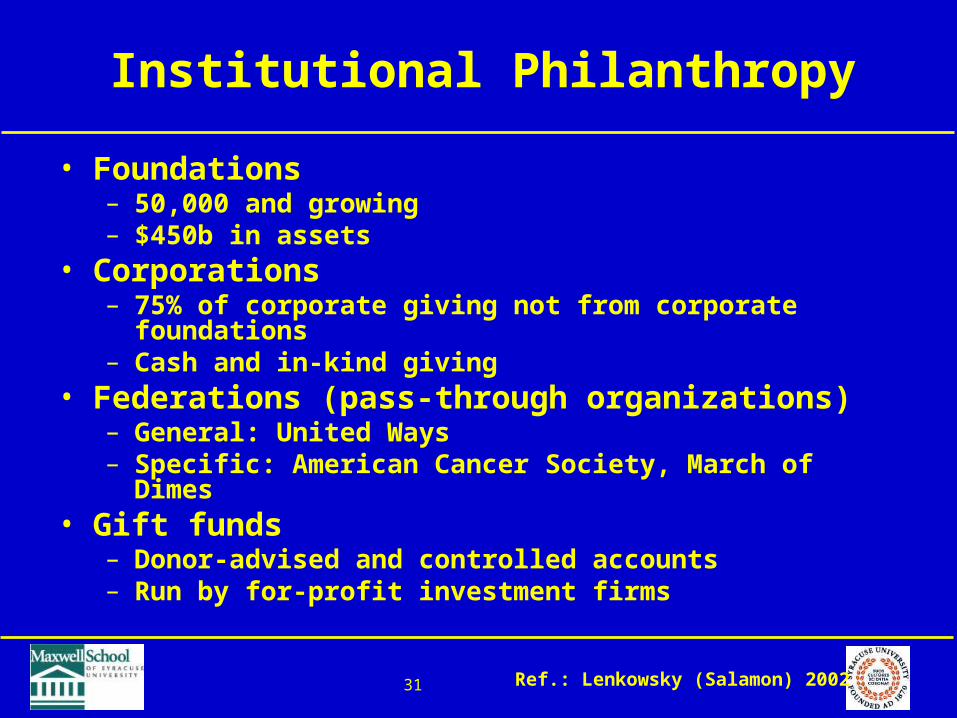
Institutional Philanthropy
• Foundations– 50,000 and growing– $450b in assets
• Corporations– 75% of corporate giving not from corporate
foundations– Cash and in-kind giving
• Federations (pass-through organizations)– General: United Ways– Specific: American Cancer Society, March of Dimes
• Gift funds– Donor-advised and controlled accounts– Run by for-profit investment firms
Ref.: Lenkowsky (Salamon) 2002
32
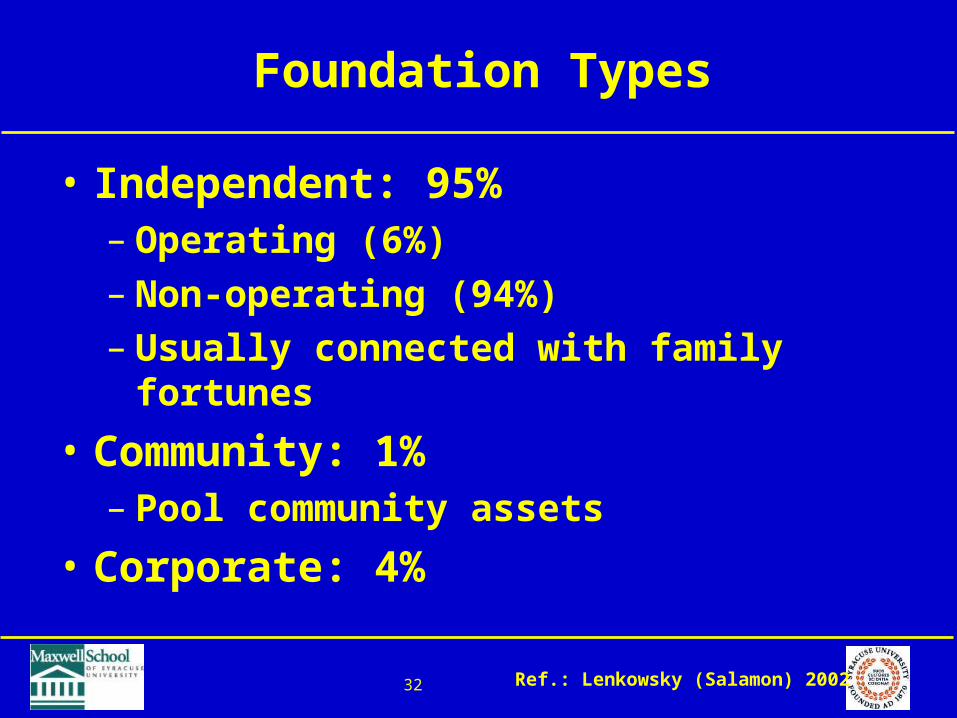
Foundation Types
• Independent: 95%– Operating (6%)– Non-operating (94%)– Usually connected with family
fortunes
• Community: 1%– Pool community assets
• Corporate: 4%
Ref.: Lenkowsky (Salamon) 2002
33
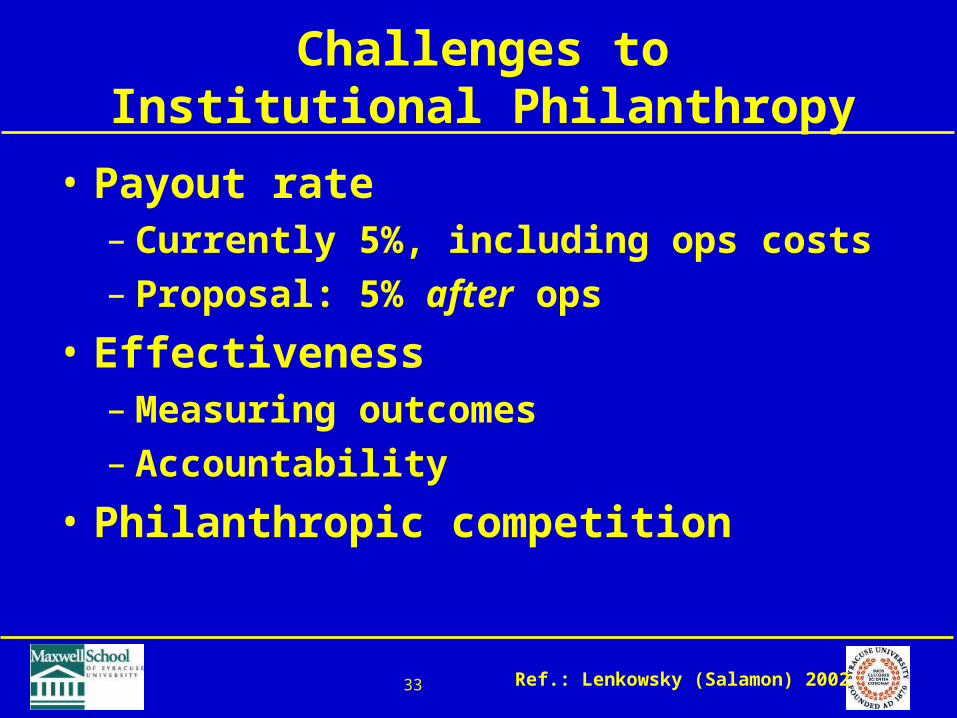
Challenges to Institutional Philanthropy
• Payout rate– Currently 5%, including ops costs– Proposal: 5% after ops
• Effectiveness– Measuring outcomes– Accountability
• Philanthropic competition
Ref.: Lenkowsky (Salamon) 2002