Embed Size (px)
Citation preview

1
PASBO ANNUAL CONFERENCEPASBO ANNUAL CONFERENCE
Pittsburgh, PAPittsburgh, PA
March 12-16, 2007March 12-16, 2007
Financing Pennsylvania School Projects Under the Taxpayer Relief ActFinancing Pennsylvania School Projects Under the Taxpayer Relief Act
(Act 1 of the Special Session of 2006)(Act 1 of the Special Session of 2006)
Kenneth A. PhillipsRBC Capital Markets
Lancaster, PA(717)519-6001
Paul A. Lundeen, EsquireRhoads & Sinon LLP
Harrisburg, PA(717)231-6004
Beth A. EwingJanney Montgomery Scott LLC
Pittsburgh, PA(724)770-0232

2
Table of ContentTable of Content
Section I Overview of the District’s Current Debt Profile
Section II Referendum Exception Worksheet Examples
Section III “60% Test” Calculation Example
Section IV Overview of Electoral Debt

3
Section I
Overview of the District’s Current Debt Profile

4
under mgmt are municipal holdings
- 170 institutional salespeople
in 19 offices
- 135 Underwriters & Traders
- 26 Research Analysts
- 102 Support Personnel
SALES & TRADING
(2)
As of (1) Del Val (3) (4) (5) (6)
Fiscal Year 2001 2002 2002 A 2003 2005 2005 AEnding June 30 G.O. Bonds G.O. Bonds G.O. Bonds G.O. Bonds G.O. Bonds G.O. Bonds Total
2007 972,190 828,395 798,500 1,070,870 379,370 724,058 4,773,383
2008 972,990 831,843 799,613 1,064,070 378,070 734,708 4,781,293
2009 976,500 835,398 798,363 1,064,520 376,400 733,583 4,784,763
2010 838,018 795,708 1,067,335 379,350 734,933 3,815,343
2011 841,703 798,708 726,828 381,755 735,833 3,484,825
2012 845,368 800,708 733,703 378,468 733,858 3,492,103
2013 849,970 796,708 728,435 384,628 732,608 3,492,348
2014 853,425 795,668 732,045 384,865 738,145 3,504,148
2015 857,733 798,578 728,825 384,463 738,798 3,508,395
2016 862,808 800,228 729,220 388,400 738,175 3,518,830
2017 867,565 800,265 338,000 391,000 736,238 3,133,0682018 872,963 798,660 388,000 737,643 2,797,2652019 877,915 391,250 737,443 2,006,6082020 883,380 388,500 731,243 2,003,1232021 889,273 733,905 1,623,1782022 895,508 895,5082023 02024 0
Total 2,921,680 13,731,260 9,581,703 8,983,850 5,374,518 11,021,165 51,614,175
(1) Series of 2001 Average Remaining Coupon 4.56%.
(2) Series of 2002 Del Val VRDB bonds @ budgeted rate of 4.25%. (3.75% Coupon + 50Bps fees) Per administration 6/15/2006
(3) Series of 2002A Average Remaining Coupon 4.16%.
(4) Series of 2003 Average Remaining Coupon 3.40%.
(5) Series of 2005 Average Remaining Coupon 3.86%.
(6) Series of 2005A Average Remaining Coupon 4.23%.
as of July 1, 2006
XYZ School DistrictGross Debt Outstanding
The District’s Debt ProfileThe District’s Debt Profile

5
(2)As of (1) Del Val (3) (4) (5) (6)
Fiscal Year 2001 2002 2002 A 2003 2005 2005 AEnding June 30 G.O. Bonds G.O. Bonds G.O. Bonds G.O. Bonds G.O. Bonds G.O. Bonds Total
2007 727,198 737,272 681,679 875,008 379,370 449,640 3,850,167
2008 727,797 740,340 682,629 869,452 378,070 456,253 3,854,540
2009 730,422 743,504 681,562 869,819 376,400 455,555 3,857,262
2010 0 745,836 679,295 872,119 379,350 456,393 3,132,994
2011 0 749,115 681,857 593,891 381,755 456,952 2,863,570
2012 0 752,377 683,564 599,508 378,468 455,726 2,869,642
2013 0 756,473 680,149 595,204 384,628 454,949 2,871,403
2014 0 759,548 679,261 598,154 384,865 458,388 2,880,217
2015 0 763,382 681,746 595,523 384,463 458,793 2,883,906
2016 0 767,899 683,154 595,846 388,400 458,407 2,893,705
2017 0 772,133 683,186 276,180 391,000 457,203 2,579,7022018 0 776,937 681,816 0 388,000 458,076 2,304,8292019 0 781,344 0 0 391,250 457,952 1,630,5462020 0 786,208 0 0 388,500 454,102 1,628,8102021 0 791,453 0 0 0 455,755 1,247,2082022 0 797,002 0 0 0 0 797,0022023 0 0 0 0 0 0 02024 0 0 0 0 0 0 0
Total 2,185,417 12,220,821 8,179,899 7,340,704 5,374,518 6,844,143 42,145,502
(1) Project Reimbursement 52.99% x 2006-07 MVAR 47.55%. Local Effort 74.80% State Effort 25.20%(2) Project Reimbursement 36.80% x 2006-07 MVAR 47.55%. Local Effort 82.50% State Effort 17.50% (Authority Annual Fee Non-reimburseable. Net Effective Reimbursement approximately 89.00%)(3) Project Reimbursement 30.76% x 2006-07 MVAR 47.55%. Local Effort 85.37% State Effort 14.63%(4) Project Reimbursement 38.46% x 2006-07 MVAR 47.55%. Local Effort 81.71% State Effort 18.29%(5) No Project Reimbursement(6) Project Reimbursement 79.71% x 2006-07 MVAR 47.55%. Local Effort 62.10% State Effort 37.90%
as of July 1, 2006
XYZ School DistrictNet Debt Outstanding
The District’s Debt ProfileThe District’s Debt Profile

6
XYZ School District
Millage Requirement Study
Prior 2009 Net Debt Project Less: Total Total Total Budget
Outstanding $21,390,000 Interest Net Value of Mills Equivalent Mills in Dollars SurplusDate D/S (1) LE=85%(2) Earnings Debt 1 Mill Required Mills Place (3) Appropriated (Deficit)
2007 3,807,282 0 3,807,282 1,166,000 3.27 0.00 3.28 3,824,480 17,1982008 3,811,492 0 3,811,492 1,166,000 3.27 0.00 3.28 3,824,480 12,9882009 3,814,195 0 3,814,195 1,166,000 3.27 0.00 3.28 3,824,480 10,2852010 3,102,588 479,751 3,582,340 1,166,000 3.07 0.00 3.28 3,824,480 242,1402011 2,836,325 993,503 3,829,828 1,166,000 3.28 0.00 3.28 3,830,193 3662012 2,842,357 979,203 3,821,559 1,166,000 3.28 0.00 3.28 3,824,480 2,9212013 2,844,222 978,225 3,822,447 1,166,000 3.28 0.00 3.28 3,824,480 2,0332014 2,852,900 968,735 3,821,635 1,166,000 3.28 0.00 3.28 3,824,480 2,8452015 2,856,585 963,883 3,820,468 1,166,000 3.28 0.00 3.28 3,824,480 4,0122016 2,866,381 959,228 3,825,608 1,166,000 3.28 0.00 3.28 3,825,611 32017 2,556,093 1,265,022 3,821,115 1,166,000 3.28 0.00 3.28 3,824,480 3,3652018 2,284,381 1,538,727 3,823,108 1,166,000 3.28 0.00 3.28 3,824,480 1,3722019 1,616,092 2,205,465 3,821,557 1,166,000 3.28 0.00 3.28 3,824,480 2,9232020 1,614,477 2,206,967 3,821,445 1,166,000 3.28 0.00 3.28 3,824,480 3,0352021 1,232,823 2,590,503 3,823,326 1,166,000 3.28 0.00 3.28 3,824,480 1,1542022 797,002 3,026,256 3,823,258 1,166,000 3.28 0.00 3.28 3,824,480 1,2222023 0 3,824,413 3,824,413 1,166,000 3.28 0.00 3.28 3,824,480 672024 0 3,820,643 3,820,643 1,166,000 3.28 0.00 3.28 3,824,480 3,8372025 0 3,819,563 3,819,563 1,166,000 3.28 0.00 3.28 3,824,480 4,917
TOTAL 41,735,195 30,620,087 0 72,355,281 0.00
(1) Net annual debt service for Series 2001, Del. Val. 2002, 2002A, 2003, 2005 and 2005A G.O. Bonds. (2) Proposed Series of 2009, $21,390,000 Dated July 1, 2009. (Wrap Financing) Average Coupon 5.29% (Current Rates + 100 Bps.). Local Effort 85% (3) Includes mills put in place for original Series 2001A, Del. Val. 2002, 2002A, 2003, 2005 and 2005A G.O. Bonds.
The District’s Debt Profile with New, Non-Grandfathered The District’s Debt Profile with New, Non-Grandfathered DebtDebt

7
Section II
Referendum Exception Worksheets- “Grandfathered Debt”

8
(a.1) Bond issue, note or loan and Year Issued 2002A 1998 2005 2005A 2006 Total(a.2) Original or Refinancing Refunding Orig/Refund Original Refunding Refunding
(a.3) If Refinancing on a.2, list bond issue, note or loan refinanced 06/18/05 1996/97 1997/1999 06/23/05
(b) PDE lease number for line a.1 (if applicable) 022062 2062/2306/2308 052742
(c) Bond issue/note/loan principal amount for line a.1 $8,010,000 $18,125,000 $50,000,000 $17,815,000 $7,105,000 $101,055,000
(d) Date line a.1 incurred (mm/dd/yy)
1. Latest date before effective date 09/05/02 12/07/98 08/19/04 01/20/05 03/01/06 2. Earliest date on or after effective date
(e) Date line a.1 issued (mm/dd/yy) 10/01/02 12/30/98 10/27/05 02/22/05 04/18/06
(f) Principal for line a.1 incurred before effective date as % of Total
1. Principal incurred before effective date $8,010,000 $18,125,000 $50,000,000 $17,815,000 $7,105,000 2. Principal incurred on or after effective date 3. Total principal incurred (f .1 + f .2) $8,010,000 $18,125,000 $50,000,000 $17,815,000 $7,105,000 $0 4. Funds on line f.1 as percent of Total (f .1 ÷ f .3) 100.00% 100.00% 100.00% 100.00% 100.00% 0.00%
(g) Refinanced indebtedness incurred before effective date
1. Principal refinanced on indebtedness incurred before effective date $7,710,000 $12,990,000 $18,420,000 $6,700,000 2. Principal refinanced on indebtedness incurred on or after effective date 3. Total indebtedness refinanced (g.1 + g.2) $7,710,000 $12,990,000 $0 $18,420,000 $6,700,000 $0 4. Refinanced indebtedness incurred before effective date as % of total (g.1 ÷ g.3) 100.00% 100.00% 0.00% 100.00% 100.00% 0.00%
(h) Proceeds used to fund capital projects and to refinance outstanding bond issues.Do not include issuance costs. 1. Escrow, remarketing or call requirement for refinancing $7,882,500 $2,997,808 $18,420,000 2. Deposit to construction fund (new money for reimbursable and non-reimbursable projects) $49,417,270 3. Total - refinancing and new money (h.1 + h.2) $7,882,500 $2,997,808 $49,417,270 $18,420,000 $0 $0 4. Refinancing requirements as % of total (h.1 ÷ h.3) 100.00% 100.00% 0.00% 100.00% 0.00% 0.00%
(i) Principal on indebtedness incurred after effective date as % of total xRefinanced indebtedness incurred before effective date as % of total xRefinancing requirements as % of total ((1 - f .4) * g.4 * h.4)
0.00% 0.00% 0.00% 0.00% 0.00% 0.00%
(j) Percentage assigned to indebtedness incurred before effective date (f .4 + i) 100.00% 100.00% 100.00% 100.00% 100.00% 0.00%
School Construction: Indebtedness Incurred Prior to Effective DateReferendum Exception Worksheet for Budget Year 2007-2008
333(f)(2)(iii)(A)
XYZ School District
I. LIST ALL ISSUES, NOTES AND LOANS WITH ANY INDEBTEDNESS INCURRED BEFORE EFFECTIVE DATE (as follows) :
II. LIST ALL REFINANCING ISSUES, NOTES AND LOANS INCURRED ON OR AFTER THE EFFECTIVE DATE THAT REFINANCED ANY ISSUES, NOTES AND LOANS WITH ANY INDEBTEDNESS INCURRED BEFORE THE EFFECTIVE DATE
Act 72 School Districts: September 4, 2004All Other School Districts: June 27, 2006
Referendum Exception Worksheet ExampleReferendum Exception Worksheet Example

9
Bond issue, note or loan and Year Issued 2002A 1998 2005 2005A 2006 Total
(k) 2006-2007 total principal and interest payments * $1,053,698 $2,060,958 $3,241,033 $1,596,318 $288,635 $8,240,642
(l) Reimbursable percentage (if applicable) 0.5927 0.4740 0.2549 0.4617
(m) Applicable aid ratio (greater of MV AR, CARF or Density) 0.6091 0.6091 0.6091 0.6091 0.6091 0.6091
(n) Estimated state share (k * l * m) $380,399 $595,026 $0 $247,844 $81,170 $0 $1,304,439
(o) Local share attributable to pre-effective date debt ((k - n) * j) $673,299 $1,465,932 $3,241,033 $1,348,474 $207,465 $0 $6,936,203
(p) Total nonrecurring revenue applied to 2006-2007 debt service payments $1,700,000 $1,700,000
(q) Estimated local share of 2006-2007 payments from recurring revenues (o - p) $673,299 $1,465,932 $1,541,033 $1,348,474 $207,465 $0 $5,236,203
(r) 2007-2008 total principal and interest payments * $1,056,988 $2,056,800 $3,740,043 $1,595,318 $303,465 $8,752,614
(s) Reimbursable percentage (if applicable) 0.5927 0.4740 0.2549 0.4617
(t) Applicable aid ratio (greater of MV AR, CARF or Density) 0.6091 0.6091 0.6091 0.6091 0.6091 0.6091
(u) Estimated state share (r * s * t) $381,587 $593,826 $0 $247,688 $85,341 $0 $1,308,442
(v) Local share attributable to pre-effective date debt ((r - u) * j) $675,401 $1,462,974 $3,740,043 $1,347,630 $218,124 $0 $7,444,172
(w) Total nonrecurring revenue to apply to 2007-2008 debt service payments $508,340 $508,340
(x) Estimated local share of 2007-2008 payments from recurring revenues (v - w ) $675,401 $1,462,974 $3,231,703 $1,347,630 $218,124 $0 $6,935,832
(y) 2007-2008 local share minus 2006-2007 local share (x - q) $2,102 -$2,958 $1,690,670 -$844 $10,659 $0 $1,699,629
Allowable School Construction: Indebtedness Prior to Certain Dates Exception (y > $0): $1,699,629
* May include swap payments that are part of the interest charge on indebtedness paid by a district to an authority.
Referendum Exception Worksheet ExampleReferendum Exception Worksheet Example

10
Section III
Academic Building Construction Exception (60% Test)

11
•To pay interest and principal on indebtedness for up to 60% of the construction cost average on a To pay interest and principal on indebtedness for up to 60% of the construction cost average on a square foot basis of an academic elementary (pre-K to 6) or secondary (7-12) school building square foot basis of an academic elementary (pre-K to 6) or secondary (7-12) school building
•Statute specifically excludes natatorium, stadium bleachers, athletic field, athletic field lighting Statute specifically excludes natatorium, stadium bleachers, athletic field, athletic field lighting equipment and apparatus used to promote and conduct interscholastic athleticsequipment and apparatus used to promote and conduct interscholastic athletics
•PDE forms also exclude District administration offices, daycare/pre-school (nonacademic), and PDE forms also exclude District administration offices, daycare/pre-school (nonacademic), and non-district use spaces (health clinic, public library, etc.)non-district use spaces (health clinic, public library, etc.)
•““The indebtedness is incurred only after The indebtedness is incurred only after existing fund balances for school constructionexisting fund balances for school construction and and any any undesignated fund balancesundesignated fund balances have been fully committed to fund the project.” (emphasis added) have been fully committed to fund the project.” (emphasis added)
•For 2nd, 3rd and 4th Class Districts, project approval has been given by PDE under Section 731. For 2nd, 3rd and 4th Class Districts, project approval has been given by PDE under Section 731. For 1st Class A Districts, the plans and specs for the project have been approved by PDE For 1st Class A Districts, the plans and specs for the project have been approved by PDE (reimbursable project) or the board of school directors (nonreimbursable project).(reimbursable project) or the board of school directors (nonreimbursable project).
•Plancon F approval for reimbursable projectsPlancon F approval for reimbursable projects
Academic Building Construction Exception (60% Test)Academic Building Construction Exception (60% Test)

12
As of (1) (2) (3) (4)
Fiscal Year 2001 2002 2003 2005Ending June 30 G.O. Bonds G.O. Bonds G.O. Bonds G.O. Bonds Total
2007 2,111,298 706,620 961,358 610,523 4,389,798
2008 2,112,498 705,105 973,098 602,273 4,392,973
2009 2,111,498 701,905 965,738 614,700 4,393,840
2010 2,112,665 702,205 959,925 612,900 4,387,695
2011 2,112,865 701,550 586,285 610,650 4,011,350
2012 2,112,865 704,390 257,585 3,074,840
2013 2,113,105 701,030 254,065 3,068,200
2014 2,117,375 701,050 2,818,425
2015 2,110,895 709,200 2,820,095
2016 2,113,735 705,000 2,818,735
2017 705,000 705,0002018 703,350 703,3502019 02020 0
Total 21,128,798 8,446,405 4,958,053 3,051,045 37,584,300
(1) Call date required 4/1/2011, average coupon 4.74%.
(2) Callable 8/15/2007, average coupon 3.83%.
(3) Callable 5/1/2008, average coupon 3.20%.
(4) Non-Callable, average coupon 3.09%.
XYZ School DistrictGross Debt Outstanding
as of July 1, 2006
The District’s Debt ProfileThe District’s Debt Profile

13
As of (1) (2) (3) (4)
Fiscal Year 2001 2002 2003 2005Ending June 30 G.O. Bonds G.O. Bonds G.O. Bonds G.O. Bonds Total
2007 1,861,531 706,620 658,434 440,187 3,666,771
2008 1,862,589 705,105 666,474 434,238 3,668,407
2009 1,861,707 701,905 661,434 443,199 3,668,245
2010 1,862,737 702,205 657,453 441,901 3,664,295
2011 1,862,913 701,550 401,547 440,279 3,406,288
2012 1,862,913 704,390 176,420 0 2,743,723
2013 1,863,125 701,030 174,009 0 2,738,164
2014 1,866,890 701,050 0 0 2,567,940
2015 1,861,176 709,200 0 0 2,570,376
2016 1,863,680 705,000 0 0 2,568,680
2017 0 705,000 0 0 705,0002018 0 703,350 0 0 703,3502019 0 0 0 0 02020 0 0 0 0 0
Total 18,629,261 8,446,405 3,395,770 2,199,803 32,671,239
(2) No Project Reimbursement
(1) Project Reimbursement 20.55% x 2006-07 MVAR 57.58%. Local Effort 88.17% State Effort 11.83%
(3) Project Reimbursement 54.73% x 2006-07 MVAR 57.58%. Local Effort 68.49% State Effort 31.51%
(4) Project Reimbursement 48.46% x 2006-07 MVAR 57.58%. Local Effort 72.10% State Effort 27.90%
XYZ School DistrictNet Debt Outstanding
as of July 1, 2006
The District’s Debt ProfileThe District’s Debt Profile

14
As of (1) (2) (3) (4) (5)
Fiscal Year 2001 2002 2003 2005 Proposed 2007Ending June 30 G.O. Bonds G.O. Bonds G.O. Bonds G.O. Bonds G.O. Bonds Total
2007 2,111,298 706,620 961,358 610,523 4,389,798
2008 2,112,498 705,105 973,098 602,273 1,616,623 6,009,595
2009 2,111,498 701,905 965,738 614,700 1,621,623 6,015,463
2010 2,112,665 702,205 959,925 612,900 1,621,422 6,009,117
2011 2,112,865 701,550 586,285 610,650 1,641,220 5,652,570
2012 2,112,865 704,390 257,585 2,375,207 5,450,047
2013 2,113,105 701,030 254,065 2,384,275 5,452,475
2014 2,117,375 701,050 2,571,395 5,389,820
2015 2,110,895 709,200 2,568,963 5,389,058
2016 2,113,735 705,000 2,569,231 5,387,966
2017 705,000 4,641,937 5,346,937
2018 703,350 4,640,360 5,343,710
2019 5,421,579 5,421,579
2020 5,422,489 5,422,489
2021 5,425,989 5,425,989
2022 5,426,555 5,426,5552023 5,424,435 5,424,435
Total 21,128,798 8,446,405 4,958,053 3,051,045 55,373,301 92,957,601
(1) Call date required 4/1/2011, average coupon 4.74%.
(2) Callable 8/15/2007, average coupon 3.83%.
(3) Callable 5/1/2008, average coupon 3.20%.
(4) Non-Callable, average coupon 3.09%.
(5) Proposed Series of 2007, average coupon 4.67%.
XYZ School DistrictGross Debt Outstanding with $35MM Bond Issue
as of July 1, 2006Post June 27, 2006 Act 1 Effective Date
The District’s Debt Profile with New, Non-Grandfathered The District’s Debt Profile with New, Non-Grandfathered DebtDebt

15
As of (1) (2) (3) (4) (5)
Fiscal Year 2001 2002 2003 2005 Proposed 2007Ending June 30 G.O. Bonds G.O. Bonds G.O. Bonds G.O. Bonds G.O. Bonds Total
2007 1,861,531 706,620 658,434 440,187 0 3,666,771
2008 1,862,589 705,105 666,474 434,238 1,454,960 5,123,367
2009 1,861,707 701,905 661,434 443,199 1,459,460 5,127,705
2010 1,862,737 702,205 657,453 441,901 1,459,279 5,123,575
2011 1,862,913 701,550 401,547 440,279 1,477,098 4,883,386
2012 1,862,913 704,390 176,420 0 2,137,686 4,881,409
2013 1,863,125 701,030 174,009 0 2,145,848 4,884,011
2014 1,866,890 701,050 0 0 2,314,256 4,882,195
2015 1,861,176 709,200 0 0 2,312,067 4,882,443
2016 1,863,680 705,000 0 0 2,312,308 4,880,988
2017 0 705,000 0 0 4,177,743 4,882,743
2018 0 703,350 0 0 4,176,324 4,879,674
2019 0 0 0 0 4,879,421 4,879,421
2020 0 0 0 0 4,880,240 4,880,240
2021 4,883,390 4,883,390
2022 4,883,900 4,883,9002023 4,881,992 4,881,992
Total 18,629,261 8,446,405 3,395,770 2,199,803 49,835,970 82,507,210
(5) Estimated Local Effort 90.00% State Effort 10.00%
XYZ School DistrictNet Debt Outstanding with $35MM Bond Issue
as of July 1, 2006Post June 27, 2006 Act 1 Effective Date
(3) Project Reimbursement 54.73% x 2006-07 MVAR 57.58%. Local Effort 68.49% State Effort 31.51%
(4) Project Reimbursement 48.46% x 2006-07 MVAR 57.58%. Local Effort 72.10% State Effort 27.90%
(2) No Project Reimbursement
(1) Project Reimbursement 20.55% x 2006-07 MVAR 57.58%. Local Effort 88.17% State Effort 11.83%
The District’s Debt Profile with New, Non-Grandfathered The District’s Debt Profile with New, Non-Grandfathered DebtDebt

16
PlanCon or PDE-3074 Project Number
Date PlanCon Part F or PDE-3074 Approved
(a) 1. Total architectural area (square feet)
2. less: natatorium
3. less: district administration office
4. less: daycare/pre-school (non-academic)
5. less: non-district use (health clinic, public library, etc.)
6. Sum of a.2 through a.5
7. Academic architectural area (a.1 - a.6)
(b) 1. Academic elementary school building – architectural area
2. Academic elementary cost per square foot
3. Academic elementary calculated cost (b.1 * b.2)
(c) 1. Academic secondary school building: architectural area
2. Academic secondary cost per square foot
3. Academic secondary calculated cost (c.1 * c.2)
(d) Construction cost average for academic building (b.3 + c.3)
(e) 60% of construction cost average for academic building (d * 0.6)
(f) Total project cost (structure, movable f ixtures & equipment, architect fees,
site acquisition, f inancing and other project-related costs)
(g) Costs for academic school building
1. Structure costs
Construction costs ineligible for academic school building exception 2. less: natatorium
3. less: district administration office
4. less: day care/pre-school (non-academic)
5. less: non-district use (health clinic, public library, etc.)
6. less: site development (including but not limited to parking, playgrounds,
f ieldhouse, athletic stadium, athletic f ields, lighting equipment and apparatus)
7. less: builder's risk insurance (if not included in primes) and OCIP on the ineligible costs
8. Sum of g.2 through g.7 9. Adjusted structure costs (g.1 - g.8)
$0
$14,659,000
$2,500,000
$2,500,000$21,913,900
Academic Elementary or Secondary School Building Name New Elementary School
$8,795,400
$28,647,790
$24,413,900
$142
0
107,000
107,000
$137
$14,659,000
0
School Construction: Academic School Construction Project for Elementary or Secondary School BuildingReferendum Exception Worksheet for Budget Year 2007-2008
333(f)(2)(iii)(C)
XYZ School District
Act 72 School Districts: September 4, 2004All Other School Districts: June 27, 2006
ONLY LIST AN ACADEMIC SCHOOL DISTRICT BUILDING PROJECT FUNDED BY INDEBTEDNESSINCURRED ON OR AFTER EFFECTIVE DATE (as follows) :
107,000
(includes prime contracts (General, HVAC, Electrical, Plumbing, etc.), builder's risk insurance and ow ner's controlled insurance program (OCIP); excludes architect/engineer fees, movable f ixtures and equipment and related design fees, building purchase, site acquisition, f inancing and other project-related costs)
60% Test Example60% Test Example

17
(h) 1. Architect/engineer fees on structure costs
2. less: architect/engineer fees on costs listed above for construction ineligible for exception
3. Adjusted architect/engineer fees (h.1 - h.2)
(i) Sanitary sewage disposal (if not included in costs reported in line g above)
(j) Builder's risk insurance and OCIP on sanitary sewage disposal (if not reported in line g or i above)
(k) Architect/engineer fees on sanitary sewage disposal (if not included in fees reported in line h above)
(l) Net costs (g.9 + h.3 + i + j + k)
(m) Lesser of 60% of construction cost average (line e) or net costs (line l)
(n) 1. Total Project Cost from line f
2. Funds available for this project from: a. §690 Capital Reserve Fund
b. §1431 Capital Reserve Fund
c. Capital Projects Fund
d. Debt Service Fund
e. Other school construction funds f. Subtotal of School Construction Funds3. Available unreserved undesignated funds from: a. General Fund
b. Other funds
c. Subtotal of Unreserved Undesignated funds4. Total project cost minus available funds (n.1 - n.2f - n.3c)
$0
$100,000
$23,445,734
$8,795,400
$28,647,790
$1,581,834
$150,000
$1,431,834
$0$28,647,790
60% Test Example60% Test Example
18
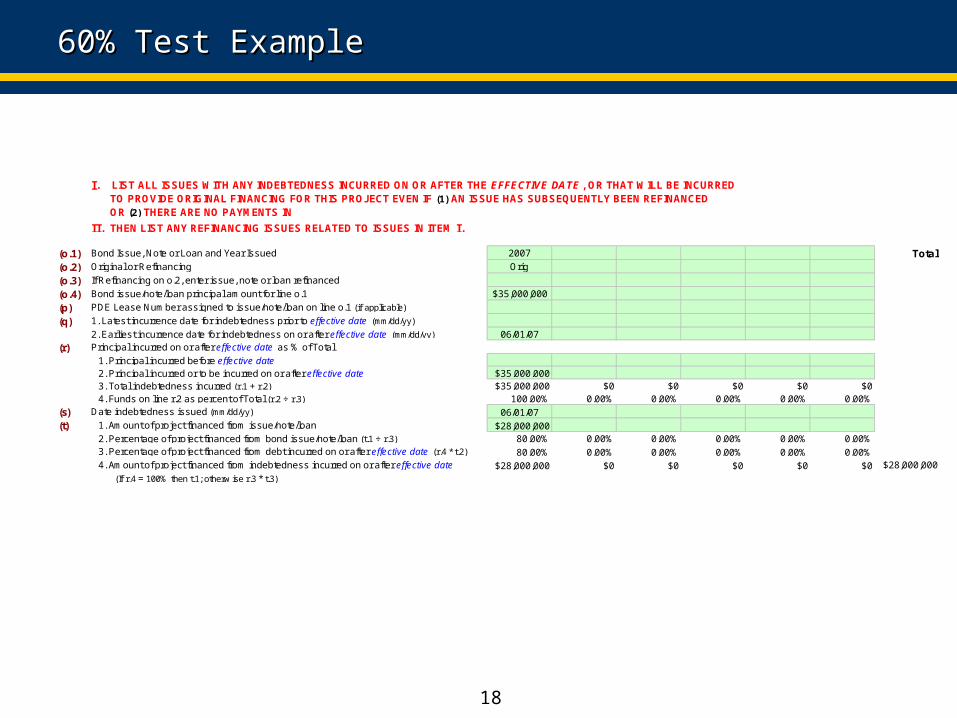
(o.1) Bond Issue, Note or Loan and Year Issued 2007 Total(o.2) Original or Refinancing Orig
(o.3) If Refinancing on o.2, enter issue, note or loan refinanced
(o.4) Bond issue/note/loan principal amount for line o.1 $35,000,000
(p) PDE Lease Number assigned to issue/note/loan on line o.1 (if applicable)
(q) 1. Latest incurrence date for indebtedness prior to effective date (mm/dd/yy)
2. Earliest incurrence date for indebtedness on or after effective date (mm/dd/yy) 06/01/07
(r) Principal incurred on or after effective date as % of Total
1. Principal incurred before effective date 2. Principal incurred or to be incurred on or after effective date $35,000,000 3. Total indebtedness incurred (r.1 + r.2) $35,000,000 $0 $0 $0 $0 $0 4. Funds on line r.2 as percent of Total (r.2 ÷ r.3) 100.00% 0.00% 0.00% 0.00% 0.00% 0.00%
(s) Date indebtedness issued (mm/dd/yy) 06/01/07
(t) 1. Amount of project financed from issue/note/loan $28,000,000 2. Percentage of project financed from bond issue/note/loan (t.1 ÷ r.3) 80.00% 0.00% 0.00% 0.00% 0.00% 0.00% 3. Percentage of project financed from debt incurred on or after effective date (r.4 * t.2) 80.00% 0.00% 0.00% 0.00% 0.00% 0.00% 4. Amount of project financed from indebtedness incurred on or after effective date $28,000,000 $0 $0 $0 $0 $0 $28,000,000
(If r.4 = 100% then t.1; otherw ise r.3 * t.3)
I. LIST ALL ISSUES WITH ANY INDEBTEDNESS INCURRED ON OR AFTER THE EFFECTIVE DATE , OR THAT WILL BE INCURRED TO PROVIDE ORIGINAL FINANCING FOR THIS PROJECT EVEN IF (1) AN ISSUE HAS SUBSEQUENTLY BEEN REFINANCED OR (2) THERE ARE NO PAYMENTS IN
II. THEN LIST ANY REFINANCING ISSUES RELATED TO ISSUES IN ITEM I.
60% Test Example60% Test Example

19
Bond Issue, Note or Loan and Year Issued 2007 Total
(u) 1. Principal refinanced on indebtedness incurred before effective date
2. Principal refinanced on indebtedness incurred on or after effective date
3. Total indebtedness refinanced (u.1 + u.2) $0 $0 $0 $0 $0 $0 4. Refinanced indebtedness incurred on or after effective date as % of total (u.2 ÷ u.3) 0.00% 0.00% 0.00% 0.00% 0.00% 0.00%
(v) Refinanced principal related to this project Total 1. Total principal refinanced for all issues refunded (u.3) $0 $0 $0 $0 $0 $0 2. Refinanced principal related to this project (issues w ith proceeds used
to originally f inance this project or issues that previously ref inanced any original f inancing for this project)
3. Refinanced principal related to this project as % of total principal refinanced 0.00% 0.00% 0.00% 0.00% 0.00% 0.00% (for total ref inancing, 100%; for partial, less than 100%) (v.2 ÷ v.1)
(w)Proceeds used to fund capital projects and to refinance outstanding bond issues.Do not include issuance costs. 1. Escrow, remarketing or call requirement for refinancing
2. Deposit to construction fund (new money for reimbursable and non-reimbursable projects)
a. Amount financed for this project (t.1) $0 $0 $0 $0 $0 $0 b. Amount financed for other projects
3. Total - refinancing and new money (w .1 + w .2a + w .2b) $0 $0 $0 $0 $0 $0 4. Refinancing requirements as % of total (w .1 ÷ w .3) 0.00% 0.00% 0.00% 0.00% 0.00% 0.00%
(x)
Principal on indebtedness incurred on or after effective date as % of total xRefinanced indebtedness incurred on or after effective date as % of total xRefinanced principal related to this project as % of total principal refinanced xRefinancing requ 0.00% 0.00% 0.00% 0.00% 0.00% 0.00%
(y) Percentage of project financed from original and refinancing bond issues (t.3 + x) 80.00% 0.00% 0.00% 0.00% 0.00% 0.00%
Do NOT complete information for any issue with all indebtedness incurred prior to the effective date.
Refinanced indebtedness incurred on or after effective date
If still making payments on original indebtedness incurred on or after the effective date, skip to (z) below. Otherwise complete the following for any refinancing issues (with or without new money for capital projects) related to the original financing for this project.
60% Test Example60% Test Example

20
Bond Issue, Note or Loan and Year Issued 2007 Total
(z) 2006-2007 total principal and interest payments * $0 $0
(aa) Reimbursable percentage (if applicable) 0.1800
(bb) Applicable aid ratio (greater of MV AR, CARF or density) 0.5758 0.5758 0.5758 0.5758 0.5758 0.5758
(cc) Estimated state share (z * aa * bb) $0 $0 $0 $0 $0 $0 $0
(dd) Estimated local share attributable to project ((z - cc) * y) $0 $0 $0 $0 $0 $0 $0
(ee) Total nonrecurring revenue applied to 2006-2007 debt service payments $0 (not included in lines n.2 or n.3)
(ff) Estimated local share of 2006-2007 payments from recurring revenues (dd - ee) $0 $0 $0 $0 $0 $0 $0
(gg) 2007-2008 total principal and interest payments * $1,616,622 $1,616,622
(hh) Reimbursable percentage (if applicable) 0.1800
(ii) Applicable aid ratio (greater of MV AR, CARF or density) 0.5758 0.5758 0.5758 0.5758 0.5758 0.5758
(jj) Estimated state share (gg * hh * ii) $167,553 $0 $0 $0 $0 $0 $167,553
(kk) Estimated local share attributable to project ((gg - jj) * y) $1,159,255 $0 $0 $0 $0 $0 $1,159,255
(ll) Total nonrecurring revenue applied to 2007-2008 debt service payment $0 (not included in lines n.2 or n.3)
(mm) Estimated local share of 2007-2008 payments from recurring revenues (kk - ll) $1,159,255 $0 $0 $0 $0 $0 $1,159,255
(nn) 2007-2008 local share minus 2006-2007 local share (mm - f f) $1,159,255 $0 $0 $0 $0 $0 $1,159,255
(oo) Estimated local share assigned to project (t.3 * nn) $927,404 $0 $0 $0 $0 $0 $927,404
(pp) Amount of project financed (line t.4 Total) $28,000,000
(qq) $8,795,400
(rr) 31.41%
(ss) Estimated local share of project allowable for exception (oo * rr) $291,298
Allowable School Construction: Academic School Construction Project Exception (ss > $0):
Maximum academic school construction project cost available for exception (lesser of line m or line n.4)
Maximum project cost as % of amount of project financed from issue/note/loan, not to exceed 100% (qq ÷ pp)
$291,298
* May include swap payments that are part of the interest charge on indebtedness paid by a district to an authority.
60% Test Example60% Test Example

21
Section IV
Electoral Debt Review

22
Act 1Debt Exceptions To The Back-End Referendum
Payment of Interest And Principal On Any Electoral Debt Incurred Under The Local Government Unit Debt Act (§333(f)(2)(iii)(B))
• PDE Approval Required to Exceed Act 1 Index

23
Electoral Debt Under TheLocal Government Unit Debt Act (LGUDA)
• DEFINITION
– All Debt Incurred With The Assent Of The Electors, Whether Issued By The School District Or Through An Authority (§8002(a))
• ELECTORAL DEBT LIMIT
– None (§8021)
• QUESTION
– “Shall Debt In The Amount Of (Insert Amount) Dollars For The Purpose Of Financing (Insert Brief Description Of Project) Be Authorized To Be Incurred As Debt Approved By The Electors?” (§8042)
• REQUIRED APPROVAL
– Majority Of The Votes Cast Upon The Question At A General Or Special Election (§8043(d))

24
LGUDA Electoral Debt Referendum Procedure
1. Board Adopts A “Desire” Resolution (§8041)
• Resolution May Call For A Special Election, If Nearest Election For Other Purposes Is More Than 90 Or Less Than 30 Days After The Effective Date Of The “Desire” Resolution,
• Cost Of A Special Election Not Held For Other Purposes To Be Paid By School District
2. Board Submits Certified Copy Of Desire Resolution And Form Of The Question To The County Board Of Elections At Least 45 Days Prior To The Election (§8043)

25
LGUDA Electoral Debt Referendum Procedure
3. Board To Publish A Notice of Election (§8042)
4. County Board Of Elections Computes The Vote And Transmits A Certified Return To The School District (§8043)

26
Effect Of Approval Of Question Under LGUDA
If The Ballot Question Is Approved By Majority Vote,
• School District May Then Undertake Local Government Unit Debt Act Proceedings To Incur The Debt And Issue Bonds Or Notes Or Enter Into A Lease In The Same Manner As For Nonelectoral Or Lease Rental Debt, But Debt Limits Do Not Apply (§8046)
• Board Must Issue The Approved Debt Within 10 Years (§8047)

27
Effect Of Approval Of QuestionUnder LGUDA
• Board May, By Resolution, Rescind Or Cancel, In Whole Or In Part, The Authorization To Incur Electoral Debt For Any Stated Reason (Without Any Assent Of The Voters) (§8047)
• Proceeds Of The Approved Electoral Debt May Be Used Only For The Project For Which Approval Was Obtained Or To Retire Such Debt (Board May Call For Another Election To Change The Purpose, However) (§§8048, 8049)

28
Effect Of Defeat Of QuestionUnder LGUDA (§8045)
If Question Is Not Approved By Majority Vote,
• Another Election For The Same Purpose May Not Be Held Until 155 Days Have Elapsed
• During The Interim, No Bonds Or Notes May Be Issued Or Lease Rental Debt Incurred For The Same Purpose, Except That Which Is Incurred As Nonelectoral Or Lease Rental Debt (i.e., By The Board And Within The Statutory Debt Limits) To -
– Complete Projects Already Under Construction
– Finance A Different Portion Or Portions Of A Capital Budget, Or
– Evidence Emergency Debt Incurred With Court Approval Under Debt Act Section 8022(e)

29
Comparison of LGUDA And Act 1 Referenda Regarding Debt For A School Building Project
Debt Act Referendum Act 1 ReferendumQuestion Focus
Building Project/Amount of Debt
Annual Budget/Tax Increase
Question Content
Estimated Amount of Debt; Brief Description of The Project
Specific Tax Rate or Rate of Tax Increase; Reason for Tax Increase
When Before Debt is Issued After Debt is Issued
Timing of Election
Any Election Fixed by the Board of School Directors Before Debt is Issued
Primary Election Before Start of Fiscal Year for Which Tax Increase is Needed
Vote Required For Approval
Majority Majority

30
Comparison of LGUDA And Act 1 Referenda Regarding Debt For A School Building Project
Debt Act Referendum Act 1 ReferendumEffect of Approval
Debt Service Eligible for Back-End Referendum Exception Under Act 1
Board May Raise Taxes by Amount Authorized, but Only in the Following Fiscal Year
Approved Debt Does Not Count Against Statutory Borrowing Limits
Board May Issue Approved Debt at Any Time Within 10 Years

31
Comparison of LGUDA And Act 1 Referenda Regarding Debt For A School Building Project
Debt Act Referendum Act 1 ReferendumEffect of Disapproval
Board Cannot Resubmit Question to Voters or Incur Debt for the Project for 155 Days
Board May Not Increase Taxes Above the Index for the Following Fiscal Year
After Waiting Period, Board May Incur Debt as Nonelectoral Debt or Lease Rental Debt Subject to Statutory Borrowing Limits and Act 1 Tax Increase Limitations
When Subsequent Referendum Required
If and When Additional Debt Needed or Board Desires to Change Purpose of Approved Debt
Any Subsequent Fiscal Year in Which Taxes Need to be Increased Above Index After Application or Denial of Exceptions