Embed Size (px)
Citation preview

1. One Seller 2. One Product
4. Non-Price competition
6. Price Maker (to maximize profits)
3. Blocked Entry (and exit?)
5. LR profits/losses
Barriers to Entry1. economies of scale
2. government licensing
3. Patents
4. control over an essential resource

Price and Output• A profit-maximizing firm will expand output
as long as marginal revenue exceeds marginal cost.• Price will be lowered and output expanded
until MR = MC
• The price charged will be greater than its marginal cost.

A Natural Monopoly Graph
Q
Average Cost
Q0.5
C1
Q1Q0.33
C0.5
C0.33
ATC
• One firm producing Q1 has average cost C1
• If two firms share the market, each produces Q0.5 and has average cost C0.5• If three firms share the market, each produces Q0.33 has average cost C0.33

d
Price
Quantity/time
P2
P1
MRq1 q2
Increase inTotal Revenue
Reduction inTotal Revenue
Marginal Revenue of a Monopolist• Initial price P1 & output q1.
Total revenue (TR) = P1 * q1.1. As price falls from P1 to P2,
output increases from q1 to q2,
two conflicting influences on TR.1. TR will rise because of an increase in the number of units sold (q2 - q1) * P2.
2. TR will decline [(P1 - P2) * q1] as q1 units once sold at the higher price (P1) are now sold at the lower price (P2). • Depending on the size of the shaded regions, total revenue may increase or decrease.

______
___
___
___
___
____________
0
1
2
3
4
5
6
7
8
9
10
OutputTotal Cost
Marginal Cost
Price (AR)Quantity Marginal
Revenue
50
80
90
110
140
180
230
290
360
440
530
0
1
2
3
4
5
6
7
8
9
10
120
110
100
90
80
70
60
50
40
30
20___
______
___
___
___
___
_________
0
110
200
270
320
350
360
350
320
270
200
30
10
20
30
40
50
60
70
80
90
Total Revenue
110
90
70
50
30
10
-10
-30
-50
-70___
______
___
___
___
___
_________
___
80
45
37
35
36
38
41
45
49
53
ATC
___
___
___
___
___
_________
___

Marginal Cost
Price (AR)Quantity Marginal
Revenue0
1
2
3
4
5
6
7
8
9
10
120
110
100
90
80
70
60
50
40
30
20
30
10
20
30
40
50
60
70
80
90
110
90
70
50
30
10
-10
-30
-50
-70
80
45
37
35
36
38
41
45
49
53
ATC

Cost
Output
60
50
40
30
20
10
1 2 3 4 5 60 7 8 9 10
70
80
90
100
110
120
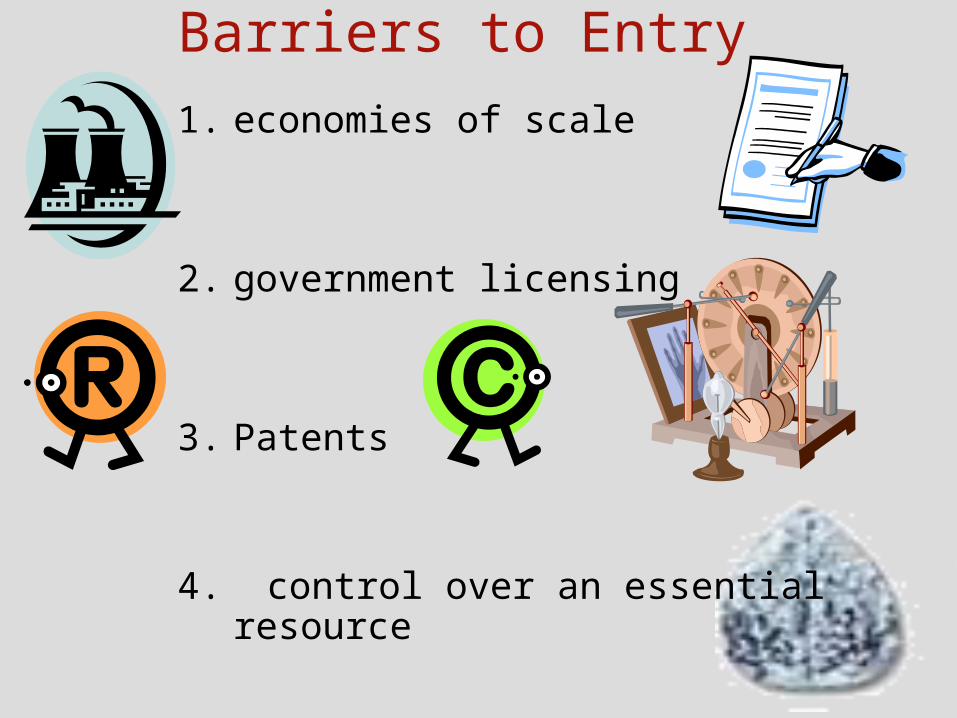
Monopolistic Profit Maximization Graph
MC
Q
P
Find output where MC = MR, this is the profit maximizing Q
DMC = MR
4 = Qprofit max
D at Qprofit max
$24
Marginal revenue is not constant as Q increases because:•revenue increases as the monopolist sells more•revenue decreases because the monopolist must lower the price to sell more
Find how much consumers will pay
where the profit max Q intersects demand, this is the monopolist price
MR

Monopoly Compared to Perfect Competition Graph
MC
Q
P
DM
QM
PM
Outcome: Monopoly output is lower and price
is higher than perfect competition
MRM
• In a monopoly, P>MR, • In perfect competition,
P=MR=D• MR=MC is the profit max
rule for both
PPC
QPC
First find the monopoly Q and P
Then find the perfectly
competitive Q and P
DPC= MRPC

The Welfare Loss from a Monopoly
MC
Q
P
D
QM
PM
• The welfare loss from a monopoly is represented by the triangles B and D
• The rectangle C is a transfer of surplus from the consumer to the monopolist
• The area A represents the opportunity cost of diverted resources, which is not a loss to society MR
PPC
QPC
A
BDC
dMR
MC
LRATC
Price
Quantity/time
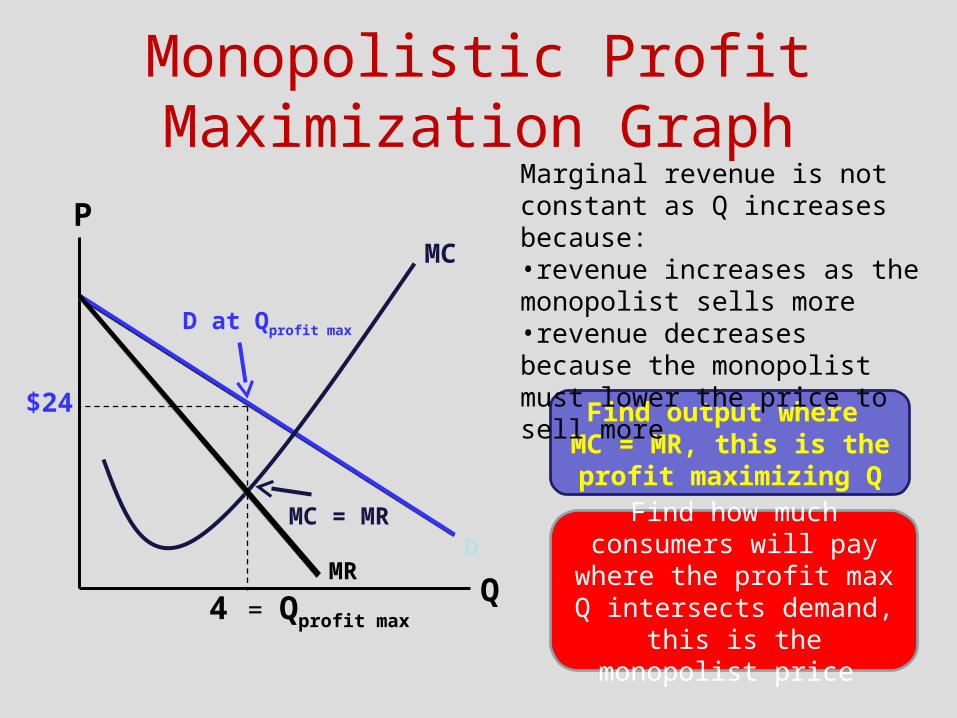
The diagram shows demand and long-run cost conditions in an industry
a. Explain why the industry is likely to be monopolized.
b. Indicate the monopolist’s output level, and label it Q.
c. Indicate the price that a profit-maximizing monopolist would charge, and label it P
d. Indicate the maximum profits of the monopolist.
e. Will the profits attract competitors to the industry? Yes ___ No ____
Explain why or why not
Name: ____________________
Price
Quantity/time
d
P
MR
q
MC
ATC
C B
A
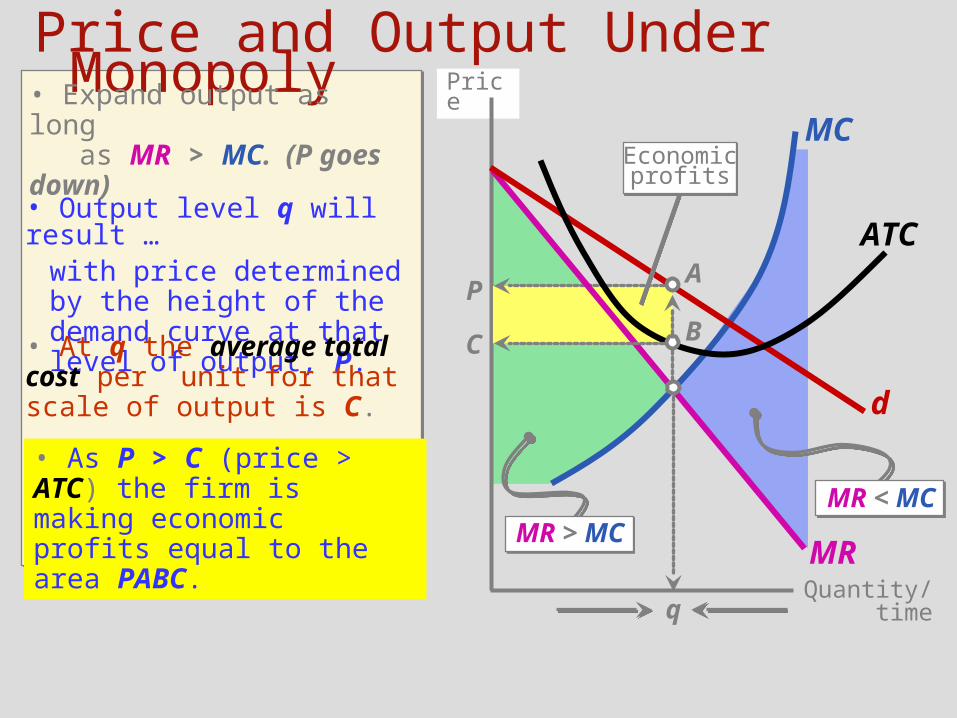
with price determined by the height of the demand curve at that level of output, P.
Price and Output Under Monopoly• Expand output as long
as MR > MC. (P goes down)
MR > MCMR < MC
• Output level q will result …
• At q the average total cost per unit for that scale of output is C.
• As P > C (price > ATC) the firm is making economic profits equal to the area PABC.
Economicprofits

0 ----
Totalrevenue
= (1)*(2) (3)
Price(per unit)
(2)
Output(per day)
(1)
1 $25.00 2 3 4 5 6 7 8 9
10
----- $50.00
Totalcosts
(per day) (4)
Profit
= (3) - (4) (5)
Marginal
cost(6)
Marginalrevenue
(7)
$24.00$23.00$22.00$21.00$19.75$18.50$17.25$16.00$14.75
$25.00$48.00$69.00$88.00
$105.00$118.50$129.50$138.00$144.00$147.50
$60.00$69.00$77.00$84.00$90.50$96.75
$102.75$108.50$114.75$121.25
-$35.00-$21.00-$8.00$4.00
$14.50$21.75$26.75$29.50$29.25$26.25
-$50.00 ----
$10.00 $25.00$9.00 $23.00$8.00 $21.00$7.00 $19.00$6.50 $17.00$6.25 $13.50$6.00 $11.00$5.75 $8.50$6.25 $6.00$6.50 $3.50
----
<<<<<<<<
Maximumprofits
• A monopolist will reduce price and expand output as long as MR > MC.
Price and Output Under Monopoly
• As the monopolist reduces price and expands output, profits increase … until the point where MC >
MR.• Here an output of 8 a day will maximize profits.
Profits Under Monopoly• High entry barriers protect
monopolists from competitive pressures.– Monopolists can earn long-run profits.
• However even a monopolist will not always be able to earn profit.– When ATC is always above the demand
curve, the monopolist will be unable to cover costs (unable to earn a profit).

• A monopolist will set output equal to q, where MR = MC
When a Monopolist Incurs Losses
d
P
MR
q
MC
ATC
C A
B
Price
Quantity/time
Short-runlosses
• At this level of output, the price that the monopolist charges does not cover the average total cost of producing the output ( P < C ).
• Whenever the ATC curve lies always above the demand curve, the monopolist will incur short-run losses.• In this diagram the firm is making economic losses equal to the shaded area, CABP.

D
P0
MRQ0
LRATC
MCP1
P2
Q1 Q2
Regulation of a MonopolistPrice
Quantity/time
• An unregulated monopolist produces where MR = MC (Q0) and charge price P0.• From an efficiency viewpoint, this output is too small and the price is too high. 1. average cost pricing
The monopolist is forced to reduce its price to P1 the expand output to Q1.
2. marginal cost pricing
-Force output to be expanded to Q2 where P = MC
- P = cost to produce
-Forces LR losses.
Average costpricing
Marginal costpricing
Allocative Efficiency• Allocative efficiency is achieved when the most
desired goods are produced at the lowest possible cost.
• The Minimum point on the ATC curve:• ATC > marginal cost at the minimum point• No allocative efficiency in a Monopoly.

Price Discrimination• Sellers may gain from price discrimination
by charging:• higher prices to groups of customers with
more inelastic demand • lower prices to groups of customers with
more elastic demand
• Price discrimination generally leads to more output and additional gains from trade.

The Economics of Price Discrimination
• If the airline charges all customers the same price, profits will be maximized where MC = MR. Here the airline charges everyone $400 and sells 100 seats.
Price
Quantity/timeSingle price
$400
$200
$300
$100
$500
$600
$700
MC
D100
MR
Net operating revenue($300*100) = $30,000
• Consider a hypothetical market for airline travel where the Marginal Cost per traveler is $100.
• This generates Net Operating Revenue of $30,000 or (total revenues) $40,000 – (operating costs) $10,000.

Price
Quantity/timeSingle price
$400
$200
$300
$100
$500
$600
$700
MC
D100
MR
Net operating revenue($300*100) = $30,000
The Economics of Price Discrimination• By charging higher prices to consumers with less
elastic demand and lower prices to those with more elastic demand it will increase net operating revenue.
• If the airline charges $600 to business travelers (who have a highly inelastic demand) and $300 to other travelers (who have a more elastic demand), it can increase its Net Operating Revenue to $42,000.
Price
Quantity/timePrice Discrim.
$400
$200
$300
$100
$500
$600
$700
MC
D
Net operating revenuefrom business travelers($500*60) = $30,000
Net operating revenuefrom all others($200*60) = $12,000
60 120

When economies of scale are important and an industry tends toward natural monopoly, splitting the industry into small, rival firms will a. lead to lower prices in the short run. b. cause prices to rise when demand is inelastic but fall when it is elastic. c. cause prices to fall because of the decline in producer profits.d. increase per-unit costs of production.
Which of the following is the most accurate description of a monopolist?
a. a firm that produces a single product b. a firm that is the sole producer of a narrowly defined product
class, such as yellow, grade-A butter produced in Jackson County, Wisconsin
c. a firm that is the sole producer of a product for which there are no good substitutes in a market with high barriers to entry
d. a firm that is large relative to its competitors
A monopolist will maximize profits bya. setting his price as high as possible. b. setting his price at the level that will maximize per-unit profit. c. producing the output where marginal revenue equals marginal cost
and charging the price on the demand curve at that quantity. d. producing the output where price equals marginal cost.

The incentive for the managers of a government-operated firm (for example, a state university) to promote internal efficiency and keep costs low will be
a. weak because it will be difficult for voters and their representatives to monitor and eliminate the inefficiency of such firms.
b. strong because public officials will have little concern for personal gain. c. strong because voters can easily recognize inefficiency and penalize the
public-sector managers who are responsible. d. weak because government employees are less competent than those who
work in the private sector.
Oligopolistic agreements on price tend to be unstable because a. although the monopoly price is the best price for all firms, oligopolists are
unaware of this.b. although the monopoly price maximizes the joint profits of the firms, a
secret price cut by any individual firm will increase the profits of that firm; hence, collusive agreements tend to break down.
c. the demand for the products of oligopolistic industries is inherently unstable relative to the demand for the products of non-oligopolistic industries.
d. firms in oligopolistic industries have more concern for consumers than do firms in competitive industries.
When firms use resources in an attempt to secure and maintain grants of market protection from the government, it is called a. rent seeking b. franchising.c. collusion. d. resource investment

What price and output in the graph would an unregulated profit-maximizing monopolist choose?
a. price C and output Rb. price B and output R c. price B and output S d. price A and output T
If a regulatory agency were using the “normal return” (zero economic profit) criteria to impose a price on a monopolist with the cost and demand conditions depicted, what price would the regulators set, and what output would the monopolist produce?
a. price A and output Tb. price C and output R c. price B and output R d. price B and output S
Would they be making a profit?a. yesb. no c. normal but not economic d. can’t tell


![[Christmas profits review] get $26,000 in one day!](https://img.dokumen.tips/doc/110x75/55a201a51a28ab42268b463a/christmas-profits-review-get-26000-in-one-day.jpg)