Embed Size (px)
Citation preview

1Office of Travel & Tourism Industries, International Trade Administration, U.S. Department of Commerce
Travel Trends for USA and Utah:An International Perspective
Presented by:
Mark BrownOffice of Travel and Tourism IndustriesMANUFACTURING & SERVICESInternational Trade AdministrationU.S. Department of CommerceMay 2010
Presented to:
The Utah Travel & Tourism Industry

2Office of Travel & Tourism Industries, International Trade Administration, U.S. Department of Commerce
Agenda for Today
• Overview of OTTI & Commerce Travel & Tourism Services
• Travel Trends for the U.S.& Western USA
• Forecast for International Travel
• Policy and Promotion Issues
• Q & A
3Office of Travel & Tourism Industries, International Trade Administration, U.S. Department of Commerce
“Who is OTTI?”
The National Tourism Office for the U.S.
4Office of Travel & Tourism Industries, International Trade Administration, U.S. Department of Commerce
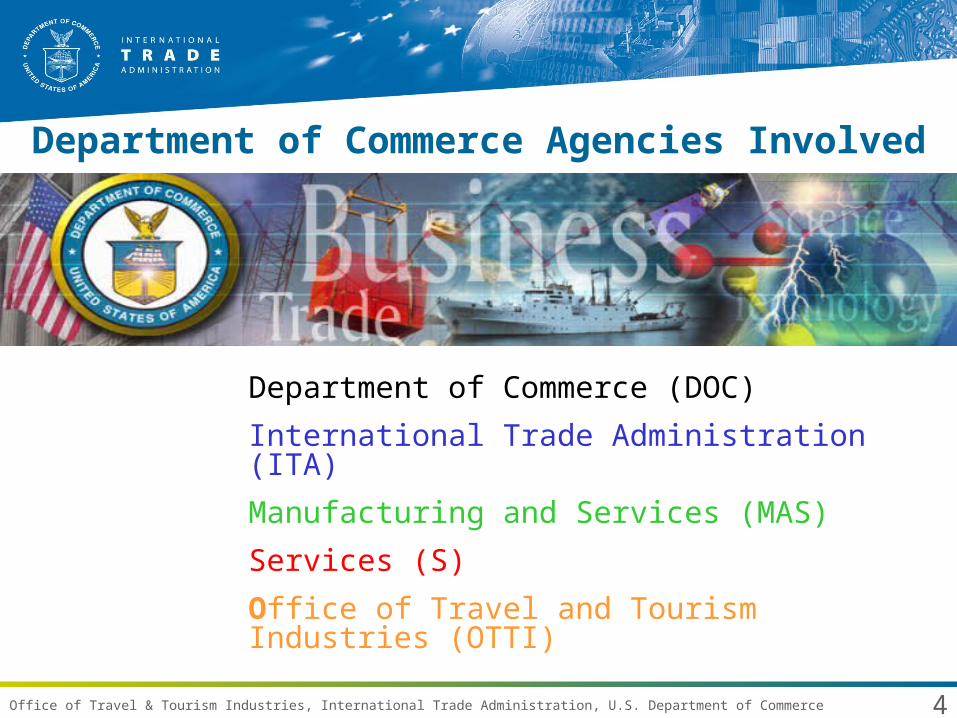
Department of Commerce (DOC)
International Trade Administration (ITA)
Manufacturing and Services (MAS)
Services (S)
Office of Travel and Tourism Industries (OTTI)
Department of Commerce Agencies Involved
5Office of Travel & Tourism Industries, International Trade Administration, U.S. Department of Commerce
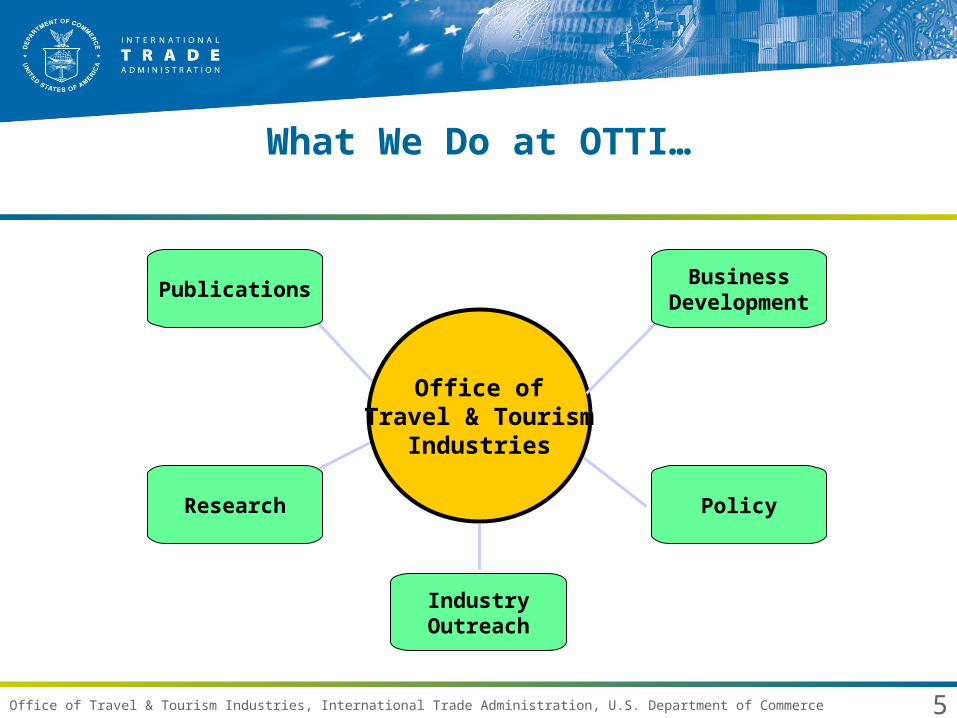
What We Do at OTTI…
Research
Publications
Office ofTravel & Tourism
Industries
IndustryOutreach
Policy
BusinessDevelopment
6Office of Travel & Tourism Industries, International Trade Administration, U.S. Department of Commerce
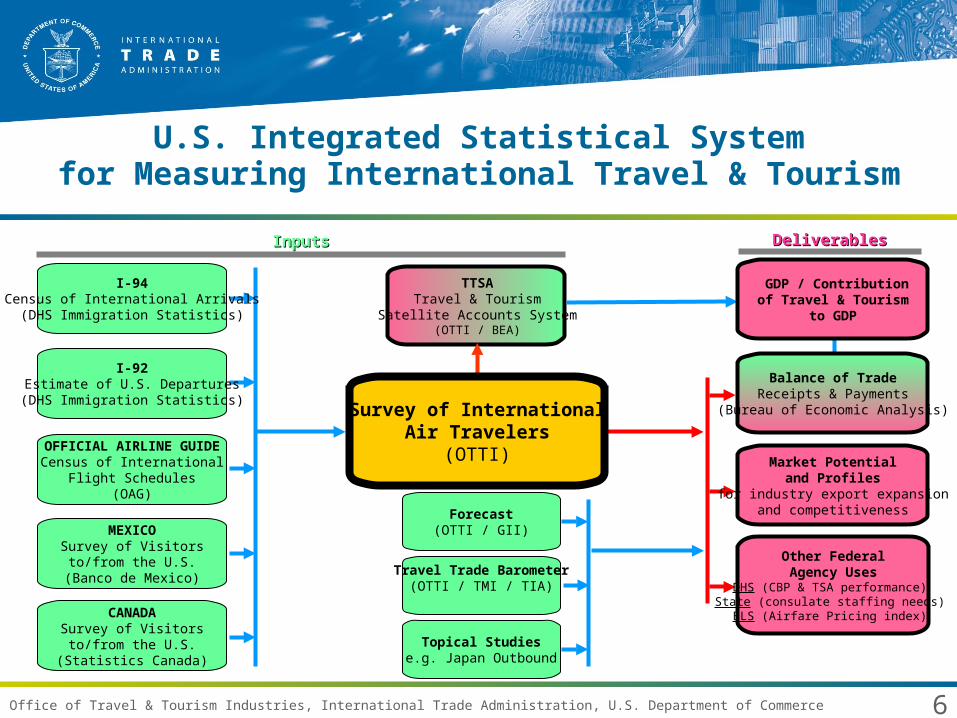
U.S. Integrated Statistical Systemfor Measuring International Travel & Tourism
DeliverablesDeliverablesInputsInputs
GDP / Contributionof Travel & Tourism
to GDP
TTSATravel & Tourism
Satellite Accounts System(OTTI / BEA)
Balance of TradeReceipts & Payments
(Bureau of Economic Analysis)
I-92Estimate of U.S. Departures(DHS Immigration Statistics)
CANADASurvey of Visitorsto/from the U.S.
(Statistics Canada)
Survey of InternationalAir Travelers
(OTTI) Market Potentialand Profiles
for industry export expansionand competitiveness
Other FederalAgency Uses
DHS (CBP & TSA performance) State (consulate staffing needs)
BLS (Airfare Pricing index)
I-94Census of International Arrivals
(DHS Immigration Statistics)
OFFICIAL AIRLINE GUIDECensus of International
Flight Schedules(OAG)
MEXICOSurvey of Visitorsto/from the U.S.
(Banco de Mexico)
Forecast(OTTI / GII)
Travel Trade Barometer(OTTI / TMI / TIA)
Topical Studiese.g. Japan Outbound
7Office of Travel & Tourism Industries, International Trade Administration, U.S. Department of Commerce
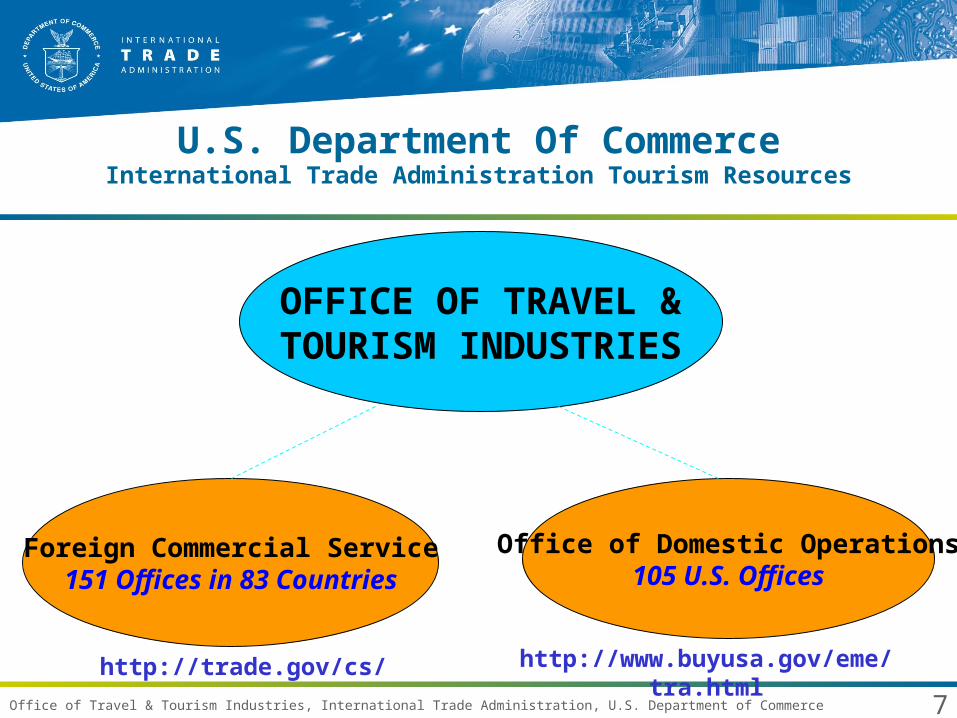
U.S. Department Of CommerceInternational Trade Administration Tourism Resources
OFFICE OF TRAVEL &TOURISM INDUSTRIES
Office of Domestic Operations105 U.S. Offices
Foreign Commercial Service151 Offices in 83 Countries
http://www.buyusa.gov/eme/tra.html
http://trade.gov/cs/
8Office of Travel & Tourism Industries, International Trade Administration, U.S. Department of Commerce
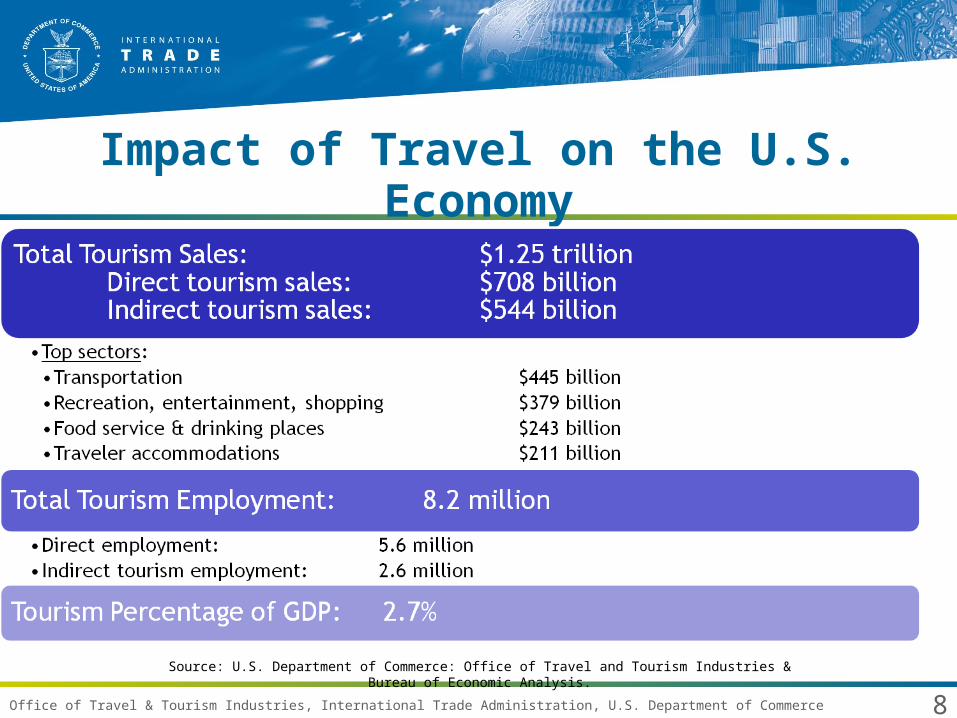
Impact of Travel on the U.S. Economy
(2009)
Source: U.S. Department of Commerce: Office of Travel and Tourism Industries & Bureau of Economic Analysis.
9Office of Travel & Tourism Industries, International Trade Administration, U.S. Department of Commerce
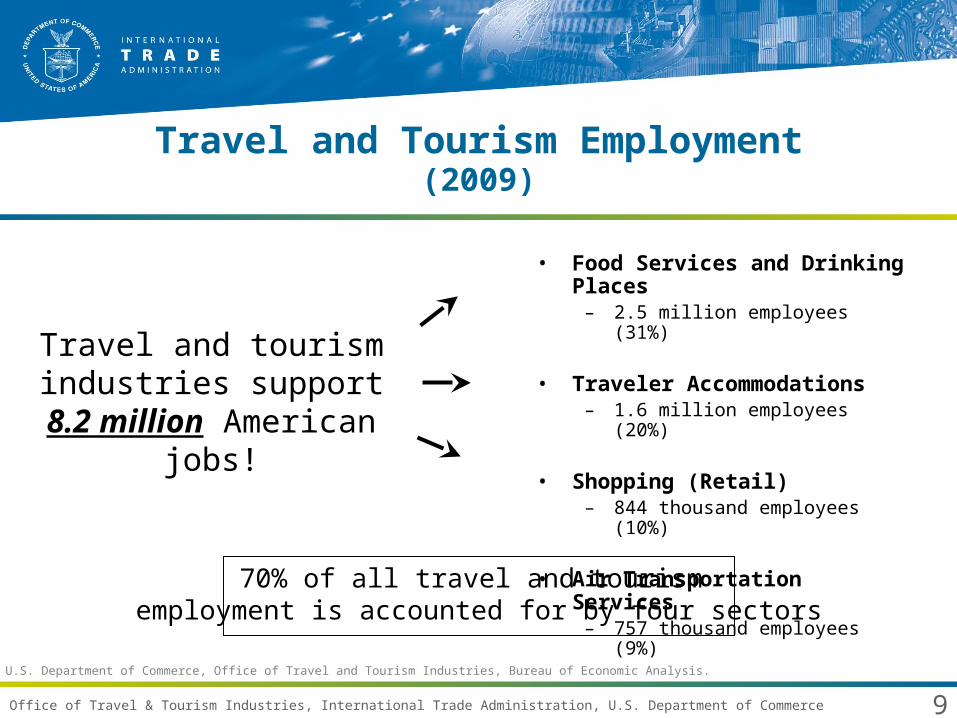
Travel and Tourism Employment(2009)
Travel and tourism industries support 8.2
million American jobs!
• Food Services and Drinking Places– 2.5 million employees (31%)
• Traveler Accommodations– 1.6 million employees (20%)
• Shopping (Retail)– 844 thousand employees (10%)
• Air Transportation Services– 757 thousand employees (9%)
70% of all travel and tourism employment is accounted for by four sectors
Source: U.S. Department of Commerce, Office of Travel and Tourism Industries, Bureau of Economic Analysis.

10Office of Travel & Tourism Industries, International Trade Administration, U.S. Department of Commerce
International Travel & Tourism to the U.S.(2009)
• Largest services sector export –$121 billion in 2009.
• Third-largest merchandise/services export category.
• Generated a trade surplus of $22 billion.
• Supported 1.1 million jobs.
• International travelers spend 4-7 times more than domestic travelers on a trip:– Length of the trip is 2-4 times greater than domestic travelers.– International travelers have higher activity participation rates than domestic
travelers.– International travelers were more inclined to stay at hotels/motels & rent cars
than a domestic traveler.
• 4% of travelers, but 17% of traveler spending, payroll, employment and taxes.

11Office of Travel & Tourism Industries, International Trade Administration, U.S. Department of Commerce
Global Travel Trends

12Office of Travel & Tourism Industries, International Trade Administration, U.S. Department of Commerce
$0
$100
$200
$300
$400
$500
$600
$700
$800
$900
$1,000
0
100
200
300
400
500
600
700
800
900
1,000
1950
1960
1965
1970
1975
1980
1981
1982
1983
1984
1985
1986
1987
1988
1989
1990
1991
1992
1993
1994
1995
1996
1997
1998
1999
2000
2001
2002
2003
2004
2005
2006
2007
2008
2009
2010
World Arrivals World Receipts
World Arrivals (millions) World Receipts ($billions)
1950 - 1980 1981 - 2010
World Tourism Arrivals & Receipts(1980-2010)
Source: U.N. World Tourism Organization
2009p880m$878b
13Office of Travel & Tourism Industries, International Trade Administration, U.S. Department of Commerce
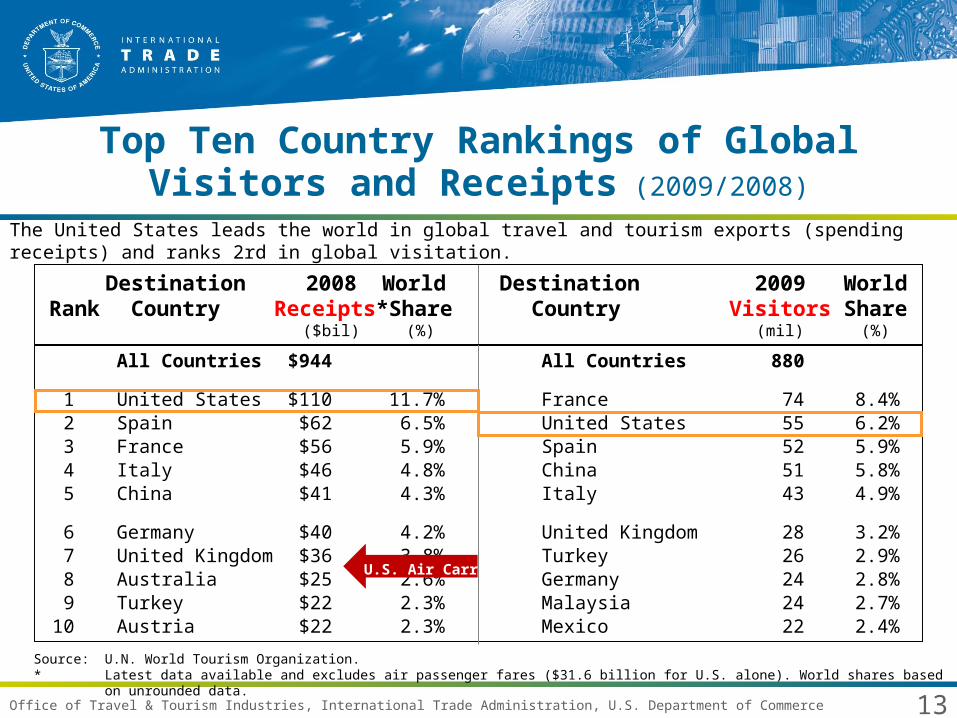
Top Ten Country Rankings of GlobalVisitors and Receipts (2009/2008)
All Countries $944 All Countries 880
1 United States $110 11.7% France 74 8.4%2 Spain $62 6.5% United States 55 6.2%3 France $56 5.9% Spain 52 5.9%4 Italy $46 4.8% China 51 5.8%5 China $41 4.3% Italy 43 4.9%
6 Germany $40 4.2% United Kingdom 28 3.2%7 United Kingdom $36 3.8% Turkey 26 2.9%8 Australia $25 2.6% Germany 24 2.8%9 Turkey $22 2.3% Malaysia 24 2.7%
10 Austria $22 2.3% Mexico 22 2.4%
Destination 2008 World Destination 2009 WorldRank Country Receipts* Share Country Visitors Share
($bil) (%) (mil) (%)
Source: U.N. World Tourism Organization.* Latest data available and excludes air passenger fares ($31.6 billion for U.S. alone). World shares based on unrounded data.
The United States leads the world in global travel and tourism exports (spending receipts) and ranks 2rd in global visitation.
U.S. Air Carriers

14Office of Travel & Tourism Industries, International Trade Administration, U.S. Department of Commerce
Top 15 * Non-Asian Countries’ vs. Asia’sShare of Global International Arrivals (2002 -
2011)
* The top market share trend line includes the top 19 world destination countries excluding China (ranked 5), Hong Kong (ranked 12),Malaysia (ranked 15), and Thailand (ranked 18). The 4 Asian countries’ market share is forecasted to grow from 11.4% in 2002 to16.2% in 2011, depicted in the lower trend line.
Sources: Office of Travel & Tourism Industries, International Trade Administration, U.S. Department of Commerce; Global Insight, Inc.
Note: the top four countries (France, Spain, U.S, and Italy) represented 31% of world visitors in 2002.
Top 15 Non-Asian Countries
10%
17%China + Hong Kong + Malaysia + Thailand

15Office of Travel & Tourism Industries, International Trade Administration, U.S. Department of Commerce
Travel Trends to the U.S.

16Office of Travel & Tourism Industries, International Trade Administration, U.S. Department of Commerce
U.S. Visitors & Spending(1996-2009)
$0
$20
$40
$60
$80
$100
$120
$140
$160
0
20
40
60
80
100
1996 1997 1998 1999 2000 2001 2002 2003 2004 2005 2006 2007 2008 2009
Visitors
Spending
Visitor spending (receipts) closely mirrors visitor volume. Spending was a record $121.1 billion in 2009, while visitor volume was 54.9 million.
millions of visitors $billions in spending
Sources: Department of Commerce, Office of Tourism Industries; Department of Commerce, Bureau of Economic Analysis; Statistics Canada; Banco de Mexico.

17Office of Travel & Tourism Industries, International Trade Administration, U.S. Department of Commerce
International Total * 54,884 -5% 15%1 Canada 17,964 -5% 53%2 Mexico 13,164 -4% 3%
Overseas ** 23,756 -6% 10%3 United Kingdom 3,899 -15% -3%4 Japan 2,918 -10% 11%5 Germany 1,687 -5% 4%6 France 1,204 -3% 3%7 Brazil 893 16% 34%8 Italy 753 -3% 9%9 South Korea 744 -2% 47%10 Australia 724 5% 28%
Origin of Visitor 2009p 09 / 08 10/09 Feb. YTD
(000s) (% change) (% change)
Top Origin Markets forInternational Travelers to the U.S.
* International travelers include all countries generating visitors to the U.S.** Overseas includes all countries except Canada and Mexico. Record year for Travel to U.S.

18Office of Travel & Tourism Industries, International Trade Administration, U.S. Department of Commerce
Total Travel Record YearReceipts Travel Record
Origin Country 2009p Receipts Set($bil) ($bil)
Top Ten Travel Export Markets(2009 & record receipts/year)
Canada $16.22 $18.66 2008 Japan $12.88 $17.80 1995United Kingdom $12.13 $17.72 2008Mexico $8.34 $9.74 2008Germany $5.60 $6.68 2008
Brazil $4.25 2009France $4.23 $4.78 2008India $3.58 $4.29 2008China $3.50 $3.61 2008Australia $3.31 $3.70 2008
U.S. TOTAL $121.07 $141.71 2008
19Office of Travel & Tourism Industries, International Trade Administration, U.S. Department of Commerce
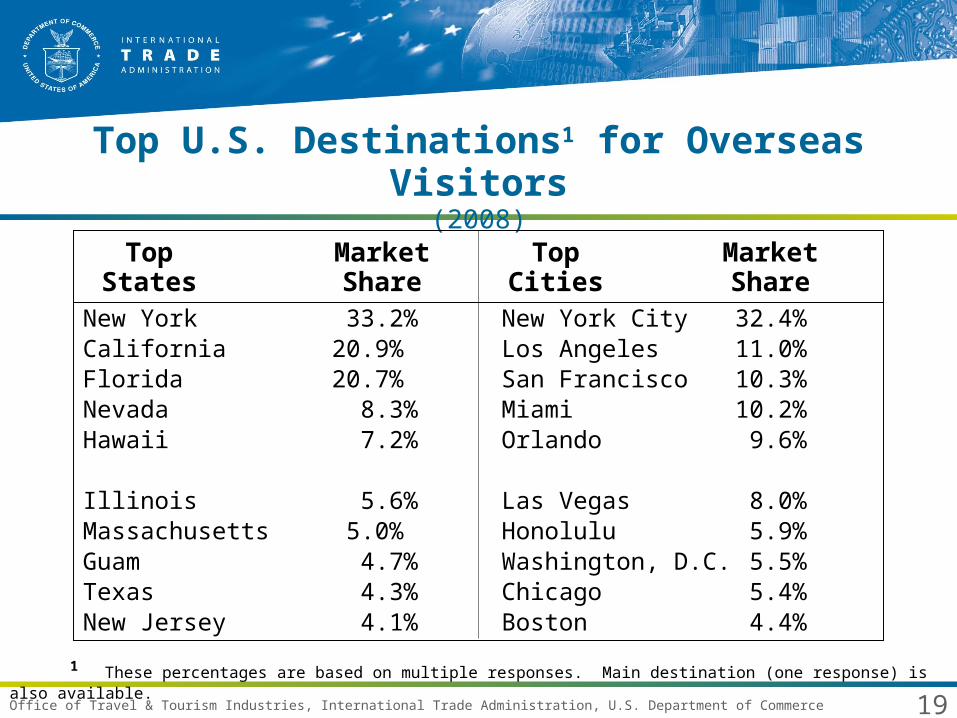
Top U.S. Destinations1 for Overseas Visitors(2008)
New York 33.2% New York City 32.4%California 20.9% Los Angeles 11.0%Florida 20.7% San Francisco 10.3%Nevada 8.3% Miami 10.2%Hawaii 7.2% Orlando 9.6%
Illinois 5.6% Las Vegas 8.0%Massachusetts 5.0% Honolulu 5.9%Guam 4.7% Washington, D.C. 5.5%Texas 4.3% Chicago 5.4%New Jersey 4.1% Boston 4.4%
Top Market Top MarketStates Share Cities Share
1 These percentages are based on multiple responses. Main destination (one response) is also available.

20Office of Travel & Tourism Industries, International Trade Administration, U.S. Department of Commerce
Western USA Visitors by Origin Country (2008)
Visitor Share Western USAOrigin Country Visitors of Western USA Share of Country
(000s) (%) (%)
TOTAL OVERSEAS 25,341 - - - - - -
Western USA 7,577 - - - 29.9%1 United Kingdom 1,260 16.6% 27.6%2 Mexico (air) 837 11.0% 49.0%3 Japan 702 9.3% 21.6%4 Germany 579 7.6% 32.5%5 Australia 417 5.5% 60.5%
6 France 389 5.1% 31.3%7 South Korea 350 4.6% 46.1%8 China 299 3.9% 60.6%9 India 297 3.9% 49.6%10 Netherlands 235 3.1% 38.7%Note: Overseas includes all countries except Canada and Mexico.
21Office of Travel & Tourism Industries, International Trade Administration, U.S. Department of Commerce
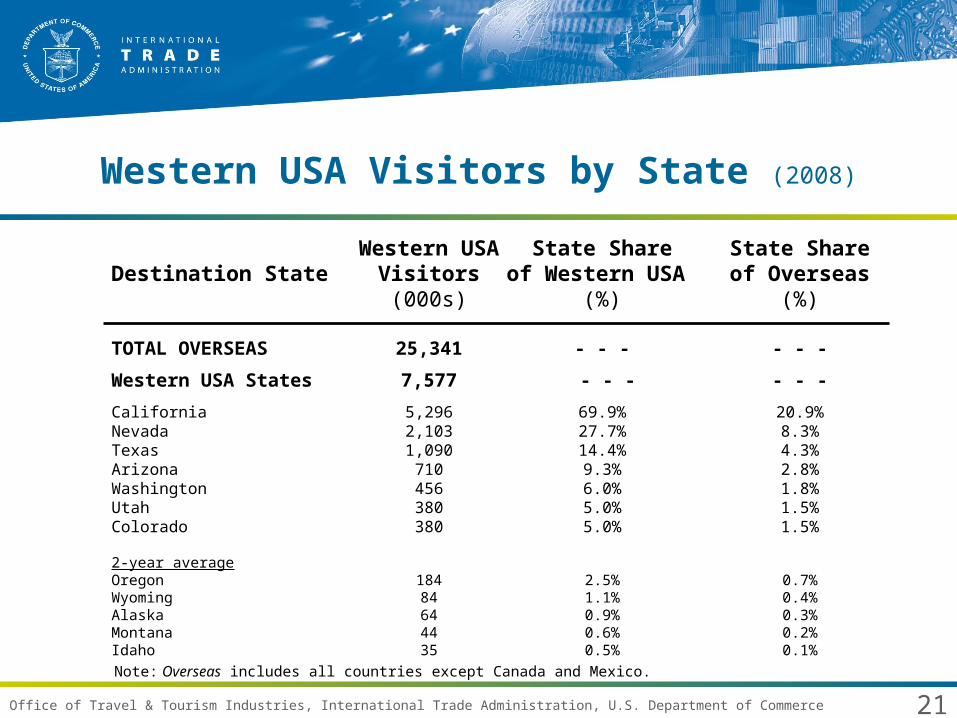
Western USA Visitors by State (2008)
Western USA State Share State ShareDestination State Visitors of Western USA of Overseas
(000s) (%) (%)
TOTAL OVERSEAS 25,341 - - - - - -
Western USA States 7,577 - - - - - -
California 5,296 69.9% 20.9%Nevada 2,103 27.7% 8.3%Texas 1,090 14.4% 4.3%Arizona 710 9.3% 2.8%Washington 456 6.0% 1.8%Utah 380 5.0% 1.5%Colorado 380 5.0% 1.5%
2-year averageOregon 184 2.5% 0.7%Wyoming 84 1.1% 0.4%Alaska 64 0.9% 0.3%Montana 44 0.6% 0.2%Idaho 35 0.5% 0.1%
Note: Overseas includes all countries except Canada and Mexico.

22Office of Travel & Tourism Industries, International Trade Administration, U.S. Department of Commerce
Travel Characteristics of Visitors fromTop Origin Markets (2008)
Travel U.K. France Western USACharacteristic Overseas Germany Japan
# of nights in U.S. 16 14 16 16 8 21
% 1st-time U.S. 24 % 15 % 23 % 29 % 31 % 22 %
Party Spending in U.S. $5,939 $5,902 $5,181 $5,336 $5,619 $7,163
Purpose of trip (net) 1 :
Leisure / Rec. / Holiday 64 % 70 % 60 % 62 % 78 % 58 %
Visit Friends/Relatives 33 % 28 % 35 % 37 % 16 % 38 %
Business / Convention 33 % 28 % 35 % 31 % 21 % 45 %
1 These trip purpose items are based on multiple responses. Main purpose of trip (one response) is also available.

23Office of Travel & Tourism Industries, International Trade Administration, U.S. Department of Commerce
Information Sources Used by Visitors fromKey Markets to the U.S. (2008)
Information Overseas U.K. Germany France Japan W. USASources (%) (%) (%) (%) (%) (%)
Personal Computer 41 48 47 44 45 40 Travel Agency 39 29 26 33 48 42Airlines Directly 20 23 28 23 10 21Friends/Relatives 15 13 15 11 15 15Corporate Travel Dept. 9 9 14 9 7 12Travel Guides 8 7 14 7 18 8Tour Company 7 6 4 5 25 5State/City Travel Office 4 1 19 1 1 4Newspapers/Magazines 3 2 3 1 8 3Advance Decision (days): Trip Decision: 87 118 104 97 68 89 Airline Booking 61 94 74 67 43 58
Note: Multiple choice responses allowed for information sources.

24Office of Travel & Tourism Industries, International Trade Administration, U.S. Department of Commerce
Information Overseas U.K. Germany France Japan W. USA
Sources (%) (%) (%) (%) (%) (%)Shopping 88 88 84 83 89 85 Dining in Restaurants 84 94 85 83 85 87Sightseeing in Cities 44 42 36 46 48 49Visit Historical Places 38 37 45 49 15 42Amusement/Theme Parks 26 32 25 20 14 31Visit Small Towns 26 26 31 23 29 33Art Gallery/Museum 22 19 26 37 7 22Cultural Heritage Sites 22 21 40 32 12 27Water Sports/Sunbathing 22 26 23 16 37 16Touring Countryside 19 21 37 17 15 28Visit National Parks 18 20 26 22 7 32Guided Tours 17 18 16 16 20 19Concert/Play/Musical 16 17 17 21 8 18
Note: Multiple choice responses allowed for activity participation.
Activity Participation while in the U.S.(2008)

25Office of Travel & Tourism Industries, International Trade Administration, U.S. Department of Commerce
Overseas Travel to Utah2006-2008 average
• Utah share of total increasing past four years:1.2%, 1.4%, 1.5%, 1.6%
• Trip purpose to USA(net):– 73% leisure/vacation– 19% business– 10% convention– 9% visit friends/relatives

26Office of Travel & Tourism Industries, International Trade Administration, U.S. Department of Commerce
Utah Overseas Visitors by Origin Country(2006-08)
Visitor Share
Origin Country Visitors of Utah
(%)
Utah Overseas 325,000
Western Europe 212,000 65%France 48,000 15%
United Kingdom 47,000 14%Germany 40,000 12%
Netherlands 27,000 8%
Asia 54,000 17%Japan 16,000 5%
South Korea 10,000 3%China (PRC) 8,000 2%
Oceania 17,000 5%Australia 12,000 4%
South America 15,000 5%Brazil 9,000 3%

27Office of Travel & Tourism Industries, International Trade Administration, U.S. Department of Commerce
Traveler Volume from Canada(stays of 1 or more nights)
Source: Statistics Canada.
5,000,000
6,000,000
7,000,000
8,000,000
9,000,000
10,000,000
11,000,000
12,000,000
13,000,000
14,000,000
15,000,000
16,000,000
17,000,000
18,000,000
19,000,000
20,000,000
21,000,000
1971
1972
1973
1974
1975
1976
1977
1978
1979
1980
1981
1982
1983
1984
1985
1986
1987
1988
1989
1990
1991
1992
1993
1994
1995
1996
1997
1998
1999
2000
2001
2002
2003
2004
2005
2006
2007
2008
2009
2010
2011
19,113,000
8,665,000
18,914,000
12,666,000
Pre-2009
2009p
Forecast
All-time Record

28Office of Travel & Tourism Industries, International Trade Administration, U.S. Department of Commerce
U.S. State Visitors Visitor-Nights Spending (000s) (000s) ($000s)
TOTAL U.S. (NET) 18,914 146,602 $12,159,398
Western US (sum 2008) 7,317 41,921 $3,993,500 Washington 2,142 6,078 $461,309 California 1,257 10,774 $1,072,402 Nevada 1,059 4,936 $867,651 Montana 650 2,035 $192,398 Arizona 515 8,587 $564,131 Oregon 409 1,386 $104,080
3-Year Average
Texas 371 3,749 $301,367 Idaho 259 757 $60,604 Utah 171 754 $84,329
Colorado 145 825 $108,707 Wyoming 88 236 $19,829
Canadian Visitors to Western USA States (2008)

29Office of Travel & Tourism Industries, International Trade Administration, U.S. Department of Commerce
Canada to Utah3-year averages based on 2006-2008 combined data (1+ nights)
• Visitors: 171 thousand producing 754 thousand visitor-nights.
• Spending: $84 million; $/visitor = $493; $/visitor/night =$112.
• Purpose: holiday/vacation-65%; VFR-17%; business-14%; other-4%.
• Stay length: 4.4 nights, 1 night-30% ; 2-6 nights-49% , 7+ nights-21%
• Province: Alberta-39%; Ontario-26%; BC-20%; Saskatchewan-8%.
• Mode: auto-58%; Air-38%.
• Accommodations: hotel-53%; f/r-10%; not stated 20% (RV?).
• Age: 55 or older-54%; children under 20-6%.
• Timing: Q2-30%; Q1-27%; Q4-26%; Q3-17%.
30Office of Travel & Tourism Industries, International Trade Administration, U.S. Department of Commerce
Forecasts for International Travel

31Office of Travel & Tourism Industries, International Trade Administration, U.S. Department of Commerce
UN/WTO Forecast for World Arrivals & Spending
for 2009 & 2010• 5% decline in world arrivals for 2009.
• The UN/WTO forecast for travel spending in 2009 is to expect a decrease of 6-8%.
• For 2010, the UN/WTO forecast for world arrivals is a 1-3% growth rate.
• Asia will show the strongest rebound, Europe & the Americas will probably take longer to recover.

32Office of Travel & Tourism Industries, International Trade Administration, U.S. Department of Commerce
Arrivals in Millions
Sources: U.S. Department of Commerce, ITA, Office of Travel & Tourism Industries; Secretaria de Turismo (Mexico); Statistics Canada & IHS Global Insight, Inc. -- May 2010 forecast
46.943.6 41.2
46.149.2 51.0
56.0 57.954.9
58.261.2
64.267.3
71.877.0
0
10
20
30
40
50
60
70
80
90
2001 2002 2003 2004 2005 2006 2007 2008 2009 2010(f) 2011(f) 2012(f) 2013(f) 2014(f) 2015(f)
International Visitors to the U.S. and Projections
(2001-2015)

33Office of Travel & Tourism Industries, International Trade Administration, U.S. Department of Commerce
Zimbabwe
Zambia
YemenVietnam
Venezuela
Vanuatu
Uzbekistan
Uruguay
United States
United Kingdom
U.A.E.
Ukraine
Uganda
TurkmenistanTurkey
Tunisia
Togo
Thailand
Tanzania
Tajikistan
Syria
Switz.
Sweden
Swaziland
Suriname
Sudan
Sri Lanka
Spain
South Africa
Somalia
Solomon Islands
Slovenia
Slovakia
Sierra Leone
Senegal
Saudi Arabia
Rwanda
Russia
Romania
Qatar
Portugal
Poland
Philippines
Peru
Paraguay
PapuaNew Guinea
Panama
Pakistan
Oman
Norway
Nigeria
Niger
Nicaragua
New Zealand
Netherlands
Nepal
Namibia Mozambique
Morocco
MongoliaMoldova
Mexico
Mauritania
Malta
Mali
Malaysia
Malawi
Madagascar
Macedonia
Lux.
Lithuania
Libya
Liberia
Lesotho
Lebanon
Latvia
Laos
Kyrgyzstan
Kuwait
S. Korea
Taiwan
N. Korea
Kenya
Kazakhstan
Jordan
Japan
Jamaica
Italy
Israel
Ireland
Iraq Iran
IndonesiaIndonesia
India
Iceland
Hungary
Honduras
Haiti
Guyana
Guinea-BissauGuinea
Guatemala
Greenland
Greece
Ghana
Germany
Georgia
Gambia
Gabon
French Guiana
France
Finland Russia
Fiji
Ethiopia
Estonia
Eritrea
Equatorial Guinea
El Salvador
Egypt
Ecuador
East Timor
Dominican Republic
Dijbouti
Denmark
Czech Rep.
Cyprus
Cuba
Coted’IvoireCosta Rica
CongoDem. Rep.of Congo
Colombia
China
China
Chile
Chad
CentralAfrican
Republic
Cape Verde
Canada
Cameroon
Cambodia
Burundi
Burma
BurkinaFaso
Bulgaria
Brunei
Brazil
Botswana
Bolivia
Benin
Belize
Bel.
Belarus
Bahamas
Azerbaijan
Austria
Australia
Armenia
Argentina
Angola
Algeria
Albania
Afghanistan
Western Sahara
Bosnia &Herz.Serbia
Montenegro
Croatia
The BRIC(K)s

34Office of Travel & Tourism Industries, International Trade Administration, U.S. Department of Commerce
Visitors to the U.S. from Brazil
555
652
838 848
941909
665
737
551
405349
385
485525
639
769
893
0
200
400
600
800
1000
93 94 95 96 97 98 99 00 01 02 03 04 05 06 07 08 09
000s of visitors
7
35Office of Travel & Tourism Industries, International Trade Administration, U.S. Department of Commerce
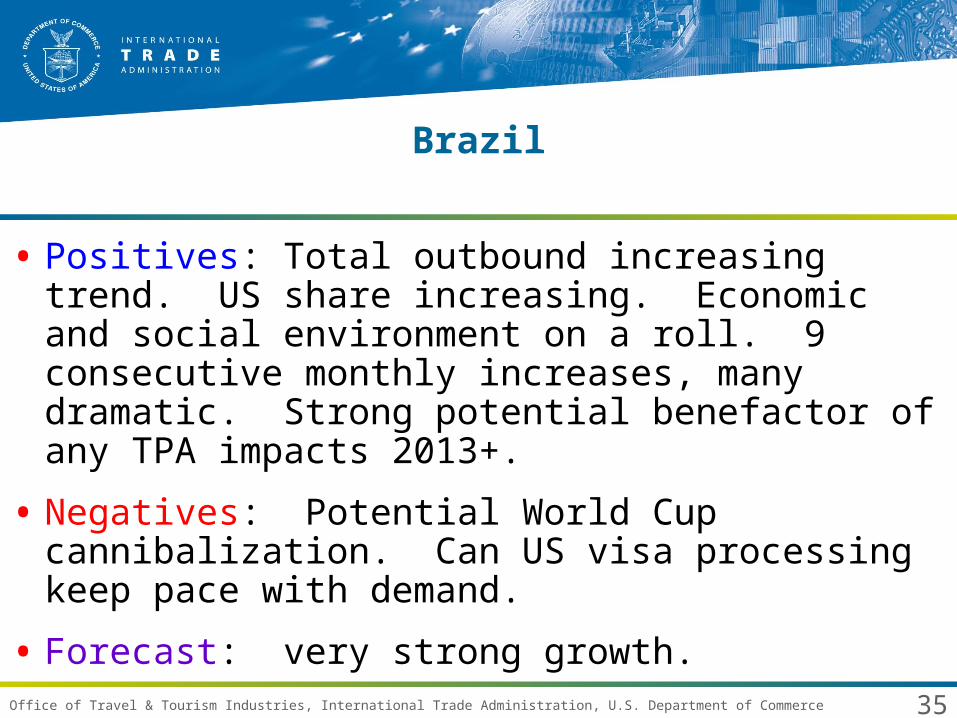
Brazil
• Positives: Total outbound increasing trend. US share increasing. Economic and social environment on a roll. 9 consecutive monthly increases, many dramatic. Strong potential benefactor of any TPA impacts 2013+.
• Negatives: Potential World Cup cannibalization. Can US visa processing keep pace with demand.
• Forecast: very strong growth.
36Office of Travel & Tourism Industries, International Trade Administration, U.S. Department of Commerce
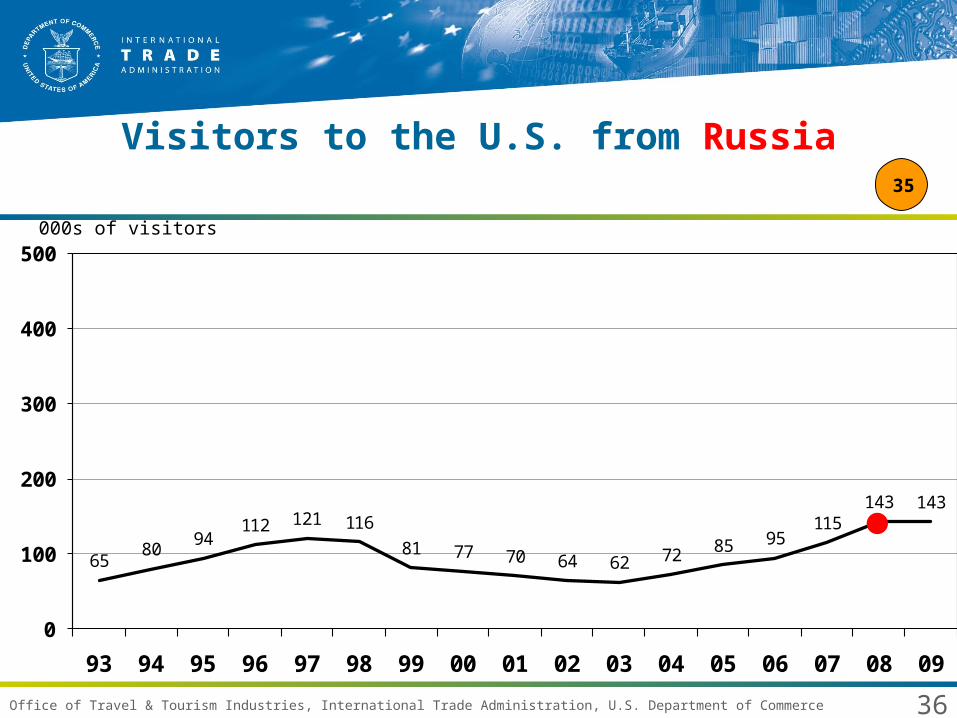
Visitors to the U.S. from Russia
6580
94112 121 116
81 77 70 64 62 72 85 95115
143 143
0
100
200
300
400
500
93 94 95 96 97 98 99 00 01 02 03 04 05 06 07 08 09
000s of visitors
35

37Office of Travel & Tourism Industries, International Trade Administration, U.S. Department of Commerce
Russia
• Positives: Flat 2009 visitation despite massive GDP decline. Three months of solid growth to USA. Low GDP growth in 2010 changing to solid GDP growth. Outbound has doubled in ten years. Simplified visa processing. growing middle class. new flights. Could benefit from any TPA impacts, if only because it's a "BRIC."
• Negatives: High inflation. USA share of total outbound stable. Population decline; visitor growth must come from more outbound trips and/or US higher share of total.
• Forecast: very strong growth.
38Office of Travel & Tourism Industries, International Trade Administration, U.S. Department of Commerce
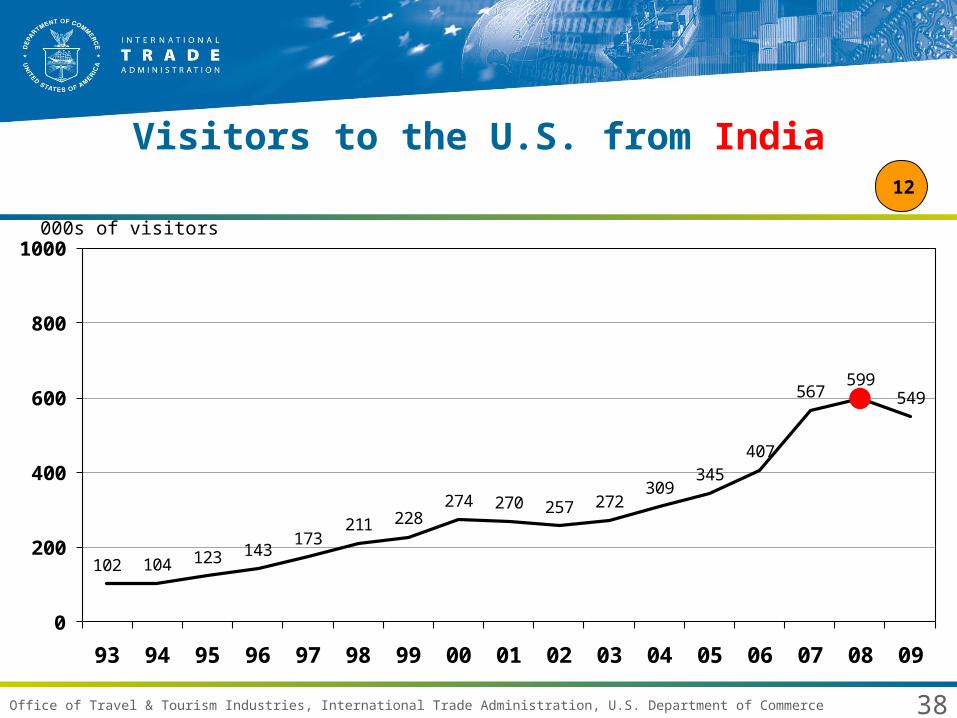
Visitors to the U.S. from India
102 104 123 143173
211 228274 270 257 272
309345
407
567599
549
0
200
400
600
800
1000
93 94 95 96 97 98 99 00 01 02 03 04 05 06 07 08 09
000s of visitors
12
39Office of Travel & Tourism Industries, International Trade Administration, U.S. Department of Commerce
India
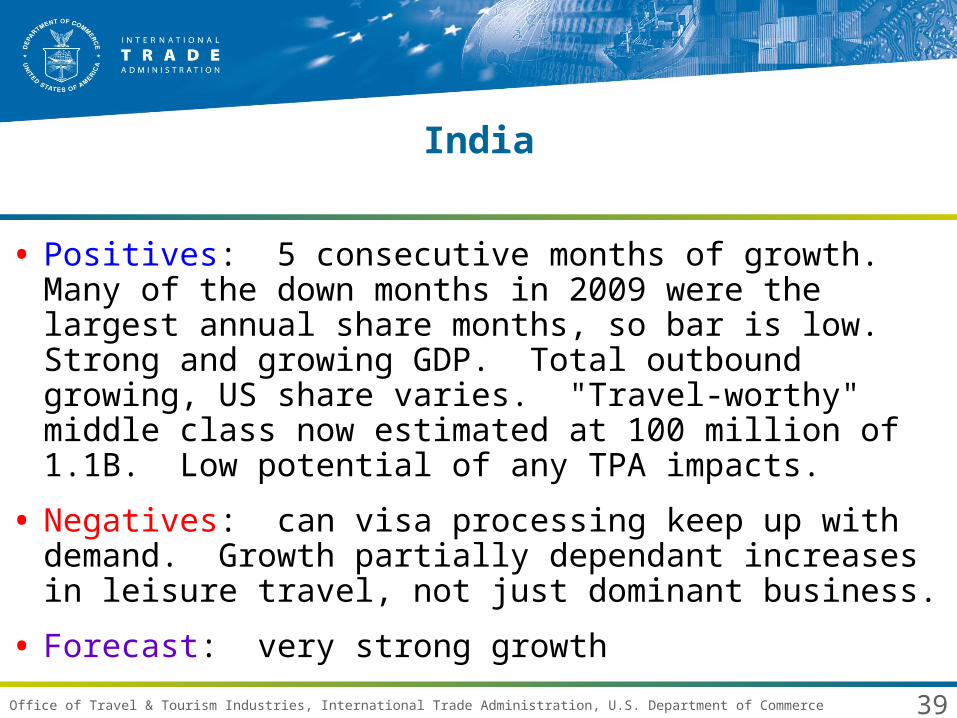
• Positives: 5 consecutive months of growth. Many of the down months in 2009 were the largest annual share months, so bar is low. Strong and growing GDP. Total outbound growing, US share varies. "Travel-worthy" middle class now estimated at 100 million of 1.1B. Low potential of any TPA impacts.
• Negatives: can visa processing keep up with demand. Growth partially dependant increases in leisure travel, not just dominant business.
• Forecast: very strong growth

40Office of Travel & Tourism Industries, International Trade Administration, U.S. Department of Commerce
Visitors to the U.S. from China (PRC)
178 158 167199 210 209 191
249 232 226
157203
270320
397
493525
0
200
400
600
800
1000
93 94 95 96 97 98 99 00 01 02 03 04 05 06 07 08 09
000s of visitors
14

41Office of Travel & Tourism Industries, International Trade Administration, U.S. Department of Commerce
China
• Positives: Seven consecutive months of monthly increases including near doubling in Feb. Will be a huge beneficiary of any TPA impacts. Tremendous growth in total outbound for more than a decade. U.S. share increasing since SARS. Very strong GDP growth. USA-China MOU.
• Negatives: Shanghai World Expo might keep some Chinese home.
• Forecast: Wowwie!

42Office of Travel & Tourism Industries, International Trade Administration, U.S. Department of Commerce
Visitors to the U.S. from South Korea
408
498
592
749 747
364
499
662618 639 618 627
705758
806759 744
0
200
400
600
800
1000
93 94 95 96 97 98 99 00 01 02 03 04 05 06 07 08 09
000s of visitors
9

43Office of Travel & Tourism Industries, International Trade Administration, U.S. Department of Commerce
South Korea
• Positives: won at .000866 and stable. 6 consecutive months of fantastic growth off of dramatic declines. Solid GDP growth, then strong growth. Industrial production fully recovered. Moderate beneficiary of any TPA impacts in 2013+. Strong growth in total outbound up until 2008.
• Negatives: Important Q3 was actually up in 2009, thus bar is not that low. US share of total outbound declining. Potential World Cup cannibalization.
• Forecast: Very strong growth

44Office of Travel & Tourism Industries, International Trade Administration, U.S. Department of Commerce
National Export Initiative
• Goal: Double exports over the next 5 years to support 2 million American jobs
• Creates Export Promotion Cabinet that will consist of leaders from top agencies
• Focuses on three key areas:– 1. Expand trade advocacy in all its forms by:
• Educating U.S. companies about foreign opportunities• Directly connecting them with customers
– 2. Improving access to credit for small-and medium-sized businesses that want to export through the Export-Import Bank, and
– 3. Continuing enforcement of international trade laws.

45Office of Travel & Tourism Industries, International Trade Administration, U.S. Department of Commerce
Travel Promotion Act
• Bill signed by President Obama on March 4, 2010
• Establishes an independent non-profit Corporation for Travel Promotion with a Board of Directors appointed by the Secretary of Commerce.
PURPOSE:
• To promote the U.S. to world travelers
• To augment USG communications on entry/exit policies

46Office of Travel & Tourism Industries, International Trade Administration, U.S. Department of Commerce
Travel Promotion Act
• Umbrella - opportunity to shine beneath
• Exposure for top markets without full investment cost
• Work with corporation for travel promotion to ensure Utah product is seen!
• Better measures possible for ROI

47Office of Travel & Tourism Industries, International Trade Administration, U.S. Department of Commerce
Travel Regional Investment Partnership ActT.R.I.P.
• H.R. 4676, introduced by U.S. Representative Sam Farr (CA).
• Creates a matching grant program in DOC to promote domestic tourism through local and regional partnerships.
• Administered by OTTI.
• CVBs, parks, resorts, attractions.
• Grants of $100,000 to $1 million: from annual $10 million fund. (5 years)

48Office of Travel & Tourism Industries, International Trade Administration, U.S. Department of Commerce
The Quickest Way to U.S. International Tourism Information: http://tinet.ita.doc.gov
Includes International Travel Research OnlineOrder, read, download & print the latest statistics on
international travel to and from the U.S.
•All of the latest summary tables highlighting specific tourism trends•More than 30 market and regional profiles available•Forecast of international travelers to the U.S. through 2013• Information on OTTI’s nine on-going market analysis (research) programs•Updated monthly statistics on arrivals and departures•Late-breaking TI News announcements and information releases•Links and information on the Commerce, Commercial Service Travel &
Tourism Team in the USA & Abroad•Links to other organizations in the travel industry
Sign up for TINews, OTTI’s FREE news service, for the latest in tourism industry news and program updates

50Office of Travel & Tourism Industries, International Trade Administration, U.S. Department of Commerce
Travel Summary WHTIthrough November 2009
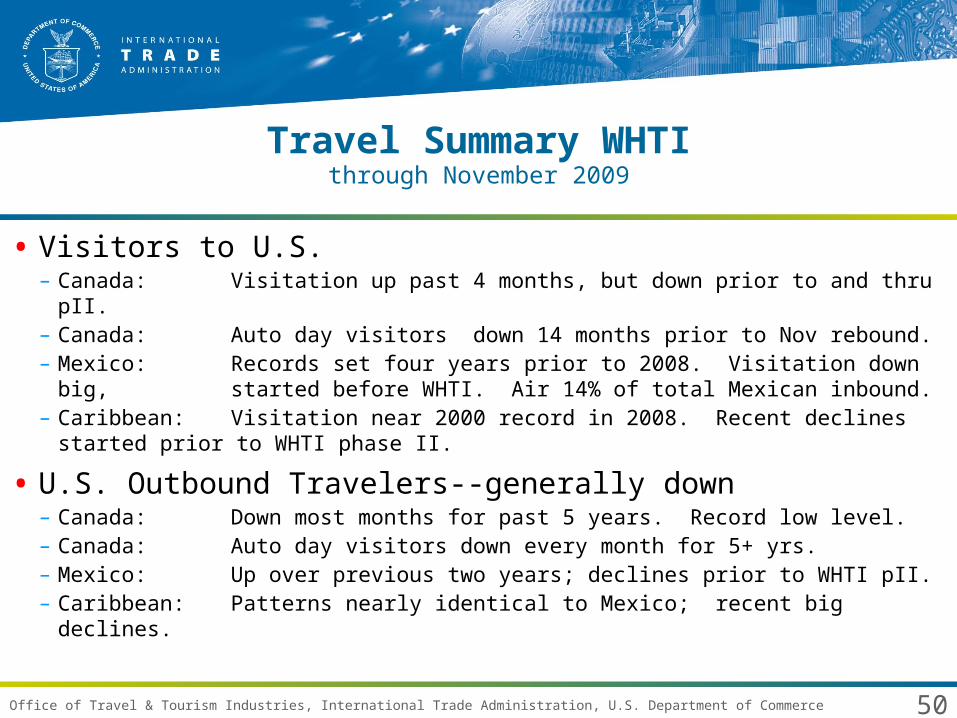
• Visitors to U.S.– Canada: Visitation up past 4 months, but down prior to and thru
pII.– Canada: Auto day visitors down 14 months prior to Nov rebound.– Mexico: Records set four years prior to 2008. Visitation down
big, started before WHTI. Air 14% of total Mexican inbound.– Caribbean: Visitation near 2000 record in 2008. Recent declines
started prior to WHTI phase II.
• U.S. Outbound Travelers--generally down– Canada: Down most months for past 5 years. Record low level. – Canada: Auto day visitors down every month for 5+ yrs.– Mexico: Up over previous two years; declines prior to WHTI pII.– Caribbean: Patterns nearly identical to Mexico; recent big declines.

51Office of Travel & Tourism Industries, International Trade Administration, U.S. Department of Commerce
Policy Challenges
• Pandemic Issues
• Travel Promotion Act
• Visa Issues
• Border Security Issues—WHTI and ESTA
• Market Barriers
• World Perceptions
• Indicators of Competitiveness
• Climate Change and Sustainability Issues

52Office of Travel & Tourism Industries, International Trade Administration, U.S. Department of Commerce
Travel Policy UpdateElectronic System for Travel Authorization
(ESTA)
On June 3, 2008 - The Department of Homeland Security announced a new online system that is part of the Visa Waiver Program (VWP). There are 35 countries eligible for the Visa Waiver Program.
Nationals or citizens of Visa Waiver Program (VWP) countries are required to complete an approved ESTA prior to boarding a carrier to travel by air or sea to the United States.
Travelers under the VWP log on to the ESTA web-based system and complete an application online providing the biographical and eligibility information currently required on the paper I-94W form.
ESTA implemented as a mandatory program effective January 20, 2010.ESTA Web site: https://esta.cbp.dhs.gov.

53Office of Travel & Tourism Industries, International Trade Administration, U.S. Department of Commerce
Travel Policy UpdateElectronic System for Travel Authorization
(ESTA)
An approved ESTA travel authorization is:
1.valid for up to two years or until the traveler’s passport expires, whichever comes first;
2.valid for multiple entries into the U.S.; and
3.not a guarantee of admissibility to the United States at a port of entry. ESTA approval only authorizes a traveler to board a carrier for travel to the U.S. under the VWP. In all cases, CBP officers make admissibility determinations at our ports of entry.

54Office of Travel & Tourism Industries, International Trade Administration, U.S. Department of Commerce
U.S.-China Memorandum of Understandingupdate
• Framework to permit group leisure travel from China to U.S.
• Needed because Chinese regulations restrict package tours to countries without a bi-lateral agreement, commonly known as Approved Destination Status. This MOU serves that purpose in opening these doors.
• U.S. travel destinations/companies able to organize and market package group leisure tours and market their brand.
• Open to 21 provinces now

55Office of Travel & Tourism Industries, International Trade Administration, U.S. Department of Commerce
Market Development Cooperator Program(M.D.C.P)
• MDCP awards are partnerships between ITA and *non-profit industry groups that foster global competitiveness and enhance export capability.
• Competitive opportunity for innovative projects with a special emphasis on small and medium sized enterprises (SMEs).
* Who’s Eligible?•Trade associations
•State departments of trade•Chambers of commerce
•Small business development centers•Regional associations of trade and
economic development•Generally, private enterprises are not
eligible, unless partnering.
HTTP://ITA.DOC.GOV/TD/MDCP
Example: Local travel and tourism
businesses with Convention and Visitors Bureau
56Office of Travel & Tourism Industries, International Trade Administration, U.S. Department of Commerce
Market Development Cooperator Program(M.D.C.P)
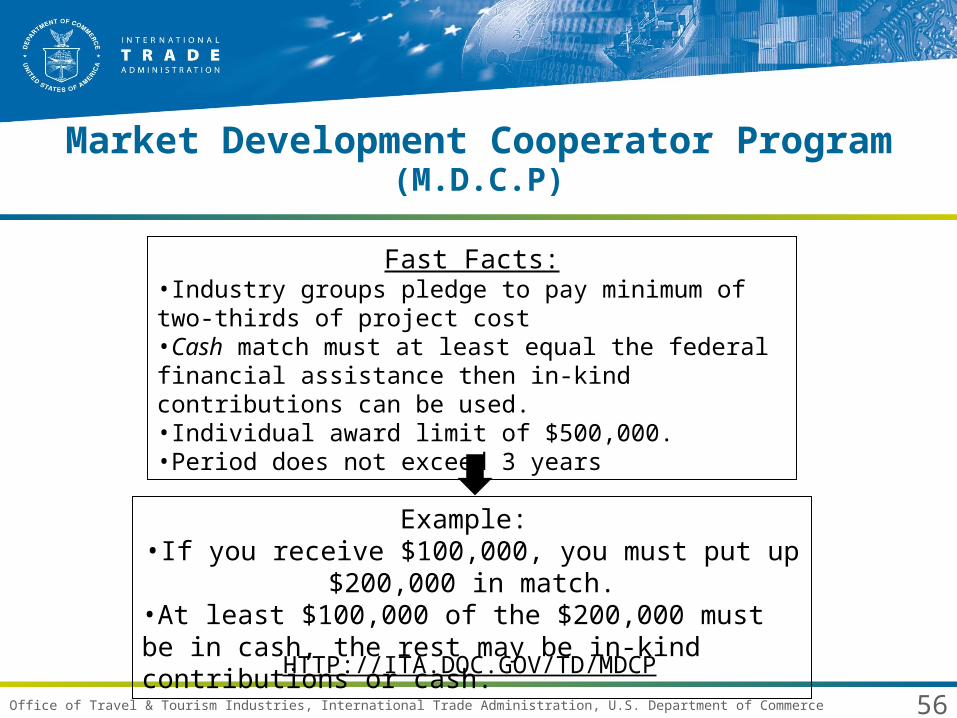
Fast Facts:•Industry groups pledge to pay minimum of two-thirds of project cost•Cash match must at least equal the federal financial assistance then in-kind contributions can be used. •Individual award limit of $500,000. •Period does not exceed 3 years
Example: •If you receive $100,000, you must put up $200,000 in
match.•At least $100,000 of the $200,000 must be in cash, the rest may be in-kind contributions or cash.
HTTP://ITA.DOC.GOV/TD/MDCP